


Deregulated lipid metabolism is an established hallmark of many diseases, such as fatty liver and obesity. Lipid metabolism is tightly regulated by sterol regulatory element-binding protein 1 (SREBP-1), an important transcriptional factor that regulates the transcription of most genes involved in lipogenesis(Reference Shao and Espenshade1). To date, two forms of mammalian SREBP-1 have been characterised, such as SREBP-1a and -1c. However, only a single form of the SREBP-1 gene has been characterised in fish(Reference Minghetti, Leaver and Tocher2,Reference Thomas, Wiseman and Giesy3) . The SREBPs are synthesised as precursor proteins bound to the endoplasmic reticulum membrane(Reference Brown and Goldstein4). After stimulation, the SREBP precursor undergoes proteolytic cleavage in the Golgi to release the transcriptionally active N-terminal domain (nSREBP). Once mature, the active SREBP1 translocates to the nucleus where it binds to sterol response elements (SRE) in the promoter regions of target genes to modulate their transcription(Reference Shao and Espenshade1,Reference Brown and Goldstein4,Reference Amemiya-Kudo, Shimano and Hasty5) .
The target genes of SREBPs included SREBP itself, acetyl-CoA carboxylase α (ACCα), fatty acid synthase (FAS) and stearoyl-CoA desaturase (SCD1)(Reference Shimano, Horton and Hammer6,Reference Kim, Shin and Seo7) . ACCα catalyses the ATP-dependent carboxylation response of acetyl-CoA to form malonyl-CoA, and FAS catalyses the condensation of acetyl-CoA and malonyl-CoA to generate long-chain fatty acids(Reference Leonard, Pereira and Sprecher8). SCD1 catalyses the synthesis of long-chain unsaturated fatty acids. At present, the promoter regions of these genes have been partially isolated and characterised in mammals(Reference Moustaid, Beyer and Sul9–Reference Shimano11). Meantime, Griffin et al. pointed out that their regulation occurs mainly at the transcriptional level(Reference Griffin, Wong and Pandya12). However, in fish, no reports investigated the mechanism of SREBP-1 regulating its target genes related to lipid metabolism.
On the other hand, the mechanisms involved in the activation of the SREBPs have been investigated in mammals(Reference Shao and Espenshade1,Reference Cagen, Xiong and Wilcox13) , but not in fish. MicroRNA (miR) are a class of small non-coding RNAs that regulate gene expression post-transcriptionally by binding to the complementary regions in the 3′UTR of target mRNAs, resulting in mRNA degradation or attenuated translation(Reference Rottiers, Najafi-Shoushtari and Kristo14). Studies have shown that miR play a role in TAG homeostasis(Reference Cui, Chen and Tan15). Recently, Ru et al. reported that SREBP-1 can activate miR-29 expression and in turn miR-29 inhibited srebp-1 expression, which unravelled a negative feedback loop mediated by miR-29 in SREBP-1 signalling(Reference Ru, Hu and Geng16). However, in fish, no reports explore the molecular mechanism of SREBP regulation by miR-29.
Fish are by far the largest group of vertebrates in the world. Grass carp (Ctenopharyngodon idella) was an important herbivorous freshwater fish widely farmed all over the world. In some countries of European and Northern America, grass carp were widely used to control aquatic plants because of their aggressive feeding on vegetation(Reference Opuxzynski and Shireman17). Recently, the draft genome of the grass carp has been released, which is considered a convenient tool for identifying genomic structure of genes involved in lipid metabolism(Reference Wang, Lu and Zhang18). The present study was conducted to identify the promoter regions of accα, fas, scd1 and srebp-1 and investigate the functions of SRE on their promoter regions. To gain insight into the distinct roles of SREBP-1, overexpressing truncated, active nuclear forms of grass carp SREBP-1 were produced and characterised. The post-transcriptional regulation of srebp-1 by miR-29 was explored. Our study offers innovative insights into the regulatory mechanism of SREBP1 and provides direct evidence for SREBP-1 regulating itself and its downstream lipogenic genes in fish.
Materials and methods
Animals, cells and media
Juvenile grass carp were purchased from a commercial farm and used for DNA and RNA extraction. HepG2 and grass carp Ctenopharyngodon idella kidney (CIK) cell lines were obtained from our Cell Resource Center in Huazhong Agricultural University. HepG2 cells were cultured in Dulbecco’s modified Eagle’s medium (DMEM) containing 10 % fetal bovine serum (FBS), penicillin (100 U/ml) and streptomycin (0·1 mg/ml) in an incubator at 37°C with 5 % CO2. Grass carp CIK cells were cultured in Medium 199 (M199) containing 10 % FBS, penicillin (100 U/ml) and streptomycin (0·1 mg/ml) in an incubator at 28°C with 5 % CO2. All these culture media, 0·25 % trypsin-EDTA and FBS were purchased from Gibco (Thermo Fisher Scientific). Penicillin and streptomycin were purchased from Sigma-Aldrich. The present study was performed in accordance with the relevant institutional and national guidelines, and the manuscript must conform to the Animal Research: Reporting of In Vivo Experiments (ARRIVE) guidelines. The ethics committee of Huazhong Agricultural University checked and approved our present experimental protocols on animals and cells.
Cloning and plasmids construction
We identified the 5′ complementary DNA (cDNA) sequences and the transcription start sites of srebp-1, accα, scd1 and fas of grass carp using RNA ligase-mediated rapid amplification of 5′ cDNA ends (RLM-5′RACE) method. The promoter cloning was performed based on the published draft genome of grass carp(Reference Wang, Lu and Zhang18), and the protocols followed these described in our recent studies(Reference Xu, Luo and Wu19). Genomic DNA was extracted from grass carp tail fins using a commercial kit (Tissue DNA Kit; Omega). The promoter sequences of srebp-1, accα, scd1 and fas were amplified from extracted DNA using PCR and sub-cloned into pGl3-basic vector (Promega) using ClonExpress™ II One Step Cloning Kit (Vazyme), and the PCR were performed using TaKaRa PrimeSTAR® HS DNA Polymerase kit (TaKaRa). Based on the distance from their transcription start sites, we named the srebp1-1998 plasmid for -1998/+59 srebp-1 promoter, accα-2043 plasmid for -2043/+49 accα promoter, scd1-1632 plasmid for -1632/+57 scd1 promoter and fas-1889 plasmid for -1889/+111 fas promoter, respectively. Plasmids of srebp1-1493, srebp1-1098, srebp1-604, accα-1538, accα-1069, accα-517, scd1-1160, scd1-602, scd1-273, fas-1447, fas-1007 and fas-476, which contained unidirectional deletions of the promoter regions, were generated with the Erase-a-Base system (Promega) using templates of srebp1-1998, accα-2043, scd1-1632 and fas-1889 plasmid, respectively.
Total RNA was extracted from hepatic samples of grass carp using TRIzol reagent (Invitrogen) and reverse transcribed to cDNA as a template for constructing the nSREBP-1 expression plasmid and the 3′UTR of srebp-1 plasmid. The open reading frame sequence encoding nSREBP-1 was amplified from cDNA using PCR and sub-cloned into pcDNA3.1 (+) vector with the DYKDDDDK peptide (FLAG-tag) sequence inserted at the C-terminus of nsrebp-1 sequence using ClonExpress™ II One Step Cloning kit (Vazyme) and named as nSREBP-1 plasmid. For constructing 3′UTR of srebp-1 plasmid, the 3′UTR sequence of srebp-1 was amplified and sub-cloned into pmirGLO vector using ClonExpress™ II One Step Cloning Kit (Vazyme) and named as pmirGLO-srebp1. All the primers were sequenced in a commercial company (Tsingke) and listed in online Supplementary Table S1.
Sequence analysis
Nucleotide sequences of srebp-1, accα, scd1 and fas promoters were compared with DNA sequences presented in the GenBank database (http://www.ncbi.nlm.nih.gov/genbank/) and the UCSC Genome Browser (http://genome.ucsc.edu/). For sequence analysis of the promoters of accα, fas, scd1 and srebp-1 from grass carp, putative transcription factor binding sites were predicted by online software MatInspector (http://www.genomatix.de/). Besides, SRE with relative score over 0·9 based on JASPAR database (http://jaspar.genereg.net/) were also considered as potential binding sites.
mRNA and protein expression of grass carp nSREBP-1 in HepG2 cells
For expression of nSREBP-1 plasmid group, HepG2 cells were counted and seeded at a density of 1 × 10⁶ in a 60-mm culture dish and then were cultured until 80–90 % confluence before transfecting with 8 μg of nSREBP-1 plasmid using Lipofectamine 2000 (Invitrogen), according to the manufacture’s instruction. For the control, the same amount of pcDNA3.1(+) was transfected into HepG2 cells. Then cells were harvested at 12-, 24- and 48-h incubation, respectively. Total RNAs from transfected HepG2 were extracted and reverse transcribed to cDNA with equal quantities of each total RNA (1 µg) as templates for real-time quantitative PCR (Q-PCR). The resulting first-strand cDNA was diluted 1:10 with ddH2O before use. Q-PCR was performed using the SYBR Premix Ex TaqTM II kit (TaKaRa) in a quantitative thermal cycler (BIO-RAD). A set of six common housekeeping genes (β-actin, 18s-rRNA, glyceraldehyde-3-phosphate dehydrogenase (gapdh), elongation factor 1-α (ef1α), hypoxanthine-guanine phosphoribosyl transferase (hprt) and β-2-microglobulin (b2m)) were selected in order to test their transcription stability. Two most stable housekeeping genes were selected by geNorm software(Reference Vandesompele, De-Preter and Pattyn20). The relative expression levels were calculated with the delta–delta Ct method(Reference Pfaffl21), when normalising to the geometric mean of the best combination of two housekeeping genes as suggested by geNorm. To confirm amplification specificity, the PCR products from each sample were examined by melting curve analysis. All experiments were performed in triplicates. These gene-specific primers for each gene are listed in online Supplementary Table S2.
Proteins for Western blot were extracted from transfected HepG2 cells using RIPA lysis and extraction buffer (Thermo Fisher Scientific), and the protocols followed these described in our recent studies(Reference Wei, Luo and Hogstrand22). Protein concentration was measured using the Pierce BCA protein assay kit (Thermo Fisher Scientific). About 30 μg total protein per lane was loaded on SDS-PAGE and transferred to a polyvinylidene difluoride membrane. After blocked with 8 % skimmed milk for 1 h, the membranes were incubated with primary antibody at 4°C overnight. The primary antibodies used in the present study were rabbit polyclonal of anti-GAPDH (1:2000; Abcam) and anti-FLAG (1:1000; Proteintech). After washing for five times with Tris-buffered saline-Tween, the membrane was probed with horseradish peroxidase-conjugated anti-rabbit IgG (1:10000; Cell Signaling Technology) for 1 h at room temperature. The protein bands were visualised by Vilber Fusion FX6 Spectra imaging system (Vilber Lourmat) and quantified by Image-Pro Plus (Media Cybernetics).
Luciferase assay of srebp-1, accα, scd1 and fas promoters
For promoter luciferase assays, HepG2 cells were counted and seeded at a density of 1 × 10⁵ in twenty-four well plates, then cultured and transfected as mentioned in our recent studies(Reference Xu, Luo and Wu19,Reference Wu, Tan and Xu23) . Briefly, to study the nSREBP-1-induced changes in promoter activities, we co-transfected 300 ng of nSREBP-1 plasmid or the same amount of pcDNA3.1(+) plasmid (300 ng, control) with 500 ng of each of these luciferase reporter plasmids of srebp-1, accα, scd1 and fas promoters into HepG2 cells using Lipofectamine 2000 (Invitrogen) at 80–90 % confluence, respectively. For an internal control, 25 ng of Renilla luciferase vector the thymidine kinase promoter-Renilla luciferase reporter plasmid (pRL-TK) per well was included in all transfections to normalise transfection efficiency. At 6 h after the transfection, the cells were incubated with the fresh DMEM containing 10 % FBS for 24 h. Then the relative luciferase activity of srebp-1, accα, scd1 and fas promoters was measured using the Dual-luciferase Reporter Assay System (Promega), according to the manufacturer’s instruction. The relative luciferase activity of these promoters was calculated using the ratio of Firefly luciferase activity:Renilla luciferase activity. All experiments were performed in triplicates.
Site-mutation assay of sterol response elements sites on the srebp-1, accα, scd1 and fas promoters
To identify the corresponding SRE on the grass carp srebp-1, accα, scd1 and fas promoters, we performed site-directed mutagenesis of SRE on the plasmid of srebp-1, accα, scd1 and fas promoters, respectively, according to the manufacture’s instruction of QuickChange II Site-Directed Mutagenesis kit (Vazyme). SRE-mutated plasmids of srebp-sre1, accα-sre1, scd1-sre1, scd1-sre2, fas-sre1, fas-sre2, fas-sre3, fas-sre4 and fas-sre3&4 were generated from the wild-type (WT) plasmids of srebp1-1998, accα-2043, scd1-1632 and fas-1889, respectively. Similar to the promoter luciferase assay performed previously, 300 ng of nSREBP-1 plasmid or the same amount of pcDNA3.1(+) plasmid (300 ng, control) was co-transfected with 500 ng of WT plasmid or the same amount of SRE-mutated plasmid into HepG2 cells using Lipofectamine 2000 (Invitrogen) at 80–90 % confluence. For an internal control, 25 ng of Renilla luciferase vector (pRL-TK) per well was included in all transfections to normalise the transfection efficiency. At 6 h after the transfection, the cells were incubated with the same fresh DMEM containing 10 % FBS for 24 h. Then the cells were harvested and the relative luciferase activity was measured using the Dual-luciferase Reporter Assay System (Promega), according to the manufacturer’s instruction. The relative luciferase activity of these promoters was calculated using the ratio of Firefly luciferase activity:Renilla luciferase activity. All experiments were performed in triplicates.
Electrophoretic mobility shift assay
An electrophoretic mobility shift assay (EMSA) was performed to confirm the functional SRE of the promoters. HepG2 cells were transfected with nSREBP-1 plasmid as described above. Nuclear proteins for EMSA were extracted from HepG2 cells, and concentrations were determined using Pierce BCA protein assay kit (Thermo Fisher Scientific). These extracts were stored at –80°C until analysed. Each oligonucleotide duplex of SRE was incubated with 5 µg nuclear extracts at room temperature, according to the instruction of LightShift™ Chemiluminescent EMSA kit (Invitrogen), and each unlabelled probe was pre-incubated 10 min prior to the addition of biotin-labelled probe. The reaction was allowed to proceed for 20 min after the addition of biotin-labelled probe at room temperature and then were detected by electrophoresis on 6 % native polyacrylamide gels. Competition analyses were performed using 200-fold excess of unlabelled oligonucleotide duplex with or without the SRE mutation. All the oligonucleotide sequences of EMSA were listed in online Supplementary Table S3.
The prediction and luciferase assay of srebp-1 for miR-29
To validate the mRNA level of srebp-1 regulated by miR-29, we obtained the sequence of miR-29 of grass carp based on the recent publication(Reference Gong, Huang and Xie24). The target sites of miR-29 on the 3′UTR of srebp-1 were predicted based on the principle of Targetscan(Reference Lewis, Burge and Bartel25). The miR-29 targeted seed sequence was mutated on the WT pmirGLO-srebp1 plasmid using QuickChange II Site-Directed Mutagenesis kit (Vazyme), and the generated plasmid was named as pmirGLO-srebp1-miR29mut (Mut). Based on the site-mutation assay performed previously, 20 pmol of miR-29 mimics or the same amount of non-coding miR (20 pmol, negative control) was co-transfected with 500 ng of the WT pmirGLO-srebp1 plasmid (WT) or 500 ng of pmirGLO-srebp1-miR29mut plasmid (Mut) into HepG2 cells using Lipofectamine 2000 (Invitrogen) at 90 % confluence. At 6 h after the transfection, the cells were incubated, with the same fresh culture DMEM containing 10 % FBS for 24 h. Then the cells were harvested and the relative luciferase activity was measured using the Dual-luciferase Reporter Assay System (Promega), according to the manufacturer’s instruction. The relative luciferase activity of these plasmids was calculated using the ratio of Firefly luciferase activity:Renilla luciferase activity. All experiments were performed in triplicates.
miR, mRNA and protein expression induced by nSREBP-1 or miR-29 in Ctenopharyngodon idella kidney cells
Grass carp CIK cells were counted and seeded at a density of 1 x 10⁶ in a 60-mm culture dish. They were then cultured until 90 % confluence was achieved before transfection using Lipofectamine 2000 (Invitrogen) with plasmids (8 μg) or miR (100 pmol). Cells were harvested and washed with PBS. Then total RNA were extracted from the cells and reverse transcribed to cDNA as templates. Real-time quantification of miR was performed by stem-loop RT-PCR(Reference Chen, Ridzon and Broomer26), miR-29 stem-loop RT primers (5′-GTCGTATCCAGTGCAGGGTCCGAGGTATTCGCACTGGATACGACAACCGA-3′) replaced oligo dT/random primers in Quantitect Reverse Transcription kit (TaKaRa). The resulting first-strand cDNA was diluted to 1:10 with ddH2O before use. The expression level of miR was determined by comparative delta–delta Ct method normalised with U6. These gene-specific primers are listed in online Supplementary Table S2. All experiments were performed in triplicates.
Proteins for Western blot were extracted from transfected cells using RIPA lysis and extraction buffer (Thermo Fisher Scientific). Protein concentration was measured using the Pierce BCA protein assay kit (Thermo Fisher Scientific). About 30 μg total protein per lane was loaded on SDS-PAGE and transferred to a polyvinylidene difluoride membrane. After blocking with 8 % skimmed milk for 1 h, the membranes were incubated with primary antibody at 4°C overnight. The primary antibodies used in the present study were rabbit polyclonal of anti-GAPDH (1:2000; Abcam) and rabbit polyclonal of anti-SREBP1 (1:1000; Abcam). After washing for five times with Tris-buffered saline-Tween, the membrane was probed with horseradish peroxidase-conjugated anti-rabbit IgG (1:10000; Cell Signaling Technology) for 1 h at room temperature. The protein bands were visualised by Vilber Fusion FX6 Spectra imaging system (Vilber Lourmat) and quantified by Image-Pro Plus (Media Cybernetics).
Statistical analysis
The data were analysed using SPSS 19.0 (SPSS Inc.). Results are presented as mean values with their standard errors for three independent experiments. Differences between two groups were assessed using the unpaired two-tailed Student’s t test unless otherwise noted. The differences were considered to be significant at P < 0·05.
Results
Cloning and sequence analysis of the promoter regions of srebp-1, accα, scd1 and fas
In the present study, we identified the transcription start sites of srebp-1 (GenBank accession no.: KJ162572), accα (GenBank accession no.: GU908475), scd1 (GenBank accession no.: AJ243835) and fas (GenBank accession no.: MK111644), and the first nucleotide of srebp-1, accα, fas and scd1 was designated as +1. Then the 1988 bp, 2043 bp, 1632 bp and 1889 bp sequences of srebp-1, accα, scd1 and fas promoters were cloned and analysed, respectively. A cluster of putative binding sites of several transcription factors, such as specific protein (SP) family, yin yang 1 (YY1), nuclear factor Y (NF-Y), SRE and enhancer box (E-box) element, were predicted on the promoters of srebp-1, accα, scd1 and fas. On the region of srebp-1 promoter (online Supplementary Fig. S1), two SP binding sites (at -60 bp/-72 bp and -451 bp/-467 bp), three YY1 binding sites (at -515 bp/-537 bp, -1902 bp/-1924 bp and -1925 bp/-1947 bp), six NF-Y binding sites (at -73 bp/-87 bp, -134 bp/-148 bp, -485 bp/-499 bp, -574 bp/-588 bp, -845 bp/-859 bp and -970/-984 bp), one SRE (at -597 bp/-611 bp) and one E-box element (at -508 bp/-524 bp) were predicted, respectively. On the region of accα promoter (online Supplementary Fig. S2), two SP binding sites (at -86 bp/-102 bp and -116 bp/-132 bp), one YY1 binding site (at -436 bp/-458 bp), nine NF-Y binding sites (at -62 bp/-76 bp, -125 bp/-143 bp, -389 bp/-403 bp, -974 bp/-988 bp, -1186 bp/-1200 bp, -1251 bp/-1265 bp, -1360 bp/-1374 bp, -1765 bp/-1779 bp and -1960 bp/-1974 bp), one SRE (at -661 bp/-675 bp) and two E-box elements (at -149 bp/-166 bp and -1232 bp/-1249 bp) were predicted, respectively. On the region of scd1 promoter (online Supplementary Fig. S3), there were two NF-Y binding sites (at -950 bp/-964 bp and -1040 bp/-1054 bp), two SRE (at -42 bp/-56 bp and -1569 bp/-1583 bp) and three E-box elements (at -87 bp/-103 bp, -714 bp/-731 bp and -1477 bp/-1494 bp). On the region of fas promoter (online Supplementary Fig. S4), we discovered one SP binding site (at -1254 bp -1270 bp), two YY1 binding sites (at -37 bp/-59 bp and -1517 bp/-1539 bp), seven NF-Y binding sites (at -90 bp/-104 bp, -127 bp/-141 bp, -785 bp/-799 bp, -1116 bp/-1130 bp, -1147 bp/-1161 bp -1484 bp/-1498 bp and -1685 bp/-1699 bp), four SRE (at -63 bp/-72 bp, -133 bp/-142 bp, -1185 bp/-1194 bp and -1235 bp/-1249 bp) and four E-box elements (at -55 bp/-72 bp, -260 bp/-276 bp, -270 bp/-286 bp and -1059 bp/-1076 bp).
Overexpression analysis of grass carp nSREBP-1 in HepG2 cells
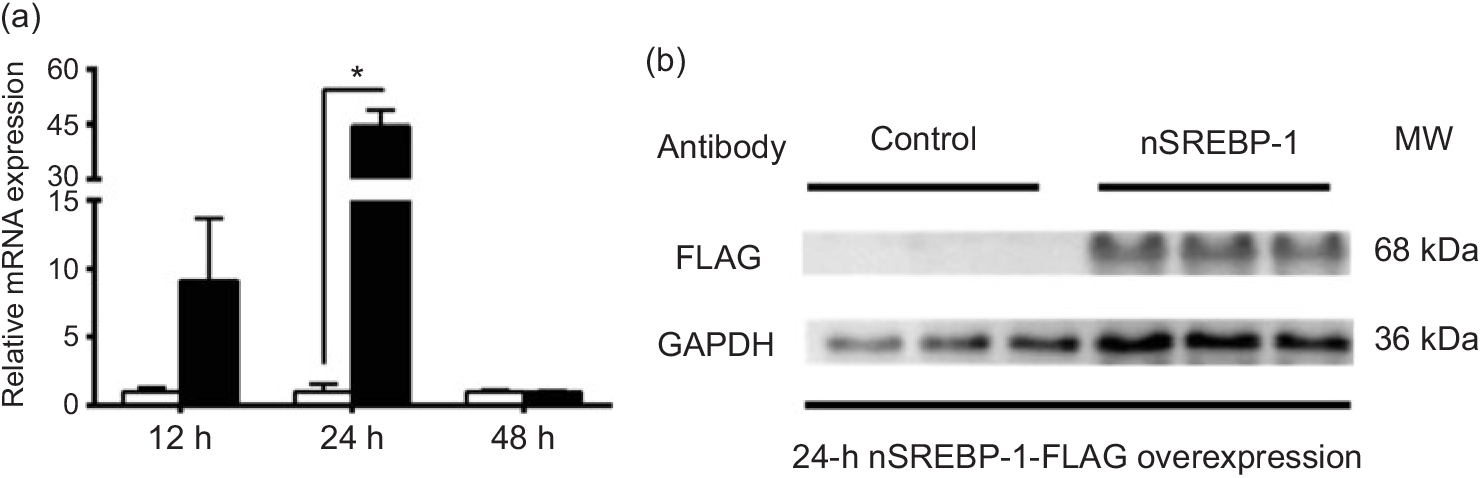
To reveal the mechanism of SREBP-1 regulating downstream target genes in grass carp, we tested the Dual-Luciferase Reporter system in cells derived from grass carp. However, compared with the canonical cells derived from mammals, the fish cells were not suitable for the Dual-Luciferase Reporter system, because the Renilla luciferase activities could not be detected. Thus, we chose HepG2 cells for analysing the SREBP-1 function in lipogenic gene expression. Therefore, to investigate the nSREBP-1 plasmid for grass carp nSREBP-1 gene overexpressed in HepG2 cells, we determined the mRNA level of grass carp nSREBP-1 after transfection into HepG2 cells at 12-, 24- and 48 h. Compared with the control, nSREBP-1 overexpression significantly up-regulated the mRNA and protein levels of nSREBP-1 at 24 h (Fig. 1). Thus, to investigate the SREBP-1 function in gene expression, 24 h was used to determine the luciferase activities of srebp-1, accα, fas and scd1 promoters.
Overexpression of the N-terminal domain of sterol regulatory element-binding protein 1 (nSREBP-1) in HepG2 cells. (a) mRNA expression of nSREBP-1 plasmid at 12, 24 and 48 h in HepG2 cells. * Significant difference between nSREBP-1 overexpression (![]() ) and control (
) and control (![]() ) groups (P < 0·05). β-Actin and glyceraldehyde-3-phosphate dehydrogenase (gapdh) were chosen as the housekeeping genes (M = 0·345). (b) Western blot of FLAG antibody for nSREBP-1 in HepG2 cells at 24 h. MW, molecular weight.
) groups (P < 0·05). β-Actin and glyceraldehyde-3-phosphate dehydrogenase (gapdh) were chosen as the housekeeping genes (M = 0·345). (b) Western blot of FLAG antibody for nSREBP-1 in HepG2 cells at 24 h. MW, molecular weight.
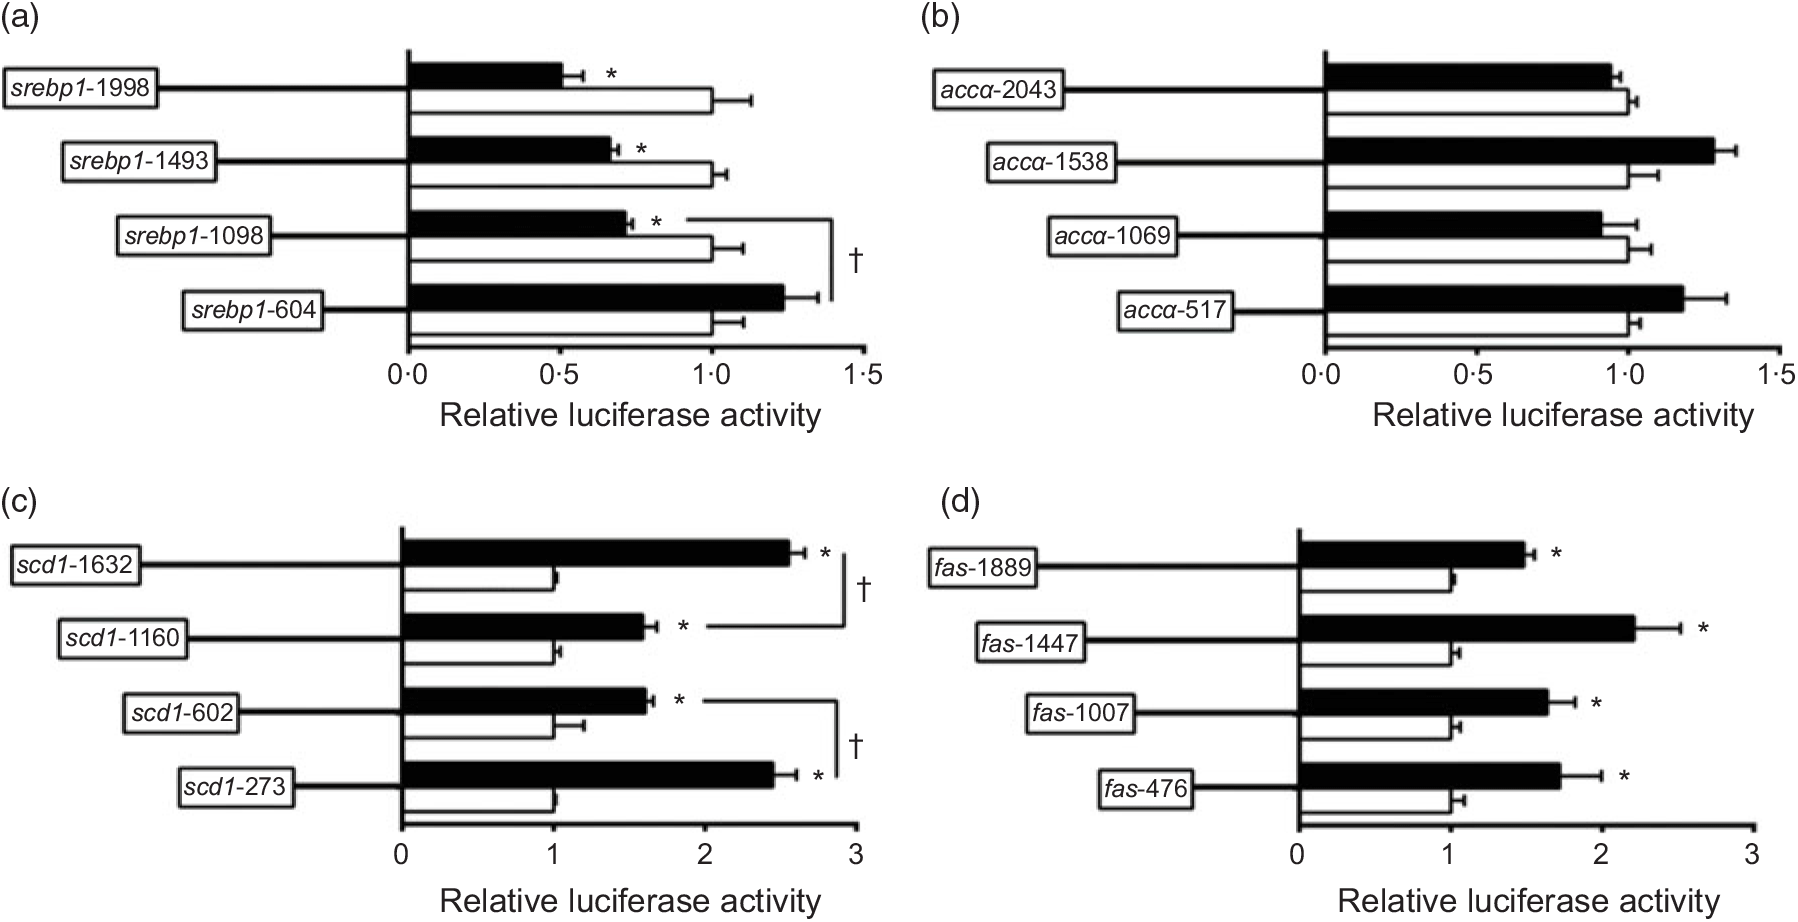
The 5′-deletion assay of the promoter regions of srebp-1, accα, scd1 and fas
To investigate the activities of these promoters induced by nSREBP-1, we co-transfected nSREBP-1 plasmid along with the promoter constructs into HepG2 for 24 h and performed the 5′-deletion assay of srebp-1, accα, scd and fas promoters (Fig. 2). Compared with the control, overexpression of nSREBP-1 resulted in a reduction of srebp-1 promoter activity by 50 % , and the sequence deletion from -1998 bp to -1098 bp presented no significant influences on SREBP-1-induced promoter activity. However, further deleting the sequence between -1098 and -604 completely abolished the inhibitory effect by nSREBP-1, indicating that negative response element to nSREBP-1 existed on -1098/-604 region of srebp-1 promoter (Fig. 2(a)). Overexpressed nSREBP-1 showed no effect on the WT accα promoter activity, and no significant differences were found in relative luciferase activity of accα promoter between different plasmid groups, indicating that the region of accα promoter was not influenced by nSREBP-1 (Fig. 2(b)). Overexpression of SREBP-1 markedly increased the scd1 promoter activity by 2·6-fold compared with the control. Deleting the sequence from -1632 bp to -1160 bp and from -1160 bp to -602 bp decreased the SREBP-1-induced scd1 promoter activity by 38 % , and further deleting the sequence between -602 bp to -273 bp recovered the SREBP-1-induced scd1 promoter activity, suggesting that -1632/-1160, -273/-602 and -273/+57 region of scd1 promoter were influenced by nSREBP-1 (Fig. 2(c)). Overexpression of SREBP-1 significantly increased the fas promoter activity by 1·5-fold compared with the control, and further deleting the sequence from -1889 bp to -476 bp presented no significant effects on SREBP-1-induced fas promoter activity. These results indicated that there are positive responsive elements at -476/+111 region of fas promoter to nSREBP-1 (Fig. 2(d)).
5′-Unindirectional deletion assays for promoter regions of sterol regulatory element-binding protein 1 (srebp-1), acetyl-CoA carboxylase α (accα), stearoyl-CoA desaturase 1 (scd1) and fatty acid synthase (fas) at 24 h. (a) Assay for srebp-1 promoter region; (b) assay for accα promoter region; (c) assay for scd1 promoter region; (d) assay for fas promoter region. Values are means (n 3), with their standard errors represented by horizontal bars. * Significant difference in relative luciferase activities between the N-terminal domain of SREBP-1 (nSREBP-1) overexpression (![]() ) and control (
) and control (![]() ) groups (P < 0·05). † Significant difference in nSREBP-1-induced changes in relative luciferase activity between the two promoter regions (P < 0·05). Relative luciferase activity was presented as the fold activated by nSREBP-1 compared with the control.
) groups (P < 0·05). † Significant difference in nSREBP-1-induced changes in relative luciferase activity between the two promoter regions (P < 0·05). Relative luciferase activity was presented as the fold activated by nSREBP-1 compared with the control.
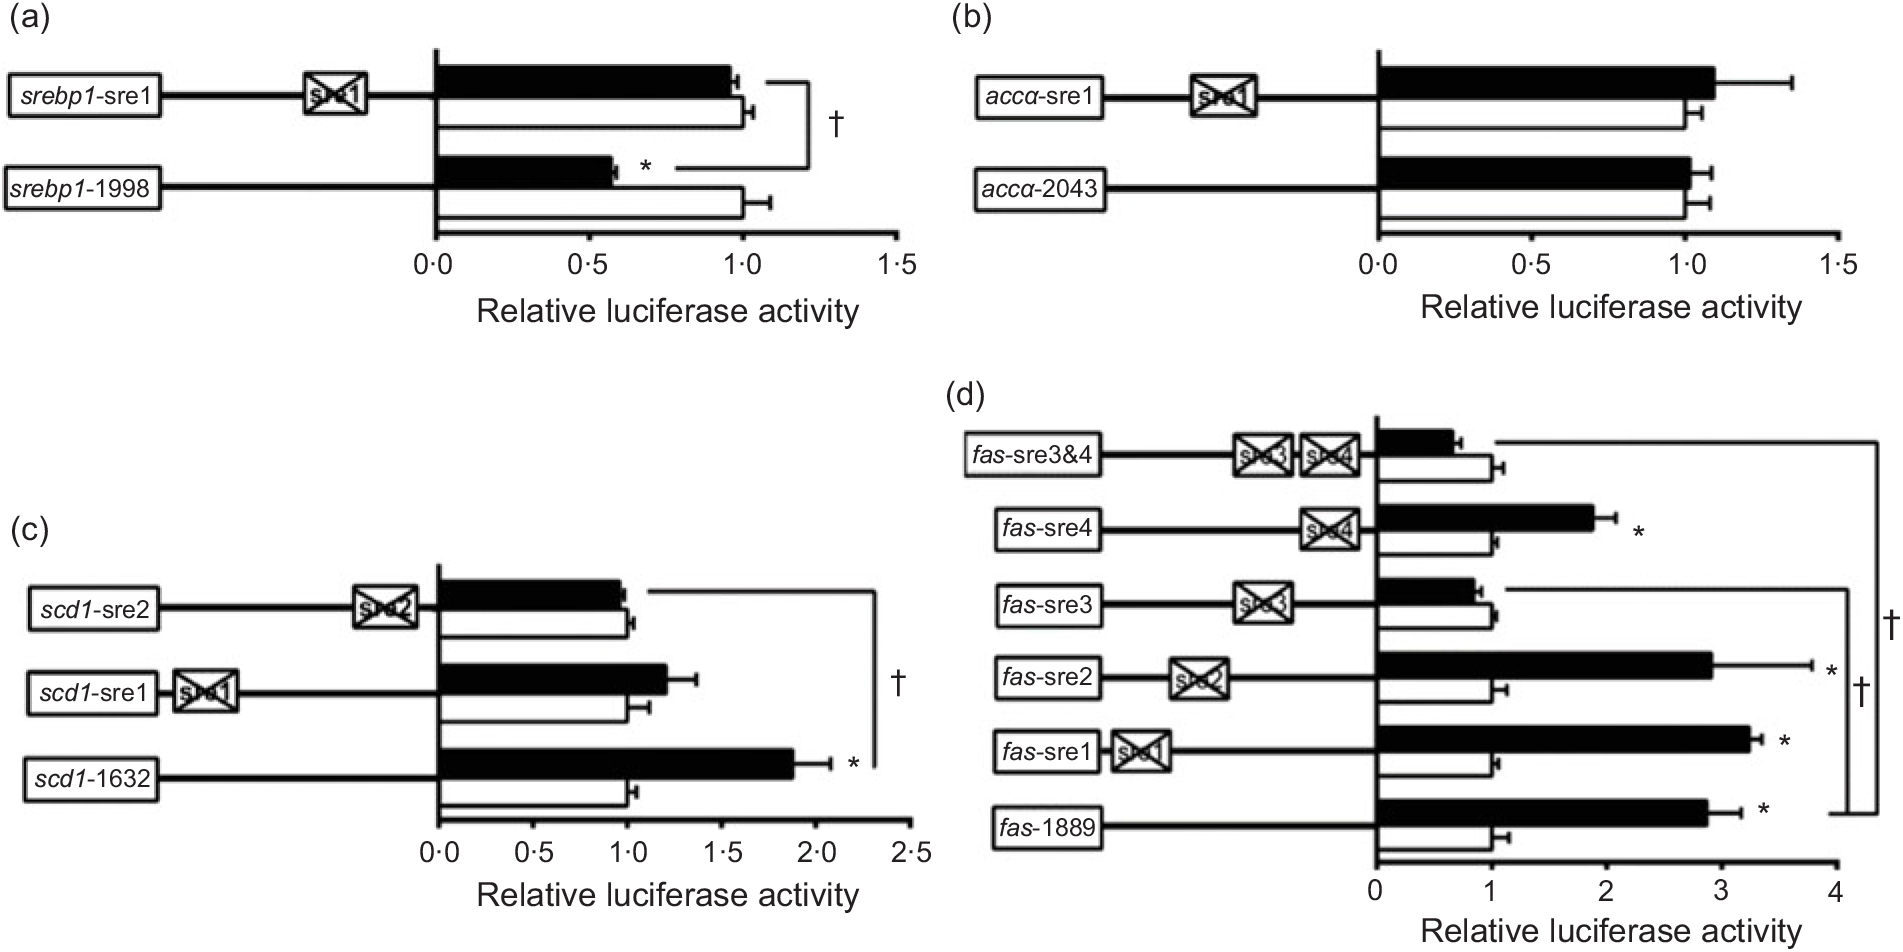
Site-mutation analysis of sterol response elements on the promoters of srebp-1, accα, fas and scd1
To further elucidate whether the regions of srebp-1, accα, fas and scd1 promoters possessed SRE, we performed the site mutation at these regions of srebp-1, accα, fas and scd1 promoters that potentially possessed SRE (Fig. 3). Overexpressed nSREBP-1 resulted in a reduction in srebp-1 promoter activity by 43 % compared with the control, and its inhibitory effect was completely abolished when srebp1-sre1 (-597/-611) was mutated, suggesting that srebp1-sre1 site inhibited SREBP-1-induced srebp-1 transcription (Fig. 3(a)). Consistent with 5′-deletion assays of the promoter region from -2043 to +49bp of accα, overexpressed nSREBP-1 showed no stimulatory effect on the WT accα promoter activity, and mutation of acc1-sre1 (-661/-675) site did not affect SREBP-1-induced accα promoter activity, indicating that the -2043/+49 region of accα did not possess any SRE (Fig. 3(b)). The promoter activity of WT scd1 construct was enhanced by nSREBP-1 overexpression by 1·9-fold; mutation of scd1-sre2 (-42/-56) site completely abolished the stimulatory effect of SREBP-1, whereas mutation of scd1-sre1 (-1569/-1583) site showed no significant effect on SREBP-1-induced scd1 promoter activity, suggesting scd1-sre2 site up-regulated SREBP-1-induced scd1 transcription (Fig. 3(c)). Overexpressed nSREBP-1 markedly enhanced the WT fas promoter activity by 2·9-fold, but only the mutation plasmid of fas-sre3 and fas-sre3 and sre4, which were related to the mutation of fas-sre3 (-133/-142) site, caused a marked reduction in fas promoter activity and completely abolished the stimulatory effect of SREBP-1, indicating that fas-sre3 enhanced the SREBP-1-induced fas transcription (Fig. 3(d)).
Promoter activities of site mutagenesis on predicted sterol response elements at 24 h. (a) Site mutagenesis on -1998/+58 sterol regulatory element-binding protein 1 (srebp-1) promoter; (b) site mutagenesis on -2043/+49 acetyl-CoA carboxylase α (accα) promoter; (c) site mutagenesis on -1632/+57 stearoyl-CoA desaturase 1 (scd1) promoter; (d) site mutagenesis on -1889/+111 fatty acid synthase (fas) promoter. Values are means (n 3), with their standard errors represented by horizontal bars. * Significant difference between the N-terminal domain of SREBP-1 (nSREBP-1) overexpression (![]() ) and control (
) and control (![]() ) groups (P < 0·05). † Significant difference in the nSREBP-1-induced changes of relative luciferase activity between two sites of mutagenesis (P < 0·05). The relative luciferase activity was presented as the fold activated by nSREBP-1 compared with the control.
) groups (P < 0·05). † Significant difference in the nSREBP-1-induced changes of relative luciferase activity between two sites of mutagenesis (P < 0·05). The relative luciferase activity was presented as the fold activated by nSREBP-1 compared with the control.
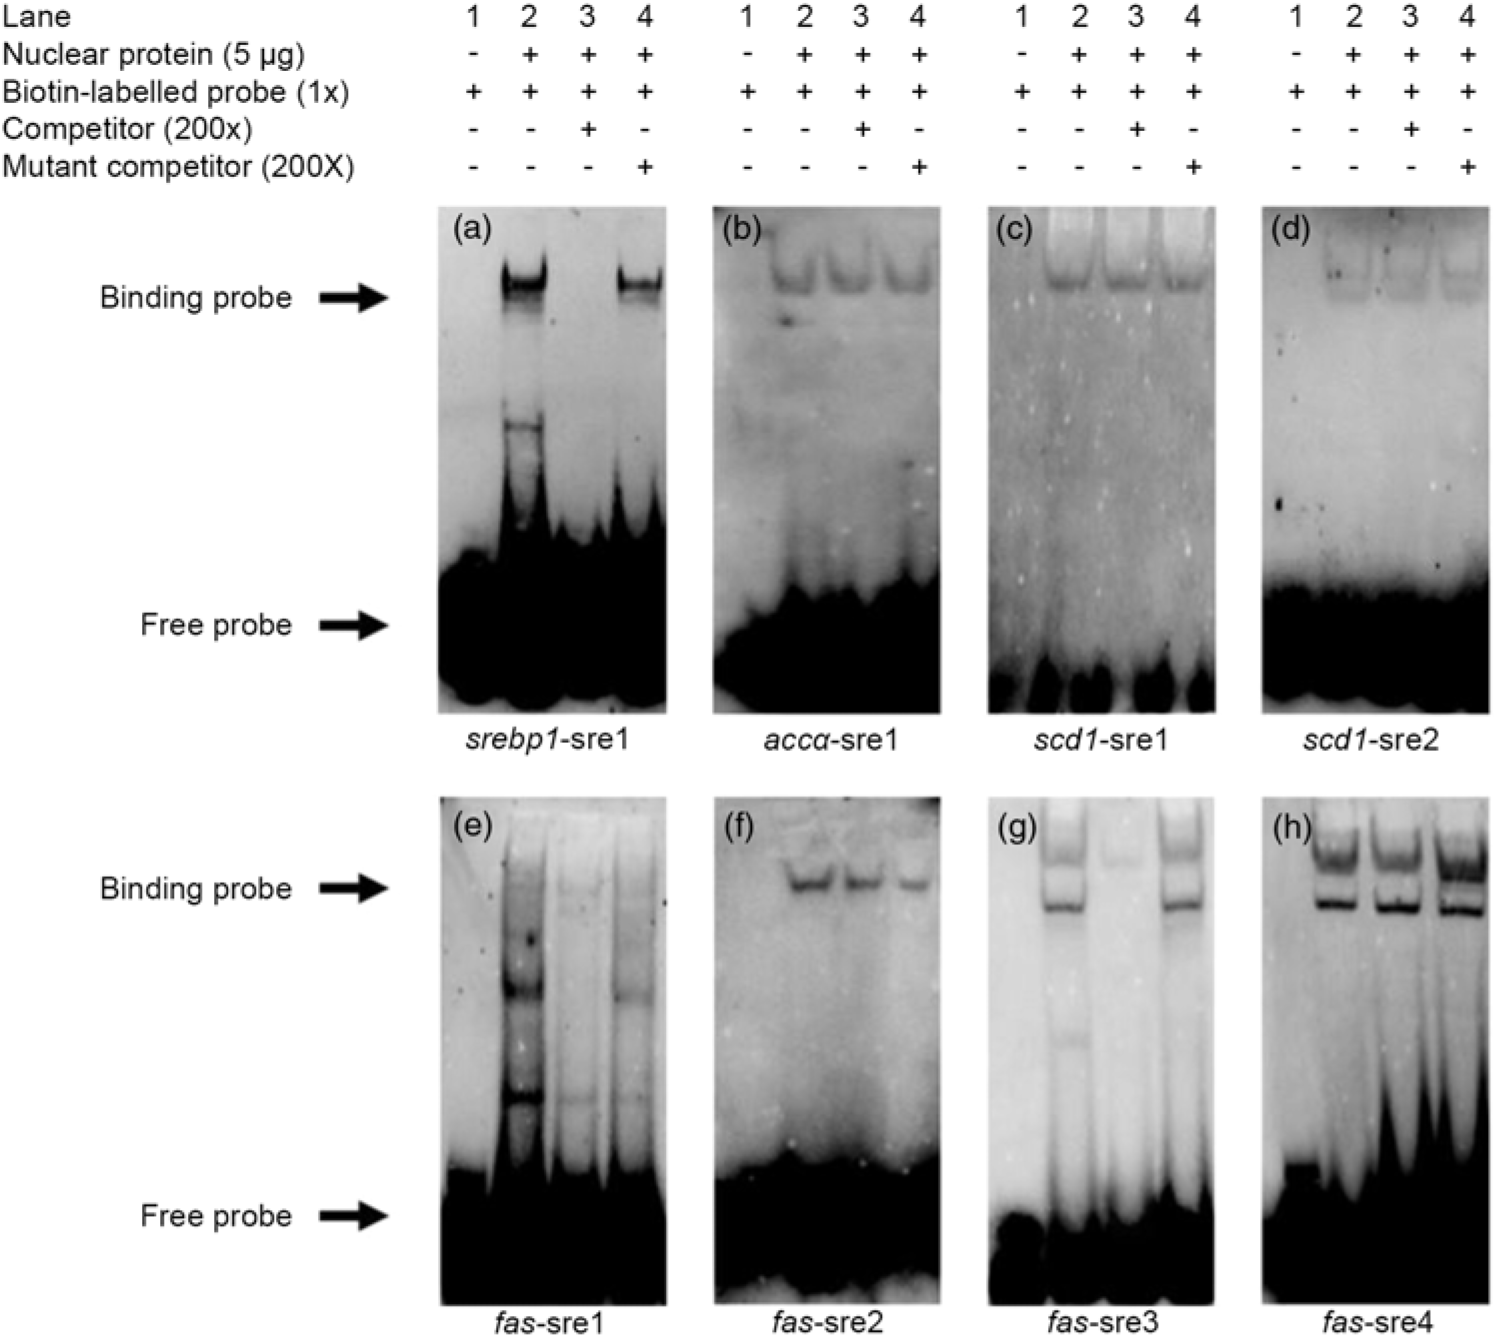
Electrophoretic mobility shift assay analysis of each SREBP-1 binding sequence
Based on the results of the site-mutation assay discussed above, we further used EMSA to explore their ability to interact with SREBP-1. We made a probe using biotin to label the srebp1-sre1 sequence. The results indicated that the 200-fold unlabelled srebp1-sre1 sequence competed the labelled probe for nSREBP-1 and reduced the brightness of the labelled probe (lane 3, Fig. 4(a)). In contrast, the 200-fold unlabelled mutated srebp1-sre1 sequence did not compete for the labelled probe for nSREBP-1 (lane 4, Fig. 4(a)), indicating that srebp1-sre1 site could be bound by SREBP-1 (Fig. 4(a)). For accα-sre1 site of accα promoter, the 200-fold unlabelled accα-sre1 sequence did not compete for the labelled probe, confirming that accα-sre1 site could not interact with SREBP-1 (lane 3, Fig. 4(b)). Similarly, the unlabelled scd1-sre1 and scd1-sre2 sites of scd1 promoter did not compete for the labelled probe for nSREBP-1 (lane 3, Fig. 4(c) and (d)), indicating that scd1-sre2 site need a synergistic action of SREBP-1 assisted with other factors. In addition, EMSA analysis of four SRE on fas promoter indicated that the fas-sre1 (-1235/-1249) site presented as a faint binding site of SREBP-1 (Fig. 4(e)); the unlabelled fas-sre2 (-1185/-1194) site and fas-sre4 site (-63/-72) did not compete for the labelled probe (lane 3, Fig. 4(f) and (h)). Only at the fas-sre3 (-133/-142) site (Fig. 4(g)), the 200-fold unlabelled sequence competed for the labelled probe for SREBP-1 binding (lane 3, Fig. 4(g)) and the 200-fold mutated fas-sre3 did not compete for the labelled probe for nSREBP-1 binding (lane 4, Fig. 4(g)), indicating that fas-sre3 was a strong binding site for SREBP-1. Taken together, these results from luciferase activity, 5′-deletion and mutation analysis demonstrated that srebp-1, fas and scd1, but not accα, were the target genes of SREBP-1.
Electrophoretic mobility shift assay (EMSA) analysis of predicted sterol response elements (SRE). (a) -597/-611 binding site of sterol regulatory element-binding protein 1 (srebp-1) (srebp1-sre1); (b) -661/-675 binding site of acetyl-CoA carboxylase α (accα) (accα-sre1); (c) -1569/-1583 binding site of stearoyl-CoA desaturase 1 (scd1) (scd1-sre1); (d) -42/-56 binding site of scd1 (scd1-sre2); (e) -1235/-1249 binding site of fatty acid synthase (fas) (fas-sre1); (f) -1185/-1194 binding site of fas (fas-sre2); (g) -133/-142 binding site of fas (fas-sre3); (h) -63/-73 binding site of fas (fas-sre4).
Analysis of nSREBP-1 overexpression in Ctenopharyngodon idella kidney cells
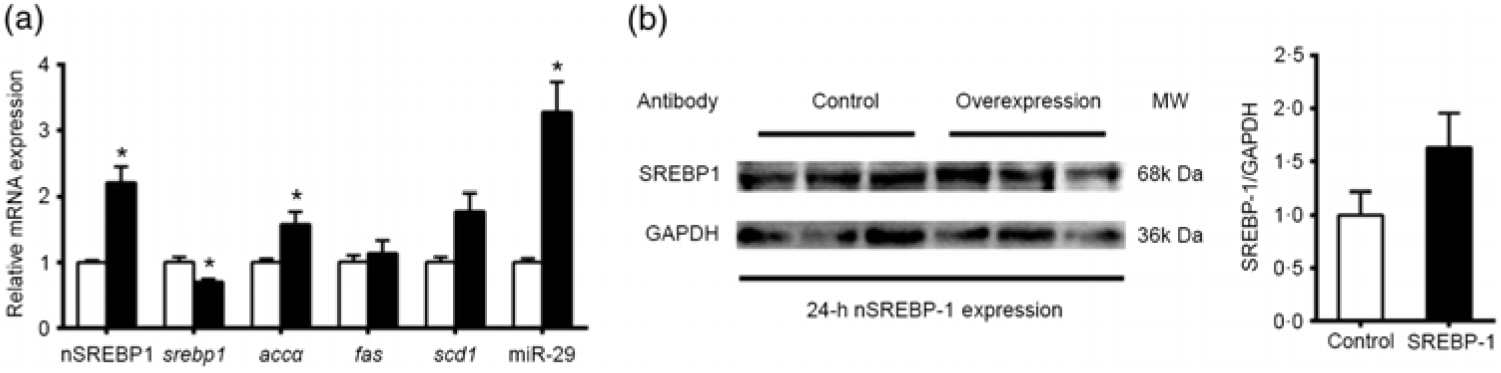
The results above indicated that the promoter regions of genes involved in lipid metabolism (srebp-1, fas and scd1) possessed SRE. These observations prompted us to investigate whether and how SREBP-1 regulated lipid metabolism in grass carp. We transfected the nSREBP-1 plasmid into CIK cells of grass carp and then determined the expression of its potential target genes and nSREBP-1. Compared with the control, the overexpression of nSREBP 1 significantly increased the mRNA expression of nSREBP-1, and significantly reduced srebp-1 mRNA expression by 30 % , and up-regulated mRNA expression of accα and miR-29. mRNA expression of fas and scd1 tended to increase after nSREBP1 overexpression but the differences were not statistically significant between the two groups (Fig. 5(a)). Moreover, the protein level of nSREBP-1 tended to up-regulate during the transfection of nSREBP-1 plasmid into CIK cells, though the differences did not reach statistical significance (Fig. 5(b)).
Expression of sterol regulatory element-binding protein 1 (srebp-1), acetyl-CoA carboxylase α (accα), fatty acid synthase (fas) and stearoyl-CoA desaturase 1 (scd1) after N-terminal domain of SREBP-1 (nSREBP-1) overexpression in Ctenopharyngodon idella kidney (CIK) cells for 24 h. (a) mRNA expression of srebp-1, accα, fas and scd1 and microRNA-29 (miR-29) in CIK cells for 24-h overexpression. β-Actin and elongation factor 1-α (ef1α) were chosen as the housekeeping genes (M = 0·253). (b) Protein expression of nSREBP-1 in CIK cells for 24-h overexpression. Values are means (n 3), with their standard errors represented by vertical bars. * Significant differences between nSREBP-1 overexpression (![]() ) and control (
) and control (![]() ) groups (P < 0·05). GAPDH, glyceraldehyde-3-phosphate dehydrogenase; MW, molecular weight.
) groups (P < 0·05). GAPDH, glyceraldehyde-3-phosphate dehydrogenase; MW, molecular weight.
Luciferase assay of 3′UTR of SREBP-1 by miR-29
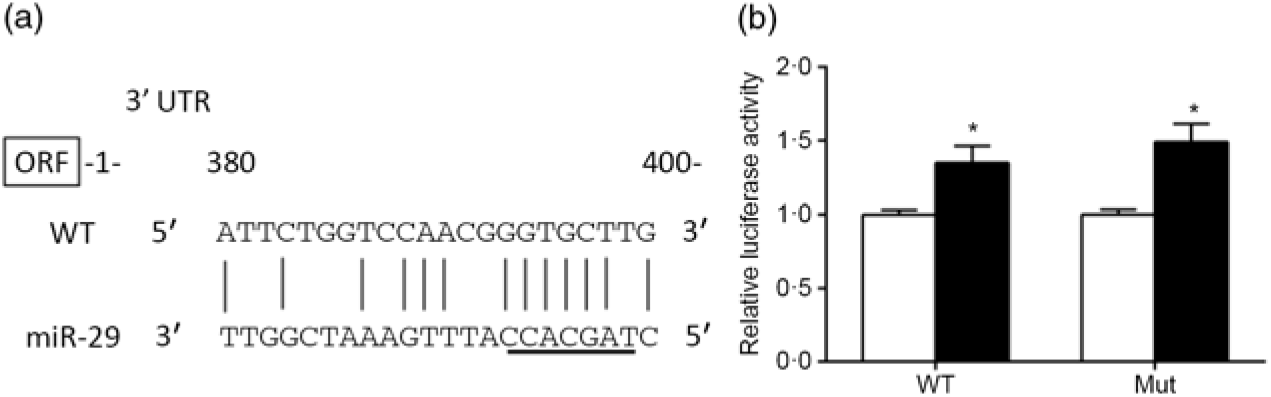
The predicted miR-29 binding sites on the 3′UTR of srebp-1 are presented in Fig. 6(a). The luciferase reporter assay was used to verify whether miR-29 could influence the transcription of srebp-1. Compared with the negative control, co-transfection of miR-29 mimics with the pmirGLO-srebp1 significantly increased the luciferase activity of srebp-1 3′UTR by 1·3-fold, and its stimulatory effect was not abolished when the miR-29 targeted seed sequence of the srebp-1 3′UTR was mutated, indicating that miR-29 up-regulated the transcription of srebp-1 (Fig. 6(b)).
Prediction and luciferase assay of 3’UTR (untranslated region) of sterol regulatory element-binding protein 1 (SREBP-1) by microRNA-29 (miR-29). (a) Schematic representation of the miR-29 target sequence within the 3’UTR of the srebp-1 gene. Vertical lines (|) indicate nucleotides that are reversely complementary to miR-29. The core seed of miR-29 is underlined. The numbers indicate the positions of the nucleotides in the srebp-1 3’UTR region. (b) Luciferase activities of the 3’UTR of srebp-1 at 24 h. Relative luciferase activity was presented as the fold activated by miR-29 mimics (![]() ) compared with the negative control (
) compared with the negative control (![]() ). Values are means (n 3), with their standard errors represented by vertical bars. * Significant difference of luciferase activity between the miR-29 mimics and negative control groups (P < 0·05). WT, wild type.
). Values are means (n 3), with their standard errors represented by vertical bars. * Significant difference of luciferase activity between the miR-29 mimics and negative control groups (P < 0·05). WT, wild type.
Analysis of miR-29 transfection in Ctenopharyngodon idella kidney cells
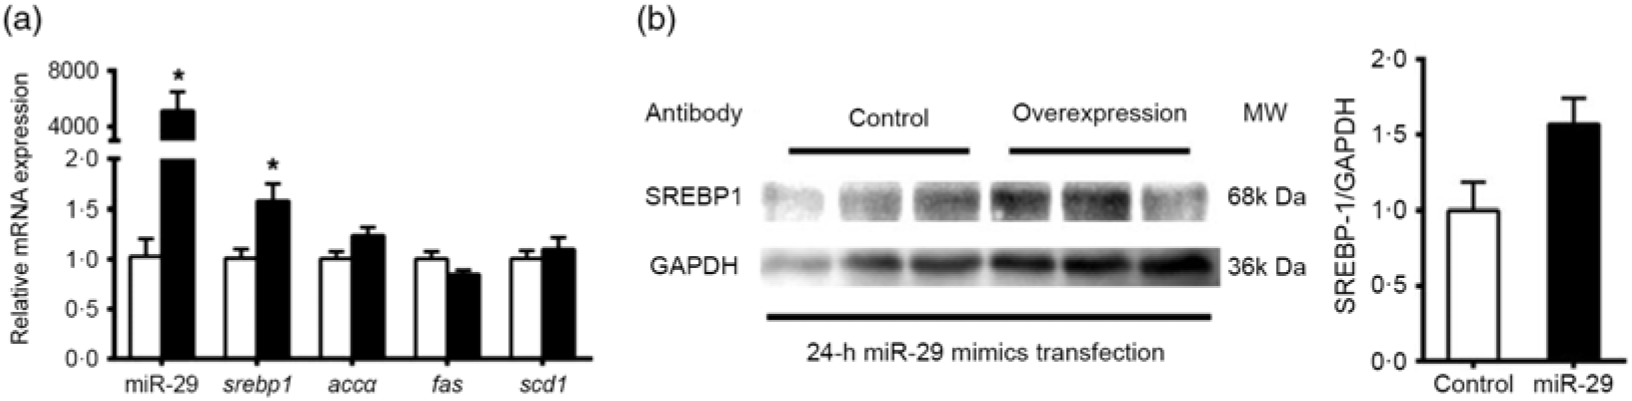
To support further the function of miR-29 in regulating the expression of SREBP-1 and its potential target genes, we transfected miR-29 mimics into the grass carp CIK cell lines. Compared with the negative control, miR-29 expression was significantly increased during the transfection of miR-29 mimics into CIK cells, and miR-29 mimics significantly increased the mRNA level of srebp-1 by 1·6-fold but showed no effect on the mRNA expression of accα, fas and scd1 (Fig. 7(a)). Moreover, the protein level of nSREBP-1 tended to up-regulate during the transfection of miR-29 mimics into CIK cells, though the differences did not reach statistical significance (Fig. 7(b)).
Expression of sterol regulatory element-binding protein 1 (srebp-1), acetyl-CoA carboxylase α (accα), fatty acid synthase (fas) and stearoyl-CoA desaturase 1 (scd1) after microRNA-29 (miR-29) mimics transfection in Ctenopharyngodon idella kidney (CIK) cells for 24 h. (a) mRNA expression of srebp-1 (nuclear part sequence of srebp-1), accα, fas and scd1 and miR-29 in CIK cells after miR-29 transfection at 24 h. β-Actin and elongation factor 1-α (ef1α) were chosen as the housekeeping genes (M = 0·242). (b) Protein expression of N-terminal domain of SREBP-1 (nSREBP-1) in CIK cells after miR-29 transfection at 24 h. Values are means (n 3), with their standard errors represented by vertical bars. * Significant difference between the nSREBP-1 overexpression (![]() ) and control (
) and control (![]() ) groups (P < 0·05). GAPDH, glyceraldehyde-3-phosphate dehydrogenase; MW, molecular weight.
) groups (P < 0·05). GAPDH, glyceraldehyde-3-phosphate dehydrogenase; MW, molecular weight.
Discussion
Several authors have overexpressed mature active SREBP-1 in fish, which activates the expression of target genes by translocating to the nucleus and binding to SRE within the promoters of target genes(Reference Shimano, Horton and Hammer6,Reference Chen and Zhang27) . Here we prepared an NH2-terminal fragment of grass carp SREBP-1 (amino acid residues 1-494 of the protein, defined as nuclear SREBP-1, or nSREBP-1) and transfected the nSREBP-1 overexpression plasmid along with promoter reporter system to study the activation of potential target genes (srebp1, accα, fas and scd1).
In the present study, we cloned the 1988 bp, 2043 bp, 1632 bp and 1889 bp sequences of srebp-1, accα, scd1 and fas promoters, respectively. To our best knowledge, this is the first time to clone and characterise their promoter regions of these genes in fish. We predicted a cluster of putative binding sites of several transcription factors on the promoters of srebp-1, accα, scd1 and fas of grass carp, such as SP, YY1, NF-Y, SREBP-1 itself and E-box element. Similar structures have been reported in mammals(Reference Cagen, Xiong and Wilcox13,Reference Amemiya-Kudo, Shimano and Yoshikawa28,Reference Li, Luo and Xu29) . Sp1 has been shown to be a co-activating factor with SREBP-1a(Reference Sanchez, Yieh and Osborne30). YY1 is a multifunctional Zn-finger transcription factor that can act as a transcriptional repressor, activator or initiator element binding protein(Reference Ericsson, Jackson and Edwards10,Reference Galvin and Shi31) . NF-Y was presented to be an essential co-activator of the sterol response(Reference Shimano11,Reference Xiong, Chirala and Wakil32) . The E-box is important for sterol regulation(Reference Bennett, Lopez and Sanchez33). Accordingly, these transcription factor binding sites were important for its basal activation and also activation through other pathways.
The functional importance of SREBPs in controlling transcription of lipid metabolism-related genes is well established, but the mechanism remains unknown. The present study found that there were SRE on the promoters of srebp-1, accα, scd1 and fas of grass carp. Multiple lines of evidence from 5′-deletion assay, site-mutation and EMSA analyses of each SRE on accα, fas, scd1 and srebp-1 promoters further confirmed that those SRE actually presented as functional sites for SREBP-1 regulation and that srebp-1, fas and scd1, but not accα, were the target genes of SREBP-1. Similarly, several studies suggested that the SRE-1 and the E-box elements were existent in FAS promoter, which binds SREBP-1(Reference Bennett, Lopez and Sanchez33). Accordingly, SREBP-1 directly controls the expression of FAS(Reference Shimano11,Reference Magaña and Osborne34) . Li et al. (Reference Li, Luo and Xu29) reported that overexpression of SREBP-1 can increase FAS promoter activity and mRNA expression levels. SREBP-1 overexpression resulted in an increase in the mRNA levels of FAS and SCD(Reference Li, Luo and Xu29,Reference Li, Zhao and Wei35) . Unexpectedly, based on the results from 5′-deletion assay, site-mutation and EMSA analyses of SRE on accα promoters, the present study clearly indicated that accα was not the direct target gene of SREBP-1 though mammal’s study found that SREBP-1 overexpression resulted in an increase in the mRNA levels of ACC(Reference Li, Zhao and Wei35). Studies indicated that SREBPs required interaction with cofactors after binding to target DNAs to activate the downstream gene(Reference Amemiya-Kudo, Shimano and Hasty5,Reference Bennett, Lopez and Sanchez33) . Similar results were also indicated by 5′-deletion assay, site-mutation and EMSA analyses of SRE on scd1 promoter.
In mammals, studies suggested that SREBP-1 contained SRE in their enhancer/promoter regions, and the nuclear forms of SREBPs can activate their own genes in an auto-regulatory loop(Reference Amemiya-Kudo, Shimano and Hasty5,Reference Amemiya-Kudo, Shimano and Yoshikawa28,Reference Sato, Yang and Wang36) . However, in contrast with mammals, the present study clearly indicated that the activity of srebp-1 promoter was strongly inhibited by SREBP-1 itself. The reasons remained unknown now. Studies showed that SREBP activation of gene expression, in some SREBP target genes, can be negatively regulated by YY-1 Zn-finger transcription factor in manner of repressing SREBP activation by displacing NF-Y(Reference Bennett, Ngo and Athanikar37,Reference Ericsson, Usheva and Edwards38) . Moreover, YY1 could bind to SREBP-1 with a high affinity and interferes with the SREBP binding to the SRE on target genes(Reference Christenson, Osborne and McAllister39). Interestingly, we discovered that there are multiple potential YY1 binding sites on the promoter of srebp-1 gene of grass carp, but not on accα, fas and scd1 promoters. Thus, we concluded that it may be YY1 that causes the inhibition of srebp-1 expression during nSREBP-1 overexpression, indicating that a potential pathway might participate in SREBP-1-mediated lipid homeostasis.
In the present study, in grass carp CIK cells, the overexpression of nSREBP-1 significantly reduced srebp-1 mRNA expression and up-regulated mRNA expression of accα. Thus, again our study confirmed that the SREBP-1 suppressed its own expression; meantime, it is the nuclear form of SREBP-1, not SREBP-1, that regulates its downstream target genes. Similarly, Kim et al. pointed out that SREBP1 translocates to the nucleus where it activates lipogenic genes by binding to the SRE of target genes(Reference Kim, Shin and Seo7). The present study also indicated that mRNA expression of fas and scd1, and the protein level of nSREBP-1 tended to up-regulate during the transfection of nSREBP-1 plasmid into CIK cells but the differences did not reach statistical significance. We speculated that it may be because increased SREBP-1 protein expression was not enough to up-regulate mRNA expression of its target genes fas and scd1. It is well reported that some miR regulate the expression of target genes involved in lipid metabolism(Reference Cui, Chen and Tan15). Recently, in mammals, Ru et al. reported that SREBP-1 transcriptionally activated specific SRE motifs on the promoter of miR-29, and then miR-29 inversely suppressed SREBP-1 expression by binding to their 3′UTR region(Reference Ru, Hu and Geng16). In contrast, in the present study, we found that transfection of miR-29 mimics significantly increased the mRNA level of srebp-1 and miR-29 in CIK cells but showed no significant effects on the mRNA expression of accα, fas and scd1. The up-regulation of srebp-1 mRNA level by miR-29 was not expected since miR are believed to bind through partial homologous sequence to a target gene at 3′UTR and cause translation repression. However, other studies suggest that miR can up-regulate translation of target genes(Reference Vasudevan, Tong and Steitz40). On the other hand, we also noticed that miR-29 mimic transfection tended to up-regulate the protein expression of nSREBP1 and that nSREBP-1 overexpression up-regulated mRNA expression of miR-29, implying that a self-activating loop for SREBP-1 and miR-29 existed in grass carp. Further study is still needed to elucidate the details of the self-activating mechanism of SREBP-1 and miR-29 in grass carp.
Conclusion
In summary, we identified and characterised the promoter regions of srebp-1, accα, fas and scd1 genes from grass carp. The present study demonstrated that fas and scd1 were the direct target genes of SREBP-1. Furthermore, we found two novel transcriptional mechanism for regulating SREBP-1 expression: (1) the auto-regulation sited on the SREBP-1 promoter regions was suppressive and (2) SREBP-1 overexpression up-regulated miR-29 expression, and SREBP-1 expression was up-regulated by miR-29 as well, implying a self-activating loop of SREBP-1 and miR-29 in grass carp. Our study shed us new sight into the regulation of lipid metabolism.
Acknowledgements
This work was supported by National Key R&D Program of China (grant no. 2018YFD0900400), National Natural Science Foundation of China (grant no. 31422056) and Fundamental Research Funds for the Central Universities, China (grant no. 2662018PY089 to Z. L.).
Z. L. and Y.-H. X. designed the experiment; Y.-H. X. conducted the experiment with the help of X.-Y. T., Y.-C. X., T. Z. and L.-H. Z.; Y.-H. X., X.-Y. T. and Z. L. analysed the data; Y.-H. X. drafted the manuscript and Z. L. revised the manuscript. All the authors read and approved the manuscript.
The authors declare no conflicts of interest.
Supplementary material
For supplementary material/s referred to in this article, please visit https://doi.org/10.1017/S0007114519001934


