

The decision by developing countries to open up their economies to foreign trade and investment in the 1980s and 1990s was a momentous event in world history. The opening of China and India, as two of the most populous countries on earth, would have been remarkable developments on their own. Yet, many other countries from Latin America to Southeast Asia also began to reduce their trade barriers and increase their participation in international commerce around the same time. These decisions fundamentally reshaped the global economy and contributed to a stunning reduction in poverty and inequality around the world.
How did the shift from closed to open markets happen? This question raises a political economy puzzle because economists tend to think that the deck is stacked against free trade. Since Adam Smith, economists have attributed trade restrictions to governments being influenced by domestic producer interests who benefit from blocking foreign competition and ignoring the interests of consumers and exporters. As a result, efforts to reduce import restraints and liberalize trade are usually met with stiff opposition from powerful interest groups. Yet the speed and sweep of the worldwide movement toward a more open economy between 1985 and 1995 was remarkable. What confluence of circumstances made this dramatic shift possible?
Standard explanations that focus on interest groups do not provide a satisfactory answer. The balance of political power between different trade-related factions did not significantly change in most countries. That is, exporters and consumers did not suddenly become more politically powerful, and domestic producers competing against imports did not become politically weaker. Furthermore, multilateral trade agreements did not contribute much to reducing the trade barriers of developing countries.
This paper focuses on the fact that many of the trade restrictions relaxed by developing countries during this period were originally imposed for balance of payments purposes. During the Great Depression of the 1930s and into the post-World War II period, governments used various measures—import licensing, quantitative restrictions, and foreign exchange controls—to limit spending on imports and prevent a drain of a country’s foreign exchange reserves. At a time when fixed exchange rates were the norm and devaluation was viewed as something to be avoided, countries resorted to import controls as a substitute for exchange rate adjustments to ensure that foreign exchange spending did not exceed foreign exchange receipts.
This situation changed in the mid-1980s, when many developing countries faced an acute shortage of foreign exchange. As foreign exchange reserves were depleted, governments found it difficult to maintain fixed exchange rates, especially those that had become highly overvalued. In addition, import-compression policies became counterproductive because raw materials and intermediate goods purchased from other countries were necessary to keep the economy going. These circumstances led countries to reorient their policy from conserving foreign exchange to earning more foreign exchange. The use of import controls to manage the balance of payments was abandoned in favor of exchange rate adjustments that encouraged exports and discouraged imports. As Collier (Reference Collier1993, p. 510) put it: “The heart of liberalization is the conversion from using trade policy for payments balance to using the exchange rate.”
The key step in opening an economy to international trade was a large devaluation to eliminate the overvaluation of a country’s currency, followed by a complete overhaul of the system of allocating foreign exchange. Under the old system, exporters would have to turn over their foreign exchange earnings to the government at the official exchange rate, empowering officials to allocate that foreign exchange for the purchase of imports that they approved. Under the new system, the government established a market-based mechanism whereby exporters could retain or sell their foreign exchange earnings, and any importer could buy foreign currency at the market rate. These steps would allow import restrictions to be relaxed, first by eliminating quantitative restrictions and then by gradually reducing tariffs.
Economists played an important role in promoting this shift away from foreign exchange controls to a more open trade and payments regime. They learned from country experiences that a devaluation was a better way of resolving balance of payments difficulties than import restrictions. As economists rose to important policymaking positions around the world in the 1980s, they were positioned to influence the decisions made by governments. They helped get the government out of the business of allocating foreign exchange in favor of market mechanisms that reduced the discretionary powers of officials, which had led to corruption and inefficiency.Footnote 1 By coupling trade reforms with a devaluation, many of the political problems associated with a tariff reduction alone were avoided. A real exchange rate devaluation would help all traded goods industries (exporters and import-competing producers alike) as opposed to pitting one group of domestic producers against another in the case of tariff cuts.
This paper begins by putting the globalization wave of the 1980s and 1990s into long-term perspective, including its contribution to historic changes in the world’s distribution of income. The paper then describes how past methods of reducing trade barriers, through trade agreements, do not help us understand what happened in the 1980s and 1990s. After setting out the balance of payments rationale for import restrictions under fixed exchange rates, the paper describes how severe shortages of foreign exchange contributed to the trade reforms of that period. The final section discusses particular country cases to illustrate these generalizations.
RECENT GLOBALIZATION IN HISTORICAL PERSPECTIVE
“When did globalization become sufficiently advanced that it started influencing overall living standards and income distribution, by changing domestic commodity prices and inducing the widespread reallocation of resources within national economies?” That is the question posed by O’Rourke and Williamson (Reference O’Rourke and Williamson2002, p. 27) in asking, “when did globalization begin?” Although international trade goes back centuries, they find this deeper form of globalization began in the early nineteenth century, sometime after the end of the Napoleonic wars in 1815.
The ebbs and flows of globalization since the early nineteenth century can be seen in data on international trade.Footnote 2 Figure 1 depicts world trade (merchandise exports and imports) as a share of the world’s gross domestic product (GDP) over almost two centuries, from 1825 to 2023. Five distinct eras of global trade integration emerge from this picture.Footnote 3
GLOBALIZATION ERAS, 1825–2023
Notes: World exports and imports as a percentage of world GDP. These series have different country coverage that accounts for some of the variation across measures.
Sources: Federico and Tena-Junguito (Reference Federico and Tena-Junguito2019) from 1825–1938 (in blue), Fouquin and Hugot (Reference Fouquin and Hugot2016) from 1826–1950 (in tan), Klasing and Milionis (Reference Klasing and Milionis2014) for 1870–1949 (in dark green), Penn World Table for 1950–2017 (in light green), and World Bank for 1960–2023 (in red).
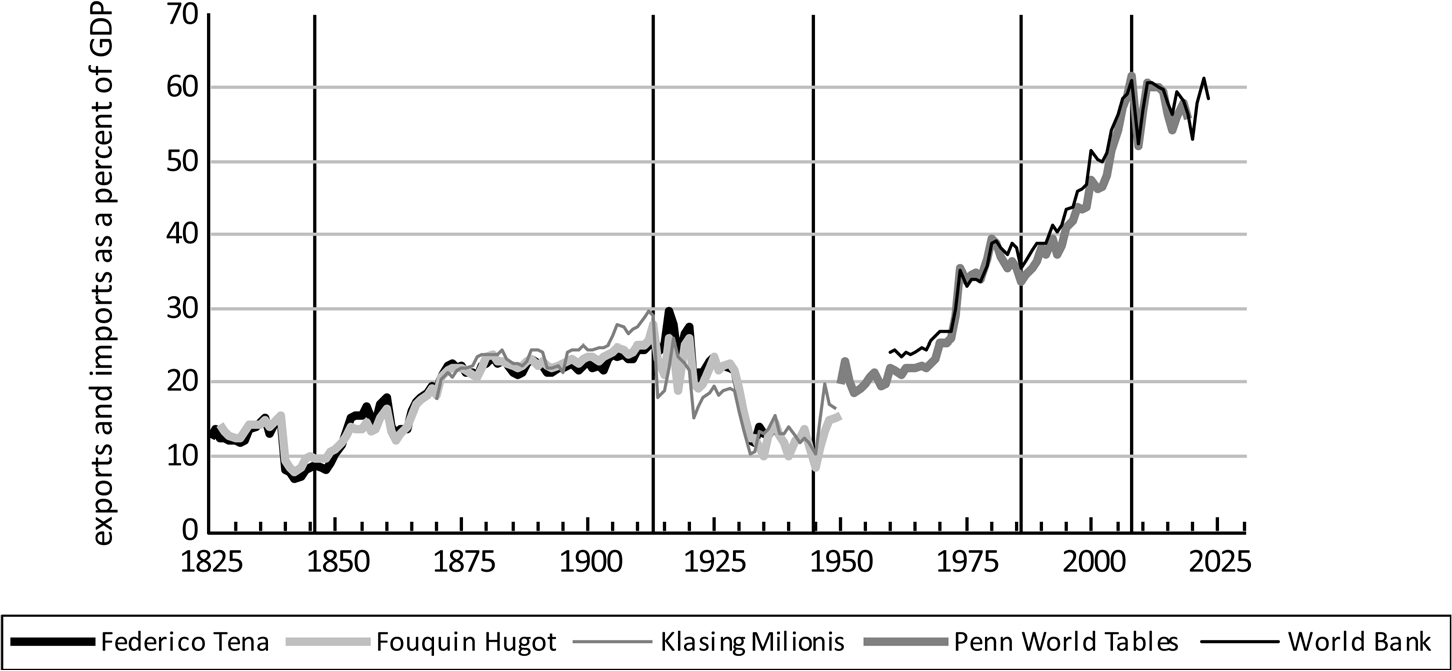
Figure 1 about here
The first era, the long nineteenth century, runs from the 1840s until World War I. Trade grew steadily as a share of world output, driven by the twin engines of lower transportation costs (steam ships and railroads) and lower trade barriers (trade agreements). The second era, from 1914 until 1945, saw a marked retreat in global integration. This period began with a destructive world war, followed by the Great Depression of the 1930s and a severe increase in protectionism around the world, and then another destructive world war.
The third era is the post-World War II recovery from 1945 until 1985. The globalization of this period was incomplete because geopolitical divisions separated the world into three different economic blocs, the market-oriented countries of the West (North America, Western Europe, and Japan), the communist countries of the East (the Soviet Union, Eastern Europe, and China), and the non-aligned countries of the global South (Latin America, Africa, and Asia). These blocs were economically separated from one another: the planned economies of the East did not trade much with the West, and the South distanced themselves from the Western core by pursuing import substitution policies. Only when two oil price shocks bumped up the measured trade-to-GDP ratio in the 1970s did the level of integration reach its pre-World War I peak.
The fourth era, from 1985 until the global financial crisis in 2008, saw a stunning increase in the world trade to GDP ratio as the three separate worlds moved toward a single integrated one. The collapse of communism in the Soviet Union and Eastern Europe, the opening of China and India to world trade, and the decision by many developing countries in Latin America and Asia to reduce their barriers to foreign trade and investment made them all greater participants in the world economy. The level of economic integration rose very quickly and far exceeded any previous era of globalization.
The fifth (and current) era, after 2009, will be for future economic historians to study. The flatlining of the trade ratio is likely due to several factors, including the end of trade reforms, the reappearance of geopolitical tensions, and the return of economic nationalism.
Economic historians have long studied the first three eras of globalization. Nearly 30 years ago, in his presidential address before the EHA, Jeffrey Williamson (Reference Williamson1996) focused on the late nineteenth century (1870–1913) and the late twentieth century (1950–1990). These two periods saw incomes converging among Western countries, but the story was strikingly different for the rest of the world. Between the West and the rest, there was increasing inequality—or “divergence, big time,” as Pritchett (Reference Pritchett1997) put it. Indeed, such divergence had been the norm since the start of the Industrial Revolution when Western countries pulled ahead of the rest of the world. Figure 2 shows the growing divergence in the distribution of world income between 1800 and 1975, dividing the world into haves and have-nots, with many people well below the international poverty line and many people well above it.

In retrospect, Williamson was writing amid a completely new era of globalization. The quarter century from 1985 to roughly 2010 stands out as a distinctive globalization epoch with truly historic consequences. During this period, developing countries experienced faster economic growth, which led to rising standards of living, falling global poverty, and the creation of a global middle class (Radelet Reference Radelet2015). For the first time since the Industrial Revolution, the world saw an unconditional convergence—not divergence—of incomes across countries.Footnote 4 Between 1975 and 2015, as Figure 2 shows, the distribution of world income shifted to the right, with the previous bimodal distribution becoming a unimodal distribution with a higher mean.
The growth of once low-income countries such as China and India reduced global income inequality. As Figure 3 shows, the global Gini coefficient—measuring income inequality across countries—increased continuously from 1820 until about 1990 when it fell sharply (Milanovic 2024). In fact, by this measure, the quarter century between 1990 and 2015 erased more inequality across countries than the previous century increased it.Footnote 5 This growth helped produce an astounding reduction in global poverty. According to the World Bank, the share of the world’s population in extreme poverty fell from about 45 percent in the early 1980s to less than 10 percent by the early 2020s.Footnote 6
GLOBAL INCOME INEQUALITY, 1820–2020
Notes: The figures from 1820–1980 are based on per capita GDP (in blue), and from 1988 are based on country mean income determined by household surveys (in orange); income in purchasing power parity (PPP) dollars.
Source: Milanovic (2024).
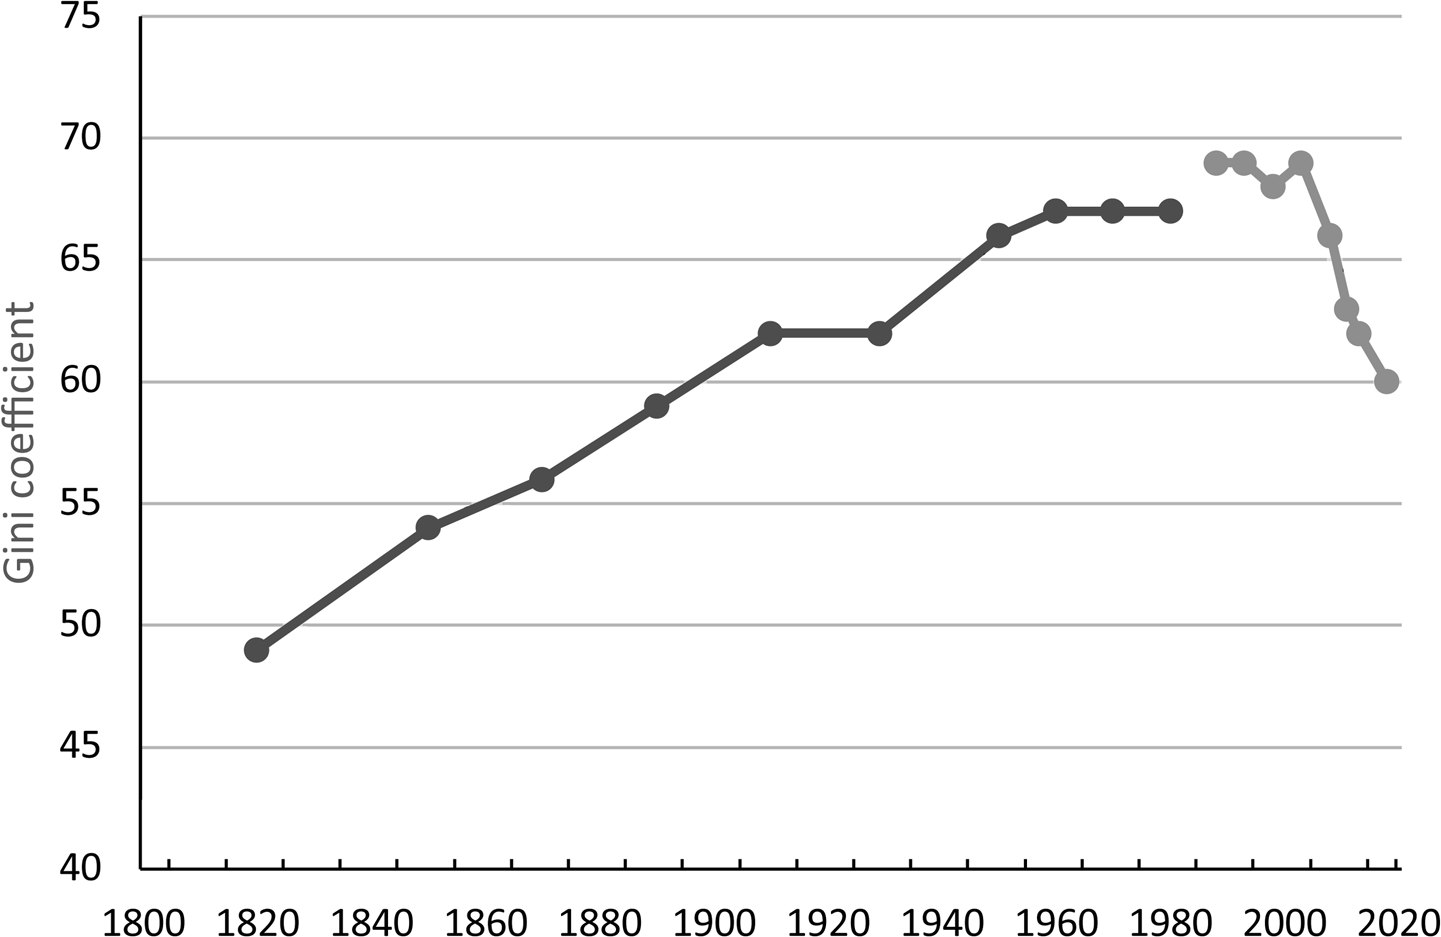
Figure 3 about here
These are astounding and historic developments in the world economy. What explains the improved economic performance of developing countries? One factor is their increased participation in global trade and investment (Easterly Reference Easterly2019). This participation was made possible because of an unprecedented number of trade liberalization episodes after 1985. Figure 4 shows the number of developing countries that switched from being “closed” to being “open” in the half-century after 1960, according to Sachs and Warner (Reference Sachs and Warner1995).Footnote 7 In contrast to the absence of such reforms in the 1960s and 1970s, a wave of trade reform occurred in developing countries between 1985 and 1995.Footnote 8
DEVELOPING COUNTRY TRADE LIBERALIZATION EPISODES, 1960–2001
Sources: Sachs and Warner (Reference Sachs and Warner1995) and Wacziarg and Welch (2008).
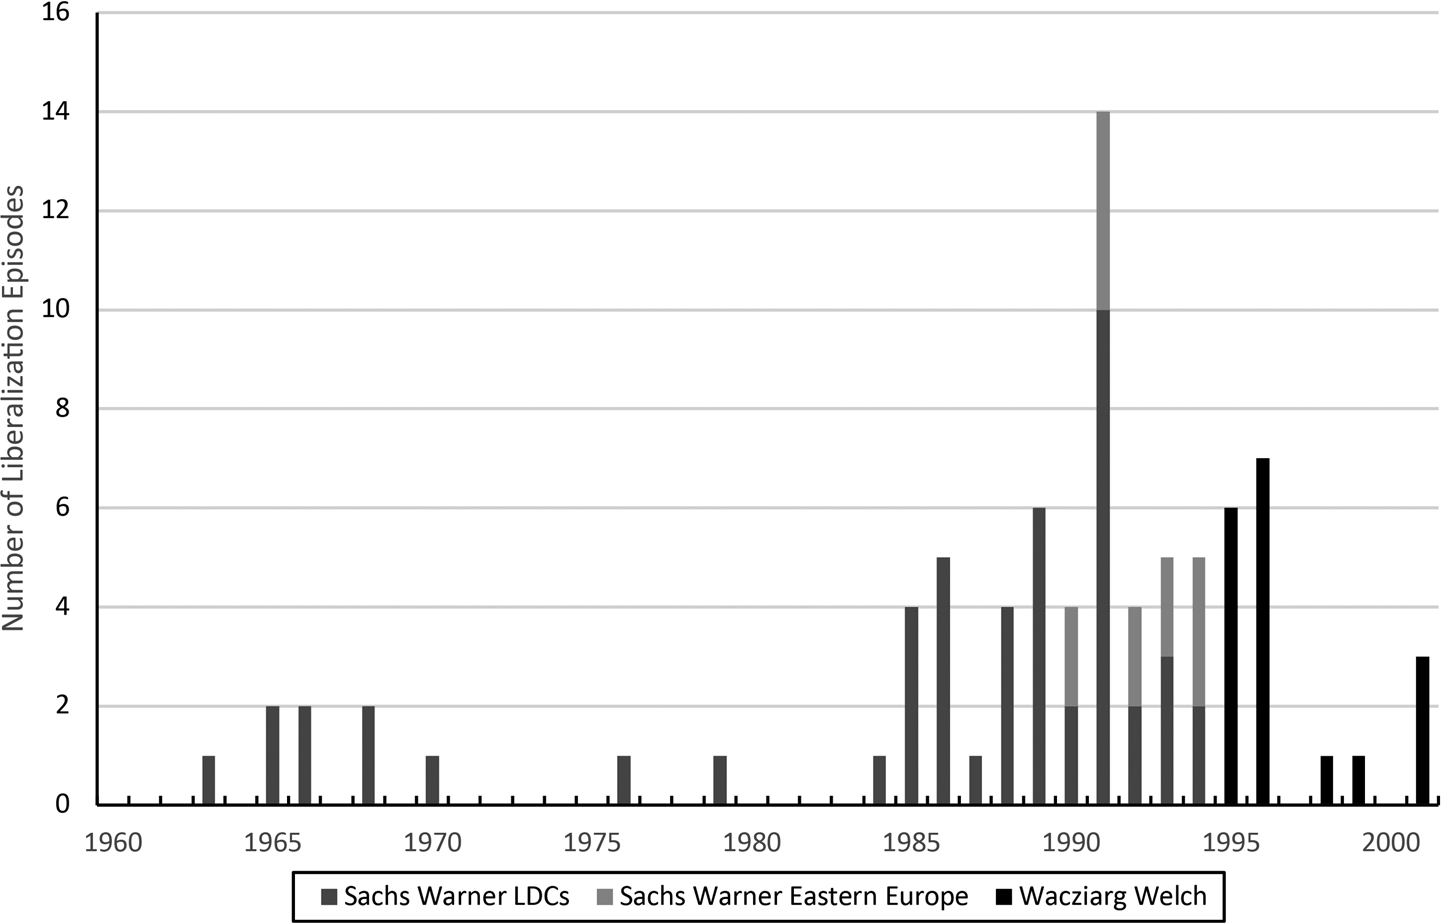
Figure 4 about here
The reduction in trade barriers associated with this opening contributed to the more rapid growth experienced by developing countries starting in the late 1980s and early 1990s. By opening up to foreign trade and investment, these countries reaped more than just the standard static gains from trade. Because they started behind the technological frontier, developing countries were able to gain access to better technology and thereby improve their productivity (Lucas Reference Lucas2009). This enabled them to close some of the gaps that separated them from higher-income countries. The experience of several high-profile countries illustrates these phenomena, such as Taiwan and Korea in the 1960s, China in the mid-1980s, and Poland, India, and Vietnam in the early 1990s.
Such impressions are supported by empirical studies that have documented the relationship between lower trade barriers and more rapid economic growth. Sachs and Warner (Reference Sachs and Warner1995) were among the first to find that open economies performed better than closed economies. This work has been extended by others. Wacziarg and Welch (2008) report that countries that liberalized their trade regimes in the period from 1950–98 experienced 1.4 percentage points higher growth than in the pre-reform period. Estevadeordal and Taylor (Reference Estevadeordal and Taylor2013) estimate that liberalizing countries enjoyed 10–15 percent higher income than non-liberalizers in the decade after 1990. Billmeier and Nannicini (Reference Billmeier and Nannicini2013) use synthetic control methods to examine country cases and conclude that trade reforms had a positive impact on income, but with much heterogeneity across countries and time. Other research using different methods has reached similar conclusions (as surveyed by Irwin 2025a).
The contribution of specific policies to improved economic performance among developing countries will be debated for some time. Yet their increased openness to trade and investment clearly helped make the 1990s and 2000s a historic period of change for the world economy. The question is, how did this openness happen?
HOW DOES FREER TRADE HAPPEN?
In the Wealth of Nations, Adam Smith described how governments tend to restrict trade because they are influenced more by producer interests that favor trade restrictions than by consumer interests that favor trade openness. Ever since economists have focused on how special interest groups that support trade restrictions have made it politically difficult to reduce such barriers.Footnote 9
The political scales are tipped in a protectionist direction for several reasons. A policy that limits trade generates benefits that are highly concentrated on a few producers while the costs are spread across many dispersed consumers. For that reason, Olson (Reference Olson1965) pointed out, producer interests find it beneficial to organize and engage in political pressure for such policies, whereas consumers who will be harmed find it more challenging to solve their collective action problem and organize in opposition.
Fernandez and Rodrik (Reference Fernandez and Rodrik1991) provide another reason that potential beneficiaries from trade reform do not organize: exporters who might benefit from a reform ex post do not know whether they will benefit ex ante. This uncertainty means that exporters will be politically inactive, which tends to support the status quo. As we will see, this explanation is consistent with the trade policy experience in the 1980s. Many reforming countries had significant export potential because their policies suppressed trade and kept the ratio of exports to GDP artificially low. For example, South Korea’s exports were only 1 percent of GDP in 1960, China’s exports were about 3 percent of GDP in the early 1970s, and India’s exports were less than 5 percent of GDP in 1985. Yet no one knew which industries would expand as a result of increased trade and hence exporters did not play a critical role in initiating policy reforms in these countries.
For these reasons, economists may be better at explaining the existence of protectionist policies than the movement toward freer trade.Footnote 10 Yet, however politically difficult, history shows that a reduction of trade barriers is possible—otherwise, countries would always remain pretty much closed, which they have not. In fact, trade liberalization was a feature of previous eras of expanding globalization. How did such liberalization happen in the past, and does it help inform our understanding of the 1985–95 trade reform wave?
In the nineteenth century, Britain pursued a policy of unilateral free trade with the repeal of the Corn Laws in 1846 and the Navigation Acts in 1849. This is a rare case in which economic interests, along with a changing distribution of political power, helped bring about freer trade (Schonhardt-Bailey Reference Schonhardt-Bailey2006). The beneficiaries of agricultural protectionism were a small group of politically influential landowners (aristocrats), whereas the mass population of workers and a smaller number of industrialists had an interest in cheaper, imported food. The Anti-Corn Law League mobilized the support of consumers and potential exporters, both of whom lacked much political power but vastly outnumbered the landowners who benefited from restricting imports of grain. The reduction of trade barriers was sparked by a crisis (the Irish potato famine) and aided by the growing political power of the middle class. While crises are often triggers for reform, widespread popular opposition to import restrictions is not something usually seen in other countries, making Britain’s experience somewhat unique.
A more common experience is that governments use trade agreements with other countries to overcome domestic political opposition to freer trade. In these agreements, countries reduce their tariffs on each other’s products and establish reciprocal market access. Such agreements mobilize the political support of exporters against import-competing producers because there are tangible benefits for exporters from a negotiated reduction in foreign barriers to their products that are absent in any unilateral tariff reduction.
Trade agreements are a feature of previous globalization episodes. The 1860 Cobden-Chevalier treaty between Britain and France reduced tariffs and sparked a wave of similar treaties across Western Europe that either reduced tariffs or extended most favored nation (MFN) treatment to each party, or both.Footnote 11 The globalization wave after World War II was also abetted by trade agreements. The United States adopted the Reciprocal Trade Agreements Act of 1934, which empowered the president to conclude trade agreements with other countries (Haggard Reference Haggard1988). The legislation did not bear much fruit until after the war when the United States helped create the General Agreement on Tariffs and Trade (GATT), which established a set of rules governing world trade and started the process of negotiating lower tariffs.
Yet neither of these two factors—domestic interest groups and trade agreements—contributed much to the trade reforms in developing countries in the 1980s and 1990s. In terms of domestic interests, consumers and exporters did not mobilize to drive the policy change, nor was opposition by domestic firms competing against imports so strong that it could not be overcome. Instead, reformist governments pushed through policy changes at their own initiative without much support or resistance from private interests. As Bates and Krueger (1993, p. 455) conclude from a series of case studies of trade reform episodes, “one of the most surprising findings … is the degree to which interest groups fail to account for the initiation” of policy reform.Footnote 12
Nor were trade agreements behind the trade opening of developing countries. These countries were exempt from key disciplines in the GATT: they were allowed to maintain quantitative restrictions on imports and excused from the obligation of reciprocity in tariff negotiations. They did not participate in the tariff reductions negotiated during the Kennedy Round of the 1960s and the Tokyo Round of the 1970s. In the Uruguay Round, which was not completed until 1994, after the trade reform wave had subsided, developing countries only agreed to reduce their bound tariffs, which were much higher than their applied tariffs that the negotiations left largely untouched (Irwin 2023). When developing countries dismantled their import control regimes and reduced their tariffs, they did so largely through unilateral actions. The average applied tariff of developing countries fell from 29.9 percent in 1983 to 11.3 percent in 2003. Two-thirds of this reduction came unilaterally, just one-quarter from multilateral negotiations, most of which was due to China, and one-tenth from regional trade agreements (Martin and Ng Reference Martin and Ng2004).
So what circumstances led developing countries to open their markets in the 1980s and 1990s?
IMPORT CONTROLS AND THE BALANCE OF PAYMENTS
To explain the unilateral reduction in trade barriers by developing countries in the 1985–95 period, one must recognize that countries imposed import restrictions for reasons other than just helping domestic producers compete against imports. Many countries used import controls—specifically, foreign exchange restrictions that hampered importing—as a means of balancing international payments under fixed exchange rates.
Under a floating (i.e., market-determined) exchange rate system, the exchange rate changes from day to day in a way that automatically balances a country’s international payments and receipts without the government intervening in the foreign exchange market. The ability of a government to maintain a fixed exchange rate, on the other hand, depends on its having enough foreign exchange reserves to intervene in the market to accommodate any imbalance in payments and receipts. For example, if demand for a country’s exports falls, reducing the supply of incoming foreign exchange, then the government must make up that shortfall by selling some of its reserves to keep the exchange rate fixed.
Reserves are finite, however, so there is a limit to how much can be spent propping up a currency’s value on foreign exchange markets. If a country is running low on reserves and does not want to devalue, it can try to borrow from foreign creditors. If borrowing is too costly, then restricting the access of importers to foreign exchange is a way of bringing spending on imports into balance with lower export receipts. This can be done through various administrative mechanisms, including import licensing (requiring permission to import), import surcharges (extra taxes on imports), prior import deposit requirements (posting a bond before importing), and so forth.
Eichengreen and Irwin (Reference Eichengreen and Irwin2010) argue that these factors help explain the protectionism of the Great Depression in the 1930s. The collapse of export prices for commodity producers and the outflow of capital starting in 1929 led many countries to impose foreign exchange controls and import restrictions for balance of payments purposes. The protectionism of the 1930s was not undertaken to protect domestic producers from foreign competition as much as an emergency measure to prevent the loss of gold reserves. Governments chose to protect their gold and foreign exchange reserves by limiting spending on imports and clamping down on other foreign exchange outflows in the hopes of avoiding a devaluation or being forced off the gold standard. Other countries that left the gold standard and devalued their currencies did not face the same pressure on their balance of payments and did not adopt protectionist measures to the same extent (Irwin Reference Irwin2012). As a result, a country’s exchange rate policy was an important determinant of its trade policy.
The Bretton Woods conference in 1944 set up the International Monetary Fund (IMF) to restore world trade by dismantling the restrictions on payments for current account transactions that had arisen during the 1930s and 1940s. However, there was tension between that objective and the other objective of exchange rate stability. The Bretton Woods negotiators established a regime of fixed but adjustable exchange rates, fixed in normal times but adjustable in situations of fundamental disequilibrium in the balance of payments.Footnote 13 Yet the emphasis was on the fixed and not on the adjustable. Most countries were still reluctant to devalue their currencies. The memoirs of politicians and finance ministers sometimes reveal the anguish they went through in trying to avoid a devaluation.Footnote 14
Like the efforts to stay on the gold standard in the 1930s, countries sought to prevent a devaluation by employing a battery of discretionary controls—including foreign exchange rationing, non-automatic import licensing, and advance import deposit requirements—as a way of regulating imports and keeping foreign exchange outflows in line with inflows. These administrative controls could be tightened or relaxed depending on the level of a country’s reserves. These policies were not designed to reduce foreign competition at the behest of domestic producers, but they had that effect. The goal was more the protection of foreign exchange reserves from depletion than the protection of domestic industries from foreign competition.
These restrictions were permitted under international trade rules. Article XVIII(b) of the GATT allowed developing countries to impose quantitative restrictions (QRs) on imports to safeguard the balance of payments and promote economic development. This enormous loophole permitted them to justify almost any restriction on imports. Consequently, developing countries maintained extensive nontariff barriers—including foreign exchange controls, import licensing, and other QRs—ostensibly on balance of payments grounds. Some 80 percent of the quantitative restrictions notified to the GATT by developing countries were justified by the balance of payments provision (International Monetary Fund 1992, p. 41). Such measures were supposed to be transitional, but the GATT provided very little oversight and allowed them to persist for decades without challenge.
To understand how easy it was to slip into the use of import restrictions, consider the options available to a government with a fixed exchange rate in response to an adverse shock to the balance of payments. Such a situation could arise because a deterioration in the terms of trade (a fall in export prices) or a reduction in foreign aid or remittances from abroad leads to a decline in foreign exchange receipts. This tightening of a country’s budget constraint forces economic adjustments to take place, and none of the choices is good.
Table 1 outlines the principal responses that a government can take to make up the shortfall between a country’s foreign exchange receipts and payments. The first option is to spend the country’s foreign exchange reserves, but there is an obvious limit to that approach (i.e., running out of reserves). The second option is to borrow from foreign creditors. Such financing provides a temporary solution but sometimes is only available on bad terms, especially after a negative shock. A third option would be restrictive monetary and fiscal policies (deflation) to reduce spending in the economy and bring expenditures on foreign goods in line with export earnings. This may resolve the payments deficit but at the likely cost of a recession, something that governments seeking to maintain popular support would prefer to avoid. A fourth option would be to devalue the currency, making imports more expensive at home and exports more competitive in world markets. This facilitates adjustment to the extent that export earnings increase and import spending decreases, but the higher price of imports reduces the real wages of consumers. A fifth alternative is to impose foreign exchange controls that immediately restrict spending on imports and the outflow of capital. This may be more politically palatable because it hides the pain in the short run even if controls are distortionary and fail to solve the underlying imbalance in the long run. Every option is painful and politically unpopular, which is why Forbes and Klein (Reference Forbes and Klein2015) say that policymakers have to “pick your poison.”Footnote 15
POLICY OPTIONS IN A BALANCE OF PAYMENTS CRISIS
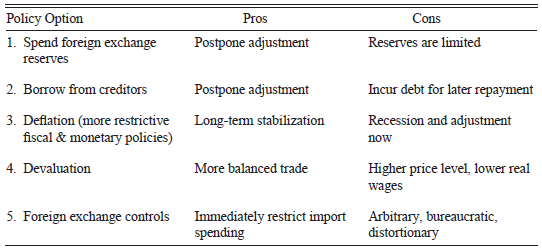
Source: Author’s compilation.
A vivid description of these unpalatable policy options comes from New Zealand. In the fourth quarter of 1957, New Zealand lost nearly half of its foreign exchange reserves when export prices plunged after eight years of high prices. The country’s reserves fell to the equivalent of just six weeks of imports, a dangerously low level. Prime Minister Walter Nash, who had served as finance minister during a previous balance of payments crisis in 1938, gave a radio address to the nation in which he outlined the difficult choices that the government faced. His biographer described it this way:
“As Nash spoke, he was, in effect, reviewing much of his own life as a Minister of Finance … as he surveyed the alternatives. The first was to borrow abroad—shades of 1939 again. £50 or £60 million (not a mere £17 million now) could not, given the state of the London market, be raised unless at very high interest. He was not going to go through that again. Rapid deflation, reducing purchasing power sufficiently, and causing unemployment, was not acceptable. Nor would devaluation do the job—devaluation to such an extent that it would deter importing would mean a 25 per cent or 30 per cent rise in the cost of living: inflation instead of an exchange crisis. Exchange controls … were a fourth theoretical possibility but were blunt and clumsy. The remaining possibility, which Labour would adopt, was ‘exchange allocation and import selection’” (Sinclair Reference Sinclair1976, p. 307, emphasis added).
In other words, he ruled out borrowing, deflation, and devaluation and opted instead for import controls, in which the government would allocate foreign exchange to purchase specific types of imported goods.
India faced a similar problem in 1957 and resolved it in almost exactly the same way. In the early 1950s, India did not have a shortage of foreign exchange and import controls were relatively relaxed. That changed with the Second Five Year Plan for 1956–61, which involved massive state-sponsored investment in heavy industry and required large-scale imports of capital goods. A key constraint was whether the country would have enough foreign exchange, either earned through exports or received through foreign aid, to finance the purchases.
The sharp increase in government investment spending immediately spilled over to imports and crowded out exports as production was diverted to the domestic market. The fall in exports and the jump in imports depleted India’s foreign exchange reserves almost overnight. Prime Minister Jawaharlal Nehru insisted on continuing with the plan and rejected a devaluation as “fantastic nonsense” (Panagariya Reference Panagariya2024, p. 171). Having ruled out a devaluation, the government addressed the scarcity of foreign exchange through comprehensive import licensing. Almost all imports required government approval, something that became known as the license raj. Exporters were required to turn over at the official exchange rate all foreign exchange earnings, which the government would allocate based on its development priorities. The government could relax or tighten the foreign exchange budget depending on the level of its reserves. The use of licensing to restrict imports gave valuable scarcity rents to those fortunate enough to gain access to foreign currency because they could buy foreign products at world prices and sell them at inflated domestic prices.Footnote 16
Of course, because the nominal exchange rate was fixed at its 1949 rate, the large expansion in investment demand led the rupee to become overvalued. The black-market premium on the rupee increased from 5 percent in the mid-1950s to 50 percent in the early 1960s.Footnote 17 The overvalued rupee significantly reduced exports and increased demand for imports, making the country more dependent on foreign aid to keep imports at high levels.
India’s foreign exchange reserves continued to slide over the next few years, dropping from $1.6 billion in 1955 to just $265 million in 1962 (Bhagwati and Srinivasan Reference Bhagwati and Srinivasan1975, p. 22). By 1965, India’s reserves had dwindled to just one month’s worth of imports, and the black-market premium reached more than 100 percent. In desperation, the government continued to squeeze imports, increasing customs duties by 10 percent in February 1965 and again in August. After the World Bank promised additional funding if it were to devalue and relax its import controls, India’s government reluctantly devalued on the infamous day of 6 June 1966 (6/6/66). The government was not fully committed to dismantling the license raj or making further exchange rate adjustments, and soon India was back with an overvalued currency and tight import controls once again.
The experiences of New Zealand and India were repeated in many other countries around the world. Developing countries were prone to having overvalued currencies and recurring balance of payments difficulties, often due to high rates of inflation and the failure to adjust nominal exchange rates accordingly.Footnote 18 Devaluations were thought to fuel inflation, deteriorate the terms of trade, add to the burden of foreign debt, redistribute income in undesirable ways, and reduce the standard of living of urban workers. Officials sought to avoid, or postpone for as long as possible, any devaluation because of these concerns, as well as fear of the political fallout.Footnote 19 Even developed countries used import restrictions as a substitute for devaluation in the 1950s and 1960s.Footnote 20 Yet such efforts only postponed but did not prevent an eventual devaluation. Moreover, once introduced, the import controls were never completely abolished even if a devaluation rendered them unnecessary.
A few developing countries responded to balance of payments crises in a different way, by using a devaluation as an opportunity to relax import restrictions and open the economy to more trade. Two countries that did so relatively early were Taiwan (1958–62) and South Korea (1964–65). In each case, an important motive for reform was the desire to increase foreign exchange earnings from exports to compensate for declining U.S. foreign aid, which had been financing a large share of their imports (Irwin 2021). Korea particularly resented its dependence on the United States, which gave it leverage over Korean politics, and wanted to become “self-sufficient”—not in the sense of trade autarky but in being able to pay for their imports through their own export earnings.
Taiwan and South Korea adopted what came to be known as an “export-oriented” trade policy. That stance hinged more on changes to exchange rate policy than traditional trade policies, such as tariffs, although it often included giving exporters duty-free access to imported raw materials and other inputs to production. In both cases, a large devaluation was followed by efforts to maintain a competitive real exchange rate and avoid another overvaluation of their currency.Footnote 21 It also involved moving away from government allocation of foreign exchange toward market-based mechanisms. In both cases, the goal was to increase export earnings to pay for more imports and avoid the pain of reducing imports further even if that might benefit some domestic producers.
Both Taiwan and South Korea began to grow more rapidly after their policy changes, but few followed their example. In the early 1970s, higher commodity prices and easier access to credit in the aftermath of the oil price shock led to a general abundance of foreign exchange. Most developing countries had adequate reserves to maintain their existing trade and payments regimes without much pressure to change. As the Spanish economist Enrique Fuentes Quintana once quipped: “Foreign exchange reserves kill the will to reform” (Calvo-Gonzalez Reference Calvo-Gonzalez2021, p. 128).
EXCHANGE RATE REGIMES AND THE TRADE REFORM WAVE
What changed to move countries away from import controls as a means of regulating the balance of payments in favor of exchange rate adjustments and trade liberalization?
The global environment shifted from foreign exchange abundance in the 1970s to foreign exchange scarcity in the 1980s. The balance-of-payments constraint tightened for most countries. The oil price shock of 1979 did not lead to a generalized commodity price boom as the one in 1973–74 had. Instead, commodity prices slid and then collapsed in 1985–86, leading to a catastrophic 35 percent decline in the terms of trade of commodity exporters between 1980 and 1987 (Maizels Reference Maizels1992). The severe tightening of U.S. monetary policy in the early 1980s led to higher interest rates and sharply curtailed the ability of developing countries to borrow. In fact, capital flows reversed: net transfers to developing countries fell from +$55 billion in 1981 to –$18 billion by 1987 as countries repaid more on old loans than they received in new lending (World Bank 1991, p. 18).
Developing countries were facing inevitable hardship, but continued resistance to devaluation hampered their ability to adjust. Although most industrialized countries had moved to floating exchange rates in the early 1970s, the developing world did not follow because foreign exchange was abundant and borrowing was easy. That was no longer the case in the 1980s, but they still kept their exchange rates tightly managed. The lack of exchange rate adjustment led to massively misaligned currencies as export prices fell. Nearly half of all countries in the mid-1980s had overvalued currencies, often with black market premia above 40 percent (Easterly Reference Easterly2019, figure 2a).
Overvalued currencies posed a huge obstacle to exports and created a strong incentive to import. That exacerbated foreign exchange shortages and almost guaranteed that countries would have to adopt a restrictive import regime. Furthermore, it was almost impossible to introduce freer trade in a country where the currency was seriously overvalued. Domestic producers looked hopelessly uncompetitive at the official exchange rate, making them fearful of any trade opening, whereas the situation would look quite different at a market exchange rate.
Therefore, the first step of any government that sought to open the economy was to undertake a large devaluation to eliminate the currency overvaluation and substantially reduce the black-market premium. This had to be coupled with a commitment to adjust the nominal exchange rate on an ongoing basis to prevent a recurrence of an overvaluation. Reforming governments also revamped how foreign exchange was managed. They moved away from a system where exporters turned over all their foreign exchange earnings at the official exchange rate for the government to allocate based on whatever criteria it established. Instead, they would establish a convertible currency at a market exchange rate, whereby exporters could retain or sell their foreign currency earnings and any importer could purchase foreign currency without applying for a government permit or import license.
The changing ideas of economists helped set the stage for these steps. Early in the postwar period, many development economists warned against devaluations and instead proposed multiple exchange rates to selectively encourage or discourage certain imports and exports.Footnote 22 During the 1970s, economists came to recognize the costs of such import control regimes and their adverse effect on exports (Little, Scitovsky, and Scott Reference Little, Scitovsky and Scott1970; Krueger 1997). In particular, country experiences demonstrated that import controls were a bad way of addressing an overvalued exchange rate and a poor substitute for a devaluation (Bhagwati Reference Bhagwati1978; Krueger 1978). Using import controls to conserve foreign exchange did nothing to increase export earnings or solve the underlying shortage of foreign exchange. And postponing a devaluation did not prevent its eventual occurrence but just ensured that the shock would be that much larger.
As a result, more and more economists saw the benefits of exchange rate adjustment over import controls as a way of managing the balance of payments.Footnote 23 These ideas were given force as an increasing number of economists were appointed to senior policymaking positions around the world in the 1980s (Markoff and Montecinos Reference Markoff and Montecinos1993). The idea of using exchange rate policy instead of import restrictions to promote balance of payments adjustment usually entered the policymaking process from economists in central banks and finance ministries, where economic expertise within the government was concentrated.Footnote 24 When foreign exchange reserves were low and policy adjustments were required, economists in policymaking positions helped tip decisions in favor of devaluation and the liberalization of import controls. This position was reinforced by advice and conditionality from the IMF and the World Bank.
These decisions were made politically possible not only because they usually occurred in a crisis, when foreign exchange reserves were close to being exhausted, but also because they did not involve an immediate reduction of import tariffs. A tariff cut alone would take away benefits to certain domestic producer interests without generating much support from other constituents. Instead, a devaluation would help all traded goods industries, export-oriented and import-competing alike. Furthermore, adjustments to the foreign exchange regime were technical decisions that could be administered by central banks and finance ministries, which had broad authority to change exchange rates and relax nontariff import restrictions without legislative approval or protracted public debate. The decision to lift administrative import controls was usually made by a small group of officials who were largely insulated from political pressures and special interests. Then the goal of reducing tariffs was made easier by the real depreciation of the currency, which helped exporters and dampened import competition.
Not coincidentally, the trade reform wave coincided with a dramatic reduction in the number of countries with overvalued currencies. The number of countries with large black-market premia fell considerably between the late 1980s and the early 1990s as devaluations became more accepted (Easterly Reference Easterly2019). These countries also overhauled their foreign exchange regime. Figure 5 shows that the number of countries with multiple or dual exchange rates fell considerably between 1985 and 1995 as countries moved to unify their exchange rates and establish convertibility for current account transactions.
PERCENT OF COUNTRIES WITH MULTIPLE OR DUAL EXCHANGE RATES, 1946–2015
Source: Ilzetzki, Reinhart, and Rogoff (Reference Ilzetzki, Reinhart and Rogoff2019).

COUNTRY EXAMPLES
This broad characterization of the reform process in the late 1980s and early 1990s can be given more specificity by looking at particular cases that illustrate some of the themes emphasized here: the absence of economic interest groups as drivers of policy, the centrality of the foreign exchange system in the reform process, and the importance of economists in government in shaping policy choices.
Mexico and Peru
In 1982, when Mexico declared that it could no longer pay its foreign debts, key economic officials in the government of President Jose Lopez Portillo had received their degrees from Cambridge University under the influence of Joan Robinson and Nicholas Kaldor. Representing that tradition, they argued against devaluation and liberalization in favor of import repression and a closed economy model (Rattner Reference Rattner1982). On their advice, the government responded to the debt crisis by subjecting 100 percent of imports to quantitative restrictions and introducing exchange controls through multiple exchange rates.
When Miguel de la Madrid took over the presidency, he relied on a different set of economists who had been educated at U.S. institutions. This group supported the abolition of import controls and the opening of the economy, a process that began in 1985. They did not adopt a floating exchange rate but managed it to prevent an overvaluation that would harm exporters. The government slashed the share of imports subject to import licensing from 100 percent in 1983 to about 18 percent in 1989. They also reduced the average tariff from 27 percent in 1982 to 13 percent in 1989 (Aspe Reference Aspe1993, pp. 157–8).
The Mexican policy switch originated within the government itself and did not arise from demands coming from the private sector. Cronin (Reference Cronin2003, pp. 64–5) notes that “the decision to embark on the path toward significant trade liberalization was solely the product of preferences in the government. The economically and politically most important societal group—the industrial sector—opposed the change.” That opposition was much less formidable than expected, and the real exchange rate adjustment facilitated the process of adjusting to lower trade barriers.
Peru went through a similar transformation around the same time. The terms of trade shock of the mid-1980s put enormous pressure on the country’s balance of payments position. Under President Alan Garcia, the government took a heterodox macroeconomic approach that involved 100 percent import licensing, multiple exchange rates, and import surcharges to support a massively overvalued currency. This program pushed the country toward hyperinflation and an extreme foreign exchange shortage.
In 1990, Alberto Fujimori was elected president and was persuaded (in part by the IMF, against his initial inclinations) to adopt major reforms after learning that further borrowing was not an option. Within weeks of taking over, the government undertook a massive devaluation and moved to unify and float the exchange rate. The government also began to overhaul the trade regime, an effort led by Finance Minister Carlos Boloña, whose thesis at Oxford University was a tariff history of Peru. Import licensing and other nontariff barriers were eliminated or scaled back, and the tariff code was simplified to just three tariff rates—15 percent on primary inputs, 25 percent on intermediate and capital goods, and 50 percent on final goods (International Monetary Fund 1993, p. 51).
India
As we saw earlier, India maintained comprehensive controls on imports after the loss of foreign exchange reserves due to the Second Five Year Plan in 1957.Footnote 25 Strict import licensing, along with tariffs as high as 300 percent, largely closed the Indian economy to trade. Exports were only about 5 percent of GDP in the mid-1970s, and local producers controlled about 95 percent of the domestic market for manufactured goods and almost 100 percent of the consumer goods market (World Bank 1989, p. 7).
When Iraq invaded Kuwait in 1990, oil prices spiked and put India’s balance of payments under extreme pressure. Not only did the higher price of oil increase India’s spending on imports, but exports to the Middle East and remittances from workers in the Gulf region slumped. With foreign exchange reserves at low levels and falling, the government mortgaged some of its gold holdings and tried unsuccessfully to secure external financing as it squeezed imports even further to stem the loss of foreign exchange. The government tightened licensing requirements for imports of capital goods and reduced the amount of foreign exchange made available for raw materials and industrial components. It imposed a 50 percent advance import deposit requirement on all non-capital goods imports in late 1990, an amount ratcheted up to 200 percent by early 1991. These stringent measures shut out almost all non-oil and non-food imports by early 1991. The problem with the austerity inherent in an import compression policy was that slashing imports of raw materials and intermediate goods began to inhibit domestic production and employment in some sectors.
In June 1991, a new government took over amid the economic crisis. Manmohan Singh, an Oxford-trained economist whose thesis had been on India’s export difficulties in the 1960s, was appointed finance minister. He led a reform team that quickly devalued the rupee, abolished costly export subsidies (which were no longer needed to compensate for an overvalued currency), and took major steps toward ending import licensing and establishing an open market for foreign exchange. These initiatives were taken by the finance minister, the commerce minister, and the prime minister without consulting the cabinet or other constituencies. As Ahluwalia (2020, p. 136), who was one of the reformers in government, later exclaimed: “A major step in liberalizing trade policy was completed in the space of about eight hours!”
In a national address, the prime minister defended the devaluation without using that word, saying that it “was done so that we can export more … This will not only earn us Foreign Exchange but also create new employment at home. And why do we need to earn foreign exchange so badly? Not to import luxury items but to buy commodities like kerosene and diesel, fertilisers, edible oil, and steel. My objective is to make India truly self-reliant. Self-reliance …. means the ability to pay for our imports through our exports” (Ramesh Reference Ramesh2015, pp. 68–69).
The reaction to the sweeping reforms announced in July 1991—within the government bureaucracy, by intellectuals and academic economists, by opposition political parties, and by industry and labor groups—was almost uniformly negative. The reforms had no domestic constituency or strong advocates outside the high-level technocrats in government. Yet within weeks, the balance of payments crisis eased, the foreign exchange situation improved, and the Reserve Bank was able to relax the advance import deposit requirement.
Over the next two years, the government scaled back import licensing, unified the exchange rate, and made the rupee convertible for current account transactions. The adoption of a flexible exchange rate made any return to the draconian import controls of the past unnecessary. The black-market premium that had existed for many decades disappeared, and foreign exchange reserves were no longer a major policy concern. With surprisingly little backlash, the average tariff on imports was reduced from about 140 percent in 1991 to about 40 percent in 1995. The depreciation of the rupee helped ease the adjustment for industries competing against imports. As Ahluwalia (2017, p. 50) stated, “The exchange rate was very significantly depreciated over a two-year period, and this made it possible to liberalize import controls and reduce import duties with far fewer problems than would have arisen if trade liberalization was not accompanied by exchange rate depreciation.”
As a result of these actions, India’s exports rose from about 5 percent of GDP in the early 1970s to more than 20 percent of GDP by the mid-2000s, enabling the financing of imports of a comparable magnitude.
China
After the communist revolution in 1949, China was virtually a closed economy. Foreign trade was controlled by state-trading companies, and in the early 1970s, exports and imports were only about 2 percent of GDP.Footnote 26
In 1979, China began a policy of “reform and opening.” The driving force behind the decision was Deng Xiaoping’s desire to modernize the economy and take advantage of foreign technology.Footnote 27 As a one-party state, the Chinese government had the autonomy to make this pivot based on the desires of the political leadership. It was not acting at the behest of domestic producers or consumers, there being no private firms or private political activity. To accomplish the goal of modernization, China required foreign exchange to purchase technology and capital goods abroad, and hence it needed to export. As Liew and Wu (Reference Liew and Wu2007, p. 73) note: “The main aim of the authorities in introducing foreign exchange and trade reform was to increase foreign exchange earnings to make more foreign exchange available to finance the national import plan.”
As China was a planned economy, prices and exchange rates were not used to allocate resources. As it began to open up, China established a foreign exchange retention system—allowing export-producing enterprises and state foreign trade companies to keep a portion of their foreign exchange earnings—to incentivize exports. “The 1980 foreign exchange retention system was a milestone in exchange rate reform because it was the first attempt by the authorities in the reform period to allow the market to play a role, even though only at the margin, in determining the exchange rate,” Liew and Wu (Reference Liew and Wu2007, p. 66) argue. In 1986, the government permitted exporters to retain a much larger share of their foreign exchange earnings and introduced a secondary market for foreign exchange. This swap market set a market-based price of foreign exchange (as opposed to the overvalued official exchange rate) and allowed non-exporting firms to gain access to foreign exchange. This gave a huge boost to exports, and by the mid-1980s, 42 percent of all foreign exchange was in the hands of provinces and exporters, and only 58 percent was controlled by the central government (Lardy Reference Lardy1992, p. 57).
China adopted more far-reaching trade and exchange rate reforms in the early 1990s. The government devalued the official exchange rate in steps until it matched the swap rate and then unified it in 1994. The foreign exchange retention system was abolished, allowing exporters to retain or trade all of their earnings at the market rate. These exchange rate adjustments facilitated the reduction in the average applied tariff from 44 percent in 1991 to 17 percent in 1997 (Lardy 2002, p. 34). These policies contributed to an explosion of trade, with exports reaching nearly 20 percent of GDP by the end of the decade.
Other Examples
These stories could be repeated in many other countries around the world. A common theme would be the pressures for reform coming from the tightening of the foreign exchange budget constraint, the necessity of increasing exports to pay for imports, the importance of policies regarding the setting of the exchange rate and the disposition of foreign exchange, and the autonomy of the government in setting a new path for policy without receiving much support from exporters or facing much opposition from producers competing against imports.
One could even trace the collapse of communism in the Soviet Union and Eastern Europe to these factors (Bartel Reference Bartel2022). The collapse in oil prices in 1985–86 hit the Soviet Union’s economy very hard, reducing its export earnings and its ability to pay for imports of food. The Soviets borrowed heavily in the late 1980s to continue importing until 1989, when they could not secure a major loan. In late 1990 the Soviet Union ran out of hard currency reserves, and in 1991 import volume fell in half. The inability to finance imports meant less food and fewer industrial goods were available to the economy, reducing production and even threatening the country with a possible famine. As Gaidar (Reference Gaidar2007, p. 250) put it: “in the mid-1980s, the USSR faced a crisis in its balance of payments … that developed into a broader economic crisis and led to a steep decline in production and the standard of living, and finally the collapse of the political regime and the Soviet Empire.”
The foreign exchange problems of the Soviet Union forced it to cut back on its subsidies to Eastern Europe and Vietnam, leading to reforms in those countries as well. The cessation of Soviet aid and the collapse of the Soviet trade bloc cost Vietnam about 7 percent of its GDP, an enormous shock (IMF 1991, p. 53). At the end of 1987, Vietnam’s foreign exchange reserves were down to about two and one-half weeks’ worth of imports, and the country was on the brink of famine. After turning to the IMF for advice, Vietnam eliminated virtually all price controls and devalued the official exchange rate to the parallel market rate in March 1989. Exports responded almost immediately, and the country’s foreign trade began its long expansion.
Poland borrowed heavily in the 1970s but failed to develop the export capacity to service those debts. Throughout the 1980s, the country suffered from a shortage of foreign exchange, squeezing out imports to the detriment of the standard of living. In August 1989, a non-communist government took over, and economist Leszek Balcerowicz was appointed deputy prime minister and finance minister. Balcerowicz embraced rapid economic reforms, including a massive devaluation in January 1990. The black-market premium on the zloty, which had been over 400 percent in 1989, disappeared (Berg and Sachs Reference Berg and Sachs1992, p. 130). Balcerowicz also made the zloty completely convertible for importers and exporters. The World Bank had recommended a five-year transition period for convertibility, but Balcerowicz did it overnight. Balcerowicz (Reference Balcerowicz2017, p. 47) later stated: “One of the greatest reforms which we introduced was the unification of the exchange rate and the introduction of the convertibility of the currency, and this was sort of a revolution because people could legally import goods.”
African countries faced equally, if not more, acute balance of payments pressures than other countries but were slower to reform. Many East African countries, such as Kenya, Tanzania, and Uganda, suffered extreme and persistent foreign exchange shortages in the 1980s. The resistance to reform did not come from import-competing producers but from within the government. As Bienen (Reference Bienen1990, pp. 714–5) noted: “The halting steps toward trade liberalization and foot-dragging on tariff reform and export promotion … come less from mass political protests against reform policies … than they do from opposition within the government… The most politically powerful pressures for import substitution and/or overvalued exchange rates have come from civil servants, politicians, and the military,” not private businesses. Pressure from donors and international institutions finally persuaded these countries, usually after new leaders took office, to devalue and unify their exchange rates and move to current account convertibility, around 1993.
Of course, not all countries that reformed experienced the globalization boom, and not all countries had policymakers willing to undertake extensive reforms. Trade reforms ran into problems in the absence of a real exchange rate adjustment. Countries in French West Africa tried to open their economies but kept their currencies pegged to the French franc, leading to disastrous results. Other countries did not accompany opening to trade with other domestic reforms that were needed to support exports, such as labor market or service sector liberalization. Such countries had disappointing growth outcomes (Devarajan 2019).
Even today, some countries resist reforming their trade and exchange rate policies. For example, Egypt has experienced roughly eight balance of payments crises since 1952. The country has gone through a repeated cycle of having an overvalued currency, running into a crisis, being forced to devalue, refixing the exchange rate, and going through the process once again. The problem has been vested interests in government that benefit from privileged access to foreign exchange and the power to allocate it. As Agarwal and Mazarei (Reference Agarwal and Mazarei2024, p. 2) note, “This pattern is rooted not just in a belief in the merits of fixed exchange rates but also in Egypt’s political economy, especially its state-military-dominated governance structure…. Egypt’s ability to secure geopolitical rents, including in the form of support from the international financial organizations and major donors, allows the authorities to continue to bet on weathering future crises without significant reforms.”
CONCLUSION
The decade from 1985–1995 was a historic period in which the opening of developing countries to trade fundamentally transformed the world economy. This paper focuses on the balance of payments origin of the import restrictions that kept developing countries separated from the rest of the world. The process of opening up countries that had been largely closed to the world economy involved extensive changes to the foreign exchange regime—the setting of the exchange rate and the disposition of foreign exchange—as much as changes to traditional trade policy instruments such as tariffs and quotas. Understanding the original purpose of these restrictions in a regime of fixed exchange rates helps us make sense of their removal as countries gradually moved toward more flexible exchange rates.
It is often said that developing countries followed a strategy of import substitution to build up domestic industries and promote industrialization. But they often limited imports for a more prosaic reason: to protect foreign exchange reserves from depletion because of an overvalued currency. An important objective of reforming countries was to import more, not less, and to generate more foreign exchange earnings through exports to pay for those imports.


 Open access