


Introduction
Protected areas are essential for conserving biodiversity. This is reflected in Aichi Target 11 of the Convention on Biological Diversity, which aims to protect at least 17% of terrestrial and 10% percent of marine areas by 2020. However, many developing countries lack the resources to expand and manage their protected area networks (Bruner et al., Reference Bruner, Gullison and Balmford2004; Githiru et al., Reference Githiru, Wilburn King, Bauche, Simon, Boles, Rindt and Victurine2015). Unless alternative sources of finance are sought, it seems unlikely that developing countries will meet their protected area targets (Butchart et al., Reference Butchart, Clarke, Smith, Sykes, Scharlemann and Harfoot2015).
Biodiversity offsetting has been presented as a tool for meeting protected area targets (Pilgrim & Bennun, Reference Pilgrim and Bennun2014; Githiru et al., Reference Githiru, Wilburn King, Bauche, Simon, Boles, Rindt and Victurine2015; Maron et al., Reference Maron, Gordon, Mackey, Possingham and Watson2016a). Offsetting is a conservation action that aims to compensate for a specific amount and type of biodiversity loss at one locality with an ecologically equivalent gain at another locality (Maron et al., Reference Maron, Ives, Kujala, Bull, Maseyk and Bekessy2016b). In the case of using offsets for protected area expansion, tracts of land would be conserved formally, thus curbing future transformation and avoiding the anticipated loss of biodiversity (i.e. averted-loss biodiversity offsets). Although averted-loss offsets inevitably lead to biodiversity loss relative to starting levels (Moilanen & Laitila, Reference Moilanen and Laitila2016), no net loss can be achieved against supposed baseline counterfactuals of ongoing decline (Maron et al., Reference Maron, Rhodes and Gibbons2013; Buschke, Reference Buschke2017).
Funding protected area expansion through biodiversity offsetting is appealing because developers are liable for the ecological damage they cause, and incur the full environmental costs. However, such strategies run the risk of cost-shifting if these new funds supplant, rather than supplement, existing commitments to protected area expansion (Pilgrim & Bennun, Reference Pilgrim and Bennun2014; Maron et al., Reference Maron, Gordon, Mackey, Possingham and Watson2016a). Moreover, biodiversity offsets cannot be regarded as a sustainable source of protected area finance because they are fundamentally premised on biodiversity loss; especially if they replace other non-offset conservation interventions. Therefore, any evaluation of biodiversity offsets should include the broader context of conservation interventions. In the case of protected areas, the gains from offsets should be assessed in conjunction with existing protected area expansion strategies.
Here we simulate how much habitat would be lost to development if biodiversity offsetting were to meet Aichi Target 11 in South Africa's grassland biome. South Africa is recognized globally as a mega-diverse country (Brooks et al., Reference Brooks, Mittermeier, da Fonesca, Gerlach, Hoffman and Lamoreux2006) and its grasslands contain considerable floral endemism, half of the country's endemic mammals, 70% of its globally threatened birds and 30% of its threatened butterflies (O'Connor & Kuyler, Reference O'Connor and Kuyler2009). The grassland biome comprises 72 distinct ecosystem types; these supply numerous ecosystem services, including 63% of national surface water supply (Egoh et al., Reference Egoh, Reyers, Rouget, Bode and Richardson2009). However, the grassland biome also includes rich mineral resources as well as areas ideal for both livestock and cultivation agriculture. South Africa, as with similar rapidly developing countries with emerging global economies, places a strong emphasis on economic growth. For instance, the South African National Development Plan aims to double the gross domestic product and eliminate poverty by 2030 (National Planning Commission, 2012). South Africa's grassland biome typifies the conflict between economic growth and biodiversity conservation.
Only 3.2% of the South African grassland biome is currently protected (Department of Environmental Affairs, 2016). The national protected area expansion strategy identifies new areas for conservation. However, the sum of these areas and existing protected areas still falls short of the 17% Aichi Target, at just 13.2% (Department of Environmental Affairs, 2016). Considering this shortfall, and the continuous development pressure on the grassland biome, biodiversity offsets could be used to reach the 17% Aichi Target. However, the national protected area expansion strategy implies that biodiversity offsets may be used in expanding protected areas as part of the national strategy, rather than in addition to existing commitments. This raises questions regarding whether offsets may be used to shift the costs from government commitments to the private sector (Pilgrim & Bennun, Reference Pilgrim and Bennun2014; Maron et al., Reference Maron, Gordon, Mackey, Possingham and Watson2016a).
Although provinces within South Africa have had their own offset guidelines since 2015, an overarching national policy is being finalized (Brownlie et al., Reference Brownlie, von Hase, Botha, Manuel, Balmforth and Jenner2017). The draft national policy differs from international policies in one notable way: rather than aiming for no net loss of biodiversity, it aims to ensure no net loss of biodiversity beyond ecosystem-specific biodiversity targets (Fig. 1). These biodiversity targets represent ecological thresholds of habitat extent needed to maintain 75% of all species (Desmet & Cowling, Reference Desmet and Cowling2004; Rutherford et al., Reference Rutherford, Mucina and Powrie2012). Biodiversity targets within the grassland biome vary between 23 and 28% across the 72 ecosystem types, and the national protected area expansion strategy based its protected area targets on these thresholds. This ensures that protected area targets represent underlying ecological thresholds (Watson et al., Reference Watson, Darling, Venter, Maron, Walston and Possingham2016), but obfuscates how they link to the uniform 17% Aichi Target. For example, the 17% Aichi Target could be met across the whole biome either by protecting 17% of individual ecosystem types or by scaling protection to cover relatively more area in ecosystems with higher biodiversity targets.
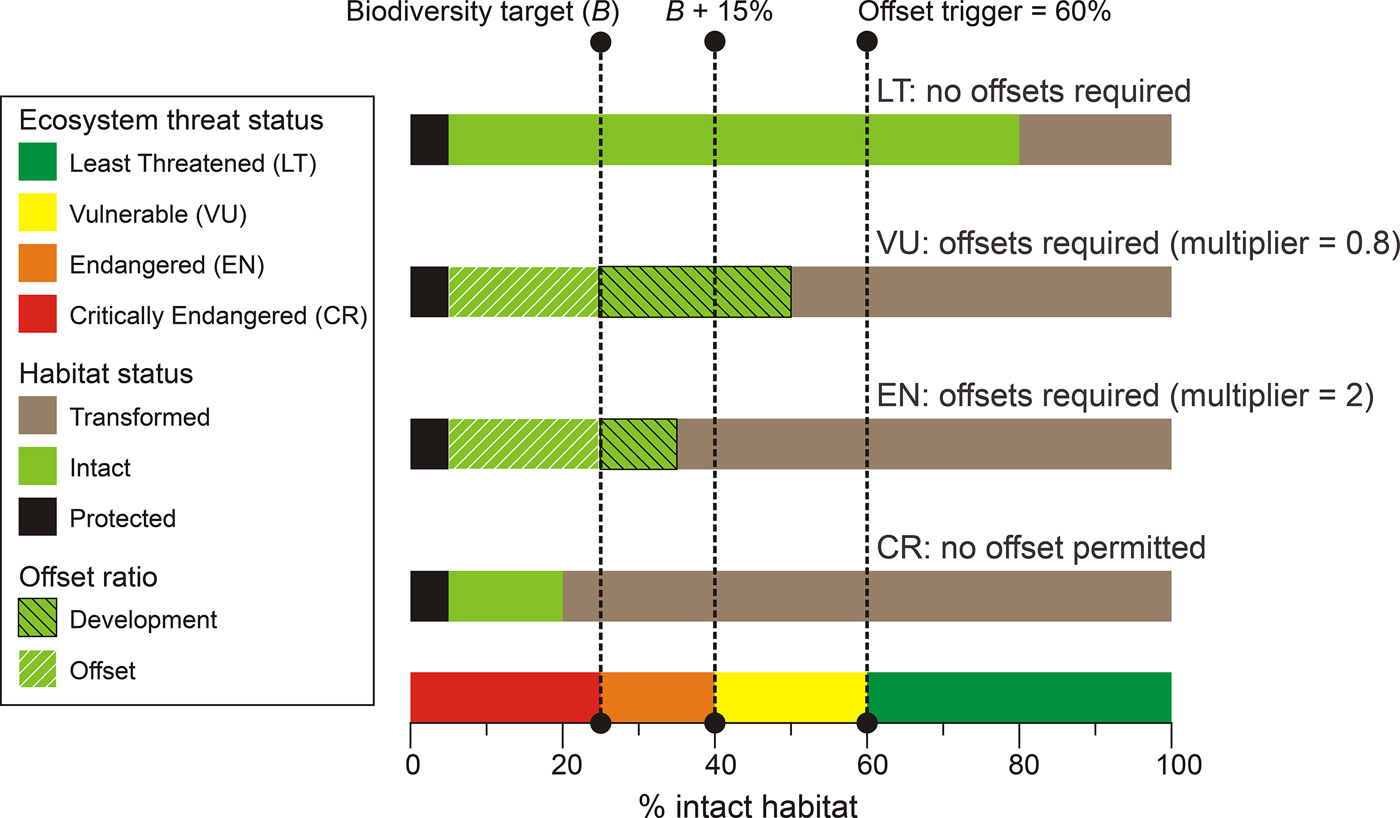
The simplified South African biodiversity offsetting framework used in simulations for a hypothetical ecosystem with a biodiversity target of 25% and current protection levels of 5% for ecosystems categorized as Least Threatened, Vulnerable, Endangered and Critically Endangered.
We examine the consequences of using the approach set out in the draft offsetting policy to expand protected area coverage in South Africa's grassland biome. We simulate four scenarios that facilitate comparison of (1) the effects of scaling protected area targets according to ecologically determined thresholds, and (2) the effects of using offsets either to supplement or supplant the existing protected area expansion strategy (Table 1). Specifically, we examine how much intact habitat would be lost to meet Aichi Target 11. However, as habitat would not be transformed without reason, we also estimate the potential economic gain (the gross value added minus potentially lost ecosystem services) that may arise from habitat transformation. Combined, this provides an overview of the conservation costs and economic benefits of using biodiversity offsets to meet protected area targets.
The four simulated scenarios for the use of offsetting to extend the protected area network in South Africa, with their protected area targets, and how they use biodiversity offsets.
Methods
Offsetting strategy
Biodiversity offsets in South Africa aim to facilitate the preservation and protection of the biodiversity target of each ecosystem type over time (Fig. 1). The aim is, therefore, not to achieve no net loss but rather to add to the national conservation estate (Brownlie & Botha, Reference Brownlie and Botha2009). This form of offsetting differs from related international policies because it is based not only on the residual loss caused by development (to achieve no net loss of biodiversity) but also on the biodiversity threshold of each ecosystem. It differs from conventional averted-loss biodiversity offsets for the same reason: the frame of reference for the offset comprises the fixed biodiversity threshold rather than a counterfactual of background loss. In this regard, South African biodiversity offsets do not meet the strict definition of offsets according to international standards (IUCN, 2014; ten Kate & Crowe, Reference ten Kate and Crowe2014; Bull et al., Reference Bull, Gordon, Watson and Maron2016). A benefit of the South African approach is that basing offsets on biodiversity targets discourages development in ecosystems that may be approaching thresholds of sustainable transformation.
The proposed national offsets framework does not permit biodiversity offsets in ecosystem types where the remaining habitat extent is less than the biodiversity target (i.e. Critically Endangered ecosystems). It is assumed that the conservation concern and risks involved are too high for these ecosystems (e.g. Pilgrim et al., Reference Pilgrim, Brownlie, Ekstrom, Gardner, von Hase and ten Kate2013). In contrast, biodiversity offsets are not required for ecosystems in which the remaining intact habitat exceeds 60% (i.e. Least Threatened ecosystems). Although the first three levels of the mitigation hierarchy (avoid, minimize, remediate) still apply in these instances, it is assumed that the residual loss is justifiable in a developing country such as South Africa. For ecosystems in which the remaining intact habitat is between the biodiversity target and 60%, biodiversity offsets are required from private and public sector developers, to offset the residual loss of habitat by conserving an alternative area within the same ecosystem type according to an area multiplier, m:
 $$m = \left[ {\displaystyle{{I - P} \over {(I - P) - (B - P)}}} \right] - 1$$
where I is the percentage of intact habitat remaining, P is the percentage of habitat currently protected and B is the ecosystem-specific biodiversity target. This means that for every area unit transformed by development, m times that area has to be legally protected within the same ecosystem type.
Although the framework distinguishes between Endangered ecosystems (in which intact habitat exceeds the biodiversity target, but not by more than 15%) and Vulnerable ecosystems (in which intact habitat exceeds the biodiversity target plus 15%), the multiplier is calculated in the same way in both instances (Fig. 1). It should be emphasized that these multipliers are the minimum offsetting ratio, which would be considerably higher in practice to account for uncertainty surrounding the underlying datasets, illegal habitat transformation, and the geographical concentration of key biological features. However, this simplified multiplier was sufficient for our simulations because when taken to its logical conclusion, it ensured that the whole area required as the biodiversity target would be protected once all remaining habitat had been transformed. In reality, however, multipliers will be impractically large in poorly protected and heavily transformed ecosystems, and therefore offsets are unlikely to be feasible in these cases (Supplementary Material S1).
Initializing simulation with empirical data
The biodiversity offsetting framework depended on four datasets. Firstly, the spatial extent of each of the 72 ecosystems in the grassland biome was defined from the 2012 updated version of the Vegetation Map of South Africa (Mucina & Rutherford, Reference Mucina and Rutherford2006), which also included the ecosystem-specific biodiversity targets (as a percentage spatial extent) required to conserve 75% of all species. Secondly, this ecosystem layer was overlaid with the most recent (2014) version of the national land cover map (Geoterraimage, 2015) to estimate how much of each ecosystem has already been transformed by human activity. Thirdly, the current protected area coverage of each ecosystem type was quantified by overlaying each ecosystem type with the extent of national and provincial protected areas (Department of Environmental Affairs, 2016). Fourthly, we included spatial data from the national protected areas expansion strategy (Department of Environmental Affairs, 2016), which identified areas for future protection. All four of these datasets are publicly available from the South African National Biodiversity Institute.
Estimating the economic gain from habitat transformation
Spatial data for the gross value-added factor cost (Naudé et al., Reference Naudé, Badenhorst, Zietsman, Van Huyssteen and Maritz2007) in the grassland biome are available for 6,717 homogeneous socio-economic units known as mesozones (each c. 50 km2). These data, updated in 2011, are the most recent economic data (in South African Rand; ZAR 1 = c. USD 0.07) used by the South African Council for Scientific and Industrial Research. We considered gross value-added factor costs only from three sectors most closely linked to land transformation: (1) agriculture and forestry, (2) mining and quarrying, and (3) electricity, gas and water supply. We combined the gross value-added factor costs from these three sectors and summarized them across each of the 72 ecosystem types by summing the values of all mesozones with centroids within the ecosystem type and then standardizing by the original surface area of the ecosystem, resulting in an economic value per unit area (ZAR per km2).
We then regressed the total gross value-added factor cost of each ecosystem type with the percentage of habitat that is currently transformed (Supplementary Material S2). An asymptotic exponential relationship ( ${y = \alpha + (\beta - \alpha )} e^{ - e^\gamma x} $) best described the current association between economic value and habitat transformation and this was used in subsequent simulations to predict the additional gross value-added factor costs from increased habitat transformation.
Transforming habitat also reduces the supply of ecosystem services, but the relationship between habitat loss and ecosystem services is complex. Although there have been notable advances in quantifying the monetary value of ecosystem services (Costanza et al., Reference Costanza, de Groot, Sutton, van der Ploeg, Anderson and Kubiszewski2014), these methods rely on simplifying assumptions that often ignore the multiple values of ecosystems (Kosoy & Corbera, Reference Kosoy and Corbera2010). Although we were wary of making errors by attempting to quantify the potential monetary value of ecosystem services, the potential loss of ecosystem services as a result of habitat transformation could potentially affect the interpretation of our results. Therefore, we also report rudimentary estimates of the monetary value of ecosystem services in Supplementary Material S3.
Simulation procedures
All simulations and analyses were conducted using R v. 3.1.2 (R Development Core Team, 2014). We simulated four scenarios that differed in how protected area targets were treated and how offsets were used to supplement or supplant the national protected area expansion strategy (Table 1). Protected area targets were either fixed at 17% of all ecosystems (Scenarios 1 and 3) or scaled relative to the biodiversity target so that the mean protection coverage across the whole biome was 17% (Scenarios 2 and 4). Furthermore, new protected areas resulting from the offsetting process could either replace the areas identified for protected area expansion (Scenarios 1 and 2) or they could be in addition to these existing commitments (Scenario 3 and 4).
Across all scenarios intact habitat was transformed in increments of 1%. Once intact habitat decreased below the 60% offset trigger, offset sites were reclassified as protected based on the multiplier ratio, m. In the scenarios in which offsets supplemented existing protected area expansion strategies both existing and planned protected areas were included as the percentage of habitat currently protected (P), whereas only currently existing protected areas were considered when offsets replaced current protected area commitments. This sequential transformation and offsetting continued until the Aichi protected area target for each ecosystem type in the specific scenario was met. At that point we recorded the amount of intact habitat remaining and used this to infer the expected economic values measured as gross value-added factor costs (and the monetary value of ecosystem services; Supplementary Material S3). We compared statistically the percentage of intact habitat and the economic value across the four scenarios, using a repeated-measures ANOVA (lme command in the nlme package) and a paired pairwise t-test with a Bonferroni correction for multiple comparisons (pairwise.t.test command in stats package).
Results
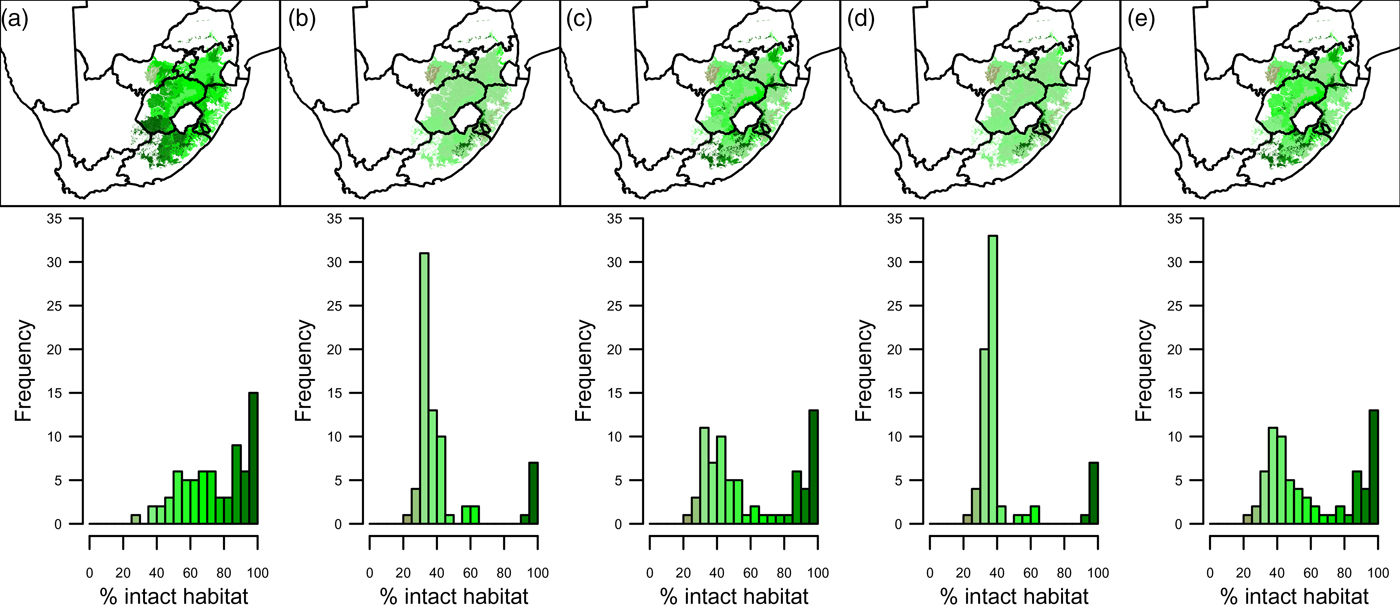
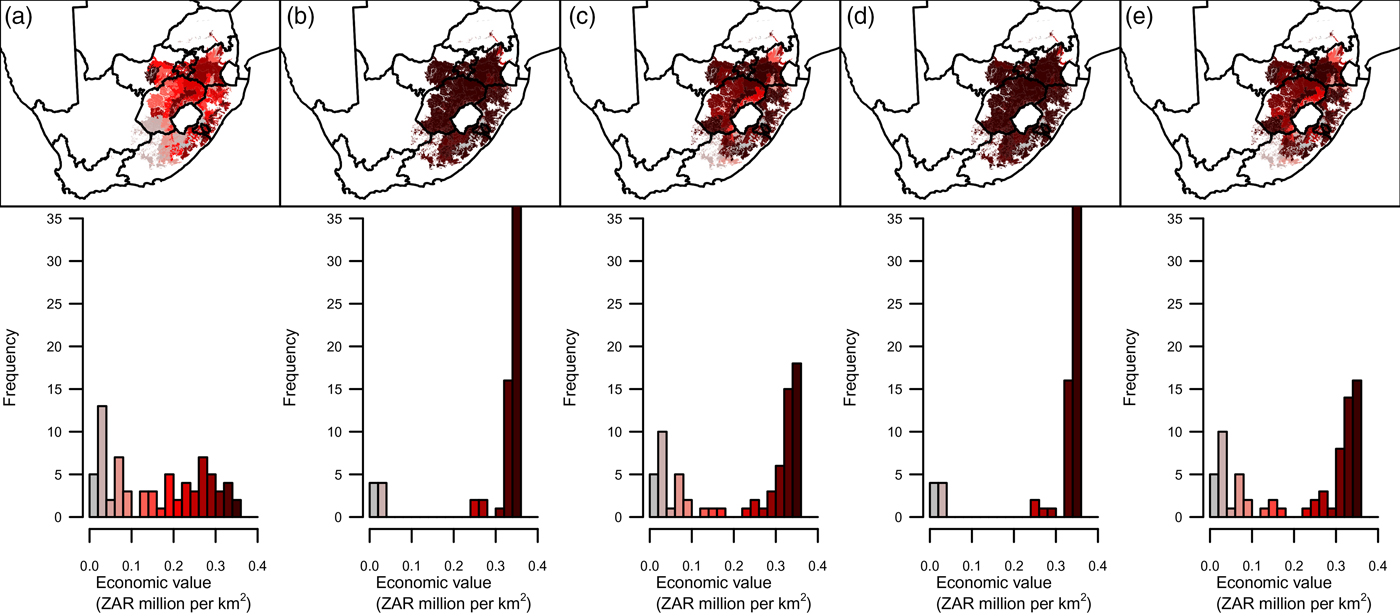
The Aichi protected area targets were met under all simulated scenarios, but this reduced the median percentage of intact habitat from current levels of 76.35% to between 34.93% in Scenario 1 and 50.24% in Scenario 4 (Fig. 2). As the value of ecosystem services was assumed to be associated linearly with the percentage intact habitat for this study, its median monetary value also declined by similar percentages: ZAR 10,000–16,000 per km2 (Supplementary Material S3). By contrast, median gross value-added factor costs would double from current levels: from c. ZAR 158,600 per km2 to ZAR 304,800–343,800 per km2 (Fig. 3). However, there was considerable variation among the 72 ecosystem types, but this variation was less when offsets were used to replace current protected area expansion commitments (Figs 2b,d & 3b,d).
The amount of intact habitat for each of the 72 ecosystem types in the South African grassland biome (a) currently, and simulated for (b) Scenario 1, (c) Scenario 2, (d) Scenario 3 and (e) Scenario 4 (Table 1).
The monetary value of gross value-added factor costs for each of the 72 ecosystem types in the South African grassland biome (a) modelled for the current situation, and simulated for (b) Scenario 1, (c) Scenario 2, (d) Scenario 3 and (e) Scenario 4 (Table 1).
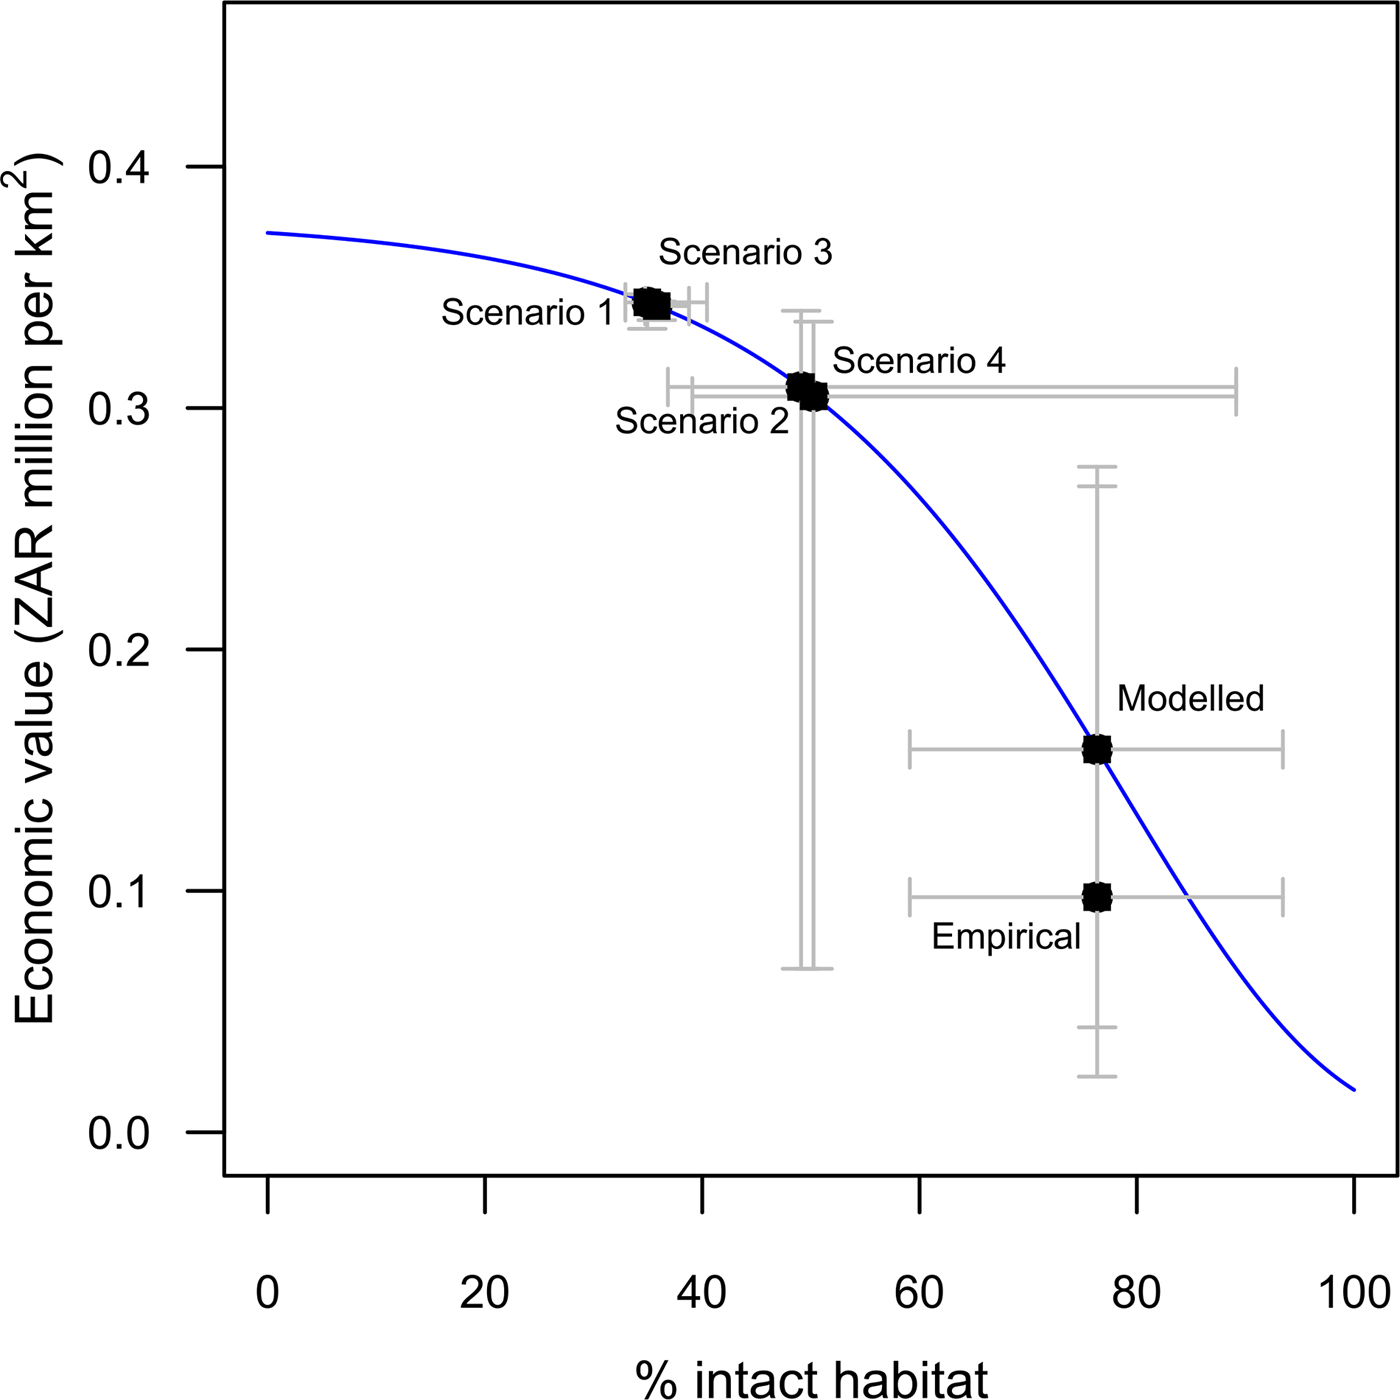
The four simulation scenarios differed significantly in terms of the amount of intact habitat (F 3,213 = 45.23, P < 0.001) as well as economic value (F 3,213 = 32.34, P < 0.001). However, these differences depended on whether offsets were in addition to or instead of existing protected area expansion commitments, rather than the way protected area targets were formulated (Table 2). Because of the asymptotic nature of gross value-added factor costs, the marginal economic gain decreased as more habitat was transformed (Fig. 4). These findings were consistent after incorporating rudimentary estimates of the monetary value of lost ecosystem services (Supplementary Material S3).
The relationship between the median percentage of intact habitat and the modelled total economic value for the current situation (both empirical and modelled) in the 72 ecosystem types in the South African grassland biome, as well as the four simulated scenarios (Table 1). Lines represent the modelled relationship between intact habitat and ecosystem services, gross value-added factor cost and total economic value. Error bars denote the 25th and 75th percentiles.
P-values from the multiple comparison tests between every combination of scenarios for the use of offsetting to extend the protected area network in South Africa (Table 1). Values below the diagonal are for comparisons of intact habitat and those above the diagonal are for total economic value.
* Statistically significant difference at α > 0.05; NS, non-significant differences
Discussion
It would be possible to rely on biodiversity offsets to meet the Aichi protected area target of 17% in South African grasslands by establishing protected areas to compensate for the transformation of intact habitat for development. Such a strategy could potentially double the total economic value of the biome, even considering the potential cost of lost ecosystem services. The cost of these gains would be a 35–50% reduction in the current extent of intact habitat. However, if offsets were used to supplement rather than substitute existing government commitments towards expanding protected areas it would be possible to reduce the loss of intact habitat significantly, with comparatively small reductions in economic gain.
Regardless of the strategy used, however, meeting Aichi Targets will not ensure ecological sustainability. The 17% Aichi Target is considerably less than the biodiversity thresholds of 23–28% (the area needed to maintain 75% of all species) for South African grasslands (Desmet & Cowling, Reference Desmet and Cowling2004; Rutherford et al., Reference Rutherford, Mucina and Powrie2012). Although biodiversity offsets can contribute to expanding protected areas, their implementation should complement existing conservation interventions to ensure the long-term persistence of biodiversity (von Hase & ten Kate, Reference von Hase and ten Kate2017). Examples of these types of interventions include government-driven protected area expansion and sustainable land use outside protected areas, which should not be overlooked in the hubristic promotion of biodiversity offsets (Gordon et al., Reference Gordon, Bull, Wilcox and Maron2015; Rode et al., Reference Rode, Gómez-Baggethun and Krause2015).
Insisting that biodiversity offsets supplement existing protected area expansion, and separating the accounting of protected area gains from offsets from those of existing protected area commitments, would lead to the best conservation outcomes (Maron et al., Reference Maron, Gordon, Mackey, Possingham and Watson2016a). Our findings show that separate accounting systems would not only reduce the loss of habitat considerably, but the economic opportunity costs would also be comparatively small, as the marginal economic benefit of transforming habitat decreases as more intact habitat is lost (Fig. 4). Using biodiversity offsets in conjunction with government-driven protected area expansion in the grassland biome could increase the contribution of the three economic sectors modelled here from c. 1.5% to c. 2.9% of the national gross domestic product (Scenarios 2 and 4). By contrast, using offsets to supplant government spending would increase this percentage of gross domestic product to 3.2% (Scenarios 1 and 3). However, an additional 4.8 million ha of natural habitat, nearly 4% of the total land surface area of South Africa, would need to be transformed for this 0.3% gain in gross domestic product. This is not an effective use of land and therefore implies that the public sector, in addition to adhering to international government commitments, probably plays a vital role in ensuring that biodiversity offsets by the private sector are effective ecologically and economically.
Aichi Target 11, to formally protect 17% of terrestrial area, may be politically and socially acceptable but arguably it falls short of what would be needed to stop the loss of biodiversity (Noss et al., Reference Noss, Dobson, Baldwin, Beier, Davis and Dellasala2012; Butchart et al., Reference Butchart, Clarke, Smith, Sykes, Scharlemann and Harfoot2015). In South African grasslands, minimum biodiversity targets for persistence of ecological patterns are 23–28%; conserving ecological processes would require even larger tracts of intact habitat. Nevertheless, whether 17% is sufficient or not, few countries are on track to meet this target (Watson et al., Reference Watson, Dudley, Segan and Hockings2014). This is especially true in developing countries because of a lack of investment in designating new protected areas and managing existing ones. Although biodiversity offsetting may assist countries like South Africa to expand protected area coverage, it should not wind back what little is currently being invested in conservation (Gordon et al., Reference Gordon, Bull, Wilcox and Maron2015).
Coverage-based targets for protected areas provide clear goals for conservation, but it is equally important that these targets represent the variety of ecosystems (Barr et al., Reference Barr, Pressey, Fuller, Segan, McDonald-Madden and Possingham2011; Watson et al., Reference Watson, Darling, Venter, Maron, Walston and Possingham2016). Our study suggests that sophisticated measures of representation based on ecological thresholds will not lead to vastly different outcomes when applying biodiversity offsetting. South African biodiversity targets are based on data-intensive species–area relationships (Desmet & Cowling, Reference Desmet and Cowling2004; Rutherford et al., Reference Rutherford, Mucina and Powrie2012), which are not available for most other developing countries. Establishing similar scientifically derived biodiversity targets would have benefits for developing countries because they are more defensible and robust than politically determined ones (Dinerstein et al., Reference Dinerstein, Olson, Joshi, Vynne, Burgess and Wikramanayake2017; Wiersma et al., Reference Wiersma, Sleep and Edwards2017). However, our results imply that using a uniform target across various ecosystems, such as those for the IUCN Red List of Ecosystems (IUCN, 2016), would result in offset outcomes similar to those based on scientifically derived targets.
Biodiversity offsets have been accused of legitimizing rather than preventing the destruction of nature (Spash, Reference Spash2015; Apostolopoulou & Adams, Reference Apostolopoulou and Adams2017). This may be true for South African grasslands because solely using biodiversity offsets to meet protected area targets would sacrifice as much as half of the remaining habitat. Arguably this is too large a price to pay, when we ought to be protecting nature. However, developing countries such as South Africa prioritize development for socio-economic reasons, so the likely alternative to offsets is the transformation of intact ecosystems without proper mitigation (Quétier et al., Reference Quétier, Van Teeffelen, Pilgrim, von Hase and ten Kate2015).
Critics point out the danger of biodiversity offsets blurring the lines between conservation and economic development, restricting other forms of conservation action and promoting the view that economic development is inevitable (Apostolopoulou & Adams, Reference Apostolopoulou and Adams2017; Dempsey & Collard, Reference Dempsey and Collard2017). In response, proponents question whether international conservation targets can be met and whether residual impacts will simply accumulate unmitigated in the absence of offsets (von Hase & ten Kate, Reference von Hase and ten Kate2017). Our findings unite these disparate viewpoints to a degree, as we found that offsets alone will result in considerable habitat loss and inefficient economic development. Conversely, offsets can be used in a way that complements existing conservation commitments and helps bridge the financial shortfall needed to adhere to international targets (Kreuger, Reference Kreuger, Joppa, Baille and Robinson2016). Governments, especially in developing countries, need clarity on where biodiversity offsets fit in their broader conservation toolbox.
Although developing countries pursue economic growth aggressively, it is likely that the economic gains shown in this study are overestimates. Our simulations were based on gross value-added factor cost, which did not incorporate transaction and management costs at either the development or the offset site. These hidden costs can be substantial and may ultimately invalidate implementation in reality (Finney, Reference Finney2015). Furthermore, our simulations assumed that the 72 ecosystem types in the grassland biome were homogeneous and that economic gain was a simple function of habitat transformation. In reality, however, the spatial configuration of ecosystems and their transformation determines economic and conservation outcomes (Chaplin-Kramer et al., Reference Chaplin-Kramer, Sharp, Mandle, Sim, Johnson and Butnar2015). In South Africa conservation planning focuses specifically on habitat configuration and connectivity, so our simulations underestimated this important ecological consideration and probably underestimated the non-linear relationship between lost ecosystem services and harm to human well-being. In light of these shortcomings the economic figures presented here should be interpreted only as a benchmark of various offset strategies, not as a comprehensive economic assessment. Nevertheless, even coarse economic estimates can raise awareness of the potential trade-offs of proposed policies (Costanza et al., Reference Costanza, de Groot, Sutton, van der Ploeg, Anderson and Kubiszewski2014).
Using biodiversity offsetting to meet international protected area targets is not without controversy (Githiru et al., Reference Githiru, Wilburn King, Bauche, Simon, Boles, Rindt and Victurine2015; Pilgrim & Bennun, Reference Pilgrim and Bennun2014; Maron et al., Reference Maron, Gordon, Mackey, Possingham and Watson2016a,Reference Maron, Ives, Kujala, Bull, Maseyk and Bekessyb). Yet for many developing countries, offsets may be the only option. We have shown that offsets alone could enable South Africa to meet its protected area targets while simultaneously supporting economic growth, but at a high cost to biodiversity. This assumes that offsets actually mitigate residual impacts in line with the policy, which case studies suggest is not always the case (e.g. Jenner & Balmforth, Reference Jenner and Balmforth2015). Biodiversity offsets should preferably be used to supplement rather than supplant existing conservation commitments. This approach would lead to the best outcomes for both conservation and economic development. Understanding the likely trade-offs and their acceptability to society depends on governments being explicit about the intended mechanisms for meeting protected area commitments, with specific clarity on the role of biodiversity offsets.
Acknowledgements
SB and JM assisted in formulating the proposed National Policy on biodiversity offsets, but this did not influence their interpretation of this study. JM's interpretation of this simulation exercise was not influenced by the South African National Biodiversity Institute (SANBI)’s policy position, nor does this study reflect SANBI's policy position. We thank M. Burgman, S. Esterhuyse, M. Fisher, E.J. Milner-Gulland and two anonymous referees for their feedback.
Author contributions
FTB designed the simulation, with input from JM regarding the protected area expansion strategy and from SB regarding ecosystem services. FTB lead the writing, with considerable input from all authors.
Biographical sketches
Falko Buschke is a macroecologist interested in the way spatial patterns of biodiversity influence conservation and management. Susie Brownlie is an environmental consultant working on integrating biodiversity into the environmental decision-making process. Jeff Manuel is a policy analyst focused on mobilizing and integrating biodiversity information into environmental planning and policy development.


