


1. Introduction
When an air bubble rises to the water surface due to buoyancy, the cap film covering the bubble breaks up. The following collapse of the bubble cavity produces capillary waves that converge at the cavity base. This creates a Worthington jet whose tip emits tiny droplets (Duchemin et al. Reference Duchemin, Popinet, Josserand and Zaleski2002; Ghabache & Seon Reference Ghabache and Seon2016; Gañán-Calvo Reference Gañán-Calvo2017; Brasz et al. Reference Brasz, Bartlett, Walls, Flynn, Yu and Bird2018; Deike et al. Reference Deike, Ghabache, Liger-Belair, Das, S.Zaleski, Popinet and Seon2018; Gordillo & Rodriguez-Rodriguez Reference Gordillo and Rodriguez-Rodriguez2019; Gañán-Calvo & López-Herrera Reference Gañán-Calvo and López-Herrera2021). The jet drops formed by the bursting of tiny bubbles on the ocean surface are widely accepted as a major source of aerosols approximately 0.1 $\unicode{x03BC}$
m in size (Veron Reference Veron2015; Wang et al. Reference Wang2017; Deike Reference Deike2022). These aerosols act as cloud condensation nuclei in atmospheric regions where water vapour concentration reaches supersaturation (Cochran et al. Reference Cochran, Ryder, Grassian and Prather2017; Meskhidze et al. Reference Meskhidze, Salter, Sellegri and Elliott2019). The jet drops also transport chemicals (toxins/microplastics) (Wang et al. Reference Wang2017; Shaw et al. Reference Shaw, Li, Nunes and Deike2023) and biological substances (bacteria/viruses) (Bourouiba Reference Bourouiba2021) into the atmosphere, which has obvious consequences for public health.
$\unicode{x03BC}$
m in size (Veron Reference Veron2015; Wang et al. Reference Wang2017; Deike Reference Deike2022). These aerosols act as cloud condensation nuclei in atmospheric regions where water vapour concentration reaches supersaturation (Cochran et al. Reference Cochran, Ryder, Grassian and Prather2017; Meskhidze et al. Reference Meskhidze, Salter, Sellegri and Elliott2019). The jet drops also transport chemicals (toxins/microplastics) (Wang et al. Reference Wang2017; Shaw et al. Reference Shaw, Li, Nunes and Deike2023) and biological substances (bacteria/viruses) (Bourouiba Reference Bourouiba2021) into the atmosphere, which has obvious consequences for public health.
The small size and large vertical velocity of the jet droplets are critical to the phenomena described previously. The parameter conditions leading to the minimum size and maximum velocity correspond to ${Bo}=0$
and
${Bo}=0$
and ${La}={La}^*\simeq 1110$
, where
${La}={La}^*\simeq 1110$
, where ${Bo}=\rho g R_b^2/\sigma$
is the Bond number,
${Bo}=\rho g R_b^2/\sigma$
is the Bond number, ${La}=\rho R_b \sigma /\mu ^2$
is the Laplace number,
${La}=\rho R_b \sigma /\mu ^2$
is the Laplace number, $\rho$
,
$\rho$
, $\mu$
and
$\mu$
and $\sigma$
are the liquid density, viscosity and surface tension,
$\sigma$
are the liquid density, viscosity and surface tension, $R_b=[3V/(4\pi )]^{1/3}$
and
$R_b=[3V/(4\pi )]^{1/3}$
and $V$
are the bubble radius and volume, and
$V$
are the bubble radius and volume, and $g$
is the gravity. The existence of an optimum value of the Laplace number, La
$g$
is the gravity. The existence of an optimum value of the Laplace number, La $^*$
, has been attributed to an energy-focusing effect (Deike et al. Reference Deike, Ghabache, Liger-Belair, Das, S.Zaleski, Popinet and Seon2018) during the bubble collapse: the mechanical energy per unit volume focused on the ejected ligament is maximised for that optimum value of the Laplace number (Gañán-Calvo & López-Herrera Reference Gañán-Calvo and López-Herrera2021).
$^*$
, has been attributed to an energy-focusing effect (Deike et al. Reference Deike, Ghabache, Liger-Belair, Das, S.Zaleski, Popinet and Seon2018) during the bubble collapse: the mechanical energy per unit volume focused on the ejected ligament is maximised for that optimum value of the Laplace number (Gañán-Calvo & López-Herrera Reference Gañán-Calvo and López-Herrera2021).
Bubble bursting in a clean liquid (Duchemin et al. Reference Duchemin, Popinet, Josserand and Zaleski2002; Ghabache & Seon Reference Ghabache and Seon2016; Gañán-Calvo Reference Gañán-Calvo2017; Brasz et al. Reference Brasz, Bartlett, Walls, Flynn, Yu and Bird2018; Deike et al. Reference Deike, Ghabache, Liger-Belair, Das, S.Zaleski, Popinet and Seon2018; Gordillo & Rodriguez-Rodriguez Reference Gordillo and Rodriguez-Rodriguez2019; Gañán-Calvo & López-Herrera Reference Gañán-Calvo and López-Herrera2021) is an idealisation of the more complex phenomenon taking place in real fluids, such as seawater. Contaminants in the marine boundary layer, both natural and anthropogenic, significantly affect the bubble-bursting process and, consequently, the emission of jet droplets (Hardy Reference Hardy1982; Masry et al. Reference Masry, Rossignol, Roussel, Bourgogne, Bussière, R’mili and Wong-Wah-Chung2021). Surfactants (Baryiames, Garrett & Baiz Reference Baryiames, Garrett and Baiz2021; Neel & Deike Reference Neel and Deike2021; Neel, Erinin & Deike Reference Neel, Erinin and Deike2021; Constante-Amores et al. Reference Constante-Amores, Kahouadji, Batchvarov, Shin, Chergui, Juric and Matar2021; Pierre, Poujol & Seon Reference Pierre, Poujol and Seon2022; Ji et al. Reference Ji, Yang, Wang, Ewoldt and Feng2023; Vega & Montanero Reference Vega and Montanero2024; Yang et al. Reference Yang, Barbhai, Ji and Feng2024), polymeric molecules (Sanjay, Lohse & Jalaal Reference Sanjay, Lohse and Jalaal2021; Tammaro et al. Reference Tammaro, Suja, Kannan, Gala, Maio, Fuller and Maffettone2021; Ji et al. Reference Ji, Yang, Wang, Ewoldt and Feng2023; Rodríguez-Díaz et al. Reference Rodríguez-Díaz, Rubio, Montanero, Gañán-Calvo and Cabezas2023; Yang et al. Reference Yang, Barbhai, Ji and Feng2024; Balasubramanian et al. Reference Balasubramanian, Sanjay, Jalaal, Vinuesa and Tammisola2024; Dixit et al. Reference Dixit, Oratis, Zinelis, Lohse and Sanjay2025; Cabalgante-Corrales et al. Reference Cabalgante-Corrales, Muñoz-Sánchez, López-Herrera, Cabezas, Vega and Montanero2025; Barbhai, Yang & Feng Reference Barbhai, Yang and Feng2025), oils (Ji, Yang & Feng Reference Ji, Yang and Feng2021; Yang et al. Reference Yang, Ji, Ault and Feng2023a , Reference Yang, Ji and Feng b , Reference Yang, Liu and Feng2025) and particles of different nature (Ji, Singh & Feng Reference Ji, Singh and Feng2022; Dubitsky, McRae & Bird Reference Dubitsky, McRae and Bird2023) have proved to substantially affect bubble bursting.
Previous experiments of bubble bursting with surfactants have shown the noticeable effect of these substances on the size and velocity of the ejected droplet (Pierre et al. Reference Pierre, Poujol and Seon2022; Vega & Montanero Reference Vega and Montanero2024; Yang et al. Reference Yang, Barbhai, Ji and Feng2024). Those experiments were conducted within a parameter region far from the critical conditions ${Bo}=0$
and
${Bo}=0$
and ${La}={La}^*$
. Under these conditions, strong surface convection of surfactant at the interface and rapid compression of the bubble bottom may significantly increase surfactant concentration in that critical region, thereby enhancing surfactant effects (figure 1).
${La}={La}^*$
. Under these conditions, strong surface convection of surfactant at the interface and rapid compression of the bubble bottom may significantly increase surfactant concentration in that critical region, thereby enhancing surfactant effects (figure 1).
Bubble bursting in the presence of surfactant. Surface convection of surfactant at the interface and rapid compression of the bubble bottom are expected to increase surfactant concentration in that region significantly. A surfactant-loaded jet is emitted from the cavity bottom. The red arrows indicate the direction of the Marangoni stress.

In this work, we conduct experiments for ${Bo}\simeq 0$
and
${Bo}\simeq 0$
and ${La}\simeq {La}^*$
with both moderately strong and weak surfactants. The latter simulates the unavoidable presence of surface-active contaminants in water. Our experiments demonstrate that even trace amounts of surfactant substantially increase droplet radius and the total volume of liquid ejected while reducing droplet velocity. The volume of the first emitted droplet increases by a factor of 20 at surfactant concentrations that cause only negligible changes in bubble surface tension. The local reduction in surface tension narrows the region of free-surface reversal. Despite this narrowing, droplet size increases because Marangoni stresses broaden the liquid jet and slow its interface, delaying droplet pinch-off. Notably, a significant increase in droplet size is observed even for weak surfactants, indicating that natural water contamination can strongly influence bubble bursting under critical conditions. These findings may help explain the particle sizes produced by bubble bursting in seawater.
${La}\simeq {La}^*$
with both moderately strong and weak surfactants. The latter simulates the unavoidable presence of surface-active contaminants in water. Our experiments demonstrate that even trace amounts of surfactant substantially increase droplet radius and the total volume of liquid ejected while reducing droplet velocity. The volume of the first emitted droplet increases by a factor of 20 at surfactant concentrations that cause only negligible changes in bubble surface tension. The local reduction in surface tension narrows the region of free-surface reversal. Despite this narrowing, droplet size increases because Marangoni stresses broaden the liquid jet and slow its interface, delaying droplet pinch-off. Notably, a significant increase in droplet size is observed even for weak surfactants, indicating that natural water contamination can strongly influence bubble bursting under critical conditions. These findings may help explain the particle sizes produced by bubble bursting in seawater.
This paper is organised as follows. The experimental method is described in § 2. We formulate the problem in § 3 and describe the variables involved. The results are presented and discussed in § 4. The paper closes with some concluding remarks in § 5.
Experimental set-up: tank filled with the working liquid (A), needle (B), camera (C), optical lenses (D), triaxial translation stage (E), optical fibre (F), frosted diffuser (G) and pneumatic anti-vibration isolation system (H). The second camera is not shown in the sketch.

2. Experimental method
2.1. Experimental set-up
A parallelepipedal glass tank of 40 $\times$
40
$\times$
40 $\times$
40 mm was filled with the working liquid (figure 2). A needle was inserted into an orifice in the centre of the tank bottom. We used needles with inner diameters in the range of
$\times$
40 mm was filled with the working liquid (figure 2). A needle was inserted into an orifice in the centre of the tank bottom. We used needles with inner diameters in the range of $10{-}40$ $\unicode{x03BC}$
m. The needle tips were fabricated using IP-S resin in Nanoscribe Photonic Professional GT2 with the dip-in laser lithography (DiLL) configuration. We used a syringe pump to inject nitrogen through the needle.
$\unicode{x03BC}$
m. The needle tips were fabricated using IP-S resin in Nanoscribe Photonic Professional GT2 with the dip-in laser lithography (DiLL) configuration. We used a syringe pump to inject nitrogen through the needle.
Two high-speed video cameras (FASTCAM SA5 and FASTCAM Mini UX50, Photron) were used to capture bubble bursting. The image acquisition system was adapted to the three events analysed in this work: cavity collapse, free-surface reversal and first droplet ejection. Images of the cavity collapse were recorded at 12 800 fps with an exposure time of 3.9 $\unicode{x03BC}$
s. The images consisted of 640
$\unicode{x03BC}$
s. The images consisted of 640 $\times$
192 pixels. The optical lenses provided a magnification of 5.33
$\times$
192 pixels. The optical lenses provided a magnification of 5.33 $\unicode{x03BC}$
m pixel−1. The images of the free surface reversal were acquired at 420 000 fps with an exposure time of 0.37
$\unicode{x03BC}$
m pixel−1. The images of the free surface reversal were acquired at 420 000 fps with an exposure time of 0.37 $\unicode{x03BC}$
s. These images comprised 128
$\unicode{x03BC}$
s. These images comprised 128 $\times$
64 pixels with a magnification of 2.69
$\times$
64 pixels with a magnification of 2.69 $\unicode{x03BC}$
m pixel−1. Finally, the first droplet ejection was visualised at 50 000 fps with an exposure time of 0.37
$\unicode{x03BC}$
m pixel−1. Finally, the first droplet ejection was visualised at 50 000 fps with an exposure time of 0.37 $\unicode{x03BC}$
s. The images consisted of 192
$\unicode{x03BC}$
s. The images consisted of 192 $\times$
592 pixels, while the magnification was 1.94
$\times$
592 pixels, while the magnification was 1.94 $\unicode{x03BC}$
m pixel−1.
$\unicode{x03BC}$
m pixel−1.
The cameras could be displaced horizontally and vertically using two triaxial translation stages to focus the bubble. The bubble was illuminated from the back by cool white light from two optical fibres. All these elements were mounted on an optical table equipped with a pneumatic anti-vibration isolation system to dampen vibrations from the building. Figure 2 shows the experimental set-up (only one of the cameras is sketched).
2.2. Liquids and surfactants
Experiments involving critical bursting with water are challenging because of the tiny spatial and temporal scales characterising the phenomenon (bubbles must be approximately 20 $\unicode{x03BC}$
m in radius and emit droplets 400 nm in radius at speeds larger than 115 m s−1). Instead, we work with dimethyl sulfoxide (DMSO)/water mixtures and bubble radii in the interval
$\unicode{x03BC}$
m in radius and emit droplets 400 nm in radius at speeds larger than 115 m s−1). Instead, we work with dimethyl sulfoxide (DMSO)/water mixtures and bubble radii in the interval $180{-}650$ $\unicode{x03BC}$
m to produce bubble bursting with
$\unicode{x03BC}$
m to produce bubble bursting with ${Bo}\lesssim 0.1$
and a range of La including
${Bo}\lesssim 0.1$
and a range of La including ${La}^*$
. It is worth noting that our experiments with glycerol/water mixtures (commonly used in this type of experiment) were not sufficiently reproducible and yielded larger jet droplets (see figure S1 in the supplemental materials available at https://doi.org/10.1017/jfm.2026.11412).
${La}^*$
. It is worth noting that our experiments with glycerol/water mixtures (commonly used in this type of experiment) were not sufficiently reproducible and yielded larger jet droplets (see figure S1 in the supplemental materials available at https://doi.org/10.1017/jfm.2026.11412).
We dissolved either sodium dodecyl sulphate (SDS) or Tween 80 in a mixture of ultrapure water and DMSO (50/50 wt). Ultrapure water, with a conductivity of approximately 3.5 $\unicode{x03BC}$
S cm−1, was provided by a water purification machine (Direct-Q®3). We measured the mass of the surfactant with a precision weight balance scale (Shimadzu AUE120 D). The error in
$\unicode{x03BC}$
S cm−1, was provided by a water purification machine (Direct-Q®3). We measured the mass of the surfactant with a precision weight balance scale (Shimadzu AUE120 D). The error in $c$
associated with this measurement was of the order of
$c$
associated with this measurement was of the order of $10^{-6} c_{\textit{cmc}}$
(where
$10^{-6} c_{\textit{cmc}}$
(where $c_{\textit{cmc}}$
is the critical micelle concentration). We dissolved the surfactant powder in water using a magnetic stirrer for 1 h. All the working solutions were used immediately after production to minimise the effects of surfactant ageing and ambient impurities. This considerably increased the reproducibility of the results. The gas bubble was formed by injecting nitrogen (99.998 %, Carburos Metálicos SL) to avoid atmospheric impurities.
$c_{\textit{cmc}}$
is the critical micelle concentration). We dissolved the surfactant powder in water using a magnetic stirrer for 1 h. All the working solutions were used immediately after production to minimise the effects of surfactant ageing and ambient impurities. This considerably increased the reproducibility of the results. The gas bubble was formed by injecting nitrogen (99.998 %, Carburos Metálicos SL) to avoid atmospheric impurities.
The viscosity was measured using a Canon-Fenske capillary viscometer at the temperature $T=22 \pm 1\,^{\circ}\textrm{C}$
. We measured the surface tension
$T=22 \pm 1\,^{\circ}\textrm{C}$
. We measured the surface tension $\sigma$
with the TIFA (theoretical image fitting analysis) method (Cabezas et al. Reference Cabezas, Bateni, Montanero and Neumann2004). Table 1 shows the properties of the DMSO/water mixtures used in the surfactant-free experiments. Figure 3(a) shows the surface tension for DMSO/water mixtures (50/50 wt) depending on the surfactant concentration
$\sigma$
with the TIFA (theoretical image fitting analysis) method (Cabezas et al. Reference Cabezas, Bateni, Montanero and Neumann2004). Table 1 shows the properties of the DMSO/water mixtures used in the surfactant-free experiments. Figure 3(a) shows the surface tension for DMSO/water mixtures (50/50 wt) depending on the surfactant concentration $c$
. In the Tween 80 case,
$c$
. In the Tween 80 case, $\sigma (c)$
could be fitted by the Langmuir equation of state
$\sigma (c)$
could be fitted by the Langmuir equation of state $\sigma _c-\sigma =R_g T \varGamma _{\infty } \log (1+\widehat {\beta }\, c)$
, where
$\sigma _c-\sigma =R_g T \varGamma _{\infty } \log (1+\widehat {\beta }\, c)$
, where $\sigma _c=52.0$
mN m−1 is the surface tension without surfactant,
$\sigma _c=52.0$
mN m−1 is the surface tension without surfactant, $\widehat {\varGamma }_{\infty }=1.62$ $\unicode{x03BC}$
mol m
$\unicode{x03BC}$
mol m $^{-2}$
and
$^{-2}$
and $\widehat {\beta }=52$
m
$\widehat {\beta }=52$
m $^3$
mol−1 (figure 3
a). This fitting allows us to estimate
$^3$
mol−1 (figure 3
a). This fitting allows us to estimate $\varGamma (c)$
from the Langmuir isotherm
$\varGamma (c)$
from the Langmuir isotherm $\widehat {\varGamma }/\widehat {\varGamma }_{\infty }=\widehat {\beta }\, c/(1+\widehat {\beta }\, c)$
(figure 3
b). The Marangoni number
$\widehat {\varGamma }/\widehat {\varGamma }_{\infty }=\widehat {\beta }\, c/(1+\widehat {\beta }\, c)$
(figure 3
b). The Marangoni number ${Ma}=\widehat {\varGamma }_{\infty }R_g T/\sigma _c$
corresponding to
${Ma}=\widehat {\varGamma }_{\infty }R_g T/\sigma _c$
corresponding to $\widehat {\varGamma }_{\infty }$
= 1.62
$\widehat {\varGamma }_{\infty }$
= 1.62 $\unicode{x03BC}$
mol m
$\unicode{x03BC}$
mol m $^{-2}$
is
$^{-2}$
is $\textit{Ma}=0.076$
. The surface tension values for SDS in DMSO/water do not follow the Langmuir equation of state due to its ionic character (Lunkenheimer, Prescher & Geggel Reference Lunkenheimer, Prescher and Geggel2022).
$\textit{Ma}=0.076$
. The surface tension values for SDS in DMSO/water do not follow the Langmuir equation of state due to its ionic character (Lunkenheimer, Prescher & Geggel Reference Lunkenheimer, Prescher and Geggel2022).
Properties of the DMSO/water mixtures used for surfactant-free experiments. The table also shows the ranges of the bubble radius and the corresponding intervals of the Bond and Laplace numbers.

(a) Surface tension $\sigma$
as a function of the surfactant concentration
$\sigma$
as a function of the surfactant concentration $c/c_{\textit{cmc}}$
for DMSO/water mixtures (50/50 wt). The arrows indicate the surfactant concentrations considered in this study. The solid line is a fit to the experimental data using the Langmuir equation of state for Tween 80. (b) Normalised surface tension
$c/c_{\textit{cmc}}$
for DMSO/water mixtures (50/50 wt). The arrows indicate the surfactant concentrations considered in this study. The solid line is a fit to the experimental data using the Langmuir equation of state for Tween 80. (b) Normalised surface tension $\sigma /\sigma _c$
as a function of the surfactant coverage
$\sigma /\sigma _c$
as a function of the surfactant coverage $\varGamma$
calculated from the fit for Tween 80. The horizontal arrows indicate the estimated increase in the surface coverage during the bubble bursting, as explained in the text.
$\varGamma$
calculated from the fit for Tween 80. The horizontal arrows indicate the estimated increase in the surface coverage during the bubble bursting, as explained in the text.

2.3. Experimental procedure
In our experiments, a needle was located at the bottom of a tank filled with the working liquid. The bubble detached from the needle, rose to the free surface of the tank and then burst. The total bubble lifetime was of the order of some seconds. We may assume that the surfactant surface density before film rupture was similar to its equilibrium value. In fact, the bubble lifetime varied significantly across the experiments. This variation did not significantly affect the results, which suggests that equilibrium was reached before the bubble bursts. The bubble bursting was recorded with a high-speed video camera. Experiments were repeated five times to ensure their reproducibility.
The width $w$
and velocity
$w$
and velocity $V_B$
of the cavity bottom, and the droplet radius
$V_B$
of the cavity bottom, and the droplet radius $R_d$
and velocity
$R_d$
and velocity $V_d$
were calculated by detecting the free surface in the image with pixel resolution. The velocity
$V_d$
were calculated by detecting the free surface in the image with pixel resolution. The velocity $V_B$
is calculated from the vertical displacement of the lower position of the cavity and, therefore, does not match the jet velocity after reversal. The free surface curvature
$V_B$
is calculated from the vertical displacement of the lower position of the cavity and, therefore, does not match the jet velocity after reversal. The free surface curvature $\kappa _1$
and
$\kappa _1$
and $\kappa _2$
along the principal directions were calculated by determining the free surface location at the subpixel level (Montanero Reference Montanero2024) and smoothing the resulting contour using a variant of the Savitzky–Golay filter. This filter replaces each contour point with that obtained by fitting a cubic function to the
$\kappa _2$
along the principal directions were calculated by determining the free surface location at the subpixel level (Montanero Reference Montanero2024) and smoothing the resulting contour using a variant of the Savitzky–Golay filter. This filter replaces each contour point with that obtained by fitting a cubic function to the $2N+1$
points around the free surface point. We considered
$2N+1$
points around the free surface point. We considered $N=4$
, 6 and 8, and verified that our conclusions are not affected by
$N=4$
, 6 and 8, and verified that our conclusions are not affected by $N$
.
$N$
.
To validate our experimental procedure, we performed experiments with a clean interface. Figure 4 shows the radius $R_d$
and velocity
$R_d$
and velocity $V_d$
of the first-emitted droplet as a function of the Laplace number for DMSO/water mixtures in the absence of surfactant. Our results are in excellent agreement with previous numerical simulations (Brasz et al. Reference Brasz, Bartlett, Walls, Flynn, Yu and Bird2018; Berny et al. Reference Berny, Deike, Seon and Popinet2020). A sharp minimum in
$V_d$
of the first-emitted droplet as a function of the Laplace number for DMSO/water mixtures in the absence of surfactant. Our results are in excellent agreement with previous numerical simulations (Brasz et al. Reference Brasz, Bartlett, Walls, Flynn, Yu and Bird2018; Berny et al. Reference Berny, Deike, Seon and Popinet2020). A sharp minimum in $R_d/R_b$
was found for
$R_d/R_b$
was found for ${La}\simeq 1100$
. The minimum value of the first-emitted droplet radius corresponds to
${La}\simeq 1100$
. The minimum value of the first-emitted droplet radius corresponds to $R_d/R_b\simeq 0.023$
, similar to those found in previous carefully conducted experiments (Brasz et al. Reference Brasz, Bartlett, Walls, Flynn, Yu and Bird2018). This result agrees with the prediction
$R_d/R_b\simeq 0.023$
, similar to those found in previous carefully conducted experiments (Brasz et al. Reference Brasz, Bartlett, Walls, Flynn, Yu and Bird2018). This result agrees with the prediction $R_d/R_b\simeq 0.0239$
for
$R_d/R_b\simeq 0.0239$
for ${La}=1275$
obtained from the scaling law derived by Gañán-Calvo & López-Herrera (Reference Gañán-Calvo and López-Herrera2021). In some experiments, the size of droplets subsequently emitted was even smaller than that value (see figure S2). As mentioned previously, critical bubble bursting in water occurs with bubbles approximately 20
${La}=1275$
obtained from the scaling law derived by Gañán-Calvo & López-Herrera (Reference Gañán-Calvo and López-Herrera2021). In some experiments, the size of droplets subsequently emitted was even smaller than that value (see figure S2). As mentioned previously, critical bubble bursting in water occurs with bubbles approximately 20 $\unicode{x03BC}$
m in radius. This means that bubble bursting in water can produce droplets with radii well below 500 nm.
$\unicode{x03BC}$
m in radius. This means that bubble bursting in water can produce droplets with radii well below 500 nm.
(a) Radius $R_d$
and (b) velocity
$R_d$
and (b) velocity $V_d$
of the first emitted droplet as a function of the Laplace number for surfactant-free experiments. The droplet radius and velocity are measured in terms of the viscous-capillary length
$V_d$
of the first emitted droplet as a function of the Laplace number for surfactant-free experiments. The droplet radius and velocity are measured in terms of the viscous-capillary length $L_{\mu }=\mu ^2/(\rho \sigma )$
and velocity
$L_{\mu }=\mu ^2/(\rho \sigma )$
and velocity $V_{\mu }=\sigma /\mu$
. The triangles are our experimental data for
$V_{\mu }=\sigma /\mu$
. The triangles are our experimental data for ${Bo}=0.007{-}0.018$
. The squares, circles and diamonds are the results of Brasz et al. (Reference Brasz, Bartlett, Walls, Flynn, Yu and Bird2018), Berny et al. (Reference Berny, Deike, Seon and Popinet2020) and Deike et al. (Reference Deike, Ghabache, Liger-Belair, Das, S.Zaleski, Popinet and Seon2018), respectively.
${Bo}=0.007{-}0.018$
. The squares, circles and diamonds are the results of Brasz et al. (Reference Brasz, Bartlett, Walls, Flynn, Yu and Bird2018), Berny et al. (Reference Berny, Deike, Seon and Popinet2020) and Deike et al. (Reference Deike, Ghabache, Liger-Belair, Das, S.Zaleski, Popinet and Seon2018), respectively.

3. Formulation of the problem
Suppose we neglect the gas’s effect on both cavity collapse and jet emission. In that case, the bubble bursting in the absence of surfactant is characterised by the Bond and Laplace numbers defined in § 1.
In our experiments, the bubble lifetime was of the order of some seconds, a time sufficiently long for the monolayer to be essentially at equilibrium before the bubble bursts. It should be noticed that the adsorption of Tween 80 and SDS is assumed to be controlled by diffusion. However, during bubble rising through the liquid bath, convection cooperates to transport surfactant molecules towards the interface, exceeding diffusion (Fernández-Martínez et al. Reference Fernández-Martínez, Cabezas, López-Herrera, Herrada and Montanero2025). This implies that the adsorption rate of surfactant molecules in our experiment is much faster than in dynamic surface tensiometers, such as the maximum bubble-pressure tensiometer. We conclude that the surface density $\widehat {\varGamma }$
of both the bath and bubble surfaces takes approximately the equilibrium value
$\widehat {\varGamma }$
of both the bath and bubble surfaces takes approximately the equilibrium value $\widehat {\varGamma }_{ {eq}}$
before the bubble bursts. This is consistent with the fact that the significant variation of the total bubble lifetime across experiments did not affect the results, suggesting that either equilibrium was reached before the bubble burst or, at least, that deviations from equilibrium did not play a relevant role.
$\widehat {\varGamma }_{ {eq}}$
before the bubble bursts. This is consistent with the fact that the significant variation of the total bubble lifetime across experiments did not affect the results, suggesting that either equilibrium was reached before the bubble burst or, at least, that deviations from equilibrium did not play a relevant role.
The bubble bursting begins when the liquid film between the bubble and the bath surface drains and breaks up (figure 1). The entire process leading to the formation of the jet droplets takes a time of the order of the inertio-capillary time $t_0=(\rho R_b^3/\sigma _c)^{1/2}\sim 1$
ms, which is much shorter than the characteristic adsorption and desorption times (Roche et al. Reference Roche, Aytouna, Bonn and Kellay2009; Mayer & Krechetnikov Reference Mayer and Krechetnikov2012; Kamat et al. Reference Kamat, Wagoner, Castrejón-Pita, Castrejón-Pita, Anthony and Basaran2020). This implies that the surfactant adsorbed onto the interface at the initial instant remains in the monolayer during the bubble bursting. In this sense, the surfactant can be regarded as insoluble even though it is present as a solute in the liquid phase.
$t_0=(\rho R_b^3/\sigma _c)^{1/2}\sim 1$
ms, which is much shorter than the characteristic adsorption and desorption times (Roche et al. Reference Roche, Aytouna, Bonn and Kellay2009; Mayer & Krechetnikov Reference Mayer and Krechetnikov2012; Kamat et al. Reference Kamat, Wagoner, Castrejón-Pita, Castrejón-Pita, Anthony and Basaran2020). This implies that the surfactant adsorbed onto the interface at the initial instant remains in the monolayer during the bubble bursting. In this sense, the surfactant can be regarded as insoluble even though it is present as a solute in the liquid phase.
The surface diffusion time $t_D=R_b^2/D_s$
(
$t_D=R_b^2/D_s$
( $D_s$
is the surface diffusion coefficient) is much larger than the characteristic time of the process. Specifically,
$D_s$
is the surface diffusion coefficient) is much larger than the characteristic time of the process. Specifically, $t_D$
is of the order of tens of seconds for
$t_D$
is of the order of tens of seconds for $R_b\sim 0.2$
mm and
$R_b\sim 0.2$
mm and $10^{-9}\lesssim D_s\lesssim 10^{-8}$
m
$10^{-9}\lesssim D_s\lesssim 10^{-8}$
m $^2$
s−1, while bubble bursting occurs at times of the order of the inertio-capillary time
$^2$
s−1, while bubble bursting occurs at times of the order of the inertio-capillary time $t_0\sim 1$
ms (figure 5
a), as already mentioned. Therefore, surfactant diffusion over the interface can be ignored. This conclusion is also obtained from the large value of the surface Pèclet number
$t_0\sim 1$
ms (figure 5
a), as already mentioned. Therefore, surfactant diffusion over the interface can be ignored. This conclusion is also obtained from the large value of the surface Pèclet number ${Pe}_s=U R_b/D_s$
. Consider the characteristic velocity
${Pe}_s=U R_b/D_s$
. Consider the characteristic velocity $U\sim R_b/t_0\sim 0.5$
m s−1 of the cavity collapse. The surface Pèclet number lies in the interval
$U\sim R_b/t_0\sim 0.5$
m s−1 of the cavity collapse. The surface Pèclet number lies in the interval $10^5\lesssim {Pe}_s\lesssim 10^6$
.
$10^5\lesssim {Pe}_s\lesssim 10^6$
.
Under the above-mentioned conditions, the dimensionless numbers characterising the surfactant effect are typically the equilibrium value of the surface coverage $\varGamma _{\textit{eq}}=\widehat {\varGamma }_{\textit{eq}}/\widehat {\varGamma }_{\infty }$
and the Marangoni number
$\varGamma _{\textit{eq}}=\widehat {\varGamma }_{\textit{eq}}/\widehat {\varGamma }_{\infty }$
and the Marangoni number ${Ma}=\widehat {\varGamma }_{\infty }R_g T/\sigma _c$
. The combination of the Langmuir equation of state and the Gibbs isotherm allows us to calculate these two parameters for Tween 80 (see § 2.2). However, the surface tension values for SDS in DMSO/water do not follow the Langmuir equation of state, and
${Ma}=\widehat {\varGamma }_{\infty }R_g T/\sigma _c$
. The combination of the Langmuir equation of state and the Gibbs isotherm allows us to calculate these two parameters for Tween 80 (see § 2.2). However, the surface tension values for SDS in DMSO/water do not follow the Langmuir equation of state, and $\varGamma _{\textit{eq}}$
and Ma cannot be estimated with this procedure. Alternatively, we use
$\varGamma _{\textit{eq}}$
and Ma cannot be estimated with this procedure. Alternatively, we use $c/c_{\textit{cmc}}$
to measure the surfactant concentration and
$c/c_{\textit{cmc}}$
to measure the surfactant concentration and $ \Delta \sigma _{\textit{cmc}}=(\sigma _c-\sigma (c_{\textit{cmc}}))/\sigma _c$
to quantify the surfactant strength.
$ \Delta \sigma _{\textit{cmc}}=(\sigma _c-\sigma (c_{\textit{cmc}}))/\sigma _c$
to quantify the surfactant strength.
To analyse the effect of the surfactant, we selected two surfactants with significantly different strengths: $\Delta \sigma _{\textit{cmc}}=0.11$
for SDS and
$\Delta \sigma _{\textit{cmc}}=0.11$
for SDS and $ \Delta \sigma _{\textit{cmc}}=0.26$
for Tween 80 (figure 3
a). Given its small strength, SDS can represent the presence of impurities in water. Tween 80 in the DMSO/water mixtures considered here can be regarded as a moderately weak surfactant (e.g.
$ \Delta \sigma _{\textit{cmc}}=0.26$
for Tween 80 (figure 3
a). Given its small strength, SDS can represent the presence of impurities in water. Tween 80 in the DMSO/water mixtures considered here can be regarded as a moderately weak surfactant (e.g. $ \Delta \sigma _{\textit{cmc}}=0.47$
for SDS in water). The equilibrium surfactant concentrations considered in our analysis were so small that the surface tension was practically the same as that of the clean interface (figure 3
a). In the Tween 80 case,
$ \Delta \sigma _{\textit{cmc}}=0.47$
for SDS in water). The equilibrium surfactant concentrations considered in our analysis were so small that the surface tension was practically the same as that of the clean interface (figure 3
a). In the Tween 80 case, $\sigma (c)$
could be fitted by the Langmuir equation of state (figure 3
a). This allowed us to estimate the isotherm
$\sigma (c)$
could be fitted by the Langmuir equation of state (figure 3
a). This allowed us to estimate the isotherm $\varGamma (c)$
and the equation of state
$\varGamma (c)$
and the equation of state $\sigma (\varGamma )$
(figure 3
b). For this surfactant,
$\sigma (\varGamma )$
(figure 3
b). For this surfactant, $\varGamma _{\textit{eq}}\leqslant 0.26$
in our bubble bursting experiments.
$\varGamma _{\textit{eq}}\leqslant 0.26$
in our bubble bursting experiments.
4. Results
4.1. Cavity collapse
As shown in § 4.2, the surfactant has a negligible effect on the critical Laplace number ${La}^*$
. In this section, we analyse the impact on the cavity evolution of Tween 80 at
${La}^*$
. In this section, we analyse the impact on the cavity evolution of Tween 80 at $c/c_{\textit{cmc}}=0.0233$
(
$c/c_{\textit{cmc}}=0.0233$
( $\varGamma _{\textit{eq}}=0.26$
) for
$\varGamma _{\textit{eq}}=0.26$
) for ${La}={La}^*$
. Due to the small surfactant concentration, the time elapsed between film rupture and the free surface reversal increased only approximately 12 % in the presence of Tween 80 (figure 5
a). The cavity shape remained essentially unchanged by the surfactant until
${La}={La}^*$
. Due to the small surfactant concentration, the time elapsed between film rupture and the free surface reversal increased only approximately 12 % in the presence of Tween 80 (figure 5
a). The cavity shape remained essentially unchanged by the surfactant until $(t-t_b)/t_0\simeq 0.2$
(
$(t-t_b)/t_0\simeq 0.2$
( $t_b$
is the instant of the film rupture and
$t_b$
is the instant of the film rupture and $t_0=(\rho R_b^3/\sigma _c)^{1/2}\simeq 0.50$
ms is the inertio-capillary time). Significant differences appeared for
$t_0=(\rho R_b^3/\sigma _c)^{1/2}\simeq 0.50$
ms is the inertio-capillary time). Significant differences appeared for $(t-t_b)/t_0\gtrsim 0.2$
.
$(t-t_b)/t_0\gtrsim 0.2$
.
(a) Images of the cavity collapse without surfactant and with Tween 80 at $c/c_{\textit{cmc}}=0.0233$
(
$c/c_{\textit{cmc}}=0.0233$
( $\varGamma _{\textit{eq}}=0.26$
) both for
$\varGamma _{\textit{eq}}=0.26$
) both for ${La}\simeq {La}^*$
and
${La}\simeq {La}^*$
and ${Bo}\simeq 0.01$
. (b) Zoom-in on the bubble bottom region close to the free surface reversal. The labels indicate the time to the film rupture (panel a) and free surface reversal (panel b) divided by the inertio-capillary time
${Bo}\simeq 0.01$
. (b) Zoom-in on the bubble bottom region close to the free surface reversal. The labels indicate the time to the film rupture (panel a) and free surface reversal (panel b) divided by the inertio-capillary time $t_0$
. The orange arrows indicate the instant of free surface reversal. The red arrows in panel (b) point at a previous capillary wave. The black arrow in panel (b) indicates the free surface curvature
$t_0$
. The orange arrows indicate the instant of free surface reversal. The red arrows in panel (b) point at a previous capillary wave. The black arrow in panel (b) indicates the free surface curvature $\kappa _1=-{\textrm d}^2r/{\textrm d}z^2/[1+({\textrm d}r/{\textrm d}z)^2]^{3/2}$
partially eliminated by the surfactant.
$\kappa _1=-{\textrm d}^2r/{\textrm d}z^2/[1+({\textrm d}r/{\textrm d}z)^2]^{3/2}$
partially eliminated by the surfactant.

Figure 5(b) zooms in on the cavity bottom during the last stage of the cavity collapse (a longer sequence can be observed in figure S3). The instant $t=t_r$
of the free surface reversal is determined as that for which the velocity
$t=t_r$
of the free surface reversal is determined as that for which the velocity $V_B$
of the observed cavity bottom is maximum (figure 6
a). In the absence of surfactant, the width
$V_B$
of the observed cavity bottom is maximum (figure 6
a). In the absence of surfactant, the width $w$
of the cavity bottom takes the value
$w$
of the cavity bottom takes the value $w/R_b\simeq 0.1$
at
$w/R_b\simeq 0.1$
at $(t-t_r)/t_0\simeq -0.002$
(figure 6
b), which is consistent with previous simulation results (Gañán-Calvo & López-Herrera Reference Gañán-Calvo and López-Herrera2021). This value is smaller than the minimum reported by Eshima et al. (Reference Eshima, Aurégan, Farsoiya, Popinet, Stone and Deike2025) for a larger Laplace number,
$(t-t_r)/t_0\simeq -0.002$
(figure 6
b), which is consistent with previous simulation results (Gañán-Calvo & López-Herrera Reference Gañán-Calvo and López-Herrera2021). This value is smaller than the minimum reported by Eshima et al. (Reference Eshima, Aurégan, Farsoiya, Popinet, Stone and Deike2025) for a larger Laplace number, ${La}=2400$
, in the absence of surfactant. This discrepancy may indicate a strong effect of viscosity on the free surface reversal at the critical conditions. In fact, a slight variation with respect to the critical Laplace number (critical viscosity for a given bubble radius) considerably reduces the energy-focusing effect, leading to a significant increase in the first-emitted droplet radius, as shown by simulations and experiments (Gañán-Calvo & López-Herrera Reference Gañán-Calvo and López-Herrera2021).
${La}=2400$
, in the absence of surfactant. This discrepancy may indicate a strong effect of viscosity on the free surface reversal at the critical conditions. In fact, a slight variation with respect to the critical Laplace number (critical viscosity for a given bubble radius) considerably reduces the energy-focusing effect, leading to a significant increase in the first-emitted droplet radius, as shown by simulations and experiments (Gañán-Calvo & López-Herrera Reference Gañán-Calvo and López-Herrera2021).
(a) Upward cavity bottom velocity $V_B$
and (b) width
$V_B$
and (b) width $w$
as a function of time to the free surface reversal without surfactant (green symbols) and with Tween 80 at
$w$
as a function of time to the free surface reversal without surfactant (green symbols) and with Tween 80 at $c/c_{\textit{cmc}}=0.0233$
(
$c/c_{\textit{cmc}}=0.0233$
( $\varGamma _{\textit{eq}}=0.26$
) (red symbols) both for
$\varGamma _{\textit{eq}}=0.26$
) (red symbols) both for ${La}\simeq {La}^*$
and
${La}\simeq {La}^*$
and ${Bo}\simeq 0.01$
.
${Bo}\simeq 0.01$
.

During the cavity collapse, the surfactant is convected towards the cavity bottom. The cavity bottom sharply shrinks before the interface reversal. Both effects increase the surfactant surface concentration in that region (Constante-Amores et al. Reference Constante-Amores, Kahouadji, Batchvarov, Shin, Chergui, Juric and Matar2021; Pico et al. Reference Pico, Kahouadji, Shin, Chergui, Juric and Matar2024). This produces a local reduction in surface tension and Marangoni stress that opposes the flow converging to the cavity bottom. Both local solute-capillarity and Marangoni stress delay the free surface reversal (figure 5 a).
The surface tension variation is very low for $\varGamma \lt 0.6$
(figure 3
b). Therefore, solute-capillarity and Marangoni stress are expected to be significant only when the local surfactant concentration rises above that value. This means that the local concentration eventually exceeds
$\varGamma \lt 0.6$
(figure 3
b). Therefore, solute-capillarity and Marangoni stress are expected to be significant only when the local surfactant concentration rises above that value. This means that the local concentration eventually exceeds $2.5\varGamma _{\textit{eq}}$
for
$2.5\varGamma _{\textit{eq}}$
for $c/c_{\textit{cmc}}=0.023$
(
$c/c_{\textit{cmc}}=0.023$
( $\varGamma _{\textit{eq}}\simeq 0.26$
). Assume that there is a phase of the cavity collapse in which the concentration at the bubble bottom lies in the interval
$\varGamma _{\textit{eq}}\simeq 0.26$
). Assume that there is a phase of the cavity collapse in which the concentration at the bubble bottom lies in the interval $2.5\varGamma _{\textit{eq}} \lesssim \varGamma \lesssim 3\varGamma _{\textit{eq}}$
. In this phase, the surface tension reduction is less than 10 % (figure 3
b). However,
$2.5\varGamma _{\textit{eq}} \lesssim \varGamma \lesssim 3\varGamma _{\textit{eq}}$
. In this phase, the surface tension reduction is less than 10 % (figure 3
b). However, $\sigma (\varGamma )$
exhibits a relatively sharp dependence on
$\sigma (\varGamma )$
exhibits a relatively sharp dependence on $\varGamma$
(figure 3
b). Therefore, Marangoni stress must be the major effect at this stage. This is consistent with the numerical simulations of Constante-Amores et al. (Reference Constante-Amores, Kahouadji, Batchvarov, Shin, Chergui, Juric and Matar2021) for a similar initial coverage and
$\varGamma$
(figure 3
b). Therefore, Marangoni stress must be the major effect at this stage. This is consistent with the numerical simulations of Constante-Amores et al. (Reference Constante-Amores, Kahouadji, Batchvarov, Shin, Chergui, Juric and Matar2021) for a similar initial coverage and ${La}=2\times 10^4$
. In these simulations, the concentration at the bubble bottom approaches nearly three times the equilibrium value during the final stage of cavity collapse (see figure 2 of Constante-Amores et al. (Reference Constante-Amores, Kahouadji, Batchvarov, Shin, Chergui, Juric and Matar2021)). In our experiment, the phase influenced solely by Marangoni stress is followed by a final stage before the interface reversal, during which the concentration continues to increase.
${La}=2\times 10^4$
. In these simulations, the concentration at the bubble bottom approaches nearly three times the equilibrium value during the final stage of cavity collapse (see figure 2 of Constante-Amores et al. (Reference Constante-Amores, Kahouadji, Batchvarov, Shin, Chergui, Juric and Matar2021)). In our experiment, the phase influenced solely by Marangoni stress is followed by a final stage before the interface reversal, during which the concentration continues to increase.
Figure 6(b) shows the evolution of the cavity bottom width $w$
(see figure 5
b) as a function of the time to the free surface reversal. The surfactant produces a negligible effect on
$w$
(see figure 5
b) as a function of the time to the free surface reversal. The surfactant produces a negligible effect on $w$
during the first phase of the cavity collapse. However, as anticipated previously, the local concentration eventually exceeds the threshold to produce significant Marangoni stress. Consequently, the cavity bottom just before the free surface reversal is narrower in the surfactant case (figure 6
b). The surfactant reduces surface tension and curvature at the cavity corners, thereby decreasing the magnitude of the capillary pressure. This delays the free surface reversal and allows further reduction of the cavity bottom width (figure 6
b) (figure S3 shows the high reproducibility of this result). It also lowers the axial acceleration during jet formation and reduces the velocity
$w$
during the first phase of the cavity collapse. However, as anticipated previously, the local concentration eventually exceeds the threshold to produce significant Marangoni stress. Consequently, the cavity bottom just before the free surface reversal is narrower in the surfactant case (figure 6
b). The surfactant reduces surface tension and curvature at the cavity corners, thereby decreasing the magnitude of the capillary pressure. This delays the free surface reversal and allows further reduction of the cavity bottom width (figure 6
b) (figure S3 shows the high reproducibility of this result). It also lowers the axial acceleration during jet formation and reduces the velocity $V_B$
at the free surface reversal, as shown in figure 6(a). Our results qualitatively agree with the numerical simulations of Eshima et al. (Reference Eshima, Aurégan, Farsoiya, Popinet, Stone and Deike2025), which show that an accumulation of surfactants near the corner of the cavity results in a Marangoni stress that smooths the corner and makes the cavity bottom narrower before the free surface reversal.
$V_B$
at the free surface reversal, as shown in figure 6(a). Our results qualitatively agree with the numerical simulations of Eshima et al. (Reference Eshima, Aurégan, Farsoiya, Popinet, Stone and Deike2025), which show that an accumulation of surfactants near the corner of the cavity results in a Marangoni stress that smooths the corner and makes the cavity bottom narrower before the free surface reversal.
Figure 7(a) shows that the surfactant partially eliminates the interface curvature $\kappa _1=-{\textrm d}^2r/{\textrm d}z^2/[1+({\textrm d}r/{\textrm d}z)^2]^{3/2}$
along one of the principal radii of curvature of the lateral bubble surface (see the black arrows in figure 5
b), except next to the bottom, where the opposite effect occurs. This increases the free surface radius
$\kappa _1=-{\textrm d}^2r/{\textrm d}z^2/[1+({\textrm d}r/{\textrm d}z)^2]^{3/2}$
along one of the principal radii of curvature of the lateral bubble surface (see the black arrows in figure 5
b), except next to the bottom, where the opposite effect occurs. This increases the free surface radius $r(z)$
and therefore decreases the curvature
$r(z)$
and therefore decreases the curvature $\kappa _2=[r\sqrt {1+({\textrm d}r/{\textrm d}z)^2}]^{-1}$
along the other principal radius, except next to the bottom, where
$\kappa _2=[r\sqrt {1+({\textrm d}r/{\textrm d}z)^2}]^{-1}$
along the other principal radius, except next to the bottom, where $\kappa _2$
takes practically the same value with and without surfactant (figure 7
b). The combination of these effects slightly decreases the bubble curvature
$\kappa _2$
takes practically the same value with and without surfactant (figure 7
b). The combination of these effects slightly decreases the bubble curvature $\kappa =\kappa _1+\kappa _2$
(decreases the magnitude of the capillary pressure
$\kappa =\kappa _1+\kappa _2$
(decreases the magnitude of the capillary pressure $p_c=-\sigma \kappa$
) next to the bottom (figure 7
c). This effect was also observed in simulations for larger values of Laplace number (Pico et al. Reference Pico, Kahouadji, Shin, Chergui, Juric and Matar2024). The curvature
$p_c=-\sigma \kappa$
) next to the bottom (figure 7
c). This effect was also observed in simulations for larger values of Laplace number (Pico et al. Reference Pico, Kahouadji, Shin, Chergui, Juric and Matar2024). The curvature $\kappa _1$
may be affected by numerical error due to the limited spatial resolution of the image, even though the free surface location was determined at the subpixel level (Montanero Reference Montanero2024).
$\kappa _1$
may be affected by numerical error due to the limited spatial resolution of the image, even though the free surface location was determined at the subpixel level (Montanero Reference Montanero2024).
Curvatures $\kappa _1=-{\textrm d}^2r/{\textrm d}z^2/[1+({\textrm d}r/{\textrm d}z)^2]^{3/2}$
,
$\kappa _1=-{\textrm d}^2r/{\textrm d}z^2/[1+({\textrm d}r/{\textrm d}z)^2]^{3/2}$
, $\kappa _2=[r\sqrt {1+({\textrm d}r/{\textrm d}z)^2}]^{-1}$
and total curvature
$\kappa _2=[r\sqrt {1+({\textrm d}r/{\textrm d}z)^2}]^{-1}$
and total curvature $\kappa =\kappa _1+\kappa _2$
along the lateral free surface (excluding the corner and bottom of the cavity) without surfactant (green symbols) and with Tween 80 at
$\kappa =\kappa _1+\kappa _2$
along the lateral free surface (excluding the corner and bottom of the cavity) without surfactant (green symbols) and with Tween 80 at $c/c_{\textit{cmc}}=0.0233$
(
$c/c_{\textit{cmc}}=0.0233$
( $\varGamma _{\textit{eq}}=0.26$
) (red symbols) both for
$\varGamma _{\textit{eq}}=0.26$
) (red symbols) both for ${La}\simeq {La}^*$
,
${La}\simeq {La}^*$
, ${Bo}\simeq 0.01$
and
${Bo}\simeq 0.01$
and $(t-t_r)/t_0=-0.007$
.
$(t-t_r)/t_0=-0.007$
.

Lai, Eggers & Deike (Reference Lai, Eggers and Deike2018) derived a scaling that describes the process from cavity collapse to droplet formation in the absence of surfactant. The scaled numerical profiles approximately collapsed onto a universal curve over a certain time interval for ${La}=1000{-}5000$
. Figure 8(a,b) shows the collapse of our experimental outer cavity profiles (notice that the jet cannot be visualised) without surfactant for
${La}=1000{-}5000$
. Figure 8(a,b) shows the collapse of our experimental outer cavity profiles (notice that the jet cannot be visualised) without surfactant for ${La}\simeq {La}^*$
and
${La}\simeq {La}^*$
and ${Bo}\simeq 0.01$
. Adding a surfactant (figure 8
c,d) breaks self-similarity within the same time interval. Local soluto-capillarity and Marangoni stress modify the cavity curvature. The surface tension at the bottom of the cavity deviates significantly from the constant value assumed in the scaling.
${Bo}\simeq 0.01$
. Adding a surfactant (figure 8
c,d) breaks self-similarity within the same time interval. Local soluto-capillarity and Marangoni stress modify the cavity curvature. The surface tension at the bottom of the cavity deviates significantly from the constant value assumed in the scaling.
(a) Outer cavity profiles and (b) their scaled counterparts without surfactant. Panels (c) and (d) show the results with Tween 80 at $c/c_{\textit{cmc}}=0.0233$
. Here,
$c/c_{\textit{cmc}}=0.0233$
. Here, $z_0$
is the cavity bottom position in the last image considered,
$z_0$
is the cavity bottom position in the last image considered, $L(t)=L_{\mu } [(t_r-t)/(L_\mu /V_\mu )]^{2/3}$
, and
$L(t)=L_{\mu } [(t_r-t)/(L_\mu /V_\mu )]^{2/3}$
, and $L_{\mu }=\mu ^2/(\rho \sigma )$
and
$L_{\mu }=\mu ^2/(\rho \sigma )$
and $V_{\mu }=\sigma /\mu$
are the viscous-capillary length and velocity, respectively. The results were obtained for
$V_{\mu }=\sigma /\mu$
are the viscous-capillary length and velocity, respectively. The results were obtained for ${La}\simeq {La}^*$
and
${La}\simeq {La}^*$
and ${Bo}\simeq 0.01$
.
${Bo}\simeq 0.01$
.

4.2. Droplet emission
We now examine the effect of the surfactant on spray production. Figure 9 shows the radius $R_d$
and velocity
$R_d$
and velocity $V_d$
of the first-emitted droplet as a function of the Laplace number for a clean interface and different concentrations of Tween 80 and SDS. The surfactant hardly changes the critical Laplace number
$V_d$
of the first-emitted droplet as a function of the Laplace number for a clean interface and different concentrations of Tween 80 and SDS. The surfactant hardly changes the critical Laplace number ${La}^*$
for which the droplet radius is minimum. For a fixed Laplace number, the droplet radius monotonically increases and the velocity monotonically decreases with the surfactant concentration
${La}^*$
for which the droplet radius is minimum. For a fixed Laplace number, the droplet radius monotonically increases and the velocity monotonically decreases with the surfactant concentration $c/c_{\textit{cmc}}$
(figure 9). The same effect was observed for
$c/c_{\textit{cmc}}$
(figure 9). The same effect was observed for ${La}=5.4\times 10^4$
and lower SDS concentrations than those for which ejection was suppressed (Vega & Montanero Reference Vega and Montanero2024).
${La}=5.4\times 10^4$
and lower SDS concentrations than those for which ejection was suppressed (Vega & Montanero Reference Vega and Montanero2024).
Dimensionless (a) radius $R_d/R_b$
and (b) velocity
$R_d/R_b$
and (b) velocity $V_d/V_\mu$
(
$V_d/V_\mu$
( $V_\mu =\sigma _c/\mu$
) of the first-emitted jet droplet as a function of the Laplace number La without surfactant (green symbols), with Tween 80 (red symbols) and with SDS (blue symbols). The error bars in panels (a) and (b) correspond to half a pixel size and the standard deviation, respectively. In some experiments, they are smaller than the symbol size and are hidden.
$V_\mu =\sigma _c/\mu$
) of the first-emitted jet droplet as a function of the Laplace number La without surfactant (green symbols), with Tween 80 (red symbols) and with SDS (blue symbols). The error bars in panels (a) and (b) correspond to half a pixel size and the standard deviation, respectively. In some experiments, they are smaller than the symbol size and are hidden.

The phenomenon observed here is substantially different from that observed in saturated monolayers and in systems with large Laplace numbers. Experiments under those conditions have demonstrated that a surfactant dissolved at the appropriate concentration dampens the short-wavelength capillary waves arising during the cavity collapse (Rodríguez-Díaz et al. Reference Rodríguez-Díaz, Rubio, Montanero, Gañán-Calvo and Cabezas2023; Vega & Montanero Reference Vega and Montanero2024), thereby intensifying the focusing of energy and enhancing jet ejection. This results in a significant increase (decrease) in the first-emitted droplet velocity (radius) (Rodríguez-Díaz et al. Reference Rodríguez-Díaz, Rubio, Montanero, Gañán-Calvo and Cabezas2023; Vega & Montanero Reference Vega and Montanero2024). A tiny capillary wave can be observed at the base of the clean cavity (see the red arrows in figure 5
a), indicating a slight deviation with respect to the critical condition ${La}={La}^*$
. The surfactant does not produce a significant damping effect. As a consequence, we do not observe the non-monotonous dependence of the droplet radius and velocity on the surfactant concentration described by Rodríguez-Díaz et al. (Reference Rodríguez-Díaz, Rubio, Montanero, Gañán-Calvo and Cabezas2023) and Vega & Montanero (Reference Vega and Montanero2024).
${La}={La}^*$
. The surfactant does not produce a significant damping effect. As a consequence, we do not observe the non-monotonous dependence of the droplet radius and velocity on the surfactant concentration described by Rodríguez-Díaz et al. (Reference Rodríguez-Díaz, Rubio, Montanero, Gañán-Calvo and Cabezas2023) and Vega & Montanero (Reference Vega and Montanero2024).
Interestingly, there is a significant increase in the droplet radius even at concentrations at which the equilibrium surface tension is nearly identical to that of the clean interface. For instance, $R_d$
increases by a factor of 2.8 at the concentration
$R_d$
increases by a factor of 2.8 at the concentration $c/c_{\textit{cmc}}=0.0233$
of Tween 80, for which
$c/c_{\textit{cmc}}=0.0233$
of Tween 80, for which $\sigma /\sigma _c=0.98$
(figure 10). In this case, the bubble bottom width
$\sigma /\sigma _c=0.98$
(figure 10). In this case, the bubble bottom width $w$
reaches a minimum that is much smaller than in the absence of surfactant (figures 5
b and 6
b). This indicates that additional effects in the jet (occurring after the free surface reversal) contribute to increasing the droplet radius. Vega & Montanero (Reference Vega and Montanero2024) have experimentally shown that the surfactant molecules are convected towards the jet tip so that the density of the monolayer covering the first-emitted droplet increases significantly for
$w$
reaches a minimum that is much smaller than in the absence of surfactant (figures 5
b and 6
b). This indicates that additional effects in the jet (occurring after the free surface reversal) contribute to increasing the droplet radius. Vega & Montanero (Reference Vega and Montanero2024) have experimentally shown that the surfactant molecules are convected towards the jet tip so that the density of the monolayer covering the first-emitted droplet increases significantly for ${La}\gt {La}^*$
. Simulations for large Laplace numbers show that the resulting Marangoni stress generates a recirculation zone near the jet base, which counteracts the flow from the jet bottom towards the front, contributing to increasing the radius of the droplet (Constante-Amores et al. Reference Constante-Amores, Kahouadji, Batchvarov, Shin, Chergui, Juric and Matar2021; Pico et al. Reference Pico, Kahouadji, Shin, Chergui, Juric and Matar2024). This mechanism also explains the increase in the droplet radius in our experiments.
${La}\gt {La}^*$
. Simulations for large Laplace numbers show that the resulting Marangoni stress generates a recirculation zone near the jet base, which counteracts the flow from the jet bottom towards the front, contributing to increasing the radius of the droplet (Constante-Amores et al. Reference Constante-Amores, Kahouadji, Batchvarov, Shin, Chergui, Juric and Matar2021; Pico et al. Reference Pico, Kahouadji, Shin, Chergui, Juric and Matar2024). This mechanism also explains the increase in the droplet radius in our experiments.
Images of the first-emitted droplet for ${La}\simeq {La}^*$
. The experiments were conducted using a clean interface and at several concentrations of Tween 80.
${La}\simeq {La}^*$
. The experiments were conducted using a clean interface and at several concentrations of Tween 80.

The droplet radius increases and the velocity decreases with the surfactant strength $ \Delta \sigma _{\textit{cmc}}$
. For
$ \Delta \sigma _{\textit{cmc}}$
. For ${La}\simeq {La}^*$
, the increase in the droplet radius due to the surfactant,
${La}\simeq {La}^*$
, the increase in the droplet radius due to the surfactant, $(R_d/R_b)-(R_d/R_b)_0$
(here,
$(R_d/R_b)-(R_d/R_b)_0$
(here, $(R_d/R_b)_0$
is the dimensionless radius without surfactant), can be fitted by the power law
$(R_d/R_b)_0$
is the dimensionless radius without surfactant), can be fitted by the power law $(R_d/R_b)-(R_d/R_b)_0= 17.9\, \Delta \sigma _{\textit{cmc}}^{\alpha _1}\, (c/c_{\textit{cmc}})^{\alpha _2}$
with
$(R_d/R_b)-(R_d/R_b)_0= 17.9\, \Delta \sigma _{\textit{cmc}}^{\alpha _1}\, (c/c_{\textit{cmc}})^{\alpha _2}$
with $\alpha _1=2.5$
and
$\alpha _1=2.5$
and $\alpha _2=0.65$
(figure 11), indicating the importance of the surfactant strength
$\alpha _2=0.65$
(figure 11), indicating the importance of the surfactant strength $ \Delta \sigma _{\textit{cmc}}$
.
$ \Delta \sigma _{\textit{cmc}}$
.
Increase in the dimensionless first-emitted droplet radius $(R_d/R_b)-(R_d/R_b)_0$
due to the surfactant monolayer for
$(R_d/R_b)-(R_d/R_b)_0$
due to the surfactant monolayer for ${La}\simeq {La}^*$
and
${La}\simeq {La}^*$
and $B\simeq 0.01$
. The solid line corresponds to the scaling law
$B\simeq 0.01$
. The solid line corresponds to the scaling law $(R_d/R_b)-(R_d/R_b)_0= 17.9\, \Delta \sigma _{\textit{cmc}}^{2.5}\, (c/c_{\textit{cmc}})^{0.65}$
calculated with the optimisation method described by Montanero & Gañán-Calvo (Reference Montanero and Gañán-Calvo2020) (details of this method can be found in the supplementary material).
$(R_d/R_b)-(R_d/R_b)_0= 17.9\, \Delta \sigma _{\textit{cmc}}^{2.5}\, (c/c_{\textit{cmc}})^{0.65}$
calculated with the optimisation method described by Montanero & Gañán-Calvo (Reference Montanero and Gañán-Calvo2020) (details of this method can be found in the supplementary material).

The fit in figure 11 suggests strong sensitivity to $\Delta \sigma _{\textit{cmc}}$
, but comparatively weak sensitivity to
$\Delta \sigma _{\textit{cmc}}$
, but comparatively weak sensitivity to $c/c_{\textit{cmc}}$
. This is not self-evident, since increasing
$c/c_{\textit{cmc}}$
. This is not self-evident, since increasing $c/c_{\textit{cmc}}$
should both reduce
$c/c_{\textit{cmc}}$
should both reduce $\sigma$
and intensify Marangoni stress. We do not have a definitive explanation for this behaviour because we do not know the dependence of
$\sigma$
and intensify Marangoni stress. We do not have a definitive explanation for this behaviour because we do not know the dependence of $\sigma$
on
$\sigma$
on $\varGamma$
for SDS and shadowgraphy provides limited information. However, the experimental values of the exponents
$\varGamma$
for SDS and shadowgraphy provides limited information. However, the experimental values of the exponents $\alpha _1$
and
$\alpha _1$
and $\alpha _2$
can be rationalised as follows.
$\alpha _2$
can be rationalised as follows.
Marangoni stress is responsible for jet widening and for the delay in droplet ejection. These effects increase the size of the first-emitted droplet. The parameter $\Delta \sigma _{\textit{cmc}}$
quantifies the surface tension reduction. One may assume that the strength of the Marangoni stress is proportional to
$\Delta \sigma _{\textit{cmc}}$
quantifies the surface tension reduction. One may assume that the strength of the Marangoni stress is proportional to $\Delta \sigma _{\textit{cmc}}$
and, consequently, the exponent
$\Delta \sigma _{\textit{cmc}}$
and, consequently, the exponent $\alpha _1$
is expected to be of order unity.
$\alpha _1$
is expected to be of order unity.
The parameter $c/c_{\textit{cmc}}$
determines the initial coverage at the bubble interface (the total amount of surfactant during bursting). As explained already, to trigger Marangoni stress at the jet inception, the local surfactant concentration in that region must exceed a threshold. The value of
$c/c_{\textit{cmc}}$
determines the initial coverage at the bubble interface (the total amount of surfactant during bursting). As explained already, to trigger Marangoni stress at the jet inception, the local surfactant concentration in that region must exceed a threshold. The value of $c/c_{\textit{cmc}}$
affects the instant beyond which Marangoni stress is triggered. Figure S5 shows that
$c/c_{\textit{cmc}}$
affects the instant beyond which Marangoni stress is triggered. Figure S5 shows that $w/R_b$
takes practically the same value immediately before the free surface reversal for two initial surfactant concentrations that differed by one order of magnitude. In fact, increasing
$w/R_b$
takes practically the same value immediately before the free surface reversal for two initial surfactant concentrations that differed by one order of magnitude. In fact, increasing $c/c_{\textit{cmc}}$
by a factor of 10 increases the reduction in
$c/c_{\textit{cmc}}$
by a factor of 10 increases the reduction in $w/R_b$
by only a factor of approximately 2 at the free surface reversal. This suggests that the local surfactant concentration in the early jet formation (the instant beyond which Marangoni stress arises) does not considerably depend on
$w/R_b$
by only a factor of approximately 2 at the free surface reversal. This suggests that the local surfactant concentration in the early jet formation (the instant beyond which Marangoni stress arises) does not considerably depend on $c/c_{\textit{cmc}}$
. Consequently, this parameter will have a relatively small impact on the droplet size (
$c/c_{\textit{cmc}}$
. Consequently, this parameter will have a relatively small impact on the droplet size ( $\alpha _2\ll \alpha _1$
).
$\alpha _2\ll \alpha _1$
).
A significant increase in the droplet size is also observed with a weak surfactant. This means that impurities in water substantially increase the minimum radius of the jet droplets. The bursting of a bubble in pure water is an idealisation that significantly differs from what occurs in nature. Our experiments suggest that impurities in real seawater lead to larger jet droplets. This is consistent with the results obtained by Wang et al. (Reference Wang2017) using natural seawater. In their experiments, bubbles with a radius in the range of 20–40 $\unicode{x03BC}$
m produced a significant number of dried particles with radii down to
$\unicode{x03BC}$
m produced a significant number of dried particles with radii down to ${\sim} 0.5$ $\unicode{x03BC}$
m. The radii of the jet droplets that originated those particles were around twice those of the particles; i.e. 2.2 times the minimum radius in clean water.
$\unicode{x03BC}$
m. The radii of the jet droplets that originated those particles were around twice those of the particles; i.e. 2.2 times the minimum radius in clean water.
The velocity of the first-emitted droplet decreases significantly with the addition of Tween 80. However, the droplet’s momentum at $c/c_{\textit{cmc}}=0.0233$
is approximately 7 times that in the absence of surfactant. Interestingly, the droplet kinetic energy increases by a factor of 2.5 when the surfactant is added due to the increased droplet volume. We can obtain a lower bound for the interfacial energy of the first drop by considering the surface tension for maximum packing. The corresponding surface energy is approximately 5 times larger than in the clean case due to the increased surface area. We conclude that more energy is transferred to the first drop. We hypothesise that jet widening and a delay in the detachment of the first drop due to Marangoni stress allow more mass and energy to flow into the first drop.
$c/c_{\textit{cmc}}=0.0233$
is approximately 7 times that in the absence of surfactant. Interestingly, the droplet kinetic energy increases by a factor of 2.5 when the surfactant is added due to the increased droplet volume. We can obtain a lower bound for the interfacial energy of the first drop by considering the surface tension for maximum packing. The corresponding surface energy is approximately 5 times larger than in the clean case due to the increased surface area. We conclude that more energy is transferred to the first drop. We hypothesise that jet widening and a delay in the detachment of the first drop due to Marangoni stress allow more mass and energy to flow into the first drop.
According to Berny et al. (Reference Berny, Deike, Seon and Popinet2020), the bursting of each bubble can produce up to fourteen droplets that may contribute to spray formation. Figure 12 shows the number $N$
of emitted droplets, their total surface
$N$
of emitted droplets, their total surface $S_{t}$
, volume
$S_{t}$
, volume $V_{t}$
and kinetic energy
$V_{t}$
and kinetic energy $E_{k,t}$
at the critical Laplace number for a clean interface and different concentrations of Tween 80. The combination of the Langmuir equation and the Gibbs isotherm for this surfactant allows us to calculate
$E_{k,t}$
at the critical Laplace number for a clean interface and different concentrations of Tween 80. The combination of the Langmuir equation and the Gibbs isotherm for this surfactant allows us to calculate $\varGamma _{\textit{eq}}(c)$
(see § 2.2), which allows us to plot the results versus this quantity. The results shown in figure 12 correspond only to the droplets emitted with an upward velocity, excluding those produced by the fragmentation of the retracting jet. The radius and velocity of each droplet are shown in figure S2. The number of drops
$\varGamma _{\textit{eq}}(c)$
(see § 2.2), which allows us to plot the results versus this quantity. The results shown in figure 12 correspond only to the droplets emitted with an upward velocity, excluding those produced by the fragmentation of the retracting jet. The radius and velocity of each droplet are shown in figure S2. The number of drops $N=7$
for a clean interface is in good agreement with numerical simulations for almost the same Bond and Laplace numbers (
$N=7$
for a clean interface is in good agreement with numerical simulations for almost the same Bond and Laplace numbers ( ${Bo}=0.015$
and
${Bo}=0.015$
and ${La}=1142$
) (see figure 5b of Berny et al. (Reference Berny, Deike, Seon and Popinet2020)). It is worth noting that
${La}=1142$
) (see figure 5b of Berny et al. (Reference Berny, Deike, Seon and Popinet2020)). It is worth noting that $N$
is very sensitive to the Bond and Laplace numbers for
$N$
is very sensitive to the Bond and Laplace numbers for ${La}\simeq {La}^*$
. In fact, the simulations of Berny et al. (Reference Berny, Deike, Seon and Popinet2020) showed the ejection of 14 droplets for
${La}\simeq {La}^*$
. In fact, the simulations of Berny et al. (Reference Berny, Deike, Seon and Popinet2020) showed the ejection of 14 droplets for ${La}=1430$
and
${La}=1430$
and ${Bo}=0.009$
.
${Bo}=0.009$
.
(a) Number $N$
of jet droplets, (b) total emitted surface
$N$
of jet droplets, (b) total emitted surface $S_t$
, (c) volume
$S_t$
, (c) volume $V_t$
and (d) kinetic energy
$V_t$
and (d) kinetic energy $E_{k,t}$
. The results are expressed in terms of the bubble surface
$E_{k,t}$
. The results are expressed in terms of the bubble surface $S_b=4\pi R_b^2$
, volume
$S_b=4\pi R_b^2$
, volume $V_b=4/3\pi R_b^3$
and interfacial energy
$V_b=4/3\pi R_b^3$
and interfacial energy $E_{s,b}=\sigma _c S_b$
. The dashed line in panel (b) corresponds to
$E_{s,b}=\sigma _c S_b$
. The dashed line in panel (b) corresponds to $S_t/S_b=\varGamma _{\textit{eq}}$
. The green symbol corresponds to the experiment without surfactant. The error bars indicate the standard deviation. In some experiments, they are smaller than the symbol size and are hidden.
$S_t/S_b=\varGamma _{\textit{eq}}$
. The green symbol corresponds to the experiment without surfactant. The error bars indicate the standard deviation. In some experiments, they are smaller than the symbol size and are hidden.

Our results demonstrate high reproducibility in the number of droplets, but significant variability in the total emitted surface area and volume. The scatter in radius and velocity measurement increases with the ordinal number of the emitted drop (see figure S2). This scatter is caused by the nonlinearity of the jet fragmentation process and may be associated with bifurcations among multiple states (Berny et al. Reference Berny, Deike, Seon and Popinet2020). A detailed study of jet fragmentation is outside the scope of this work.
Adding surfactant reduces the number of drops emitted. Only two drops are emitted for the highest concentration $c/c_{\textit{cmc}}=0.023$
. This is consistent with the experimental results of Vega & Montanero (Reference Vega and Montanero2024) for larger values of the Laplace number, who showed that a concentration interval exists without droplet emission.
$c/c_{\textit{cmc}}=0.023$
. This is consistent with the experimental results of Vega & Montanero (Reference Vega and Montanero2024) for larger values of the Laplace number, who showed that a concentration interval exists without droplet emission.
The emitted surface $S_t$
and volume
$S_t$
and volume $V_t$
exhibit a minimum at
$V_t$
exhibit a minimum at $\varGamma _{\textit{eq}}=3.4 \times 10^{-3}$
due to the reduction in the number of drops. Beyond this concentration, the surface, volume and kinetic energy of the liquid released into the atmosphere increase with the surfactant concentration. The increase in kinetic energy cannot be attributed only to a decrease in the droplet surface tension. In fact, the kinetic energy of the surfactant-laden droplets exceeds the sum of their kinetic and interfacial energies in the clean-interface case. Therefore, the surfactant enhances energy transfer to the spray. The increase in the mass and energy of the emitted droplets may explain the increase in microplastics transferred to the atmosphere when bubbles burst in the presence of surfactants (Masry et al. Reference Masry, Rossignol, Roussel, Bourgogne, Bussière, R’mili and Wong-Wah-Chung2021).
$\varGamma _{\textit{eq}}=3.4 \times 10^{-3}$
due to the reduction in the number of drops. Beyond this concentration, the surface, volume and kinetic energy of the liquid released into the atmosphere increase with the surfactant concentration. The increase in kinetic energy cannot be attributed only to a decrease in the droplet surface tension. In fact, the kinetic energy of the surfactant-laden droplets exceeds the sum of their kinetic and interfacial energies in the clean-interface case. Therefore, the surfactant enhances energy transfer to the spray. The increase in the mass and energy of the emitted droplets may explain the increase in microplastics transferred to the atmosphere when bubbles burst in the presence of surfactants (Masry et al. Reference Masry, Rossignol, Roussel, Bourgogne, Bussière, R’mili and Wong-Wah-Chung2021).
The surfactant initially adsorbed at the bubble’s free surface accumulates at the bubble’s bottom during the collapse of the cavity. Let $S^*$
be the area of the surface that could be covered with surfactant at the maximum packing fraction. Mass conservation yields
$S^*$
be the area of the surface that could be covered with surfactant at the maximum packing fraction. Mass conservation yields $S^*/S_b=\varGamma _{\textit{eq}}$
, where
$S^*/S_b=\varGamma _{\textit{eq}}$
, where $S_b=4\pi R_b^2$
is the bubble surface area. For
$S_b=4\pi R_b^2$
is the bubble surface area. For $c/c_{\textit{cmc}}\leq 0.0023$
,
$c/c_{\textit{cmc}}\leq 0.0023$
, $S^*$
is smaller than the total surface of the emitted droplets (figure 12
b). For these concentrations, we can assume that practically all the surfactant adsorbed at the bubble surface is transported by the droplets emitted from the bubble. Under this assumption, the mean surfactant coverage in the emitted droplets,
$S^*$
is smaller than the total surface of the emitted droplets (figure 12
b). For these concentrations, we can assume that practically all the surfactant adsorbed at the bubble surface is transported by the droplets emitted from the bubble. Under this assumption, the mean surfactant coverage in the emitted droplets, $\langle \varGamma \rangle$
, can be calculated from the conservation equation
$\langle \varGamma \rangle$
, can be calculated from the conservation equation $\langle \varGamma \rangle S_t=\varGamma _{\textit{eq}}S_b$
. For
$\langle \varGamma \rangle S_t=\varGamma _{\textit{eq}}S_b$
. For $c/c_{\textit{cmc}}=0.0023$
(
$c/c_{\textit{cmc}}=0.0023$
( $\varGamma _{\textit{eq}}=0.033$
),
$\varGamma _{\textit{eq}}=0.033$
), $\langle \varGamma \rangle$
becomes almost 25 times
$\langle \varGamma \rangle$
becomes almost 25 times $\varGamma _{\textit{eq}}$
. The corresponding surface tension value,
$\varGamma _{\textit{eq}}$
. The corresponding surface tension value, $\sigma (\langle \varGamma \rangle )$
, is approximately 0.85
$\sigma (\langle \varGamma \rangle )$
, is approximately 0.85 $\sigma _c$
(figure 3
b). This means that the reduction in surface tension in the jet is relatively small or affects only a small region. However, the values of
$\sigma _c$
(figure 3
b). This means that the reduction in surface tension in the jet is relatively small or affects only a small region. However, the values of $\langle \varGamma \rangle$
lie in an interval where
$\langle \varGamma \rangle$
lie in an interval where $\sigma$
exhibits a significant dependence on
$\sigma$
exhibits a significant dependence on $\varGamma$
(figure 3
b), giving rise to significant Marangoni stress. We may conclude that the primary effect of the surfactant on jet dynamics is Marangoni stress, which slows the interface and delays droplet detachment. This allows more liquid to flow into the droplet, increasing the mass and energy transferred to the resulting spray.
$\varGamma$
(figure 3
b), giving rise to significant Marangoni stress. We may conclude that the primary effect of the surfactant on jet dynamics is Marangoni stress, which slows the interface and delays droplet detachment. This allows more liquid to flow into the droplet, increasing the mass and energy transferred to the resulting spray.
5. Conclusions
In summary, we have demonstrated that a tiny amount of surfactant significantly increases the size and total mass of the emitted droplets via bubble bursting, even when its presence is not detected in surface tension measurements or does not substantially affect cavity collapse time. Surfactant accumulates at the bubble base due to the shrinkage of the cavity bottom and surfactant convection. Both soluto-capillarity and Marangoni stress alter the self-similar bubble collapse before the free surface reversal. This effect is also observed with a very weak surfactant, indicating that natural water contamination can substantially alter bubble bursting at the critical conditions.
Using a DMSO/water mixture analogue for water has some limitations: (i) the Bond number does not take the same value in our experiments and in water for the critical Laplace number, which is not a severe limitation because the Bond number is expected to play a secondary role; (ii) the surfactant monolayer in seawater may not reach equilibrium concentration before the bubble bursts; and (iii) the equation of state of Tween 80 and SDS in DMSO/water mixtures may differ from that of contaminants in seawater.
Our work provides evidence of the significant influence of surface-active contaminants, commonly present in natural environments, on the dynamics of bursting bubbles – a critical phenomenon in aerosol production and transport of chemical and biological substances into the atmosphere.
Supplementary materials
Supplementary materials are available at https://doi.org/10.1017/jfm.2026.11412.
Funding
This work was financially supported by the Spanish Ministry of Science, Innovation and Universities (grant no. PID2022-140951OB-C22/AEI/10.13039/501100011033/FEDER, UE).
Declaration of interests
The authors report no conflict of interest.


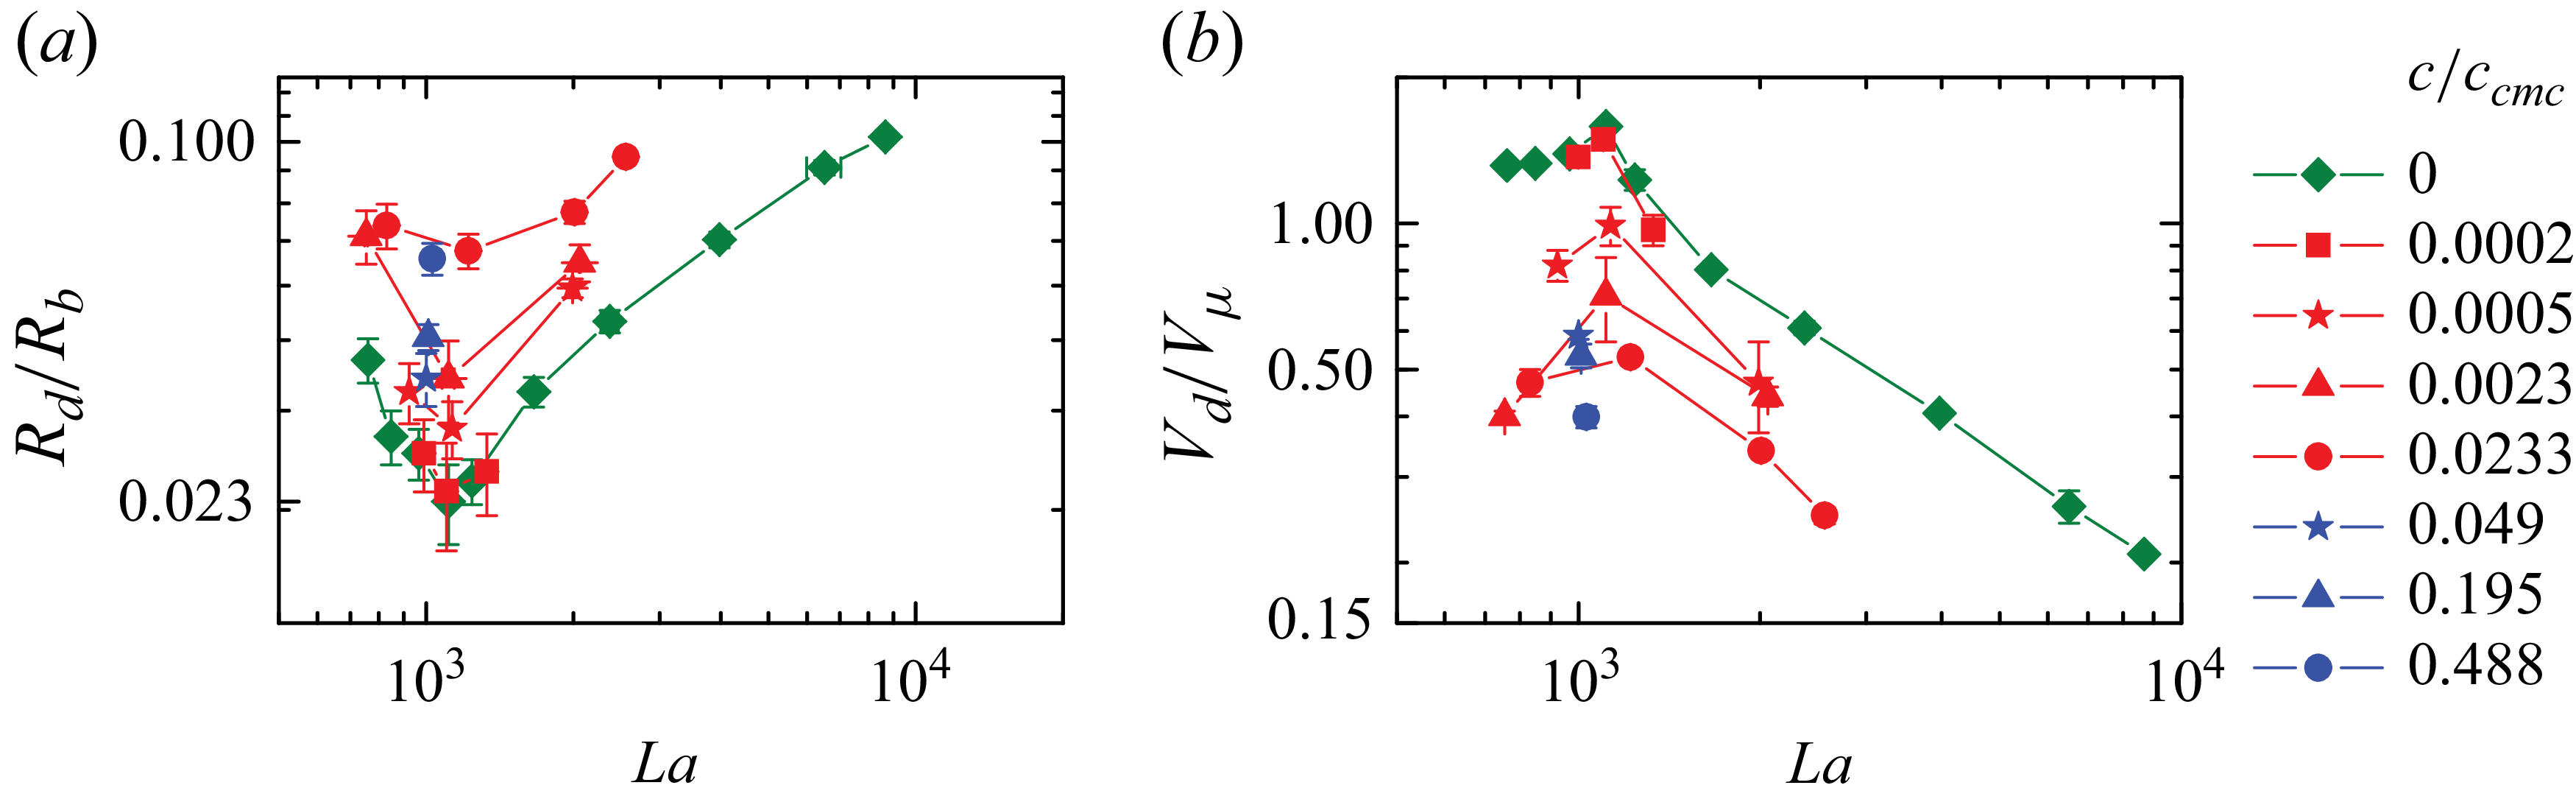


 Open access