



Proper folic acid (FA) and Fe status is crucial to young women’s health and is particularly important during pregnancy because of the development of the placenta and fetus, the increased volume of blood and the muscles of the uterus(Reference Christian, Mullany and Hurley1). For this reason, many commercially available supplements contain Fe and FA.
Folate, also known as vitamin B9, is involved in many metabolic reactions and participates in purine and pyrimidine synthesis and one-carbon metabolism(Reference Greenberg, Bell and Guan2). Insufficient intake of this nutrient can affect cellular function and lead to metabolic disturbances, such as increased homocysteine (Hcy) concentration(Reference Obwegeser, Hohlagschwandtner and Sinzinger3). Folate deficit impairs DNA synthesis and cell differentiation and thus alters erythropoiesis. Moreover, decreased folate status contributes to erythroblast apoptosis and induces anaemia(Reference Koury and Ponka4). Increased Hcy concentrations have been linked with embryonic development alterations, but the data on relationships between Hcy and increased incidences of spontaneous abortions are conflicting(Reference Micle, Muresan and Antal5,Reference Gaiday, Tussupkaliyev and Bermagambetova6) . It has also been shown that FA supplementation before and during pregnancy decreases the risk of neural tube defects(Reference De Marco, Calevo and Moroni7,Reference Nazki, Sameer and Ganaie8) . For this reason, many countries recommend supplementation of this nutrient among young women(Reference Panel and Nda9) and fortification is mandatory in the USA, Canada and a number of European countries(Reference Patanwala, King and Barrett10).
Fe deficiency caused by a negative Fe balance leads to impaired red blood production and Fe-deficiency anaemia. Fe-deficiency anaemia is one of the most common nutritional deficiencies in the world(Reference Low, Speedy and Styles11). The WHO reports that, on average, 56 % of pregnant women suffer from anaemia and at least half of this is Fe-deficiency anaemia(Reference Allen12). The adequate intake of food or of supplements containing Fe is thus essential(Reference Haider, Olofin and Wang13). The prenatal supplementation with Fe is associated with improved birth weight(Reference Alwan and Hamamy14), but Fe-overload is toxic(Reference Wessling-Resnick15).
The status of both Fe and FA primarily depends on dietary intake, absorption in the intestine, transport and excretion. FA is mainly absorbed in the duodenum(Reference Visentin, Diop-Bove and Zhao16) and, as a negatively charged molecule, it requires a specific membrane transporter to transfer it in and outside of the cell(Reference Visentin, Diop-Bove and Zhao16). FA absorption is mainly supported in mammals by proton-coupled folate transporter (Pcft), which is encoded by the Slc46a1 gene. Pcft requires an acidic environment for optimal functioning and has high affinity for FA(Reference Zhao, Diop-Bove and Visentin17). Pcft has been established as a folate transporter but was originally identified as haem carrier protein 1 and characterised as a mammalian haem transporter(Reference Inoue, Nakai and Ueda18). It has subsequently been shown that this transporter has a lower affinity to haem than to folate, but there is competitive uptake of folate and haem by it. For this reason, a high intake of haem may lead to impaired absorption of folate and high uptake of folate conversely leads to decreased absorption of haem Fe(Reference Laftah, Latunde-Dada and Fakih19). However, Fe absorption also depends on nonhaem Fe uptake via other transporters(Reference Garrick20). Fe absorption from the proximal small bowel is a critical step in the maintenance of Fe homeostasis(Reference Conrad and Umbreit21). Fe transport from the lumen of the gut into duodenal enterocytes is mediated by the divalent metal transporter 1, which is encoded by the Slc11a2 gene. Divalent metal transporter 1 functions as a Fe(II)/proton symporter. Fe(III) is also transported by divalent metal transporter 1 after reduction to Fe(II) by duodenal cytochrome B (DcytB)(Reference West and Oates22). Moreover, dysfunction of SLC11A2 leads to impaired Fe absorption and dramatically increases the expression of its transcript in rodents(Reference Canonne-Hergaux, Fleming and Levy23).
Fe deficiency results in elevated Fe requirements. It has been shown that expression of the Slc11a2 gene is tissue-specific and that its level of expression is related to Fe status. A compensation mechanism leads to increased Slc11a2 transcription and thus an increased abundance of transporters, which thus leads to accelerated absorption of Fe(Reference Canonne-Hergaux, Fleming and Levy23,Reference Canonne-Hergaux, Levy and Fleming24) . A similar observation has been noticed in rodent and in vitro models of folate deficiency, and folate deficiency increases expression levels of folate transporters(Reference Said, Chatterjee and Haq25–Reference Thakur, Rahat and Hamid27). However, there is no data on the effect of simultaneously supplementing Fe and FA after a deficiency of these nutrients on their transporter function. Moreover, there is limited information about the time response to supplementation following a deficiency of these nutrients(Reference Thakur, Rahat and Hamid27).
The aim of the present study was thus to determine how FA and Fe deficiency, and the subsequent supplementation of the rat diet with these nutrients, affects Slc11a2 and Slc46a1 gene expression and metabolic biomarkers of FA and Fe status.
Methods
Animals and diet
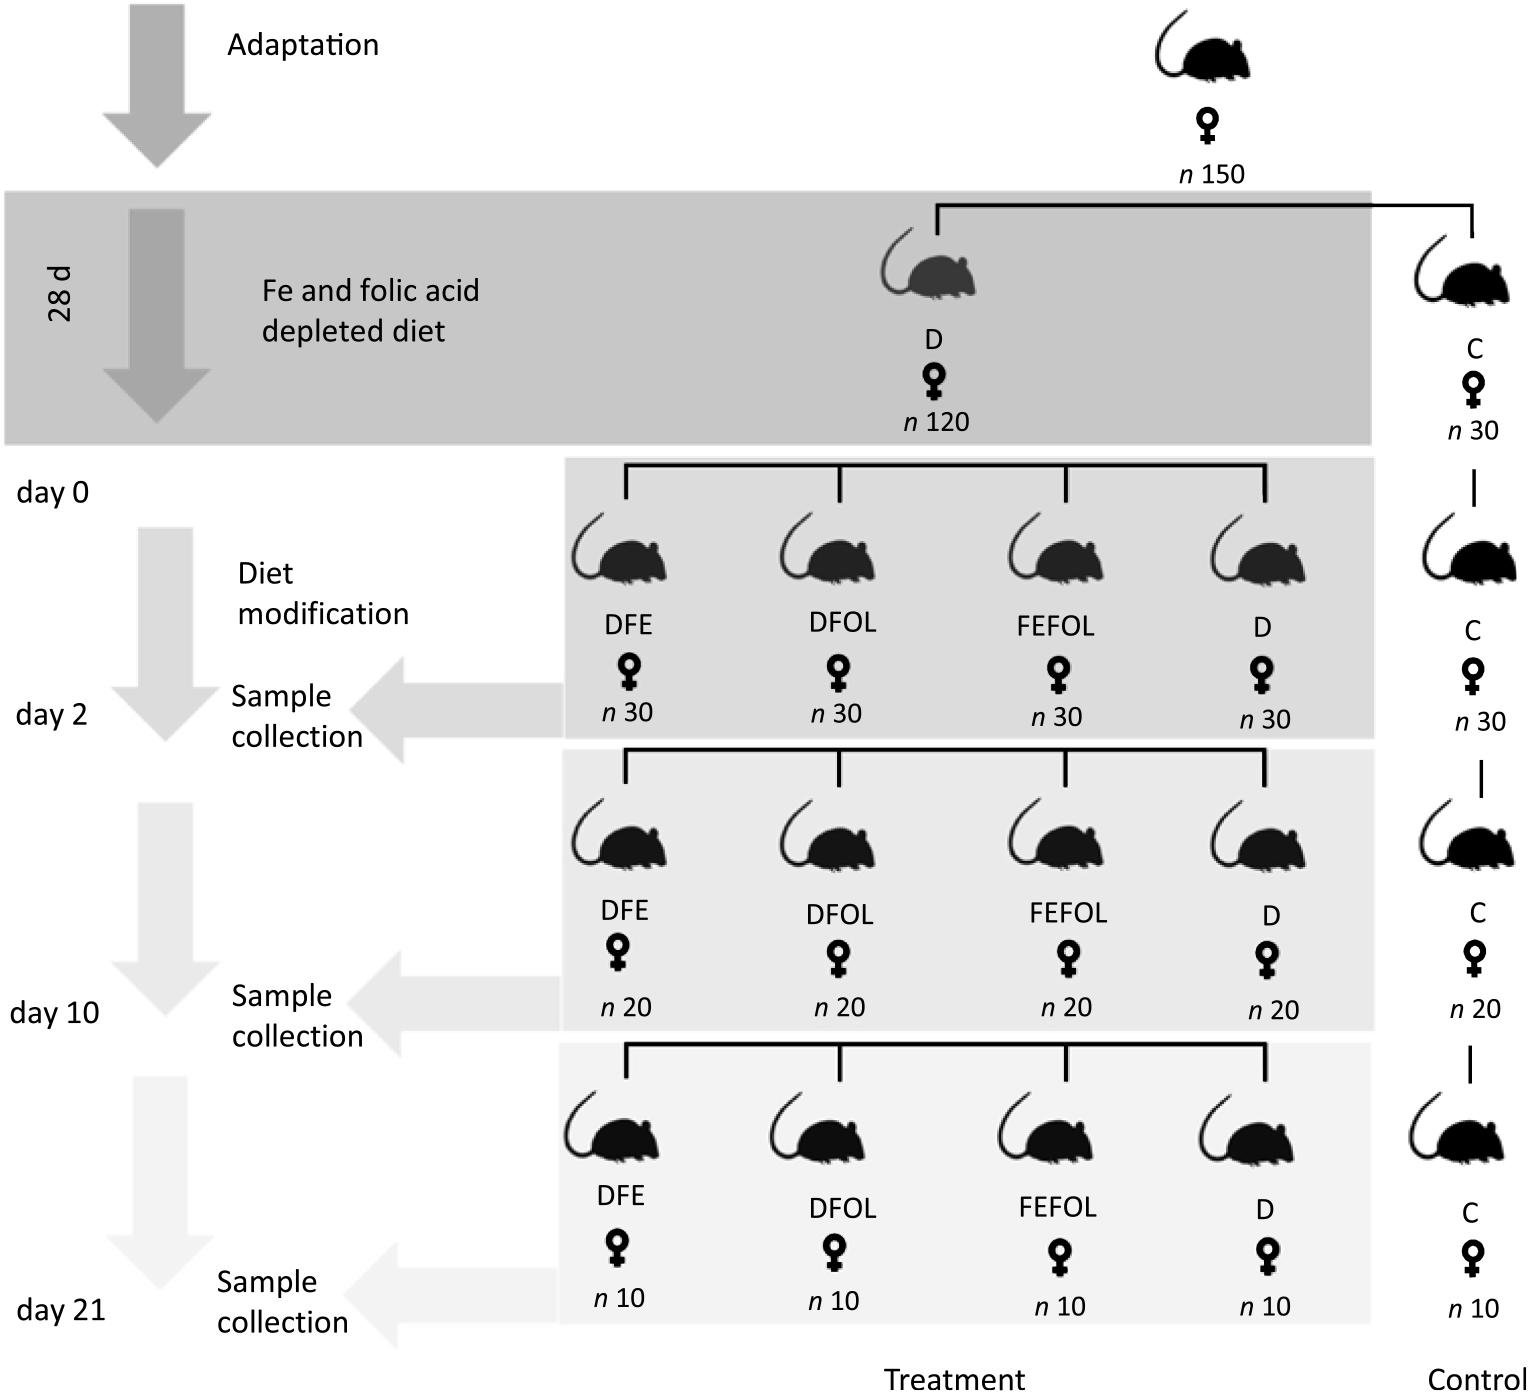
The experimental procedures were conducted in compliance with the international principles for laboratory animals and protocols approved by the Bioethical Commission for Animal Care and Use in Poznań, Poland (approval no. 59/2016). One hundred and fifty female Wistar rats of 8 weeks of age were purchased from AnimaLab (Germany). The animals were housed in cages with a 12 h light–12 h dark cycle in an environmentally controlled room at 20–22°C. Following an acclimatisation period, the animals were randomly assigned to either a group fed a diet deficient in Fe and FA (D, n 120) or to a group fed a control diet (C, n 30) for 28 d. The control diet was AIN-93M. After this period, animals in the D group were randomised to a group fed with a diet deficient in FA and supplemented with Fe (DFE), a group fed with a diet deficient in Fe and supplemented with FA (DFOL), a group fed with a diet supplemented with Fe and FA (FEFOL), a diet deficient in Fe and FA (D) or a group fed the control diet (C) until the end of the experiment. Detailed information on dietary composition is presented in Tables 1 and 2. Rats were given food and water ad libitum. Ten rats from each group were killed after 2, 10 and 21 d of the modified diet. The full study design is shown in Fig. 1. During the experiment, food intake was monitored daily and body weight was measured using an electronic scale.
Composition of diets
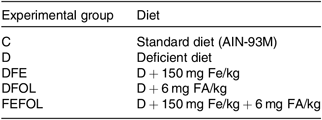
C, control diet; AIN, American Institute of Nutrition; D, diet deficient in Fe and folic acid; DFE, diet deficient in folic acid and supplemented with Fe; DFOL, diet deficient in Fe and supplemented with folic acid; FA, folic acid; FEFOL, diet supplemented with Fe and folic acid.
Composition of vitamin and mineral mixes in the experimental diets*
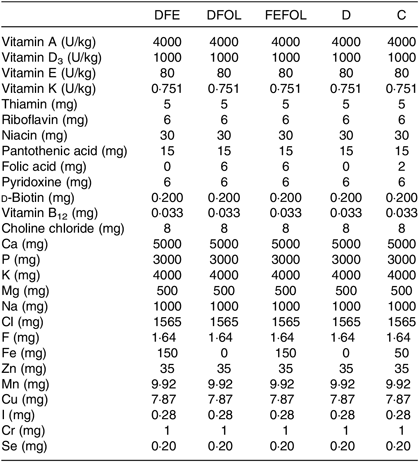
DFE, diet deficient in folic acid and supplemented with Fe; DFOL, diet deficient in Fe and supplemented with folic acid; FEFOL, diet supplemented with Fe and folic acid; D, diet deficient in Fe and folic acid; C, control diet.
* All values are expressed per kg of diet.
Study design. D, diet deficient in iron and folic acid; C, control diet; DFE, diet deficient in folic acid and supplemented with iron; DFOL, diet deficient in iron and supplemented with folic acid; FEFOL, diet supplemented with iron and folic acid.
Tissue and blood sampling
The animals were fasted overnight for up to 12 h and were killed by decapitation. Duodenum samples were frozen immediately in liquid N2 and stored at −80°C for further analysis. Blood was collected into standard vials and allowed to clot at room temperature for 1 h. The sample was then centrifuged at 14 000 rpm for 6 min, and the serum was collected and stored at −80°C. For the plasma samples, the blood was collected to a microtainer and centrifuged at 14 000 rpm for 6 min at 4°C and then collected and stored at −80°C.
Real-time PCR
The relative transcript levels were measured for genes encoding folate and Fe transporters – namely, Slc46a1 and Slc11a2. All details of primer and probe sequences are shown in Table 3. Total RNA was extracted from the liver and duodenum using a commercial kit (High Pure RNA Isolation Kit, Roche) and following the manufacturer’s protocol. The quality and quantity of RNA were assessed using a microvolume spectrophotometer (DS-11, DeNovix). The cDNA synthesis used 1 µg of RNA with a Transcriptor First Strand Synthesis Kit (Roche). Real-time reactions were performed in duplicate for all the rat samples using a Light Cycler 480 Instrument (Roche) with Universal Probe Library probes and LightCycler 480 Probes Master (Roche). The assays were intron-spanning. The real-time PCR cycle consisted of denaturation at 95°C for 10 min, followed by forty-five cycles of denaturation at 95°C for 10 s, annealing at 56°C for 30 s, and elongation at 72°C for 1 s. To normalise the data, we employed arithmetic means of transcription levels of two reference genes: 18s subunit ribosomal RNA and Actin β. Relative quantification of the mRNA level was performed based on the second derivative maximum method (Roche).
Real-time PCR primers and amplicon lengths of the studied genes
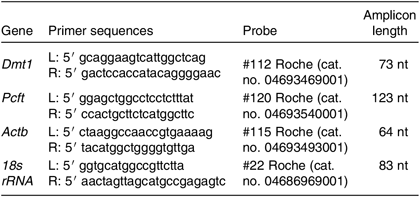
Dmt1, divalent metal-ion transporter 1; nt, nucleotides; Pcft, proton-coupled folate transporter; Actb, actin β; 18s rRNA, 18S ribosomal RNA.
Protein isolation
Proteins were isolated from 200 mg of tissue. Mechanical homogenisation was conducted in ice-cold radioimmunoprecipitation assay (RIPA) buffer (containing 50 mmol Tris–HCl, pH 8·0 with 150 mm NaCl, 1·0 % NP-40, 0·5 % sodium deoxycholate, 0·1 % SDS, 10 mm NaF and 1 mm Na3VO4) supplemented with a cocktail of proteases inhibitors. Samples were centrifuged at 12 000 g . Protein concentration was determined using a bicinchoninic acid (BCA) kit (Thermo Scientific).
Western Blot
Samples containing 20 μg of proteins were mixed in a 1:3 ratio (w/v) with 4× Laemmli buffer (BioRad), supplemented with β-mercaptoethanol and denatured for 5 min at 95°C. Electrophoresis was performed in 4 % acrylamide stacking gel and 12 % resolving gel for approximately 1·5 h at 125 V. The resolved proteins were transferred into a nitrocellulose membrane in a semidry transfer procedure with a Towbin buffer at 0·3 A for 10 min Trans-Blot Turbo Blotting System (BioRad). Protein band visualisations were performed with an 1 min incubation in Ponceau S solution. The membrane was then blocked by incubating with 3 % bovine serum albumin (BSA) in TBST solution for 1 h. The membrane was incubated with a primary antibody (SLC46A1 Antibody, Aviva Systems Biology; SLC11A2 Antibody, Santa Cruz Biotechnology) diluted to 1:1000 in TBST supplemented with 1 % of BSA at 4°C overnight. Specificity of both antibodies has been verified prior to the study. The membrane was then washed three times for 10 min and incubated with secondary antibody diluted to 1:5000 for 1 h. The signal was visualised using an ECL substrate (Thermo Scientific) on a ChemiDoc Touch Imaging System (BioRad).
Biochemical parameters
Fe concentrations were determined in serum using a commercial kit (Thermo Scientific). Unsaturated Fe binding capacity concentrations were assayed in serum using the photometric method with ferene (DiaSys) with a Konelab 20i biochemical analyser (Thermo Electron). Total Fe binding capacity (TIBC) was calculated by summing the unsaturated Fe binding capacity and Fe concentrations. Folate concentrations were determined using the electrochemiluminescence method with a Cobas 6000 (Roche Diagnostics) and reagent Folate III test (Roche Diagnostics GmbH). Plasma Hcy levels were determined using enzyme-cycling Hcy assay with commercial kits (Diazyme Homocysteine Assay, Diazyme Laboratories) and a fully automated Konelab 20i Analyser (Thermo Electron). Whole-blood morphological analysis was performed by a commercial laboratory with the use of SYSMEX XT-4000 (Synevo).
Statistical analysis
The results are presented as mean values and standard deviations. Differences between groups were assessed using one-way ANOVA followed by a post hoc Scheffé’s test. Transcripts and protein levels were compared by Kruskal–Wallis analysis. P < 0·05 was taken to be statistically significant.
Sample size was calculated using power analysis. Significance level was 0·05, assumed a two-sided test of the hypothesis and 0·8 was considered as adequate. Taking the Hb standard deviation as 6·2 g/l, ten animals gave as 87 % power to detect a difference between groups. Calculations were performed with the use of Statistica software (StatSoft).
Results
Intake of the experimental diets did not differ between the groups, nor did we observe body mass differences between the groups. Mean body weights are presented in Table 4.
Body weight of each animal group (n 10 per group)
(Mean values and standard deviations)
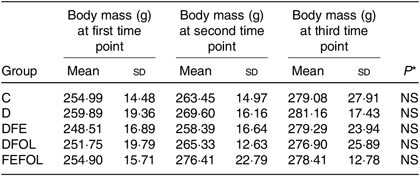
C, control diet; D, diet deficient in Fe and folic acid; DFE, diet deficient in folic acid and supplemented with Fe; DFOL, diet deficient in Fe and supplemented with folic acid; FEFOL, diet supplemented with Fe and folic acid.
* P values show the significance levels for the differences between dietary groups within sample collection days.
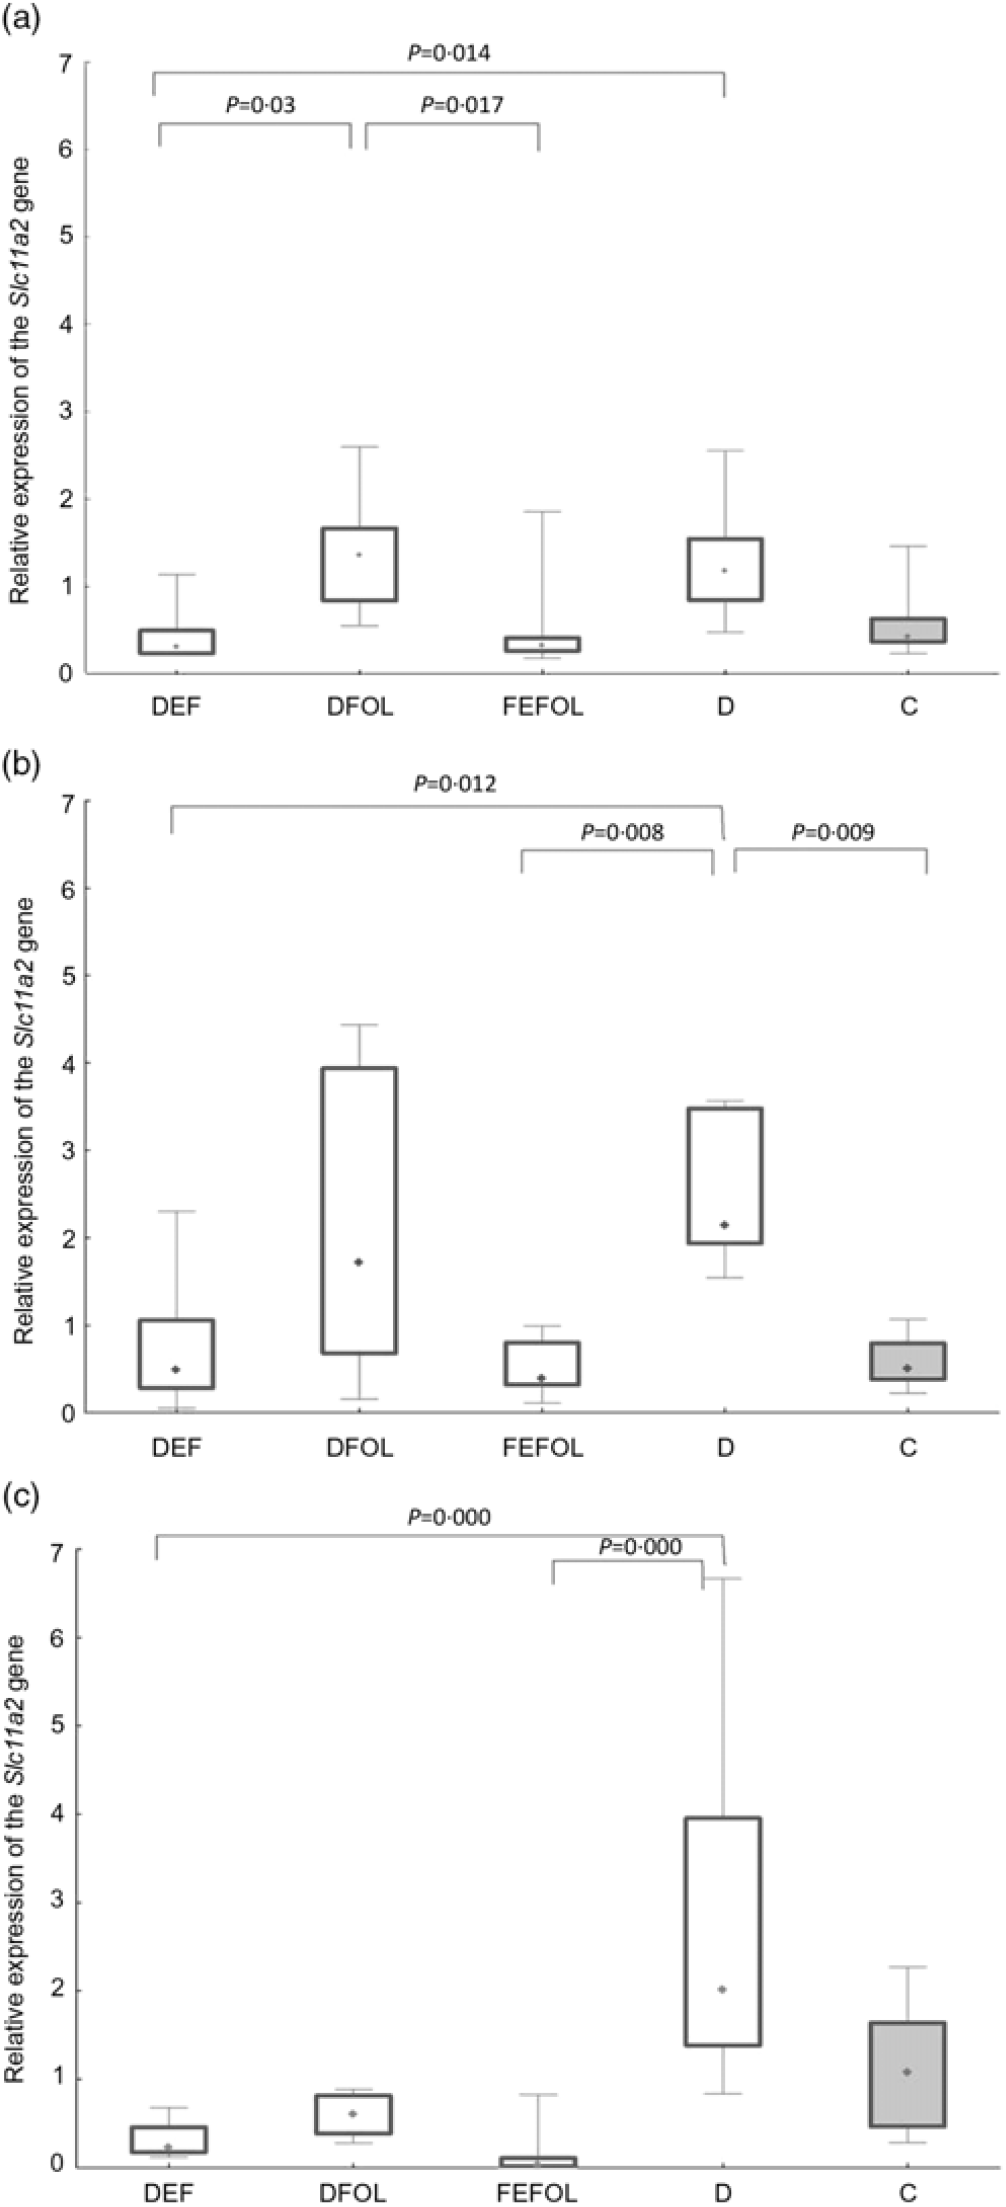
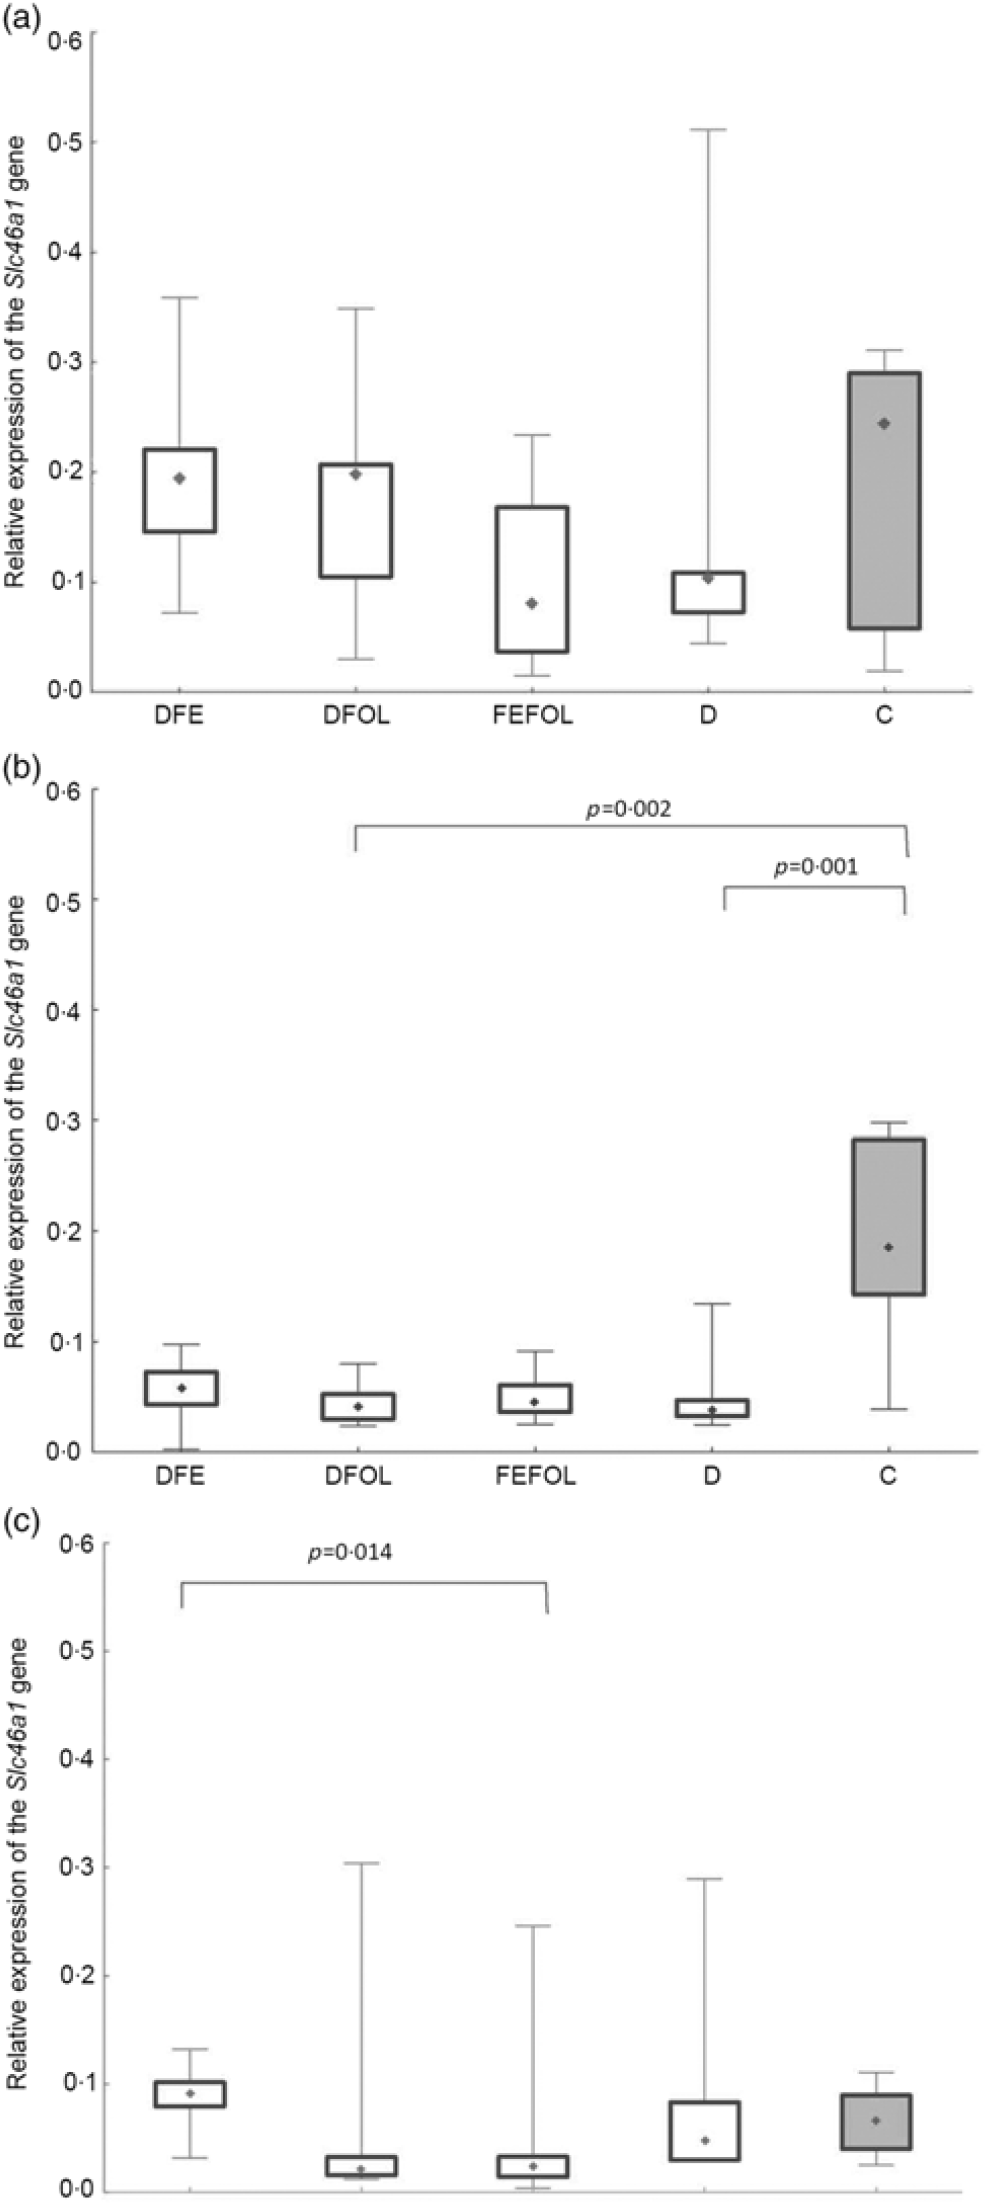
We attempted to determine how the dietary regimen affected the expression of the genes that code for transporters of FA (SLC46A1) and Fe (SLC11A2) in the duodenum. We saw lower transcript levels of Slc11a2 in the DFE than in the D animals at all three points in time (P < 0·01; Fig. 2). However, there were no differences between the DFE and the C group (Fig. 2). At the second and third time points, significantly lower expression of Slc11a2 in the FEFOL group than in the D group was observed (P < 0·01 and P < 0·001, respectively). We observed intergroup differences in Slc46a1 gene expression on day 2 of the experiment (Fig. 3), but after 10 d, its expression was higher in the C group than in the DFOL (P < 0·01) and D groups (P < 0·001) (Fig. 3). After 21 d on the diets, the DFE group had higher expression of Slc46a1 than the FEFOL group (P < 0·05; Fig. 3).
Relative expression of the Slc11a2 gene in the duodenum at (a) the first (n 9–10 per group), (b) the second (n 9–10 per group) (c) and third time points (n 4–10 per group). DFE, diet deficient in folic acid and supplemented with iron; DFOL, diet deficient in iron and supplemented with folic acid; FEFOL, diet supplemented with iron and folic acid; D, diet deficient in iron and folic acid; C, control diet. (a) ( ), Median; (
 ), 25–75 %; (
 ), range within 1·5 interquartile range (IQR). (b) (), Median; (), 25–75 %; (), range within 1·5 IQR. (c) (), Median; (), 25–75 %; (), range within 1·5 IQR.
Relative expression of the Slc46a1 gene in the duodenum at (a) the first (n 9–10 per group), (b) the second (n 7–10 per group) and (c) the third time points (n 6–10 per group). DFE, diet deficient in folic acid and supplemented with iron; DFOL, diet deficient in iron and supplemented with folic acid; FEFOL, diet supplemented with iron and folic acid; D, diet deficient in iron and folic acid; C, control diet. (a) (), Median; (), 25–75 %; (), range within 1·5 interquartile range (IQR). (b) (), Median; (), 25–75 %; (), range within 1·5 IQR. (c) (), Median; (), 25–75 %; (), range within 1·5 IQR.
We also analysed the protein levels of FA and Fe transporters, but we did not observe any differences in the relative protein levels between the groups at any time point (online Supplementary Figs. S1–S5).
Concentrations of plasma TIBC, unsaturated Fe binding capacity, Fe, folate and Hcy were compared between the groups after 2, 10 and 21 d of feeding animals with the experimental diets. After 2 d on the experimental diets, the rats in the DFE groups had lower concentrations of TIBC than in the D group (P < 0·01; see Table 5). Similar results were observed after 21 d (P < 0·001). However, we did not find any differences in serum Fe concentrations between the groups. Folate concentrations after day 2 were highest in the C group (P < 0·001). After the second sample collection day, the FA deficient groups (DFE, D) had significantly lower FA concentrations than the supplemented groups (DFOL, FEFOL) and the C group (P < 0·001). We also examined Hcy plasma concentrations. After 10 and 21 d, we observed that the FA supplemented rats (DFOL and FEFOL), as well as the C group, had significantly lower Hcy concentrations than the two FA deficient groups (P < 0·001; see Table 5). At the third time point, we observed significantly higher Hb concentrations in the FEFOL and C groups than in the D group (P < 0·01; see Table 6). Haematocrit was highest in the C group (P < 0·01). Mean corpuscular Hb concentration was significantly highest in the DFE group (P < 0·01).
Concentration of blood metabolites across sample collection days (n 9 (lack of data) or 10 per group)
(Mean values and standard deviations)
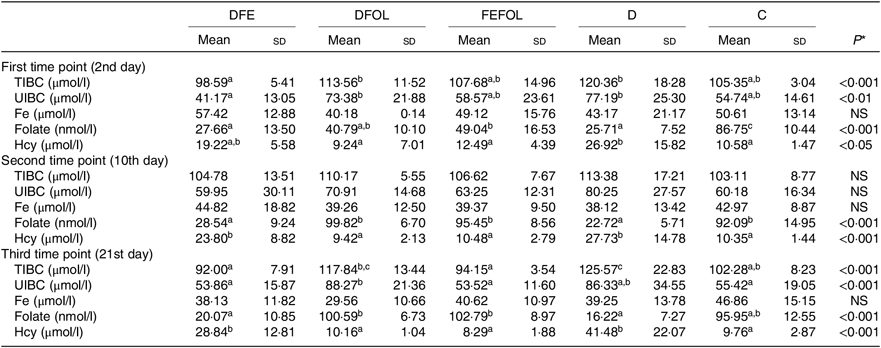
DFE, diet deficient in folic acid and supplemented with Fe; DFOL, diet deficient in Fe and supplemented with folic acid; FEFOL, diet supplemented with Fe and folic acid; D, diet deficient in Fe and folic acid; C, control diet; TIBC, total Fe binding capacity; UIBC, unsaturated Fe binding capacity; Hcy, homocysteine.
a,b Mean values within a row with unlike superscript letters are significantly different (P<0·05; Scheffé’s test).
* P values show the significance levels for differences between dietary groups within sample collection days.
Concentrations of morphological parameters (n 9 (lack of data) or 10 per group)
(Mean values and standard deviations)
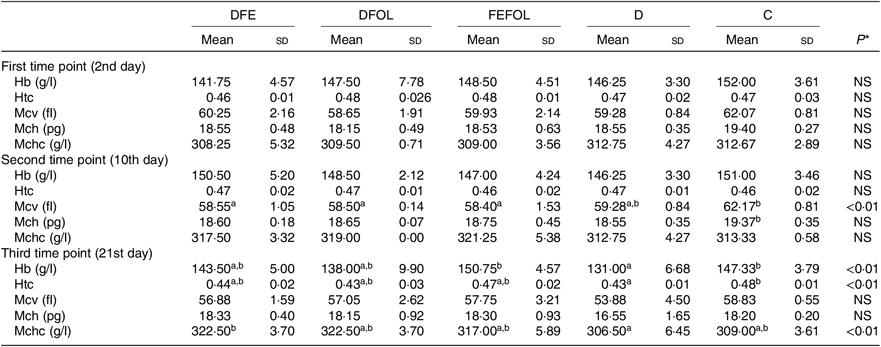
DFE, diet deficient in folic acid and supplemented with Fe; DFOL, diet deficient in Fe and supplemented with folic acid; FEFOL, diet supplemented with Fe and folic acid; D, diet deficient in Fe and folic acid; C, control diet; Htc, haematocrit; Mcv, mean corpuscular volume; Mch, mean corpuscular Hb; Mchc, mean corpuscular Hb concentration.
a,b Mean values within a row with unlike superscript letters are significantly different (P<0·05; Scheffé’s test).
* P values show the significance levels for the differences between dietary groups within sample collection days.
Discussion
The aim of the present study was to determine how FA and Fe deficiencies in rats, followed by dietary supplementation with these nutrients, affect the expression of folate and Fe transporters, and thereby FA and Fe status. As far as we know, this is the first time that the expression of these transporters has been analysed in a model that considers both deficiency of and supplementation with Fe and folate. Furthermore, the responses to the diets were observed at three time points, and the Fe and folate doses used reflected the amounts found in supplements.
We observed lower transcript levels of Slc11a2 in the DFE than in the D animals at all three time points. This suggests that Fe supplementation during folate deficiency leads to decreased expression of Slc11a2. This is consistent with other studies in which the effect of Fe deficiency has been investigated in the duodenum, resulting in the increased expression of Slc11a2 (Reference Trinder, Oates and Thomas28). Similar effects have also been observed in other tissues by others(Reference Siddappa, Rao and Wobken29). In our study, significantly lower expression levels of Slc11a2 were observed in the FEFOL group than in the D group at the second and third time points, which shows that the nutritional regimen triggered the response on the level of transcription. We did not observe any alterations between the groups in terms of protein levels after the supplementation period. This was most likely due to other transporters(Reference Morgan and Oates30) and regulatory mechanisms which we have not investigated, such as two motifs in the 5′ regulatory region(Reference Lee, Gelbart and West31), ubiquitination and proteasome degradation mediated by proteins like Ndfip1 and Ndfip2(Reference Foot, Dalton and Shearwin-Whyatt32).
We also determined whether the changes in gene expression were related to metabolic parameters. Analysis of Fe metabolism showed that, at the first time point, TIBC and unsaturated Fe binding capacity concentrations were highest in the D group, but we did not observe any differences in the Fe concentrations. At the second time point, no between-group differences were observed, which may suggest that the animals adapted through compensatory mechanisms to the deficiency. In turn, at the third time point, we again observed the highest concentrations of TIBC in the D group, which may suggest that a longer period of deficiency led to alterations in the metabolic profile. This result is in line with the results concerning Slc11a2—expression of this gene was highest in the D group. Also at the third time point, no differences were seen between the FEFOL and the DFE group on either the transcript or metabolic level. The lack of such differences in serum Fe concentrations may be a result of Fe homeostasis regulation by hepcidin or other mechanisms(Reference Wallace33).
The mechanisms by which the Slc46a1 gene is transcriptionally regulated are still not well understood. The special role of this transporter was established after the discovery that its dysfunction leads to hereditary folate malabsorption(Reference Shin, Mahadeo and Min34). The close regulation of Slc46a1 activation during deficiency and repletion states is crucial for folate homeostasis. In the present study, after 21 d of supplementation, different expression levels of Slc46a1 mRNA expression were observed in the DFE and the FEFOL groups. This is in agreement with previous observations that a diet deficient in FA leads to increases in the transcription of transporter genes(Reference Qiu, Min and Jansen35). It has also been shown in a male mice model that folate deficiency causes a thirteen-fold increase of Slc46a1 mRNA levels in mice fed deficient v. replete diet for 8 weeks(Reference Qiu, Min and Jansen35). However, we did not see any differences between the FEFOL and D groups. Nevertheless, this lack of statistically significant between-group difference may be explained by the high standard deviations in the D group. Surprisingly, after 10 d of supplementation, the expression level of Slc11a2 was lower in the D than in the C group. This may suggest that other transporters, such as reduced folate transporter (SLC19A1), contributed to this effect, as other studies have shown(Reference Liu, Ge and Cabelof36). An earlier in vivo study showed that FA deficiencies also lead to an increase in the level of Slc19a1 mRNA and protein(Reference Wani, Thakur and Kaur37). Our study investigated only one FA transporter, and so we may not have observed the difference between the deficient and the C groups.
A study somewhat similar to ours has shown that oversupplementation with folate by a factor of 10 resulted in a decrease in levels of reduced folate transporter and Pcft protein, but no changes were observed on the mRNA level(Reference Dev, Ahmad Wani and Kaur38). A previous cell culture study showed that oversupplementation of FA results in decreased mRNA levels not only of Slc46a1 but also of reduced folate transporter and folate receptor(Reference Ashokkumar, Mohammed and Vaziri39). However, these differences were observed in an in vitro model, while we performed an in vivo investigation. A study using a laying hen model has shown jejunal Slc46a1 mRNA down-regulation by dietary 5-MTHF supplementation, but not by FA supplementation(Reference Jing, Tactacan and Rodriguez-Lecompte40). Differentiation between models, treatment times, doses and nutritional regimen may have led to such inconsistent results.
Interestingly, when we analysed folate concentrations between groups at different time points, we observed that, at the second and third time points, folate concentrations were similar in the DFOL, FEFOL and C group. This suggests that FA supplementation, as well as simultaneous FA and Fe supplementation, gives the same metabolic results. In other studies, high doses of FA (ten times the normal requirements) resulted in increased FA serum levels(Reference Dev, Ahmad Wani and Kaur38). In our study, the DFE and FEFOL diets were designed to be similar to the doses provided by common supplements. However, the amounts of FA and Fe used, as well as the time of administration, did not result in increased FA concentrations in serum. FA supplementation also affected other metabolic parameters; in particular, Hcy concentrations were significantly lower in the DFOL, FEFOL and C groups than in the DFE and D groups at all three time points, which is consistent with previous findings(Reference Cui, Li and Lv41).
At the third time point, differences were seen in Hb, haematocrit and the mean corpuscular Hb concentration. Interestingly, the highest Hb concentrations were in the FEFOL group as well as in the C group, which indicates that only simultaneous supplementation with FA and Fe compensates for the decreased Hb concentrations caused by the earlier period of the diet deficient with these nutrients. Although Hb concentrations in the DFE and FEFOL groups were in line with the activation of Slc11a2 and Slc46a1 transcription, we surprisingly did not observe any differences between groups at the protein level. However, we observed that the lowest median protein levels were in the DFEFOL group (insignificant). In vitro and in vivo studies have shown that oversupplementation with FA results in decreased uptake of this nutrient by cells(Reference Dev, Ahmad Wani and Kaur38,Reference Ashokkumar, Mohammed and Vaziri39) . Our study did not find a beneficial effect of FA supplementation or of simultaneous FA and Fe supplementation on plasma FA concentrations. These metabolic results are consistent with the expression of Slc46a1 at the mRNA and protein levels, which did not differ between the DFOL, DFEFOL and C groups, except for the significant difference in Slc46a1 mRNA expression in the DFOL and C groups at the second time point. The significantly lower concentration of FA in the D and DFE groups also agrees with the Slc46a1 mRNA differences between the DFE and FEFOL groups at the third time point.
The strength of our study is that it simultaneously investigates the expression of genes related to folate and Fe metabolism on the transcriptional and translational levels but also considers the metabolic response to short-, medium- and long-term dietary regimens. One limitation of our study is that it analysed only a few Fe and FA transporters.
Conclusions
The results of the present investigation show that FA and Fe deficiency in the rat, with subsequent dietary supplementation with 6 mg FA and 150 mg Fe per kg of diet, may affect transcription of genes that encode folate and Fe transporters, but not protein abundance. FA supplementation led to decreased Hcy levels, but this result seems unrelated to Pcft. Simultaneous supplementation with FA and Fe resulted in significantly higher Hb concentration than did supplementation with these nutrients alone. This physiological effect was reflected by changes in gene transcription, but not in protein levels. Most likely, other transporters and factors are responsible for this effect. Further studies are needed to better understand the mechanisms involved.
Acknowledgements
This research was funded by the Polish National Science Centre, grant number 2015/17/B/NZ7/02952. The Polish National Science Center had no role in the design, analysis or writing of this article.
A. R. drafted the manuscript, carried out biochemical and molecular analyses and analysed the data; J. S. designed the study; P. K. performed protein analysis; A. C. designed the study, performed gene transcription analysis and analysed the data.
There are no conflicts of interest.
Supplementary material
For supplementary materials referred to in this article, please visit https://doi.org/10.1017/S0007114519002721



