


Globally, 9·3 % of adults (aged 20–79) years were living with diabetes, and 11·3 % of deaths were attributable to diabetes in 2019(1). The prevalence of diabetes in China has reached 10·9 % in 2019(1). It is estimated the total diabetes-related health expenditure reached United States Dollar (USD) 760 billion in 2019(1). Diabetes-related cost in China was USD 109 billion(1), of which more than half (53 %) was spent on its complications(Reference Palmer, Caputo and Foos2). Prevention is becoming paramount to avoid the health burden by tackling the modifiable lifestyle behaviour factors associated with diabetes(Reference Kolb and Martin3).
Continuous effects have been made to study the impact of egg consumption on the risk of diabetes considering that eggs have become a common food in the last three decades in China. Eggs provide essential nutrients including protein, carotenoids, arginine and folate, while its high level of cholesterol has been associated with the increased risk of diabetes from laboratory tests involving impaired insulin secretion(Reference Wijesekara, Zhang and Kang4). Also, the experiment reported egg hydrolysate inhibited the intestinal α-glucosidase to delay carbohydrate absorption(Reference Shin, Xun and Nakamura5), but another study showed that daily consumption of lactic-fermented egg white reduced serum cholesterol in men and alleviated the metabolic syndrome(Reference Shirouchi and Matsuoka6). A meta-analysis of twelve cohorts studies including 219 979 participants showed a 39 % (95 % CI 21 %, 60 %) higher risk of diabetes mellitus comparing the highest with the lowest egg consumption in US studies but not in non-US studies(Reference Djousse, Khawaja and Gaziano7). Studies on egg consumption and diabetes are limited in Asia with conflicting results. For example, a study conducted in Japan found no association between egg intake and type 2 diabetes in either men or women(Reference Kurotani, Nanri and Goto8). Two cross-sectional studies were conducted in China with one reported positive association(Reference Shi, Yuan and Zhang9) and the other showed no association(Reference Ni, Du and Huang10).
Current international dietary guidelines are inconsistent for egg intake. For example, the 2015–2020 Dietary Guidelines for Americans and the 2016 Chinese Dietary Guidelines have no specific recommendations for cholesterol or egg consumption(11,12) . Mediterranean Diet Pyramid (Spain) recommends 2–4 eggs weekly but no specific recommendation for cholesterol consumption(Reference Abellan Aleman, Zafrilla Rentero and Montoro-Garcia13).
It should be noted that when a single food (group) is studied, others cannot be ignored. For example, higher egg consumption is often accompanied by higher red meat consumption in US studies, which is independently associated with diabetes(Reference Sabate, Burkholder-Cooley and Segovia-Siapco14). In the Chinese population, eggs were consumed with fast food, milk and meat as a cluster which has been associated with a group of cardiometabolic risks(Reference Li and Shi15). Dietary patterns, other lifestyle behaviours and cooking methods that closely related to egg consumption should be taken into account if possible.
Considering the controversial, inconsistent evidence and the methodology pitfalls, we aimed to fill the knowledge gap by exploring the egg consumption and its trajectory during 1991–2009 as well as the longitudinal association with diabetes among adults in the China Health and Nutrition Survey.
Materials and methods
Study design and study sample
This is a longitudinal association study based on repeated measurements of dietary intake during 1991–2009 and diabetes in 2009 using China Health and Nutrition Survey data.
The China Health and Nutrition Survey is an ongoing open prospective household-based cohort study conducted in nine provinces in China(16). China Health and Nutrition Survey uses a multistage random-cluster sampling process to select samples in both urban and rural areas. Nine waves of diet data collection during 1989–2011 have been completed. The overall response rate was >60 % based on the first survey in 1989 and >80 % based on the previous year(Reference Popkin, Du and Zhai17). Briefly, a total of 20 741 participants aged ≥18 years who attended at least one nutrition survey during 1991–2009 were followed for up to 18 years (median 6 years, interquartile range (IQR) 0–13 years). Among them, 5864 participated once and 2425 attended all seven surveys. The number of participants in 1991, 1993, 1997, 2000, 2004, 2006 and 2009 was 9229, 8838, 9487, 10 392, 9718, 9594 and 9942, respectively. In the current analysis, 8545 adults with measurements of fasting blood samples in the 2009 survey and food consumption during 1991–2009 were included (online Supplementary Fig. S1). The food intake of this cohort was followed for an average of 11 (sd 7) years (median 12, IQR 3–18 years). The survey was approved by the institutional review committees of the University of North Carolina (USA) and the National Institute of Nutrition and Food Safety (China). Informed consent was obtained from all participants.
Outcome variable
The primary outcome was diabetes in 2009 defined as fasting plasma glucose ≥ 7·0 mmol/l. Fasting blood was taken early in the morning and prepared for a further test in a national central lab in Beijing (medical laboratory accreditation certificate ISO 15189: 2007). Fasting plasma glucose was measured with the enzymatic photometric test (GOD-PAP) (Randox Laboratories Ltd). All the measurements and tests were collected using standard protocol by trained staff. The detailed data collection protocol was described elsewhere(16).
Exposure variables: mean egg intake
At each round of the survey, individual dietary intake data were collected by a trained investigator conducting a 24-h dietary recall on each of three consecutive days(Reference Zhai, Du and Wang18). Besides, foods and condiments in the home inventory, foods purchased from markets or picked from gardens and food waste were weighed and recorded by interviewers at the beginning and end of the 3-d survey period. At the household level, all the foods consumed during the survey period were weighed and assigned to each household members. Food consumption data were converted to nutrient intake using the Chinese Food Composition Table(Reference Yang19).
Egg consumption in the present study included the ‘egg’ group in the Chinese Food Composition Table(Reference Yang19). They were chicken eggs, duck eggs, goose eggs, quail eggs and food containing eggs. We calculated the mean intake of the eggs during 1991–2009 to reduce variation within individuals and to represent long-term habitual intake. For example, if the egg consumption of a participant was x, y, z in 1991, 1993 and 2009, the mean egg intake = (x + y + z)/3, and the corresponding Stata command: bysort id (wave): gen mean_egg = sum (egg)/sum (egg<.).
Covariates
Socio-demographic and lifestyle factors were collected at each survey using a structured questionnaire. The following constructed variables were included to reflect socio-economic status: education (low: illiterate/primary school; medium: junior middle school; high: high middle school or higher), per capita annual family income (recoded into tertiles as low, medium and high) and urbanisation levels (recoded into tertiles as low, medium and high).
Height, weight and blood pressure were measured at each round. Overweight/obesity was defined as BMI ≥ 25 kg/m2. Hypertension was defined as systolic blood pressure above 140 mmHg and/or diastolic blood pressure above 90 mmHg or having known hypertension.
Physical activity level (metabolic equivalent of task) was estimated based on self-reported activities (including occupational, domestic, transportation and leisure-time physical activity) and duration using a Compendium of Physical Activities. Smoking and alcohol drinking status were categorised as yes or no.
Mean fruit and vegetable consumption from the corresponding food groups, energy and macronutrients (energy content, carbohydrates, fat and protein) during 1991–2009 were calculated. It is highly likely that egg consumption is an indicator of a certain dietary pattern. To separate the effect of eggs from the overall dietary pattern, dietary pattern was adjusted as a confounding factor. In the analyses, we adjusted for two dietary patterns (traditional pattern and modern dietary pattern), which were identified by factor analysis using the standard principal component analysis method(Reference Li and Shi15). The ‘Traditional’ pattern was highly loaded with rice, meat and vegetables, while the ‘Modern’ pattern had high loadings of fast food, milk, eggs and deep-fried food(Reference Li and Shi15). Implausible low or high energy intake per d (<2092 kJ (<500 kcal) or ≥20 920 kJ (≥5000 kcal)) was excluded to minimise reporting error(Reference Banna, McCrory and Fialkowski20).
Statistical analysis
Sample characteristics were presented and compared by egg intake quartiles using ANOVA for continuous measures (e.g. age, food and nutrients intake) or χ 2 tests for categorical ones (e.g. sex, income and education levels).
Egg consumption trend was categorised using the ‘traj’ command (trajectory modelling) in STATA among those having attended at least three waves of the dietary survey between 1991 and 2009 (age ≥ 20 years, n 10 495). The following criteria were used to determine the number of trajectory groups(Reference Nagin, Jones and Passos21): (1) lowest Bayesian information criterion; (2) each group should have at least 5 % of the participants and (3) average posterior probability of group membership for each trajectory above 0·70. We followed the procedure suggested by Andruff et al. (Reference Andruff, Carraro and Thompson22) to determine the number and order of the trajectory groups.
The association between egg intake, egg consumption trend and diabetes was assessed using logistic regression models. A set of models were built: model 1 adjusted for age, sex and socio-economic status (income, urbanisation and education); model 2 adjusted additionally for behavioural factors (smoking, alcohol drinking, physical activity and dietary patterns) and health factors (overweight/obesity and hypertension); model 3 included the variables in model 2 and further adjusted for serum cholesterol, and energy intake.
To test the interaction between egg intake and other covariates (demographic, socio-economic factors, BMI or hypertension), a product term of these two variables was put in the regression model. Sensitivity analysis was conducted by including only participants who attended all rounds of the nutrition survey during 1991–2009 (online Supplementary Fig. S1).
All the analyses were performed using Stata 14.2 (Stata Corporation). Statistical significance was considered when P < 0·05 (two-sided).
Results
Mean daily egg consumption (age and sex-adjusted) during 1991–2009 was increased continuously from 16 g in 1991 and 1993 to 26 g in 2000 and 2004, to 31 g in 2009, nearly doubled during the study period (Fig. 1).
Age- and sex-adjusted daily egg consumption (g) and 95 % confidence intervals during 1991–2009. Numbers of participants: 9229 in 1991, 8838 in 1993, 9487 in 1997, 10 392 in 2000, 9718 in 2004, 9594 in 2006 and 9942 in 2009.

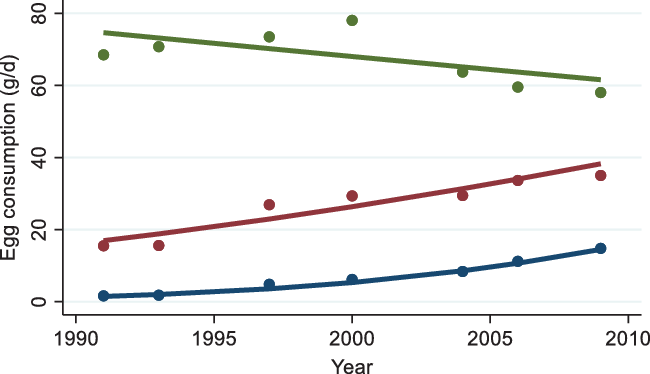
Three trajectory groups of egg consumption were identified (Fig. 2): group 1 (31 %) had low baseline intake and increased slightly; group 2 (62 %) had medium baseline intake and increased; and group 3 (7 %) had high baseline intake and decreased. Group 3 had the highest age and prevalence of diabetes among all the three groups (online Supplementary Table S1). The mean intakes of eggs in 2009 were 12·5, 36·3 and 63·8 g/d in group 1, group 2 and group 3, respectively.
Trajectory groups of egg consumption among adults attending China Health and Nutrition Survey between 1991 and 2009. Dots represent the mean intake at each time point in each trajectory group. Lines represent predicted values of intake in different trajectory groups of egg consumption. ![]() , Group 1 (30·7 %);
, Group 1 (30·7 %); ![]() , group 2 (62·2 %);
, group 2 (62·2 %); ![]() , group 3 (7·1 %).
, group 3 (7·1 %).
The mean egg consumption during 1991–2009 was 26·7 (sd 26·4, IQR 9–37·5) g/d (n 8545). Higher egg consumption was consumed in participants who were male, younger, having higher education or income, or living in the higher urbanised area; having higher BMI or blood pressure, drinking but not smoking, less physical activity, lower traditional dietary pattern score or higher modern dietary score, or less vegetable but more fruit consumption. Higher egg consumers also had higher protein, fat intake and serum cholesterol, but lower carbohydrates (Table 1).
Sample characteristics by quartiles of egg consumption among participants attending the China Health and Nutrition Survey in 2009 (n 8545)
(Numbers and percentages; mean values and standard deviations)

MET, metabolic equivalent of task.
* To convert cholesterol in mg/dl to mmol/l, multiply by 0·0259.
A total of 947 in 8545 participants (11·1 %) were detected having diabetes in 2009. The risk of having diabetes was higher in older adults (unadjusted OR 3·37 (95 % CI 2·76, 4·13) for those aged 46–64 years and OR 5·81 (95 % CI 4·69, 7·21) for those ≥ 65 years, compared with adults aged ≤ 45 years), living in a higher urbanised area (OR 1·53 (95 % CI 1·24, 1·89) relative to the lowest tertile of urbanisation) or having a high income (OR 1·30; 95 % CI 1·10, 1·54). The risk of diabetes was positively associated with overweight/obesity (OR 2·61; 95 % CI 2·27, 3·00), hypertension (unadjusted OR 2·91; 95 % CI 2·54, 3·35) and serum total cholesterol level (OR 1·012 (95 % CI 1·011, 1·013 for a 1 mg/dl increase). Physical activity level, fruit intake and the traditional dietary pattern were negatively associated with the risk of diabetes. Diabetes was not associated with smoking, drinking, vegetable or protein consumption (online Supplementary Table S2).
The prevalence of diabetes was higher among higher egg consumers during 1991–2009, increased from 8·1 % for those consuming ≤9·0 g/d to 11·2 % for 9·1–20·6 g/d, to 12·3 % for 20·7–37·5 g/d and to 12·7 % for ≥ 37·6 g/d consumers (P < 0·001) (Table 1). Compared with the first quartile (lowest consumers), the relative OR of diabetes were 1·44 (95 % CI 1·17, 1·77) for the second, 1·60 (95 % CI 1·31, 1·96) for the third and 1·65 (95 % CI 1·31, 1·96) for the fourth quartiles (P for trend < 0·001) (unadjusted OR in Table 2).
Diabetes by quartiles of mean egg consumption during 1991–2009 among participants in the China Health and Nutrition Survey (n 8545)*
(Odds ratios and 95 % confidence intervals)
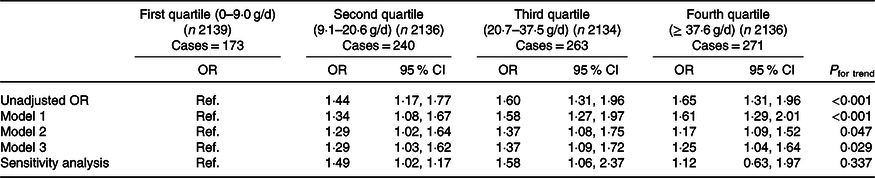
Ref., reference.
* Model 1 adjusted for age, sex, urbanisation, income and education. Model 2 adjusted for variables in model 1 and smoking, drinking, physical activity, dietary pattern, overweight/obesity and high blood pressure. Model 3 adjusted for variables in model 2 and serum cholesterol, and energy intake. Sensitivity analysis including participants attending all seven waves of the survey (n 2425).
The adjusted OR were attenuated but remained significant when adjusted for demographic and socio-economic factors (model 1), behavioural and health factors (model 2) and serum cholesterol and dietary factors (model 3). Specifically, as shown in model 3, the OR for the second, third and fourth quartiles of egg intake compared with the first quartile (the lowest) were 1·29 (95 % CI 1·03, 1·62), 1·37 (95 % CI 1·09, 1·72) and 1·25 (95 % CI 1·04, 1·64), respectively (P for trend = 0·029). Sensitivity analysis including those participating in all seven survey waves (n 2425) confirmed the positive association compared with the first quartile (the lowest intake) (adjusted OR 1·49 (95 % CI 1·02, 1·17) for the second, 1·58 (95 % CI 1·06, 2·37) for the third and 1·12 (95 % CI 0·63, 1·97) for the fourth quartiles) (Table 2).
The association between egg consumption and diabetes differed by sex. The sex-specific OR are presented in Table 3. For the same amount of egg consumption of second and third quartiles, women were 73 % and twice more likely to have diabetes than men (OR of interaction term for the second 1·73 (95 % CI 1·24, 2·43), P = 0·017; for the third quartile 2·09 (95 % CI 1·49, 2·94), P = 0·002). The association between diabetes and egg consumption was not different stratified by other significant factors associated with diabetes such as age, weight status, hypertension and serum cholesterol.
Quartiles of mean egg consumption during 1991–2009 stratified by sex among participants in the China Health and Nutrition Survey (n 8545)
(Number of diabetes cases; adjusted odds ratios and 95 % confidence intervals)
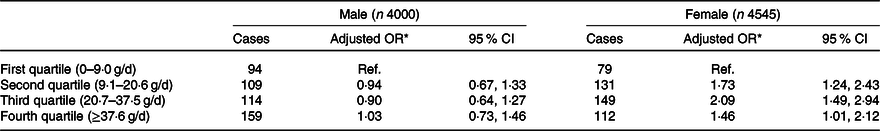
Ref., reference.
* OR adjusted for age, urbanisation, income, education, smoking, drinking, physical activity, dietary pattern, overweight/obesity, high blood pressure, serum cholesterol and energy intake.
Compared with the trajectory group with low baseline intake but increased egg consumption (group 1), group 2 of the medium baseline intake and increased and group 3 of high baseline intake but decreased were associated with increased risk of diabetes (Table 4). In the unadjusted model, group 2 and group 3 had OR for diabetes of 1·29 (95 % CI 1·08, 1·54) and 2·93 (95 % CI 2·06, 4·18), respectively. The associations were attenuated after adjusting for confounding factors. Among participants attended all the seven waves of dietary survey, egg trajectory in group 2 was associated with 47 % increased risk of diabetes (OR 1·47; 95 % CI 1·04, 2·09).
Association between trajectory of egg consumption during 1991–2009 with diabetes in 2009 among participants in the China Health and Nutrition Survey (n 6224)*
(Odds ratios and 95 % confidence intervals)
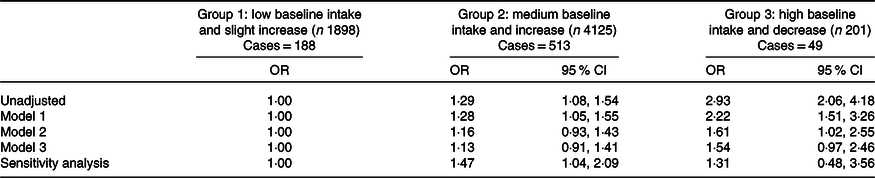
* Model 1 adjusted for age, sex, urbanisation, income and education. Model 2 adjusted for variables in model 1 and smoking, drinking, physical activity, dietary pattern, overweight/obesity and high blood pressure. Model 3 adjusted for variables in model 2 and serum cholesterol, and energy intake. Sensitivity analysis including participants attending all seven waves of the survey (n 2246).
Discussion
The egg consumption per capita in the sample increased from 16 g/d in 1991 to 31 g/d in 2009, with an average of 26·7 g/d. The per capita egg consumption in the same period was 33·65 g/d in Europe, 28·43 g/d in America, 20·56 g/d in Asia, 21·45 g/d in the world, 18·20 g/d in Oceania and 5·93 g/d in Africa(23). The data indicated egg consumption in Chinese adults was lower than that of European and American but higher than that in the world and Asia. With regard to egg consumption trends, most of the participants (93 %) with the low or medium baseline intake increased their consumption during the study period continuously, while only 7 % of adults with the highest baseline egg consumption decreased but remained higher than others. During the study period in China, the per capita gross domestic product (GDP) increased dramatically (from 1192 to 26 180 RMB)(24), while the egg price increased slowly (from 0·78 to 0·96 USD/kg)(23), the rice price doubled (from 0·12 to 0·28 USD/kg)(23) and the pork price nearly quadrupled (from 0·41 to 1·58 USD/kg)(23). The affordability of eggs might be an enabler to drive the increased egg consumption in most of our study population.
We found in this prospective study that higher long-term egg consumption increased the risk of diabetes among Chinese adults by approximately 25 % (comparing the fourth to first quartiles of the intake). The positive association was further confirmed by using consumption trend analysis indicating higher egg consumption, whether increased or decreased during the study period, predicting elevated risk of diabetes, specifically, habitual intake of one egg per d increased risk of diabetes by 60 % as compared with those with a quarter egg per d. The result was generally consistent with a meta-analysis of twelve cohort studies reporting a 39 % increased risk(Reference Djousse, Khawaja and Gaziano7). Similarly, among two large cohorts aged over 40 years included in the Physicians’ Health Study (1982–2007) and Women’s Health Study (1992–2007) in the USA, the consumption of ≥7 eggs/week compared with no consumption has been associated with a 58 % increased risk in men and 77 % in women(Reference Djousse, Gaziano and Buring25). However, the Finnish prospective study following a cohort of 2332 middle-aged men for 19·3 years has reported that egg intake of >45 g/d compared with <14 g/d decreased the risk by 38 %(Reference Virtanen, Mursu and Tuomainen26). The Spanish SUN project, a 6·6-year prospective follow-up study among adults, and the Japan Public Health Center-based prospective cohort study among adults over 45 years old did not found any association between egg consumption and diabetes(Reference Kurotani, Nanri and Goto8,Reference Zazpe, Beunza and Bes-Rastrollo27) . The positive association in the US studies and null or reverse in Nordic, Mediterranean and Japanese studies could be explained by the context of dietary patterns, not exclusively on the amount of egg intake. For example, the dietary pattern of high egg consumption was mostly accompanied by high consumption of butter, snacks, sweets and desserts, and refined grains in the USA(Reference Strate, Keeley and Cao28), which could increase the workload on islets and weaken the sensitivity of insulin(Reference Mazidi, Kengne and Mikhailidis29). The per capita fat intake and egg consumption in the Mediterranean and Nordic countries are not low(23), but the diet is dominated with whole grains, vegetables, fruits, legumes, fish, dairy products and unsaturated fat, these foods and their metabolites are beneficial for diabetes(Reference Laster and Frame30), similar to the Japanese diet. China has been undergoing substantial nutrition transition in the past three decades manifested by a shift of traditional diet with grains and vegetables to one with increased meat, oil, snacks or energy-dense food(16). Whether dietary pattern was adjusted in those studies remained questionable. Besides, the differences could be explained by diversity in the study population, egg intake measurements, the reference for comparison, follow-up period, the ascertain of diabetes and confounders adjusted.
We found that with the same amount of egg consumption, women were significantly more likely than men to develop diabetes, consistent with other studies(Reference Shi, Yuan and Zhang9,Reference Djousse, Gaziano and Buring25) . Female hormone and dietary preference might explain the result. Androgens were inversely related to the risk of diabetes by increasing insulin sensitivity and lean body mass(Reference Harada31). Women prefer cakes, soft drinks and snacks, most of which are ultra-processed food(Reference Zobel, Hansen and Rossing32), increasing the risk of diabetes. The sex difference in the association between the trend of egg consumption and diabetes was not observed possibly indicating the amount of egg consumption, rather than the trend was associated with diabetes, or both men and women increased egg consumption at the rate not different enough to detect the sex difference.
Potential mechanisms underlying the eggs and diabetes association have been investigated. Egg white hydrolysate could promote adipocyte differentiation via insulin-mimetic and sensitising actions(Reference Jahandideh, Chakrabarti and Davidge33) and α-glucosidase inhibitory activity, thereby inhibiting the hydrolysis of dietary carbohydrates and preventing their absorption(Reference Yu, Yin and Zhao34). Choline from egg yolk can be transformed by gut microbiome to trimethylamine-N-oxide(Reference Miller, Corbin and da Costa35), which increases LDL oxidation and promote inflammation, a key component of the pathogenesis of diabetes(Reference Julia, Czernichow and Charnaux36).
To the best of our acknowledge, this is the first study conducted in a large sample in the Chinese adults to investigate the longitudinal association between long-term egg consumption and diabetes in a follow-up of 18 years to some participants. The use of mean intake between 1991 and 2009 from the 3-d dietary intake in combination with household food inventory provides a robust estimate of long-term habitual egg intake. Potential dietary measurement error was assessed by applying the ratio of reported energy intake to the BMR of ≤0·9 for underreporting(Reference Goldberg, Black and Jebb37), while ≥2·4 for overreporting(Reference Black, Coward and Cole38). The results showed that among the 8545 participants included in the association analysis, ninety fell in the underreporting group (forty-nine males and forty-one females; fifty-eight were aged under 45 years), while 589 in the overreporting group (451 females). This suggested the energy and food intake from the surveys in this analysis is generally plausible which was less likely to distort the association. The association was robust and confirmed by consumption trend analysis and sensitivity analyses. A series of confounding factors including socio-demographic, behavioural factors, nutrient intake, dietary pattern and health factors were adjusted.
Limitations of the study should be noted. Firstly, the blood sample was only available in 2009. In the 1991 and 1993 surveys, the history of diabetes was not asked, and the self-reported during 1997–2006 was less than 2 %, which was very low(Reference Xu, Wang and He39) and exaggerated the association with egg consumption; therefore, baseline self-reported diabetes was not included in the analysis. Secondly, food intake was assessed using 3-d 24-h recall method. Seasonal variation was not considered. Thirdly, there was no information on family history of diabetes. Fourthly, the lost to follow-up was high because of the dynamic open cohort study design. Among the 20 741 participants attending at least one or 10 495 participants attending at least three nutrition surveys, only 8545 or 6224 participants had blood glucose recorded in 2009. Finally, residual confounding is possible due to lack of data of ethnicity, cooking method and diabetes-related biomarkers, although comprehensive factors were adjusted for in the present study. Further well-controlled investigations of the impact of egg consumption on diabetes are warranted.
Conclusion
The egg consumption for most Chinese adults increased during the study period. Our study suggested higher egg consumption increased the risk of diabetes. With the same amount of intake, women were at increased risk of having diabetes than men. Dietary Guidelines for the Chinese population should be evidence-based, and a healthy diet incorporating egg consumption level should be promoted.
Acknowledgements
This research uses data from China Health and Nutrition Survey. The authors thank the National Institute of Nutrition and Food Safety, China Centre for Disease Control and Prevention, Carolina Population Centre, the University of North Carolina at Chapel Hill, the NIH (R01-HD30880, DK056350 and R01-HD38700) and the Fogarty International Centre, NIH for financial support for the CHNS data collection and analysis files from 1989 to 2006 and both parties plus the China-Japan Friendship Hospital, Ministry of Health for support for CHNS 2009 and future surveys.
This research received no specific grant from any funding agency, commercial or not-for-profit sectors.
Y. W. drafted, reviewed and revised the manuscript; M. L. and Z. S. conceived the study, analysed the data and interpreted the results, drafted, critically reviewed and revised the manuscript. M. L. and Z. S. were responsible for the work, had access to the data and controlled the decision to publish. All authors approved the final manuscript as submitted and agree to be accountable for all aspects of the work.
The authors declare that there are no conflicts of interest.
Supplementary material
For supplementary materials referred to in this article, please visit https://doi.org/10.1017/S0007114520003955


