


Chronic kidney disease (CKD) is common in the elderly population, and renal fibrosis represents the final pathway of nearly all chronic and progressive nephropathies(Reference Humphreys1). CKD and renal fibrosis affect half of the adults aged above 70 years and 10 % of world’s population(Reference Djudjaj and Boor2). Renal fibrosis is a pathological extension of the wound healing process in response to sustained inflammation after injury or stimuli(Reference Lee and Kalluri3,Reference Nastase, Zeng-Brouwers and Wygrecka4) . Excessive extracellular matrix deposition is a typical hallmark of the fibrotic process, which eventually leads to the destruction of kidney structure and function(Reference Nastase, Zeng-Brouwers and Wygrecka4). The main source of excessive extracellular matrix deposition in renal fibrosis is the myofibroblast, which originates from resident fibroblasts that have been exposed to profibrotic factors(Reference Nastase, Zeng-Brouwers and Wygrecka4). It is well accepted that transforming growth factor-β (TGF-β)-evoked epithelial–mesenchymal transition (EMT) is one of the important mechanisms during initiation and progression of renal fibrosis(Reference Huang and Susztak5,Reference Lovisa, Zeisberg and Kalluri6) .
Vitamin D is a prohormone and one of the important nutrients in the body(Reference Colotta, Jansson and Bonelli7). The classical function of vitamin D is the maintenance of calcium homoeostasis, with severe vitamin D deficiency resulting in rickets(Reference Bouillon, Marcocci and Carmeliet8). Vitamin D has its non-classical actions, especially anti-inflammatory and immunomodulatory(Reference Colotta, Jansson and Bonelli7,Reference Bouillon, Marcocci and Carmeliet8) . Vitamin D deficiency is defined as <50 nmol/l in serum 25-hydroxyvitamin D (25(OH)D) concentration(Reference Bouillon, Marcocci and Carmeliet8). Vitamin D deficiency is prevalent especially among pregnant women, children and the elderly(Reference Palacios and Gonzalez9–Reference Guan, Zhen and Tang11). Several epidemiological studies demonstrated that maternal vitamin D deficiency during pregnancy elevated risk of asthma and multiple sclerosis in offspring(Reference Poon, Mahboub and Hamid12,Reference Munger, Aivo and Hongell13) . Our previous study found that long-term vitamin D deficiency promoted prostatic hyperplasia and fibrosis through exacerbating local inflammation in middle-aged mice(Reference Zhang, Luo and Xu14). The kidney is the main organ that converts inactive vitamin D into active vitamin D. Active vitamin D then exerts its biological effects by activating the vitamin D receptor (VDR). Previous studies showed that treatment with vitamin D3 or its analogues attenuated renal fibrosis(Reference Ito, Waku and Aoki15,Reference Tan, Li and Liu16) . An early study suggested that VDR loss is a potential mechanism linking inflammation and EMT during renal fibrosis(Reference Xiong, Gong and Liu17). However, it is unclear whether vitamin D deficiency exacerbates renal fibrosis and functional impairment. This study speculates that vitamin D deficiency promotes renal fibrosis and functional impairment through TGF-β-mediated EMT.
The purpose of this study is to investigate the effects of long-term vitamin D deficiency on renal fibrosis and functional impairment in mice fed with vitamin D-deficient (VDD) diets. Our results provide experimental evidence that long-term vitamin D deficiency promotes renal fibrosis and functional impairment, at least partially, through aggravating TGF-β/Smad2/3-mediated EMT in middle-aged male mice.
Materials and methods
Chemicals and reagents
Recombinant human TGF-β1 was purchased from Cell Signaling Technology. 1,25-Dihydroxyvitamin D3 (1,25(OH)2D3) was from Sigma Chemical Co. 25(OH)D radioimmunoassay kit was purchased from DIAsource Inc. Antibodies against VDR, α-smooth muscle actin (α-SMA), N-cadherin, vimentin, pSmad2, pSmad3, Smad2/3 and Smad3 were from Cell Signaling Technology. Antibody against β-actin was from Santa Cruz Biotechnologies. Fast green FCF and direct red 80 were purchased from Sigma. The primers were synthesised by Shanghai Sangon Biological Engineering Technology and Service Company. ECL detection kit was from Pierce Biotechnology. All the other reagents were from Sigma or as indicated in the specified methods.
Animals and diets
The ICR mice (4–5 weeks old; male mice: 19–21 g; female mice: 18–20 g) were purchased from Beijing Vital River whose foundation colonies were all introduced from Charles River Laboratories, Inc. The animals were always allowed free access to food and water and maintained on a 12 h light–12 h dark cycle in a specific pathogen-free environment with controlled temperature (20–25°C) and humidity (50 (sd 5) %). Female mice were divided randomly into two groups: Control and VDD groups. Females in the Control group were fed with standard diets (Standard AIN93G Rodent diet with 25 μg vitamin D3/kg). Females in the VDD group were fed with VDD diets (with 0 μg vitamin D3/kg) for 4 weeks. For mating purpose, four females were housed overnight with two males starting at 21.00 hours. Females were checked by 07.00 hours the next morning, and the presence of a vaginal plug was designated as pregnant mice. Seventeen and nineteen pregnant mice in the Control group and the VDD group were obtained, respectively. According to the randomisation principle, eight dams in the Control group and ten dams in the VDD group were anaesthetised with phenobarbital sodium (50 mg/kg) and killed on gestational day 18. Serum was collected for the measurement of 25(OH)D concentration. The remaining pregnant mice in the Control group were fed with standard diets throughout pregnancy and lactation. After weaning, their pups continue to be fed with standard diets. In the VDD group, dams were fed with VDD diets throughout pregnancy and lactation. After weaning, their pups continue to be fed with VDD diets. All diets were purchased from TROPHIC Animal Feed High-tech Co. Ltd. Ten male pups and ten female pups in each group were killed on postnatal week (PNW)3 and PNW8. Fifteen male pups and fourteen female pups each groups were killed on PNW20. Fifteen male pups each groups were killed on PNW40. Serum was collected for measurement of 25(OH)D concentration and renal function. All kidneys were weighed and then calculated the kidney index (i.e. the ratio of kidney:body weight) using the following equation: kidney index = kidney weight (g)/body weight (g) × 100 %. Some kidneys were collected for immunoblot or fixed in 4 % paraformaldehyde for histological examination or immunohistochemistry. During experiment, animals were monitored twice per week for health status. No adverse events were observed. This study was approved by the Association of Laboratory Animal Sciences and the Center for Laboratory Animal Sciences at Anhui Medical University. All procedures on animals were performed in accordance with the Declaration of Helsinki and the guidelines for humane treatment set by the Association of Laboratory Animal Sciences and the Center for Laboratory Animal Sciences at Anhui Medical University.
Cell culture and treatment
HK-2 cell, a human proximal tubular cell line, was purchased from the Cell Bank of the Chinese Academy of Sciences (Shanghai, China). HK-2 cells were grown in the Dulbecco’s modified Eagle’s medium (DMEM) (Hyclone) supplemented with 100 U/ml of penicillin, 100 μg/ml streptomycin and 10 % fetal bovine serum (Gibco) at 5 % CO2, 37°C. Cells were divided into four groups: Control, 1,25(OH)2D3 (VitD3), TGF-β and VitD3 + TGF-β groups. In the VitD3 and VitD3 + TGF-β groups, cells were pretreated with 100 nmol/l 1,25(OH)2D3(Reference Hasan, Sonnenschein and Soto18) at 12 and 2 h before TGF-β1 (5 ng/ml). Cells were harvested at 36 h after TGF-β1 treatment.
Serum 25-hydroxyvitamin D measurement
Serum 25(OH)D was measured by a 25(OH)D radioimmunoassay kit with 125I-labelled 25(OH)D as a tracer(Reference Liu, Wang and Zhang19). The quality and reproducibility were determined through measuring the concentration of quality controls (low control 17·5 ng/ml; high control 47·3 ng/ml) provided with radioimmunoassay kits. In the present study, the controls fell within the acceptable range given by the manufacturer.
Renal function and histological examination
Serum creatinine was measured with HPLC. Serum uric acid and blood urea nitrogen were measured with colorimetric detection kits (Thermo Scientific). Renal tissues were fixed in 4 % paraformaldehyde for 24 h. Paraffin-embedded renal tissues were cut 5 μm thick and mounted upon glass slides. Sections were stained by haematoxylin–eosin for histological analysis. Renal histopathological alterations were evaluated using the criteria established by Solez and used previously by Conger(Reference Solez, Morel-Maroger and Sraer20,Reference Conger, Schultz and Miller21) . Changes were graded on a 0–2 scale in a double-blind fashion. There was a uniform correlation on sections from the same animal. Six fields of magnification 400× per section were examined and averaged by two different pathologists.
Immunohistochemistry
Immunohistochemistry was carried out based on the process as previously described(Reference Li, Xu and Zhu22). Briefly, paraffin-embedded renal tissue sections were deparaffinised and rehydrated in a graded ethanol series. After antigen retrieval and quenching of endogenous peroxidase, sections were incubated with α-SMA (1:100 dilution) monoclonal antibodies at 4°C overnight. The colour reaction was developed with the horseradish peroxidase-linked polymer detection system and counterstaining with haematoxylin. The α-SMA-positive cells were counted in six randomly selected fields from each slide at a magnification of 400×.
Total protein and nuclear protein extraction
For total protein extraction, renal tissue and HK-2 cells were lysed in ice-cold radio immunoprecipitation assay (RIPA) lysis buffer (50 mm TRIS-HCl, pH 7·4, 150 mm NaCl, 1 mm EDTA, 1 % Triton X-100, 1 % sodium deoxycholate, 0·1 % sodium dodecyl sulphate and 1 mm phenylmethylsulfonyl fluoride) supplemented with cocktail of protease and phosphatase inhibitors (Roche Diagnostics GmbH) and centrifuged at 14 000 g for 10 min at 4°C. The supernatant was collected as total protein. Nuclear protein was extracted according to the previous method(Reference Zhang, Luo and Xu14). Briefly, renal tissue was homogenised in 2 ml ice-cold PBS buffer (137 mm NaCl, 2·7 mm KCl, 10 mm Na2HPO4, 1·8 mm KH2PO4, pH 7·4) supplemented with cocktail of protease and phosphatase inhibitors (Roche Diagnostics GmbH) using a Kimble® Dounce Tissue Grinder (Large clearance pestle). The homogenate was filtered through a 300 mesh cell sieve and then centrifuged for 5 min at 1000 rpm. After removing the supernatant, cell pellets were resuspended in 1 ml ice-cold PBS containing 0·1 % NP-40 supplemented with 1 % cocktail of protease and phosphatase inhibitors and transferred to a 1·5 ml EP tube and then triturated ten times using a p1000 micropipette tip and centrifuged for 20 s at 10 000 rpm. The precipitate (pure nucleus) was resuspended in 150 μl RIPA lysis buffer in the presence of the protease and phosphatase inhibitor cocktail, incubated on ice for 30 min and centrifuged for 10 min at 14 000 g . The supernatant was collected as nuclear protein. Protein concentration was determined with BCA protein assay (Pierce) according to the instruction.
Immunoblots
For immunoblots, 10–20 μg of protein was separated electrophoretically by SDS-PAGE and transferred to a polyvinylidene fluoride (PVDF) membrane. The membrane was blocked in 5 % nonfat powdered milk in Dulbecco’s PBS overnight at 4°C and then incubated for 2–3 h with designated antibody at room temperature. After incubating with goat anti-rabbit IgG or goat anti-mouse IgG for 2 h, the membranes were coloured using an ECL detection kit. For total protein and nuclear protein, β-actin and Lamin A/C were used as loading controls, respectively.
Sirius red staining
Renal fibrosis was quantified with Sirius red staining as previously described(Reference Zhang, Luo and Xu14). Briefly, sections were deparaffinised and rehydrated in a graded ethanol series. The sections were incubated with an aqueous solution of saturated picric acid containing 0·1 % Fast green FCF and 0·1 % direct red 80 for 2 h at room temperature. The morphology of collagen fibres was captured with a light microscope equipped with a charge coupled device (CCD) digital camera (DP-71, Olympus). Quantification of collagen fibres was performed using six random selected fields each slide at a magnification of 100×. The percentage of collagen deposition was quantified using NIH ImageJ software (http://rsb.info.nih.gov/ij/).
Isolation of total RNA and real-time reverse transcription PCR
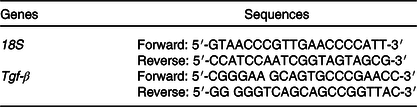
Total RNA in kidney tissue was extracted using TRI reagent. Real-time reverse transcription PCR was performed as previously described(Reference Zhang, Luo and Xu14). Briefly, RNase-free DNase-treated RNA (2·0 μg) was reverse-transcribed with AMV reagent (Promega). Real-time reverse transcription PCR was performed with a LightCycler® 480 SYBR Green I kit (Roche Diagnostics GmbH) using gene-specific primers as listed in Table 1. The amplification reactions were carried out on a LightCycler® 480 Instrument (Roche Diagnostics GmbH) with an initial hold step (95°C for 5 min) and forty-five cycles of a three-step PCR (95°C for 15 s, 60°C for 15 s and 72°C for 30 s). The comparative CT method was used to determine the amount of target, normalised to an endogenous reference (18S) and relative to a calibrator using the LightCycler 480 software (Roche, version 1.5.0).
Oligonucleotide sequence of primers for real-time reverse transcription PCR
Statistical analysis
All data were expressed as mean values with their standard errors. SPSS 13.0 statistical software was used for statistical analysis. All statistical tests were two-sided using an α level of 0·05. Student’s t test was used to determine differences between two groups in vivo study. ANOVA and the Student–Newman–Keuls post hoc test were used to determine differences among different groups in vitro study.
Results
Serum 25-hydroxyvitamin D concentration
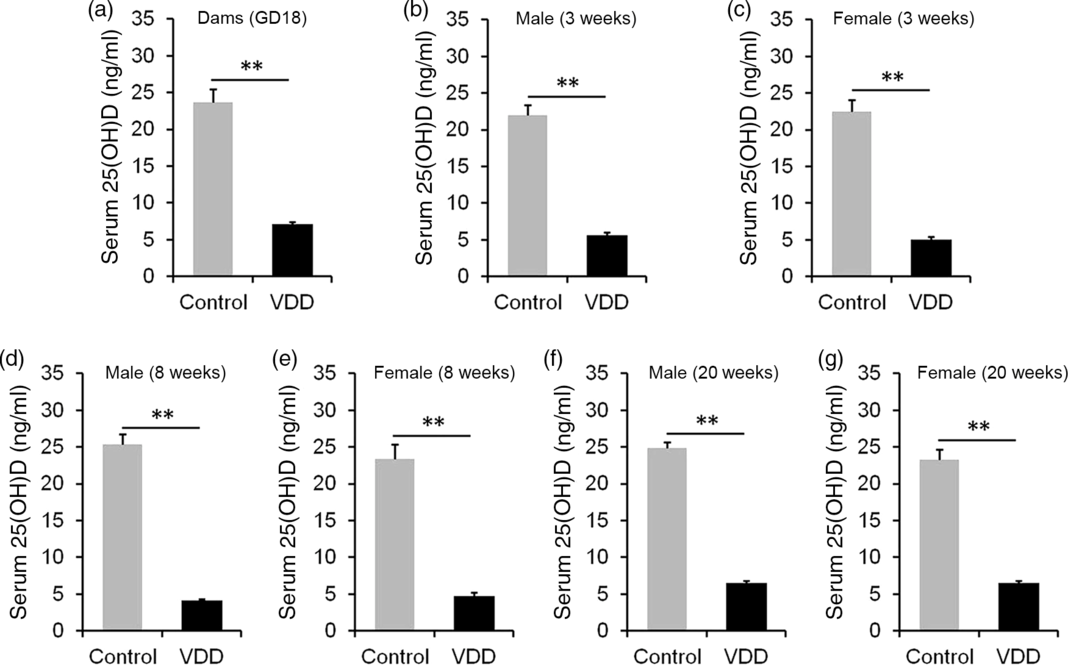
The concentration of 25(OH)D in maternal serum is presented in Fig. 1(a). As expected, serum 25(OH)D concentration was significantly reduced in VDD diet-fed pregnant mice. Serum 25(OH)D concentrations in male and female pups were then measured on PNW3, 8 and 20. As shown in Fig. 1(b), (d) and (f), serum 25(OH)D concentrations of VDD diet-fed male pups were significantly lower than those of controls at all time points. Similarly, serum 25(OH)D concentrations of VDD diet-fed female pups were lower than those of controls at all time points (Fig. 1(c), (e) and (g)).
Serum 25-hydroxyvitamin D (25(OH)D) concentration. All dams except controls were fed with vitamin D-deficient (VDD) diets throughout pregnancy and lactation. In the VDD group, all pups were fed with VDD diets. Eight dams in the control group and ten dams in the VDD group were killed on gestational day 18 (GD18). Some pups in each group were killed on either postnatal week (PNW)3 or PNW8 or PNW20. Serum 25(OH)D was measured by radioimmunoassay. (a) 25(OH)D in maternal serum. (b) Serum 25(OH)D of male pups on PNW3 (n 10). (c) Serum 25(OH)D of female pups on PNW3 (n 10). (d) Serum 25(OH)D of male pups on PNW8 (n 10). (e) Serum 25(OH)D of female pups on PNW8 (n 10). (f) Serum 25(OH)D of male pups on PNW20 (n 15). (g) Serum 25(OH)D of female pups on PNW20 (n 14). Data are mean values with their standard errors. **P < 0·01.
Effects of long-term vitamin D deficiency on kidney weight at different developmental stages
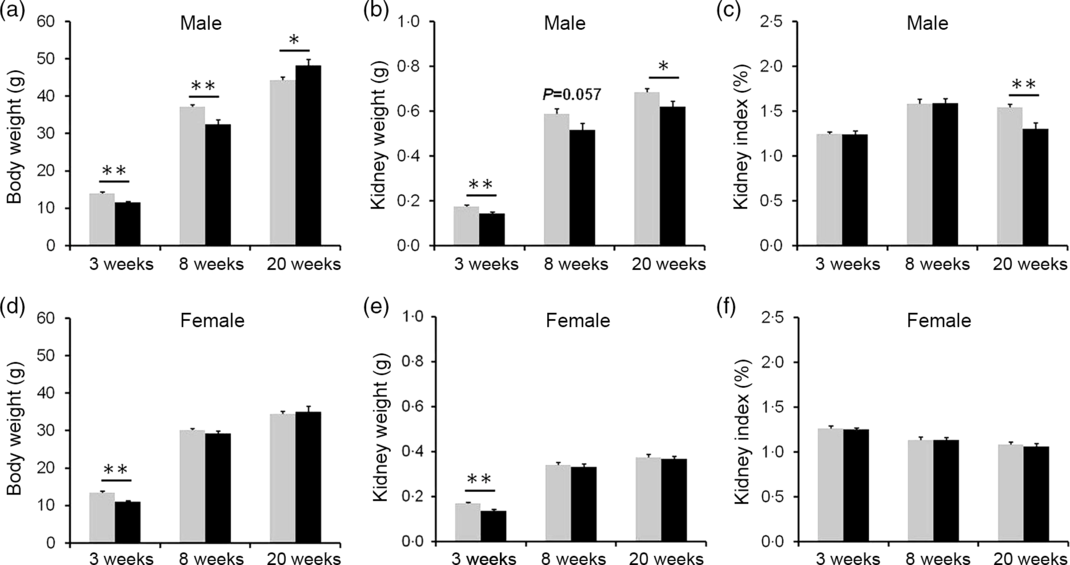
The effects of vitamin D deficiency in food intake and body weight at different developmental stages were analysed. As shown in online Supplementary Fig. S1(a) and (b), there were no significant differences in daily food intake of dams between the control and the VDD group during pregnancy and lactation. In addition, no significant differences in daily food intake were observed both in male and female pups between the control and the VDD group during PNW3–PNW40 (online Supplementary Fig. S1(c) and (d)). As shown in Fig. 2(a) and (d), body weights of VDD diet-fed male pups on PNW3 and PNW8 were lower than those of controls (Fig. 2(a)). The decrease in body weight of VDD diet-fed male pups was reversed on PNW20 (Fig. 2(a)). As shown in Fig. 2(d), body weight of VDD diet-fed female pups on PNW3 was lower than those of controls. The body weights of VDD diet-fed female pups on PNW8 and PNW20 had caught up with those of controls (Fig. 2(d)). The effects of vitamin D deficiency on kidney weight at different developmental stages were analysed. As shown in Fig. 2(b) and (e), the kidney weights of VDD diet-fed male pups on PNW3, PNW8 and PNW20 were lower than those of controls. Although the kidney weight of VDD diet-fed female pups on PNW3 was lower than those of controls, no significant differences were observed in the kidney weight of female pups on PNW8 and PNW20 between two groups (Fig. 2(e)). As shown in Fig. 2(c), the kidney index of VDD diet-fed male pups on PNW20 was significantly lower than those of the control. Interestingly, no difference was observed in kidney index of female pups between two groups at all developmental stages (Fig. 2(f)).
Effects of long-term vitamin D deficiency on kidney weight of pups at different developmental stages. All dams except controls were fed with vitamin D-deficient (VDD) diets throughout pregnancy and lactation. In the VDD group, all pups were fed with VDD diets. Some pups each group were killed on either postnatal week (PNW)3 (n 10) or PNW8 (n 10) or PNW20 (n 15 for control group, n 14 for VDD group). (a) Body weight of male pups. (b) Kidney weight of male pups. (d) Kidney index of male pups. (d) Body weight of female pups. (e) Kidney weight of female pups. (f) Kidney index of female pups. Data are mean values with their standard errors. *P < 0·05; **P < 0·01. ![]() , Control;
, Control; ![]() , VDD.
, VDD.
Effects of long-term vitamin D deficiency on histopathology and renal function in 20-week-old male and female pups
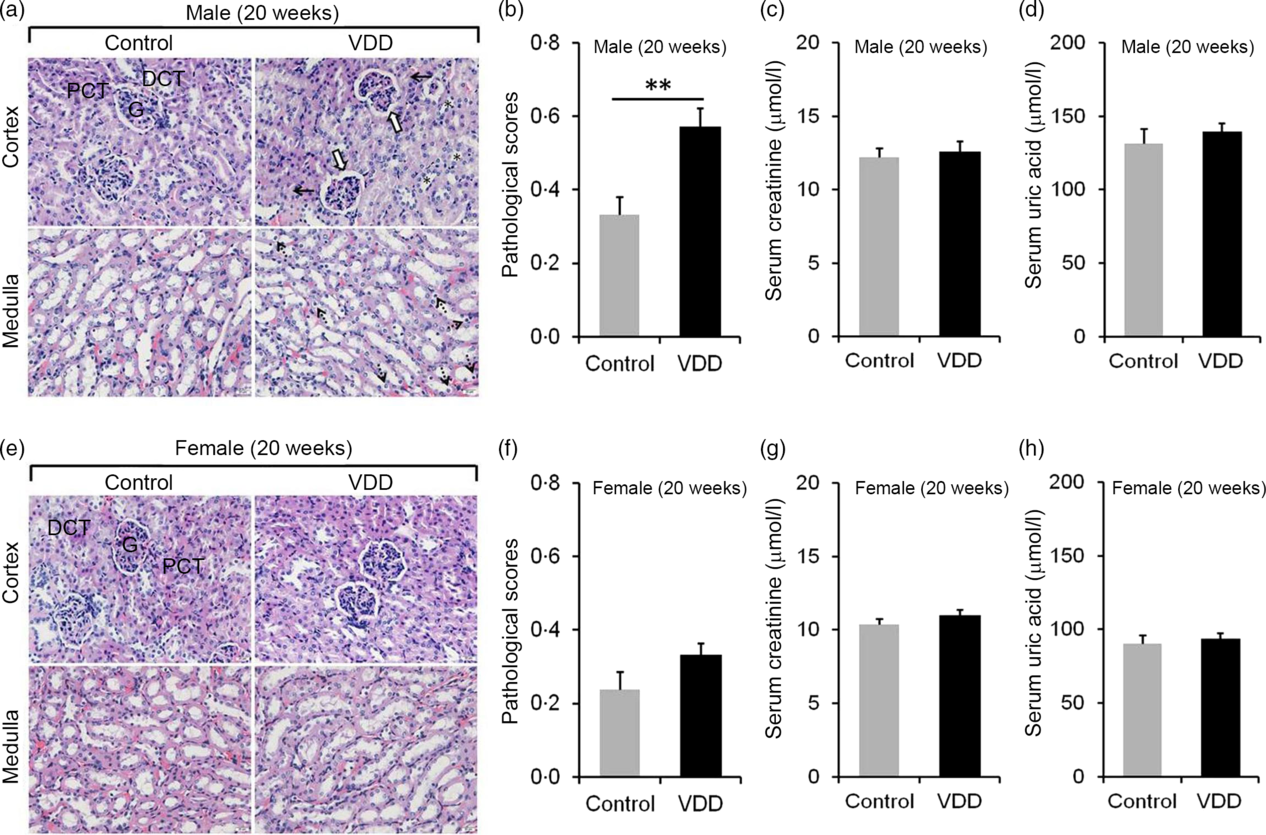
The effects of long-term vitamin D deficiency on histopathology and renal function of 20-week-old pups were analysed. As shown in Fig. 3(a), long-term vitamin D deficiency caused renal tubular lumen stenosis and closure (solid arrow), mild expansion of glomerular capsule cavity (hollow arrow), vacuolation of renal tubular epithelial cell (dotted arrow) and disappearance of renal tubular brush border (*). Although the pathological score was elevated in VDD diet-fed male pups (Fig. 3(b)), no significant differences in serum creatinine and uric acid levels were observed between two groups (Fig. 3(c) and (d)). Unlike male pups, no significant difference was observed in pathological score between VDD diet-fed female pups and controls (Fig. 3(e) and (f)). In addition, no differences in the levels of serum creatinine and uric acid were observed between the two groups (Fig. 3(g) and (h)).
Effects of long-term vitamin D deficiency on histopathology and renal function in 20-week-old pups. All dams except controls were fed with vitamin D-deficient (VDD) diets throughout pregnancy and lactation. In the VDD group, all pups were fed with VDD diets. Fifteen male pups and fourteen female pups each group were killed on postnatal week (PNW)20. (a and b) Renal histopathology of male pups was evaluated (n 3). (a) Renal tubular lumen stenosis or closure (solid arrow), mild expansion of glomerular capsule cavity (hollow arrow), vacuolation of renal tubular epithelial cell (dotted arrow) and disappearance of renal tubular brush border (*) were shown. DCT, distal convoluted tubule; PCT, proximal convoluted tubule; G, glomerulus. Original magnification: 400×. (b) Pathological scores were evaluated among different groups. (c and d) Renal function of male pups was measured (n 10). (c) Serum creatinine; (d) serum uric acid. (e and f) Renal histopathology of female pups was evaluated (n 3). (e) Representative photomicrographs of haematoxylin–eosin-stained sections from different groups are presented. (f) Pathological scores were evaluated among different groups. (g and h) Renal function of female pups was measured (n 10). (g) Serum creatinine; (h) serum uric acid. Data are mean values with their standard errors. **P < 0·01.
Effects of long-term vitamin D deficiency on histopathology and renal function in 40-week-old male pups
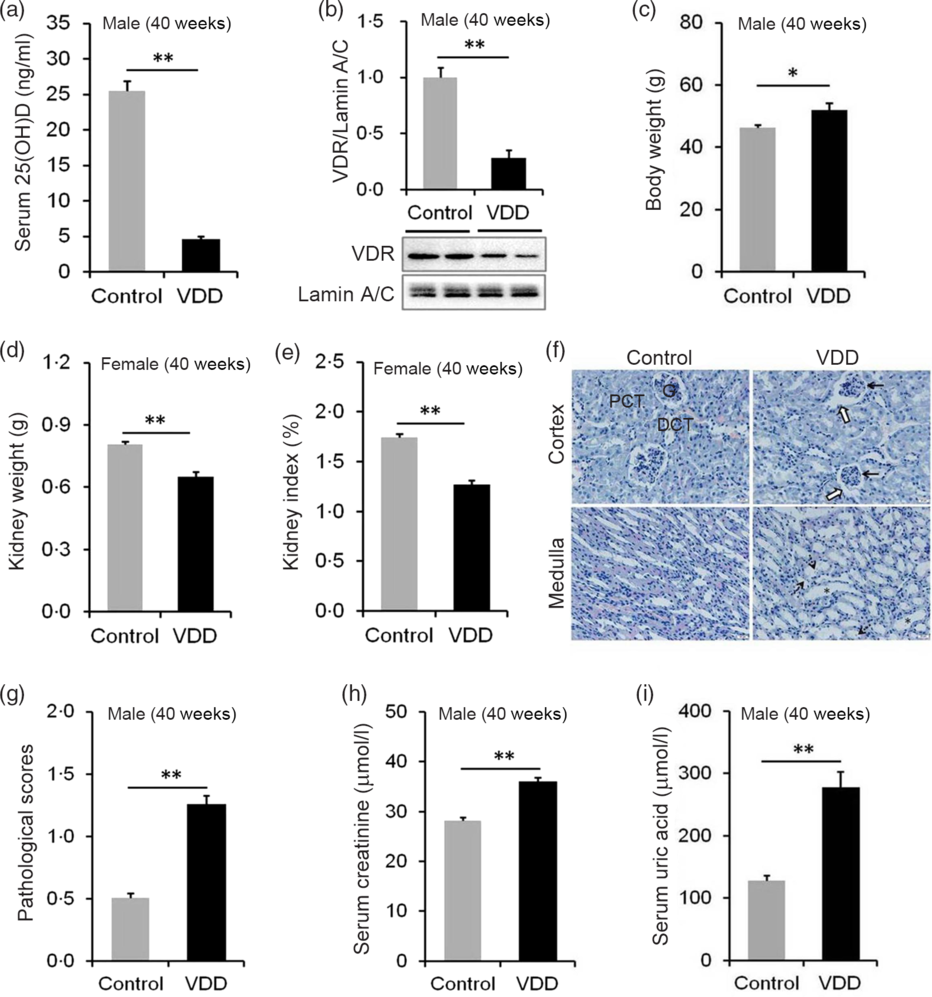
The effects of long-term vitamin D deficiency on serum 25(OH)D and renal VDR were analysed. As shown in Fig. 4(a), serum 25(OH)D concentration was significantly reduced in VDD diet-fed male pups. Correspondingly, nuclear VDR level in the kidney was reduced in VDD diet-fed male pups (Fig. 4(b)). The kidney weight and kidney index were then examined. As expected, the body weight at PNW40 was elevated in VDD diet-fed male pups (Fig. 4(c)). Both absolute kidney weight and kidney index were reduced in VDD diet-fed male pups (Fig. 4(d) and (e)). Renal histopathology is presented in Fig. 4(f). An obvious pathological damage, including reduction of glomerular cells (solid arrow), expansion of glomerular capsule cavity (hollow arrow), renal tubular dilation (*) and nuclear debris (dotted arrow), was observed in VDD diet-fed male pups (Fig. 4(f)). Further analysis showed that pathological score was elevated in VDD diet-fed male pups (Fig. 4(g)). Finally, the effect of long-term vitamin D deficiency on renal function of 40-week-old male pups was analysed. As shown in Fig. 4(h) and (i), the levels of serum creatinine and uric acid were elevated in VDD diet-fed pups.
Effects of long-term vitamin D deficiency on histopathology and renal function in 40-week-old male pups. All dams except controls were fed with vitamin D-deficient (VDD) diets throughout pregnancy and lactation. In the VDD group, all pups were fed with VDD diets. Fifteen male pups each group were killed on postnatal week (PNW)40. Mouse kidneys and blood sera were collected in male pups on PNW40. (a) Serum 25-hydroxyvitamin D (25(OH)D) of male pups were measured (n 15). (b) Renal nuclear vitamin D receptor (VDR) levels were measured using immunoblot (n 4). (c) Body weight (n 15). (d) Kidney weight (n 15). (e) Kidney index (n 15). (f and g) Renal histopathology was evaluated (n 3). (f) Glomerular cells and volume reduction (solid arrow), expansion of glomerular capsule cavity (hollow arrow), renal tubular dilation (*) and nuclear debris (dotted arrow) were shown. DCT, distal convoluted tubule; PCT, proximal convoluted tubule; G, glomerulus. Original magnification: 400×. (g) Pathological scores were evaluated among different groups (n 10). (h and i) Renal function of male pups was measured. (h) Serum creatinine; (i) serum uric acid. Data are mean values with their standard errors. *P < 0·05; **P < 0·01.
Effects of long-term vitamin D deficiency on epithelial–mesenchymal transition and renal fibrosis in 40-week-old male pups
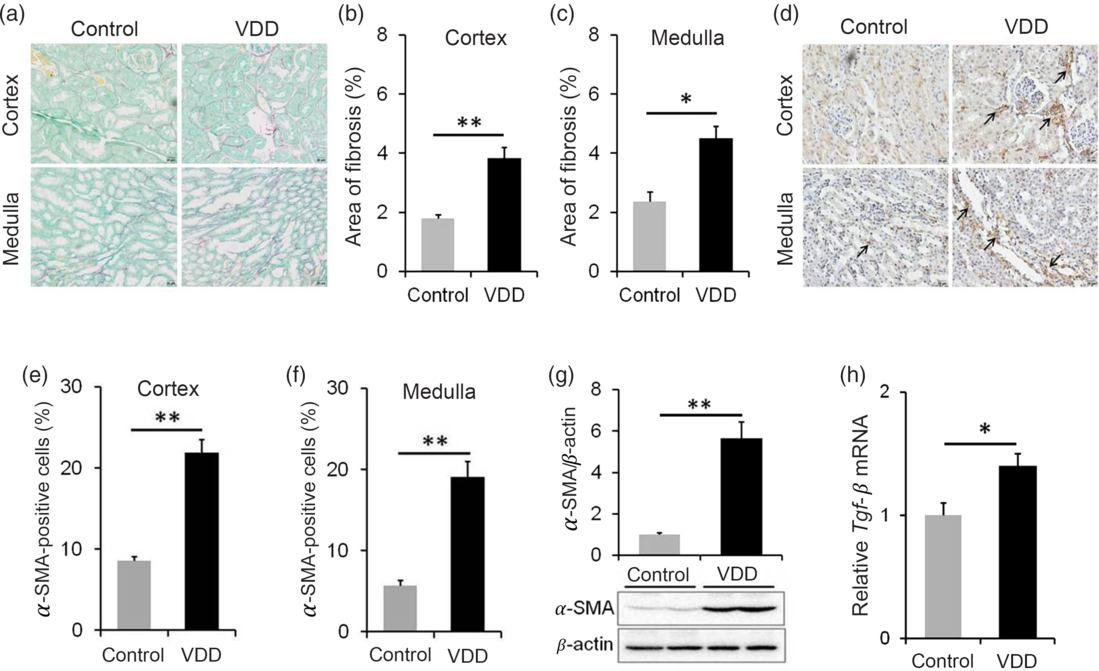
The effect of long-term vitamin D deficiency on renal fibrosis of PNW40 male pups was analysed using Sirius red staining. As shown in Fig. 5(a) and (b), the area of collagen deposition at PNW40 was significantly elevated in renal cortex of VDD diet-fed mice pups. In addition, the area of collagen deposition at PNW40 was also elevated in renal medulla of VDD diet-fed mice pups (Fig. 5(a) and (c)). The effect of long-term vitamin D deficiency on renal EMT was analysed in PNW40 male pups. Immunohistochemistry showed that α-SMA-positive cells, a marker of EMT, were increased not only in renal cortex but also in renal medulla of VDD diet-fed male pups (Fig. 5(d)–(f)). In addition, the expression of renal α-SMA at PNW40 was up-regulated in VDD diet-fed male pups (Fig. 5(g)). Moreover, the expression of renal Tgf-β mRNA at PNW40 was up-regulated in VDD diet-fed male pups (Fig. 5(h)).
Effects of long-term vitamin D deficiency on renal epithelial–mesenchymal transition and fibrosis in 40-week-old male pups. All dams except controls were fed with vitamin D-deficient (VDD) diets throughout pregnancy and lactation. In the VDD group, all pups were fed with VDD diets. Fifteen male pups each group were killed on postnatal week (PNW)40. (a–c) Renal fibrosis was detected by Sirius Red staining (n 3). (a) Representative photomicrographs of renal specimens from different groups are presented. Original magnification: 400×. (b) The area of collagen deposition in renal cortex was analysed. (c) The area of collagen deposition in renal medulla was analysed. (d–f) Renal α-smooth muscle actin (α-SMA) was analysed using immunohistochemistry (IHC) (n 3). (d) Representative photomicrographs of renal specimens from different groups are presented. Original magnification 400×. Renal α-SMA was distributed not only in renal medulla but also in renal cortex. (e) α-SMA-positive cells in renal cortex. (f) α-SMA-positive cells in renal medulla. (g) Renal α-SMA was measured using immunoblots (n 6). (h) Renal transforming growth factor-β (Tgf-β) mRNA was measured using reverse transcription PCR (n 4). Data are mean values with their standard errors. *P < 0·05; **P < 0·01.
Active vitamin D3 inhibits transforming growth factor-β-mediated epithelial-mesenchymal transition in renal epithelial HK-2 cells
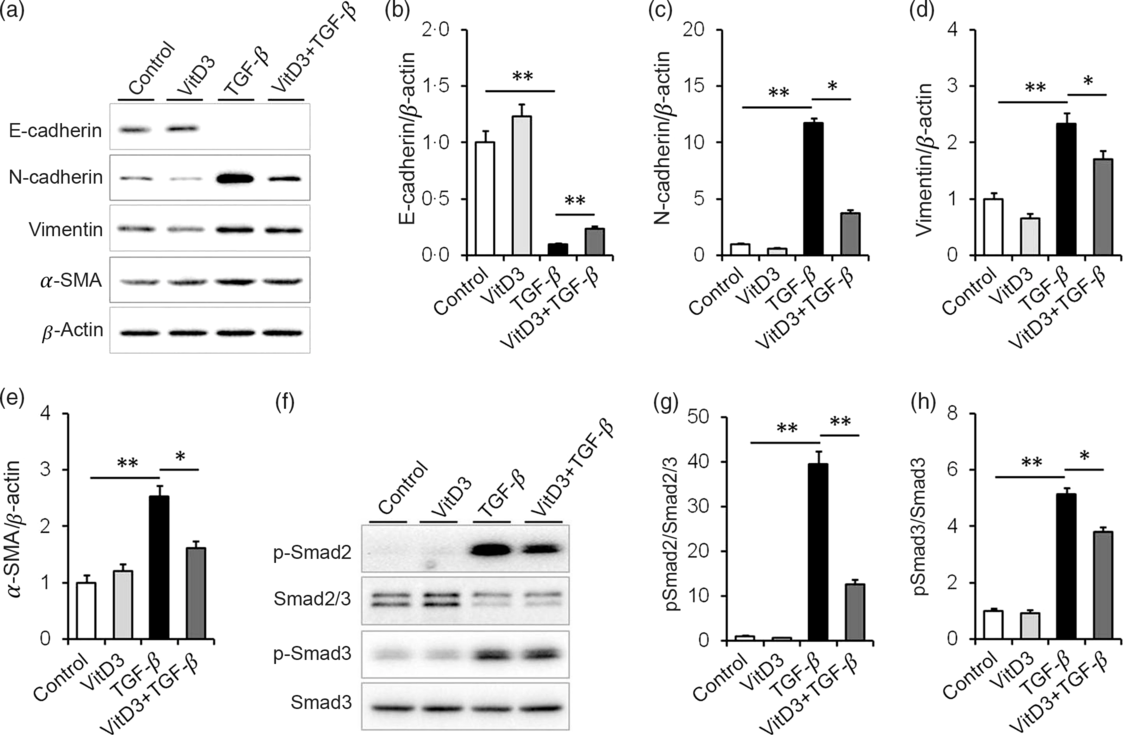
The effect of active vitamin D3 on TGF-β-induced EMT in HK-2 cells was analysed. As expected, the expression of E-cadherin, a marker of epithelial cells, was obviously decreased in TGF-β1-treated HK-2 cells (Fig. 6(a) and (b)). Interestingly, 1,25(OH)2D3, an active form of vitamin D3, alleviated TGF-β-induced down-regulation of E-cadherin in HK-2 cells (Fig. 6(a) and (b)). Moreover, the expressions of N-cadherin, vimentin and α-SMA, three markers of mesenchymal cells, were obviously up-regulated in TGF-β1-treated HK-2 cells (Fig. 6(a) and (c)–(e)). 1,25(OH)2D3 inhibited TGF-β-induced up-regulation of N-cadherin, vimentin and α-SMA in HK-2 cells (Fig. 6(a) and (c)–(e)). The effects of active vitamin D3 on TGF-β-induced Smad2/3 activation in HK-2 cells were then analysed. As shown in Fig. 6(f) and (g), the level of p-Smad2 was obviously elevated in TGF-β1-treated HK-2 cells. In addition, the level of p-Smad3 was markedly elevated in TGF-β1-treated HK-2 cells (Fig. 6(f) and (h)). Interestingly, 1,25(OH)2D3 significantly inhibited TGF-β1-induced Smad2 and Smad3 phosphorylation in HK-2 cells (Fig. 6(f)–(h)).
Active vitamin D3 (VitD3) inhibits transforming growth factor-β1 (TGF-β1)-mediated epithelial–mesenchymal transition in HK-2 cells. HK-2 cells were incubated with TGF-β1 (5 ng/ml) in the absence or presence of 1,25-dihydroxyvitamin D3 (100 nm). HK-2 cells were collected 36 h after TGF-β1. (a–e) E-cadherin, N-cadherin, vimentin and α-smooth muscle actin (α-SMA) were determined using immunoblot. (a) A representative gel. (b) E-cadherin/β-actin. (c) N-cadherin/β-actin. (d) Vimentin/β-actin. (e) α-SMA/β-actin. (f and h) Smad2/3, pSmad2, Smad3 and pSmad3 were determined using immunoblot. (f) A representative gel. (g) p-Smad2/Smad2/3. (h) p-Smad3/Smad3. Data are mean values with their standard errors, from three experiments (n 3). *P < 0·05; **P < 0·01.
Discussion
In the present study, we aimed to investigate the effects of long-term vitamin D deficiency on renal fibrosis and functional impairment in mice fed with VDD diets. Our results showed that long-term vitamin D deficiency promoted renal fibrosis in a sex-dependent manner. The specific findings include: (1) vitamin D deficiency caused renal pathological damage, including expansion of glomerular capsule cavity, renal tubular dilation and nuclear debris, accompanied by renal dysfunction in 40-week-old male pups; (2) vitamin D deficiency induced an obvious collagen deposition in the kidneys, as determined by Sirius red staining, in 40-week-old male pups.
wAn animal experiment found that maternal vitamin D deficiency impaired renal development and function in the offspring(Reference Boyce, Palmer-Aronsten and Kim23). According to a large population-based prospective cohort study, maternal 25(OH)D level during pregnancy was negatively correlated with childhood glomerular filtration rate from creatinine(Reference Miliku, Voortman and Franco24). To establish a mouse model of vitamin D deficiency, dams were fed with vitamin D-depleted diets throughout pregnancy and lactation. After weaning, their pups continued to be fed with VDD diets. We evaluated the effects of vitamin D deficiency on absolute and relative kidney weights, renal histopathology and functional impairment at different developmental stages. We found that the absolute kidney weight on PNW3 was decreased in VDD diet-fed male and female pups. Although vitamin D deficiency had no effect on renal function in PNW20 pups, the absolute and relative kidney weights on PNW20 were reduced in VDD diet-fed males but not in females. Correspondingly, a mild pathological damage was observed only in VDD diet-fed males but not in females. These results suggest that long-term vitamin D deficiency induces renal pathological damage in a sex-dependent manner.
Previous studies clearly indicated that sex is an important factor influencing the progression of nondiabetic chronic renal disease(Reference Silbiger and Neugarten25,Reference Neugarten, Acharya and Silbiger26) . In patients with CKD, male sex is associated with faster progression and worse outcome(Reference Neugarten, Acharya and Silbiger26). A recent cross-sectional study indicated that there was a sex difference between vitamin D deficiency and albuminuria. Low vitamin D status was significantly associated with albuminuria in Korean males but not in females(Reference Jeon, Shin and Jhee27). Our results showed that the absolute and relative kidney weights were significantly decreased in VDD diet-fed male pups but not females at PNW20. Moreover, pathological damage was observed only in VDD diet-fed males but not in females. Although the exact mechanism is unclear, several reasons may explain this sex difference. An earlier study proposed that oestrogen protected females from the progression of renal dysfunction(Reference Verhave, Hillege and Burgerhof28). Additional study indicated that oestrogen regulated vitamin D metabolism and VDR expression(Reference Nashold, Spach and Spanier29,Reference Correale, Ysrraelit and Gaitán30) . Indeed, females had fewer CYP24A1 transcripts, which encoding the 1,25(OH)2D3-inactivating enzyme, as well as greater binding and internalisation of vitamin D3-binding protein(Reference Nashold, Spach and Spanier29,Reference Correale, Ysrraelit and Gaitán30) . Moreover, growing evidence indicated that immunomodulatory effect of vitamin D3 was significantly stronger in females than in males(Reference Correale, Ysrraelit and Gaitán30,Reference Crescioli and Minisola31) .
Vitamin D deficiency is common especially in patients with CKD(Reference LaClair, Hellman and Karp32). Several epidemiological studies demonstrated that vitamin D deficiency was associated with increased mortality in CKD patients(Reference Mehrotra, Kermah and Salusky33,Reference Pilz, Iodice and Zittermann34) . However, whether long-term vitamin D deficiency promotes renal fibrosis remains to be determined. As vitamin D deficiency caused kidney injury only in males but not in females, the present study focused on the effect of long-term vitamin D deficiency on renal fibrosis in PNW40 male pups. As expected, the absolute and relative kidney weights were reduced in VDD-fed PNW40 male pups. Moreover, VDD-induced pathological damage, including expansion of glomerular capsule cavity, renal tubular dilation and nuclear debris, was aggravated in PNW40 male pups. A mild renal dysfunction, as shown in elevated serum creatinine and uric acid levels, was observed in VDD-fed PNW40 male pups. Importantly, an obvious collagen deposition, as determined by Sirius red staining, was shown in VDD-fed PNW40 male pups. These results provide experimental evidence for the first time that long-term vitamin D deficiency promotes renal fibrosis and functional impairment in middle-aged male mice.
Accumulating data have demonstrated that TGF-β1-initiated EMT plays an important role in the pathogenesis of renal fibrosis(Reference Hills and Squires35–Reference Loeffler and Wolf37). Indeed, the present study showed that the expression of renal α-SMA, a marker of EMT, was up-regulated in VDD diet-fed PNW40 male pups. In addition, numerous α-SMA-positive cells, as determined by immunohistochemistry, were observed not only in renal cortex but also in renal medulla of VDD diet-fed male pups. Moreover, the expression of renal Tgf-β mRNA was up-regulated in VDD diet-fed male pups. The present study further investigated the effect of 1,25(OH)2D3, an active form of vitamin D3, on TGF-β1-initiated EMT in renal epithelial HK-2 cells. Our results showed that the expression of E-cadherin, a marker of epithelial cells, was obviously decreased in TGF-β1-treated HK-2 cells. 1,25(OH)2D3 alleviated TGF-β1-induced down-regulation of E-cadherin in HK-2 cells. In addition, the expressions of N-cadherin, vimentin and α-SMA, three markers of mesenchymal cells, were up-regulated in TGF-β1-stimulated HK-2 cells. Of interest, active vitamin D3 attenuated TGF-β1-induced up-regulation of N-cadherin, vimentin and α-SMA in HK-2 cells. These results suggest that long-term vitamin D deficiency promotes renal fibrosis and functional impairment, at least partially, through aggravating TGF-β1-induced EMT in the kidneys.
The mechanism through which vitamin D deficiency aggravates renal EMT remains obscure. An earlier study indicated that active vitamin D3 suppressed renal fibrosis through reinforcing the integration of VDR with Smad3(Reference Ito, Waku and Aoki15). In a recent in vitro study, we further confirmed that active vitamin D3 suppressed Smad2/3 phosphorylation through promoting interaction between VDR and Smad2/3 in TGF-β1-stimulated renal cancer cells(Reference Xu, Zhang and Fu38). Indeed, the present study observed that nuclear VDR was reduced in the kidney of VDD-fed PNW40 male pups. To further determine the role of TGF-β1-induced Smad2/3 activation on renal EMT, we analysed the effects of active vitamin D3 on TGF-β1-induced Smad2/3 activation in renal epithelial HK-2 cells. Our results showed that TGF-β1-induced Smad2/3 phosphorylation was suppressed in 1,25(OH)2D3-treated HK-2 cells. These results suggested that TGF-β1-induced Smad2/3 activation may be partially involved in EMT during VDD-induced renal fibrosis. In our recent study, we found that active vitamin D3 inhibited β-catenin/TCF-4 activation through reinforcing interaction between VDR with β-catenin in TGF-β1-unstimulated renal cancer cells(Reference Xu, Zhang and Fu38). Thus, this study does not exclude a direct role of VDR on renal EMT.
Our previous study found that long-term vitamin D deficiency promoted prostatic hyperplasia and fibrosis through exacerbating local inflammation in middle-aged mice(Reference Zhang, Luo and Xu14). The present study placed emphasis on the effects of long-term vitamin D deficiency on renal fibrosis and functional impairment in middle-aged mice. Despite some novel and interesting findings in the present study, there are several limitations. First, the present study did not continue to track the effects of vitamin D deficiency on renal fibrosis and functional impairment in female pups at PNW40. Second, the present study did not investigate the reversal effects of vitamin D supplementation on VDD-mediated renal damage and fibrosis. Third, the mechanism of sex differences on vitamin D deficiency promoting renal fibrosis and dysfunction was not elucidated in this study. Therefore, additional researches are needed to elucidate the sex differences and the exact mechanisms of vitamin D deficiency in renal fibrosis and functional impairment in the future.
In summary, the present study aimed to investigate the effects of long-term vitamin D deficiency on renal fibrosis and functional impairment in mice fed with VDD diets. Our results showed that vitamin D deficiency induced renal damage in a sex-dependent manner. We found that long-term vitamin D deficiency promoted renal fibrosis and functional impairment in middle-aged male mice. The in vitro experiment indicated that active vitamin D3 inhibited Smad2/3 activation and EMT in TGF-β1-stimulated renal epithelial HK-2 cells. The present study provides evidence that long-term vitamin D deficiency promotes renal fibrosis and functional impairment, at least partially, through aggravating TGF-β/Smad2/3-mediated EMT in middle-aged male mice.
Acknowledgements
This work was supported by Key Project of National Natural Science Foundation of China (grant no. 81630084) and University Natural Science Research Project of Anhui Province (grant no. KJ2019A0255).
D. X. X. and D. D. X. conceived and designed the experiments; Z. H. Z., B. L., S. X., Z. C. Z. and W. Y. X. conducted the experiments; D. X. X., D. D. X., Z. H. Z. and H. W. provided reagents/materials/analysis tools; Y. H. C., C. Z. and H. W. analysed the data; D. X. X. and D. D. X. wrote the manuscript with the assistance of Z. H. Z. All authors read and approved the final manuscript.
None of the authors declares any conflicts of interest.
Supplementary material
For supplementary material referred to in this article, please visit https://doi.org/10.1017/S0007114520003232


