





Phytosterols competitively inhibit cholesterol absorption from the small intestine, exert hypocholesterolaemic effects(Reference Lees, Mok and Lees1) and reduce the risk of CHD(Reference Jiménez, Santos and Saura2). Currently, the average daily intake of phytosterols is approximately 300 mg/d(Reference Hirai, Shimadzu and Takezoe3), which is comparable with that of cholesterol. The intake level of phytosterol may increase because functional foods that utilise phytosterols are expected to increase in the future. Stigmasterol is a widely found phytosterol(Reference Foley, O’Callaghan and O’Brien4) that is absorbed less efficiently than campesterol and β-sitosterol(Reference Batta, Xu and Bollineni5). However, some studies have shown that stigmasterol exerts beneficial effects including antioxidant(Reference Haque, Hannan and Dash6), anti-inflammatory(Reference Gabay, Sanchez and Salvat7), anti-diabetic(Reference Nualkaew, Padee and Talubmook8,Reference Wang, Huang and Yang9) , anti-cancer(Reference Kim, Li and Kang10–Reference Wang, Chen and Lee13), anti-osteoarthritis(Reference Gabay, Sanchez and Salvat7,Reference Chen, Yu and Hu14,Reference Sampath, Kotikalapudi and Venkatesan15) , neuroprotective(Reference Haque, Hannan and Dash6) and immunomodulatory effects(Reference Wen, He and Zhong16). Feng et al. (Reference Feng, Dai and Liu17) found that stigmasterol prevented non-alcoholic fatty liver disease by reducing TAG levels in the liver and increasing TAG levels in the faeces of mice fed a high-fat diet. The diverse pharmacological effects of stigmasterol suggest its potential for future use in health promotion.
Phytosterols, similar to cholesterol, undergo oxidation in plant-based food products. Scholz et al. (Reference Scholz, Guth and Engel18) reported that oxidised phytosterols constitute approximately 1·9 % of total daily phytosterol intake. As phytosterol consumption increases, the intake of their oxides is also expected to increase. Oxidised phytosterols exert various harmful effects on the body, including cytotoxicity(Reference Ryan, Chopra and McCarthy19), apoptosis induction(Reference Ryan, Chopra and McCarthy19), inflammation(Reference Alemany, Laparra and Barberá20) and atherosclerosis(Reference Plat, Theuwissen and Husche21). Laparra et al. (Reference Laparra, Alfonso and Alegría22) found that oxidised phytosterols modulate cholesterol metabolism by downregulating the gene expression of 3-hydroxy-3-methylglutaryl-coenzyme A reductase, sterol regulatory element-binding protein 2 and ATP-binding cassette subfamily G member 5 in vitro. Moreover, Koyama et al. (Reference Koyama and Osada23) showed that oxidised phytosterols increase the proportion of arachidonic acid by upregulating the gene expression of fatty acid desaturase in rats. However, the specific effects of individual oxidised phytosterols, especially on fatty acid metabolism, remain unclear. Oxidised phytosterols, compared with unoxidised phytosterols, demonstrate higher absorption in the small intestine(Reference Tomoyori, Kawata and Higuchi24). Our previous study indicated that dietary oxidised stigmasterol accumulates in the liver of mice(Reference Ohara and Osada25). Recently, we reported that dietary oxidised stigmasterol affects cholesterol metabolism and absorption in the small intestine via a mechanism distinct from that of stigmasterol in mice(Reference Ohara and Osada26). In recent years, phytosterol-containing health foods have become widely consumed, and processed foods fried in vegetable oils are also commonly ingested. We have previously demonstrated that oxidised cholesterol affects lipid metabolism(Reference Osada, Kodama and Noda27,Reference Osada, Kodama and Yamada28) and liver function(Reference Sasaki, Fujikane and Ogino29). However, the in vivo effects of dietary oxidised phytosterol remain largely unexplored, and the effects of individual oxidised phytosterol have scarcely been investigated in vivo. Therefore, we report changes in fatty acid metabolism alongside alterations in cholesterol metabolism, consistent with our previous findings in this study.
Experimental methods
Composition of prepared oxidised stigmasterol
Oxidised stigmasterol was prepared as previously described(Reference Ohara and Osada26). The resulting oxidised stigmasterol consisted of the following constituents: 0·2 % unoxidised stigmasterol; 5·8 % stigmasta-5,22-dien-3β,4β-diol (4β-hydroxystigmasterol); 4·8 % stigmasta-5,22-diene-3β,7α-diol (7α-hydroxystigmasterol); 11·0 % stigmasta-5,22-diene-3β,7β-diol (7β-hydroxystigmasterol); 10·2 % 5α,6α-epoxystigmast-22-en-3β-ol (5α,6α-epoxystigmasterol); 10·1 % 5β,6β-epoxystigmast-22-en-3β-ol (5β,6β-epoxystigmasterol); 6·2 % stigmastanetriol (stigmatriol); 22·3 % stigmasta-5,22-dien-7-on-3β-ol (7-ketostigmasterol) and 29·4 % unidentified oxidised stigmasterol components. The unidentified oxidised stigmasterol fraction comprised seventeen unknown constituents.
Animals and diet
Animal experiments were conducted in accordance with the Meiji University Ethics Committee of Experimental Animal Care guidelines (Kanagawa, Japan) (approval code: MUIACUC2020–01), using previously reported methods(Reference Ohara and Osada26). The details are as follows.
ICR mice (6-week-old males; Japan SLC, Inc.) were housed individually in a temperature-controlled (24℃) and light-controlled (07.00–19.00) room, and animal cage locations were not rotated during the experiment. All treatments were performed by the same experimenter. After 8 d of acclimation, twenty-two ICR mice were divided randomly into four groups to avoid differences in the initial body weight: the standard (St) group (five mice) was fed an AIN standard diet, the control (C) group (five mice) was fed a standard diet supplemented with 0·25 % cholesterol, the stigmasterol (S) group (six mice) was fed a standard diet supplemented with 0·25 % cholesterol and 0·25 % stigmasterol and the oxidised stigmasterol (OS) group (six mice) was fed a standard diet supplemented with 0·25 % cholesterol and 0·25 % oxidised stigmasterol. Mice were allowed ad libitum access to water. Diets were prepared according to the AIN76 recommendations(30). The standard diet consisted of 15 % corn starch (Nihon Shokuhin Kako Co., Ltd.), 20 % casein (Feed One Co., Ltd.); 48·43 % sucrose (Mitsui. DM Sugar Co., Ltd.), 5 % high-linoleic safflower oil (Nisshin OilliO Group, Ltd.), 5 % cellulose (Feed One Co., Ltd.) and a 5 % mineral mixture (AIN76) (Oriental Yeast Co., Ltd.) and 1 % Vitamin Mix (AIN76) (Oriental Yeast Co., Ltd.), 0·2 % choline bitartrate (Nacalai Tesque, Inc.), 0·3 % DL-methionine (Nacalai Tesque, Inc.) and 0·075 % sodium cholate. The diets of the other groups were adjusted by reducing the percentage of sucrose according to the percentage of added cholesterol, stigmasterol or oxidised stigmasterol. The fatty acid composition of the feed fat was as follows: palmitic acid (16:0), 6·47 %; palmitoleic acid (16:1), 0·10 %; stearic acid (18:0), 2·37 %; oleic acid (18:1), 15·17 % and linoleic acid (18:2), 74·55 %. The mice in each group were fed the same quantity (in grams) of their respective diets to avoid differences in intake levels among the four groups. Feed intake was adjusted during the first week because one individual in each group consumed only a small amount. From the second week onward, mice were provided with 6 g of feed per day to prevent fasting. After 14 d, blood samples were collected from the mice under isoflurane anaesthesia via cardiac puncture using a syringe containing heparin sodium (Mochida Pharmaceutical Co., Ltd.) as an anticoagulant by alternating sequence among groups (St1→C1→S1→OS1→St2→…) after a 12-hour fast. The dissection was performed over a period of 3 h. The liver and mucosa of the small intestine were immediately excised, and plasma was separated by centrifugation at 3000 rpm for 25 min. These tissues were stored at −80℃ until further analysis. Some samples (liver and mucosa of the small intestine) were used for RNA analysis after immersion in RNAlater solution (Thermo Fisher Scientific Inc.) at 4℃ for 1 d. Faecal samples were collected for 4 d before pre-euthanasia and lyophilised.
Analyses of plasma and hepatic TAG levels
Plasma TAG levels were determined using commercial kits (Fujifilm; Wako Pure Chemical Industries, Ltd.). Hepatic lipids were extracted as described by Folch et al. (Reference Folch, Ascoli and Lees31). Hepatic TAG levels were measured as described by Ide et al. (Reference Ide, Okamatsu and Sugano32).
Analyses of plasma and hepatic fatty acid composition
Plasma and hepatic fatty acids were converted into methyl esters after saponification. The fatty acids were identified by gas chromatography (GC, Shimadzu GC-14B instrument (Shimadzu Co.) equipped with a flame ionisation detector and an InertCap Wax column (0·25 mm, 30·0 m × 0·25 μm I.D., GL Sciences). Nitrogen was used as the carrier gas at a flow rate of 100 kPa and a split ratio of 1:10. The column oven and injector temperatures were set to 210℃ and 250℃, respectively.
Analyses of the faecal fatty acid level
Faecal fatty acids were extracted and analysed using a gas chromatograph (GC-14B Shimadzu Co., Kyoto, Japan) equipped with an flame ionisation detector and InertCap Wax column (0·25 mm, 30·0 m × 0·25 μm I.D.; GL Sciences) with pentadecanoic acid as the internal standard, as described by Jeejeebhoy et al. (Reference Jeejeebhoy, Ahmad and Kozak33). Nitrogen was used as a carrier gas at a flow rate of 100 kPa. The column oven and injector temperatures were set to 210 and 250℃, respectively.
RNA extraction from liver
Total RNA was extracted from the liver and small intestinal mucosal tissues using Sepasol-RNA I Super G (Nacalai Tesque, Inc.) and mixed with 6 M lithium chloride solution for RNA purification. The RNA concentration was measured using a NanoDrop Lite spectrophotometer (Thermo Fisher Scientific).
Oligonucleotide primer sequences
The primers were designed using Primer3Plus software (https://www.bioinformatics.nl/cgi-bin/primer3plus/primer3plus.cgi) to detect mouse β-actin (Gene ID: 11461), peroxisome proliferator activated receptor γ (PPARγ; Gene ID:19016), sterol regulatory element-binding protein 1c (SREBP1; Gene ID: 20787), fatty acid synthase (Gene ID:14104), acetyl-Coenzyme A carboxylase α (ACCα; Gene ID:107476), fatty acid desaturase 2 (Δ5 desaturase: Fads 1; Gene ID:76267), fatty acid desaturase 1 (Δ6 desaturase: Fads 2; Gene ID:56473), Farnesoid X receptor (FXR: NR1H4; Gene ID: 20186), fibroblast growth factor 15 (FGF15; Gene ID:14170) PPARα(Gene ID:19013), acyl-Coenzyme A oxidase 1 (ACOX1; Gene ID: 11430) and carnitine palmitoyl transferase 1α (CPT1α; Gene ID: 12894) via reverse transcription PCR. Primers synthesised by Eurofins Genomics (Tokyo, Japan) were designed to flank known or putative introns of the target gene, thereby preventing the amplification of contaminating genomic DNA. The primer sequences were as follows: b-actin, 5′-TGTCGAGTCGCGTCCACC-3′ (sense) and 5′-TATCGTCATCCATGGCGAACTGG-3′ (antisense); PPARγ, 5′-TGGAAGACCACTCGCATTCC-3′ (sense) and 5′-CAGACTCTGGGTTCAGCTGG-3′ (antisense); SREBP1, 5′-GGAACTTTTCCTTAACGTGGGC-3′ (sense) and 5′-ATGAGCTGGAGCATGTCTTCG-3′ (antisense); fatty acid synthase, 5′-CATCAGGATCCCAAAGCCTA-3′ (sense) and 5′-ATTGGACTTTGGCTGATTGC-3′ (antisense); ACCα, 5′-TGGGCGGAATGGTCTCTTTC-3′ (sense) and 5′-GTTCATCCCTGGGGACCTTG-3′ (antisense); Δ5 desaturase, 5′-AAGCACATGCCATACAACCA-3′ (sense) and 5′-CAGCGGCATGTAAGTGAAGA-3′ (antisense); Δ6 desaturase, 5′-TCCATCTGGACCTGGACTTC-3′ (sense) and 5′-GATGTGGGACAGGAGGAGAA-3′ (antisense); FXR, 5’-ACAGCGTGGAAAGCAACAG-3’ (sense) and 5’-GTCCTCACGGAAAGCTCTTACA-3’ (antisense); FGF15, 5’-GATTGCCATCAAGGACGTCAG-3’ (sense) and 5’-TCAGCCCGTATATCTTGCCG-3’ (antisense); PPARα, 5′-AGTGCAGCCTCAGCCAA-3′ (sense) and 5′-CACAGAGCGCTAAGCTGTGA-3′ (antisense); ACOX1, 5′-GTGGAACCTTGTTGGCCTCAA-3′ (sense) and 5′-GAAGATGAGTTCCGTGGCCC-3′ (antisense); CPT1α, 5′-GGGCCATCTGTGGGAGTATG-3′ (sense) and 5′-ACTGTAGCCTGGTGGGTTTG-3′ (antisense).
Real-time quantitative PCR
One microgram of RNA was incubated at 65℃ for 5 min and rapidly cooled on ice. Reverse transcription of RNA was performed using ReverTra Ace qPCR RT Master Mix (Toyobo Co., Ltd.) with the temperature increased to 37℃ for 15 min and 98℃ for 5 min. An aliquot of the generated cDNA samples was mixed with 9 µl of THUNDERBIRD NEXT SYBR qPCR Mix (Toyobo Co., Ltd.) and 12 nmol each of the sense and antisense primers for β-actin and the target gene. The reaction mixture was amplified using a Thermal Cycler Dice Real-Time System III (Takara Bio Inc.) under the following standard cycling conditions: an initial cycle at 95℃ for 1 min, followed by 40 cycles of denaturation at 95℃ for 15 s, annealing at 58·4℃ for 15 s and extension at 72℃ for 30 s. The results (fold changes) are expressed as relative fold changes (2−Cq(target)+Cq(β-actin)) based on comparisons with the amount of RNA of the target gene to that of β-actin (the internal control).
Comparison of the effects of stigmasterol and oxidised stigmasterol on the incorporation of trilinolenin into micellar solutions
Mixed micellar solutions were prepared from 40 ml 15 mM sodium phosphate buffer (pH 7·4) containing 308·6 mg NaCl (Nacalai Tesque, Inc.), 16·4 mg phosphatidylcholine (from Egg Yolk, Nacalai Tesque, Inc.), 127·8 mg sodium taurocholate, 40 mg trilinolenin (Olbracht Serdary Research Laboratories), 35 mg cholesterol (Nacalai Tesque, Inc.) (C group) and either 35 mg stigmasterol (S group) or oxidised stigmasterol (OS group) were prepared by sonication as described by Ogino et al. (Reference Ogino, Osada and Nakamura34). The concentrations of taurocholic acid, phosphatidylcholine, cholesterol and trilinolenin in the micelles were adjusted to 5·94 mM, 0·54 mM, 2·3 mM and 1·15 mM, respectively. Since these levels vary depending on individual differences and dietary habits(Reference Staggers, Hernell and Stafford35), it remains unclear whether they reflect physiological levels; however, they are generally considered to be reasonable. Furthermore, trilinolenin was used as a substrate for TAG because phosphatidylcholine employed did not contain α-linolenic acid, thereby enabling accurate determination of the effects of sterols on TAG level within the micelles. The prepared micellar solutions were incubated at 37℃ for 1 h and then centrifuged at 1000 × g for 20 min. The supernatant was filtered using a 220 nm filter (Membrane Solutions LLC). Lipids were extracted from the filtered solution, as described by Folch et al. (Reference Osada, Kodama and Yamada28) and α-linolenic acid levels were measured by GC, as described in the previous section.
Statistical analyses and justification of sample size
This study was designed with five or six mice per experimental group, which is consistent with the group sizes used in our previous study(Reference Ohara and Osada25,Reference Ohara and Osada26) . The inclusion or exclusion criteria were not specified. All animals and data were included in the experiments and analyses. All data are expressed as mean (standard error of the mean (sem)). Statistical analyses were performed using Excel Statistics version 4·08 (Social Survey Research Information Co. Ltd.). The Shapiro–Wilk test was used to evaluate normality, revealing that the majority of variables, except for some fatty acids and gene expression levels, were normally distributed. Therefore, if the data were normally distributed, statistical analyses were performed as follows. Student’s t test was first used to evaluate significant differences between the St and C groups to assess the effects of cholesterol loading. Subsequently, one-way ANOVA followed by the Tukey–Kramer test was used to evaluate significant differences among the C, S and OS groups, in order to assess the effects of stigmasterol or oxidised stigmasterol in cholesterol-loading-induced hypercholesterolaemia. If the data were not normally distributed, the exact Mann–Whitney U test was used to evaluate significant differences between the St and C groups, and the Kruskal–Wallis and Steel–Dwass tests were used to evaluate significant differences among the C, S and OS groups. Statistical significance was set at P < 0·05. Effect size data were not available for power analysis, as this was an exploratory study aimed at comparing the effects of dietary stigmasterol and oxidised stigmasterol on fatty acid metabolism in mice. Instead of conventional power analysis, minimally detectable effect sizes were estimated using G * Power version 3·1·9·7 based on predetermined sample sizes. For comparisons between the St and C groups (n 5 each), the minimally detectable effect size (Cohen’s d) was approximately 2·02, assuming a two-sided significance level of 0·05 and a statistical power of 80 %. For analyses involving the C, S and OS groups (n 5, 6 and 6, respectively), the minimally detectable effect size (Cohen’s f) for the one-way ANOVA was approximately 0·84 under identical assumptions.
Results
Effects of dietary stigmasterol and oxidised stigmasterol on growth parameters of mice
As we previously reported(Reference Ohara and Osada26), liver weight tended to be slightly higher in the C group (0·60 (sem 0·04)) than in the St group (0·49 (sem 0·03)) (P = 0·06). However, no significant effects were observed on the other growth parameters among the four groups (food intake: St, 5·4 (sem 0·0) g; C, 5·4 (sem 0·0) g; S, 5·5 (sem 0·0) g; OS, 5·4 (sem 0·0) g; body weight gain: St, 3·6 (sem 1·1) g; C, 3·5 (sem 0·6) g; S, 2·9 (sem 1·0) g; OS, 3·5 (sem 0·7) g).
Effects of dietary stigmasterol and oxidised stigmasterol on plasma and hepatic TAG levels
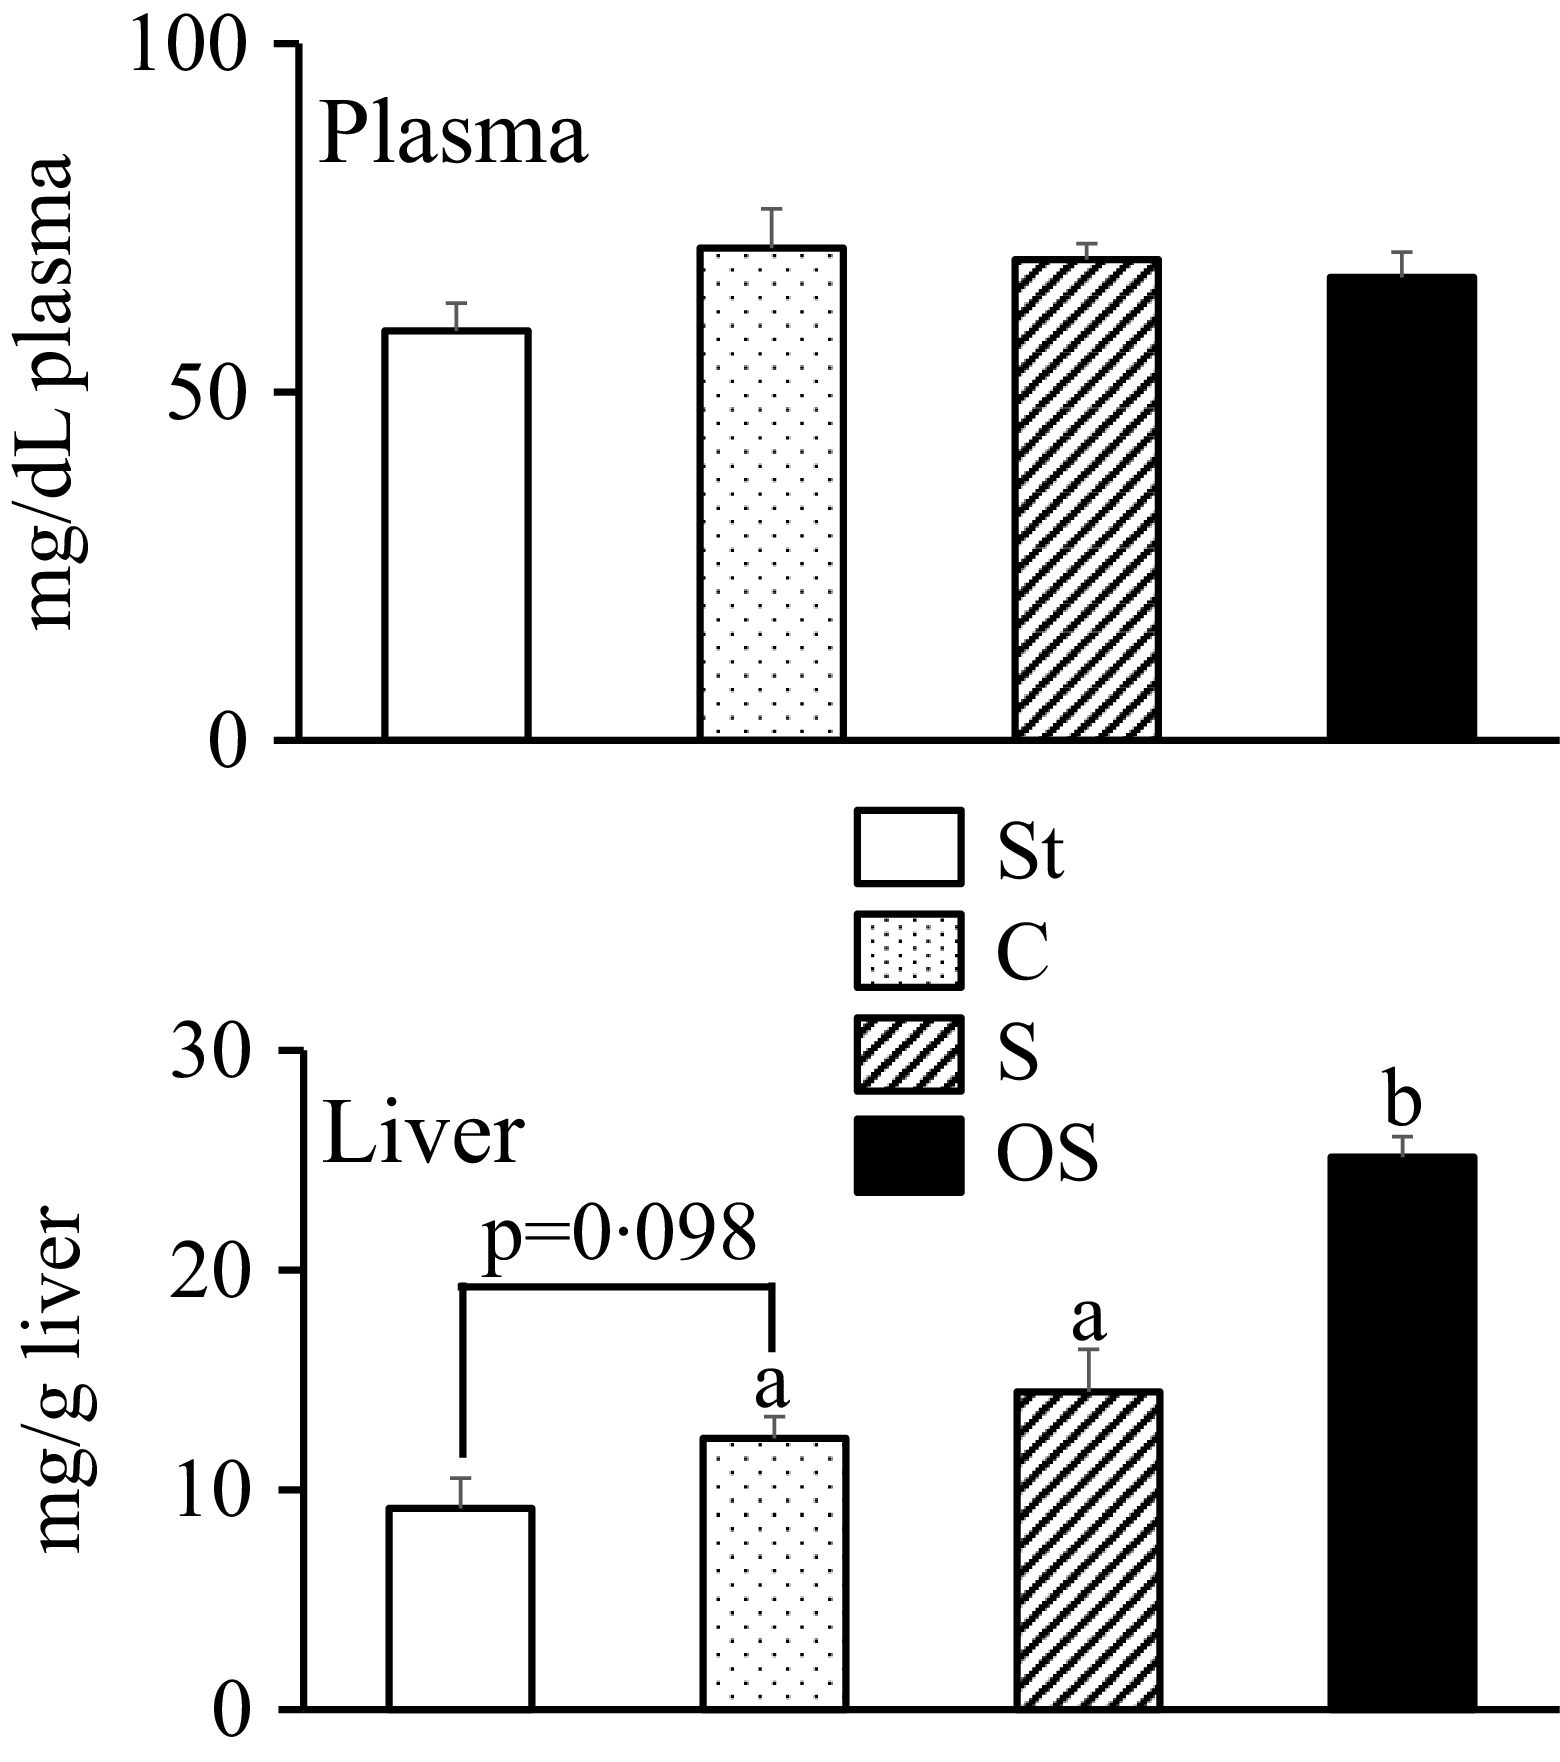
No significant differences in plasma TAG levels were observed among the four groups (Figure 1). Hepatic TAG levels tended to be slightly higher in the C group than in the St group (P = 0·098) and were significantly higher in the OS group than in the C and S groups.
Effects of dietary stigmasterol and oxidised stigmasterol on plasma and hepatic TAG levels. Data are presented as the mean and sem of 5–6 mice in each group. Significant differences between values of the St and C groups at P < 0·01**. abValues without a common superscript letter are significantly different among values of the C, S and OS groups at P < 0·05. St: standard diet fed group; C: 0·25 % cholesterol fed group; S: 0·25 % cholesterol and 0·25 % stigmasterol fed group; OS: 0·25 % cholesterol and 0·25 % oxidised stigmasterol fed group.

Figure 1. Long description
The bar graph compares plasma and hepatic TAG levels across four dietary groups: St, C, S, and OS. The x-axis represents the dietary groups, while the y-axis measures the TAG levels in milligrams per deciliter for plasma and milligrams per gram for liver. The plasma TAG levels are approximately 50, 70, 70, and 70 for St, C, S, and OS groups respectively. The liver TAG levels are approximately 10, 15, 15, and 25 for St, C, S, and OS groups respectively. The St group is represented by a white bar, the C group by a dotted bar, the S group by a striped bar, and the OS group by a black bar. Significant differences are noted between the St and C groups at P < 0.01, and among the C, S, and OS groups at P < 0.05. All values are approximated.
Effects of dietary stigmasterol and oxidised stigmasterol on plasma fatty acid composition
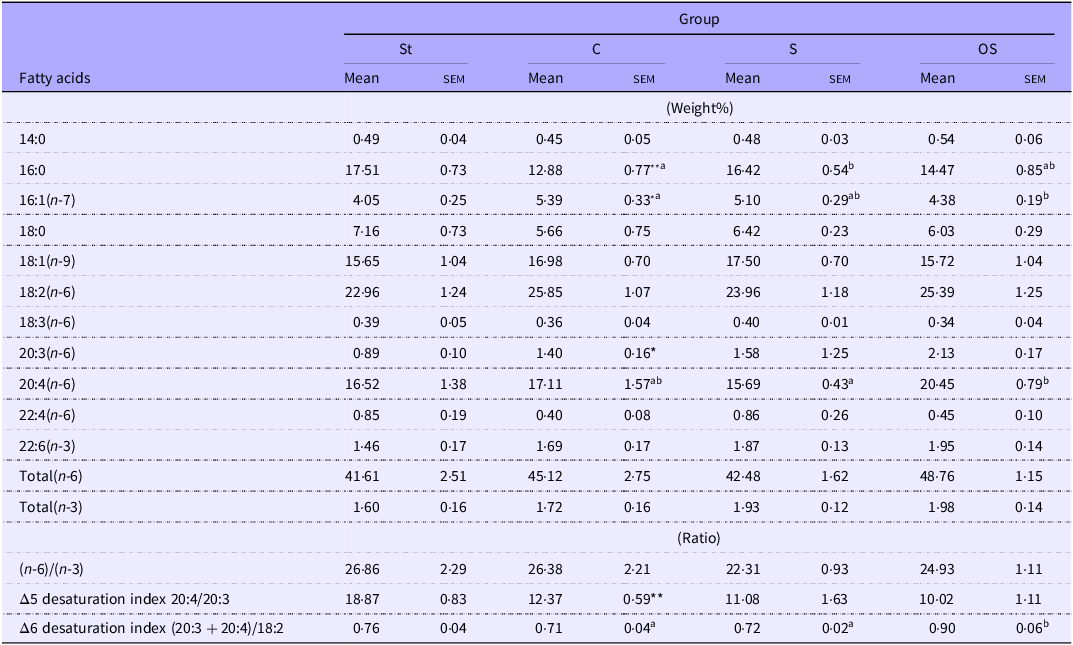
Plasma palmitic acid (16:0) levels were significantly lower in the C group than in the St group but were significantly higher in the S group than in the C group (Table 1). Plasma palmitoleic acid (16:1) levels were significantly higher in the C group than in the St group but were significantly lower in the OS group than in the C group. Plasma dihomo-γlinolenic acid (20:3) levels were significantly higher in the C group than in the St group and tended to be slightly higher in the OS group than in the C group (P = 0·059). Plasma arachidonic acid (20:4) levels did not differ between the St and C groups but were significantly higher in the OS group than in the S group and tended to be slightly higher in the OS group than in the C group (P = 0·074). Plasma DTA (22:4) levels were slightly lower in the C group than in the St group (P = 0·068), but did not differ among the C, S and OS groups. Plasma total (n-6) levels did not differ between the St and C groups but were slightly higher in the OS group than in the S group (P = 0·064). Plasma Δ5 desaturation index was significantly lower in the C group than in the St group, but did not differ among the C, S and OS groups. Plasma Δ6 desaturation index did not differ between the St and C groups, but was significantly higher in the OS group than in the C and S groups.
Effects of dietary stigmasterol and oxidised stigmasterol on plasma fatty acid composition

Table 1. Long description
The table presents a comparison of plasma fatty acid levels across four groups: St, C, S, and OS. It includes mean and standard error of the mean (SEM) values for various fatty acids, measured in weight percentage. The fatty acids listed include 14:0, 16:0, 16:1(n-7), 18:0, 18:1(n-9), 18:2(n-6), 18:3(n-6), 20:3(n-6), 20:4(n-6), 22:4(n-6), and 22:6(n-3). Additionally, the table provides totals for (n-6) and (n-3) fatty acids, as well as ratios of (n-6)/(n-3), delta 5 desaturation index (20:4/20:3), and delta 6 desaturation index (20:3 + 20:4)/18:2. Notable trends include significant differences in palmitic acid (16:0), palmitoleic acid (16:1), dihomo-linolenic acid (20:3), arachidonic acid (20:4), and total (n-6) levels among the groups. The table also highlights differences in desaturation indices across the groups.
Data are presented as the mean and sem of 5–6 mice in each group. Significant differences between values of the St and C groups at P < 0·01**, P < 0·05*. abValues without a common superscript letter are significantly different among values of the C, S and OS groups at P < 0·05. St, standard diet fed group; C, 0·25 % cholesterol fed group; S, 0·25 % cholesterol and 0·25 % stigmasterol fed group; OS, 0·25 % cholesterol and 0·25 % oxidised stigmasterol fed group.
Effects of dietary stigmasterol and oxidised stigmasterol on hepatic fatty acid composition
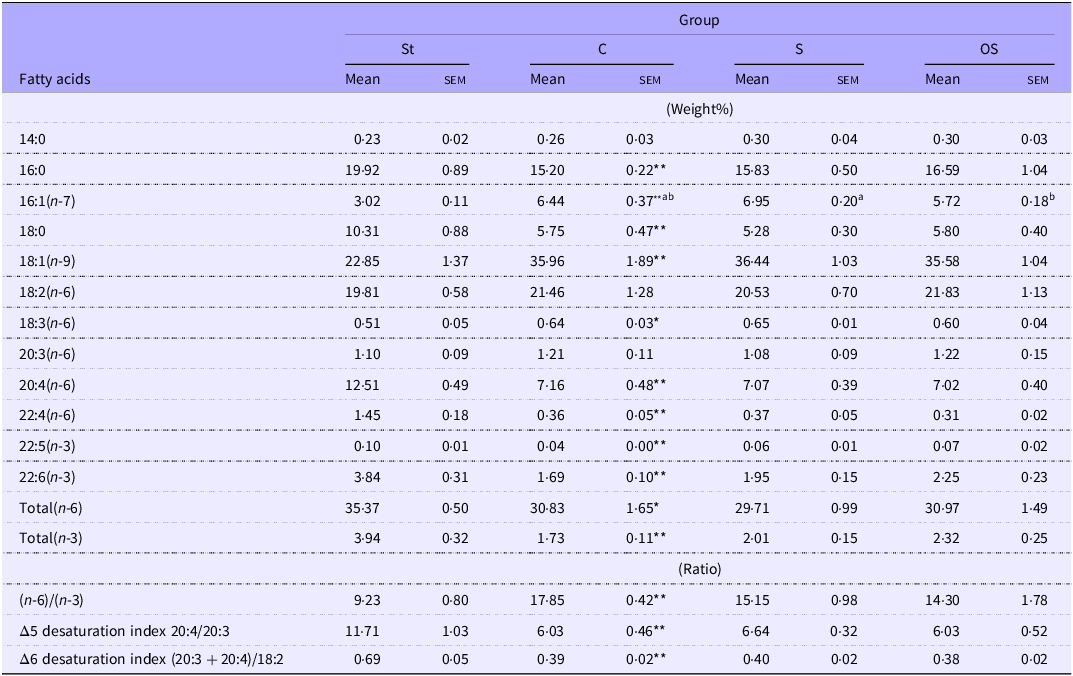
Hepatic palmitic acid (16:0), stearic acid (18:0), arachidonic acid (20:4), DTA (22:4), DPA (22:5), DHA (22:6), total (n-6) and total (n-3) levels and Δ6 desaturation index were significantly lower in the C group than in the St group, but did not differ among the C, S and OS groups. Hepatic palmitoleic acid (16:1) levels were significantly higher in the C group than in the St group and significantly lower in the OS group than in the S group. Hepatic oleic acid (18:1) and γ-linolenic acid (18:3) levels and the (n-6)/(n-3) ratio were significantly lower in the C group than in the St group but did not differ among the C, S and OS groups (Table 2).
Effects of dietary stigmasterol and oxidised stigmasterol on hepatic fatty acid composition

Table 2. Long description
The table presents data on the effects of dietary stigmasterol and oxidized stigmasterol on hepatic fatty acid composition. It includes mean and standard error of mean (SEM) values for various fatty acids across four groups: St, C, S, and OS. The table has 14 rows and 8 columns, with columns labeled by group and rows labeled by fatty acid types. Notable trends include significant differences in palmitic acid, stearic acid, arachidonic acid, DTA, DPA, DHA, total (n-6), and total (n-3) levels, as well as the delta 6 desaturation index among the groups. Specific fatty acids such as palmitoleic acid, oleic acid, and alpha-linolenic acid also show significant variations. The data highlights the impact of different dietary treatments on hepatic fatty acid levels.
Data are presented as the mean and sem of 5–6 mice in each group. Significant differences between values of the St and C groups at P < 0·01**, P < 0·05*. abValues without a common superscript letter are significantly different among values of the C, S and OS groups at P < 0·05. St, standard diet fed group; C, 0·25 % cholesterol fed group; S, 0·25 % cholesterol and 0·25 % stigmasterol fed group; OS, 0·25 % cholesterol and 0·25 % oxidised stigmasterol fed group.
Effects of dietary stigmasterol and oxidised stigmasterol on the faecal fatty acid levels
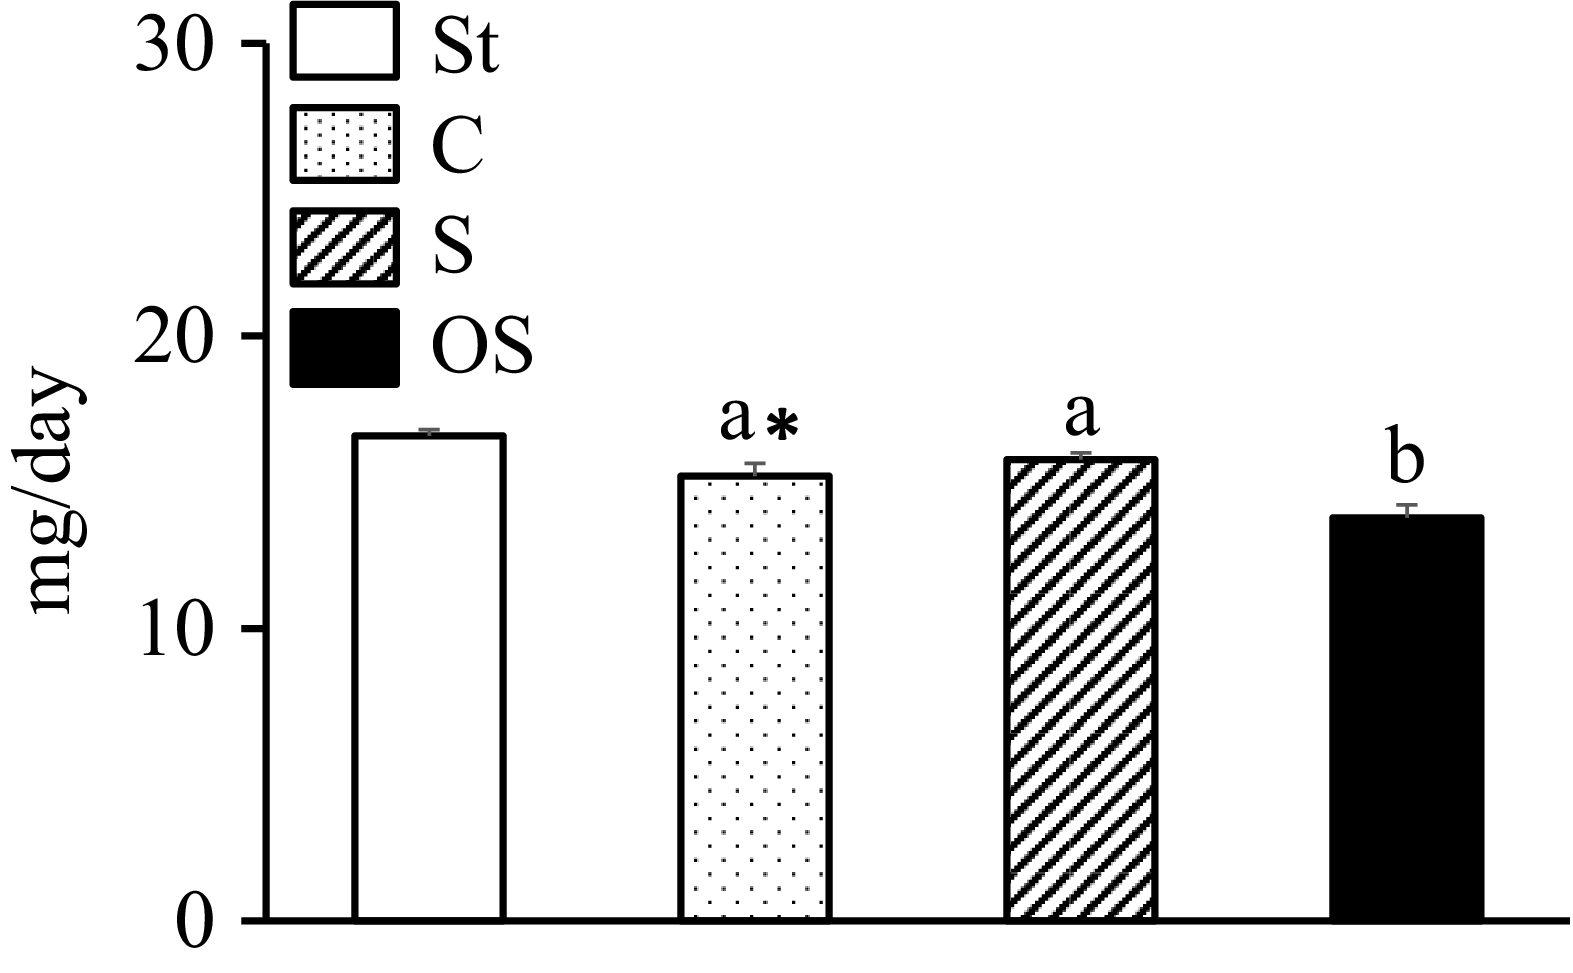
The faecal total fatty acid levels were significantly lower in the C group than in the St group and significantly lower in the OS group than in the C and S groups (Figure 2).
Effects of dietary stigmasterol and oxidised stigmasterol on the faecal fatty acid levels. Data are presented as the mean and sem of 5–6 mice in each group. Significant differences between values of the St and C groups at P < 0·01**. abValues without a common superscript letter are significantly different among values of the C, S and OS groups at P < 0·05. St: standard diet fed group; C: 0·25 % cholesterol fed group; S: 0·25 % cholesterol and 0·25 % stigmasterol fed group; OS: 0·25 % cholesterol and 0·25 % oxidised stigmasterol fed group.

Figure 2. Long description
The bar graph compares the effects of dietary stigmasterol and oxidised stigmasterol on faecal fatty acid levels in mice. The x-axis represents different dietary groups: St, C, S, and OS. The y-axis measures the faecal fatty acid levels in milligrams per day, ranging from 0 to 30. There are four vertical bars, each representing a different group. The St group has the highest value, followed by the C, S, and OS groups. The C and S groups are marked with the letter ‘a’, indicating no significant difference between them. The OS group is marked with the letter ‘b’, indicating a significant difference from the C and S groups. The St group is marked with ‘a*’, indicating a significant difference from the C group at P < 0.01. The legend explains the patterns and colors of the bars: St is a white bar, C is a dotted bar, S is a striped bar, and OS is a solid black bar. All values are approximated.
Effects of dietary stigmasterol and oxidised stigmasterol on the gene expression of enzymes and nuclear receptors involved in fatty acid synthesis in the liver
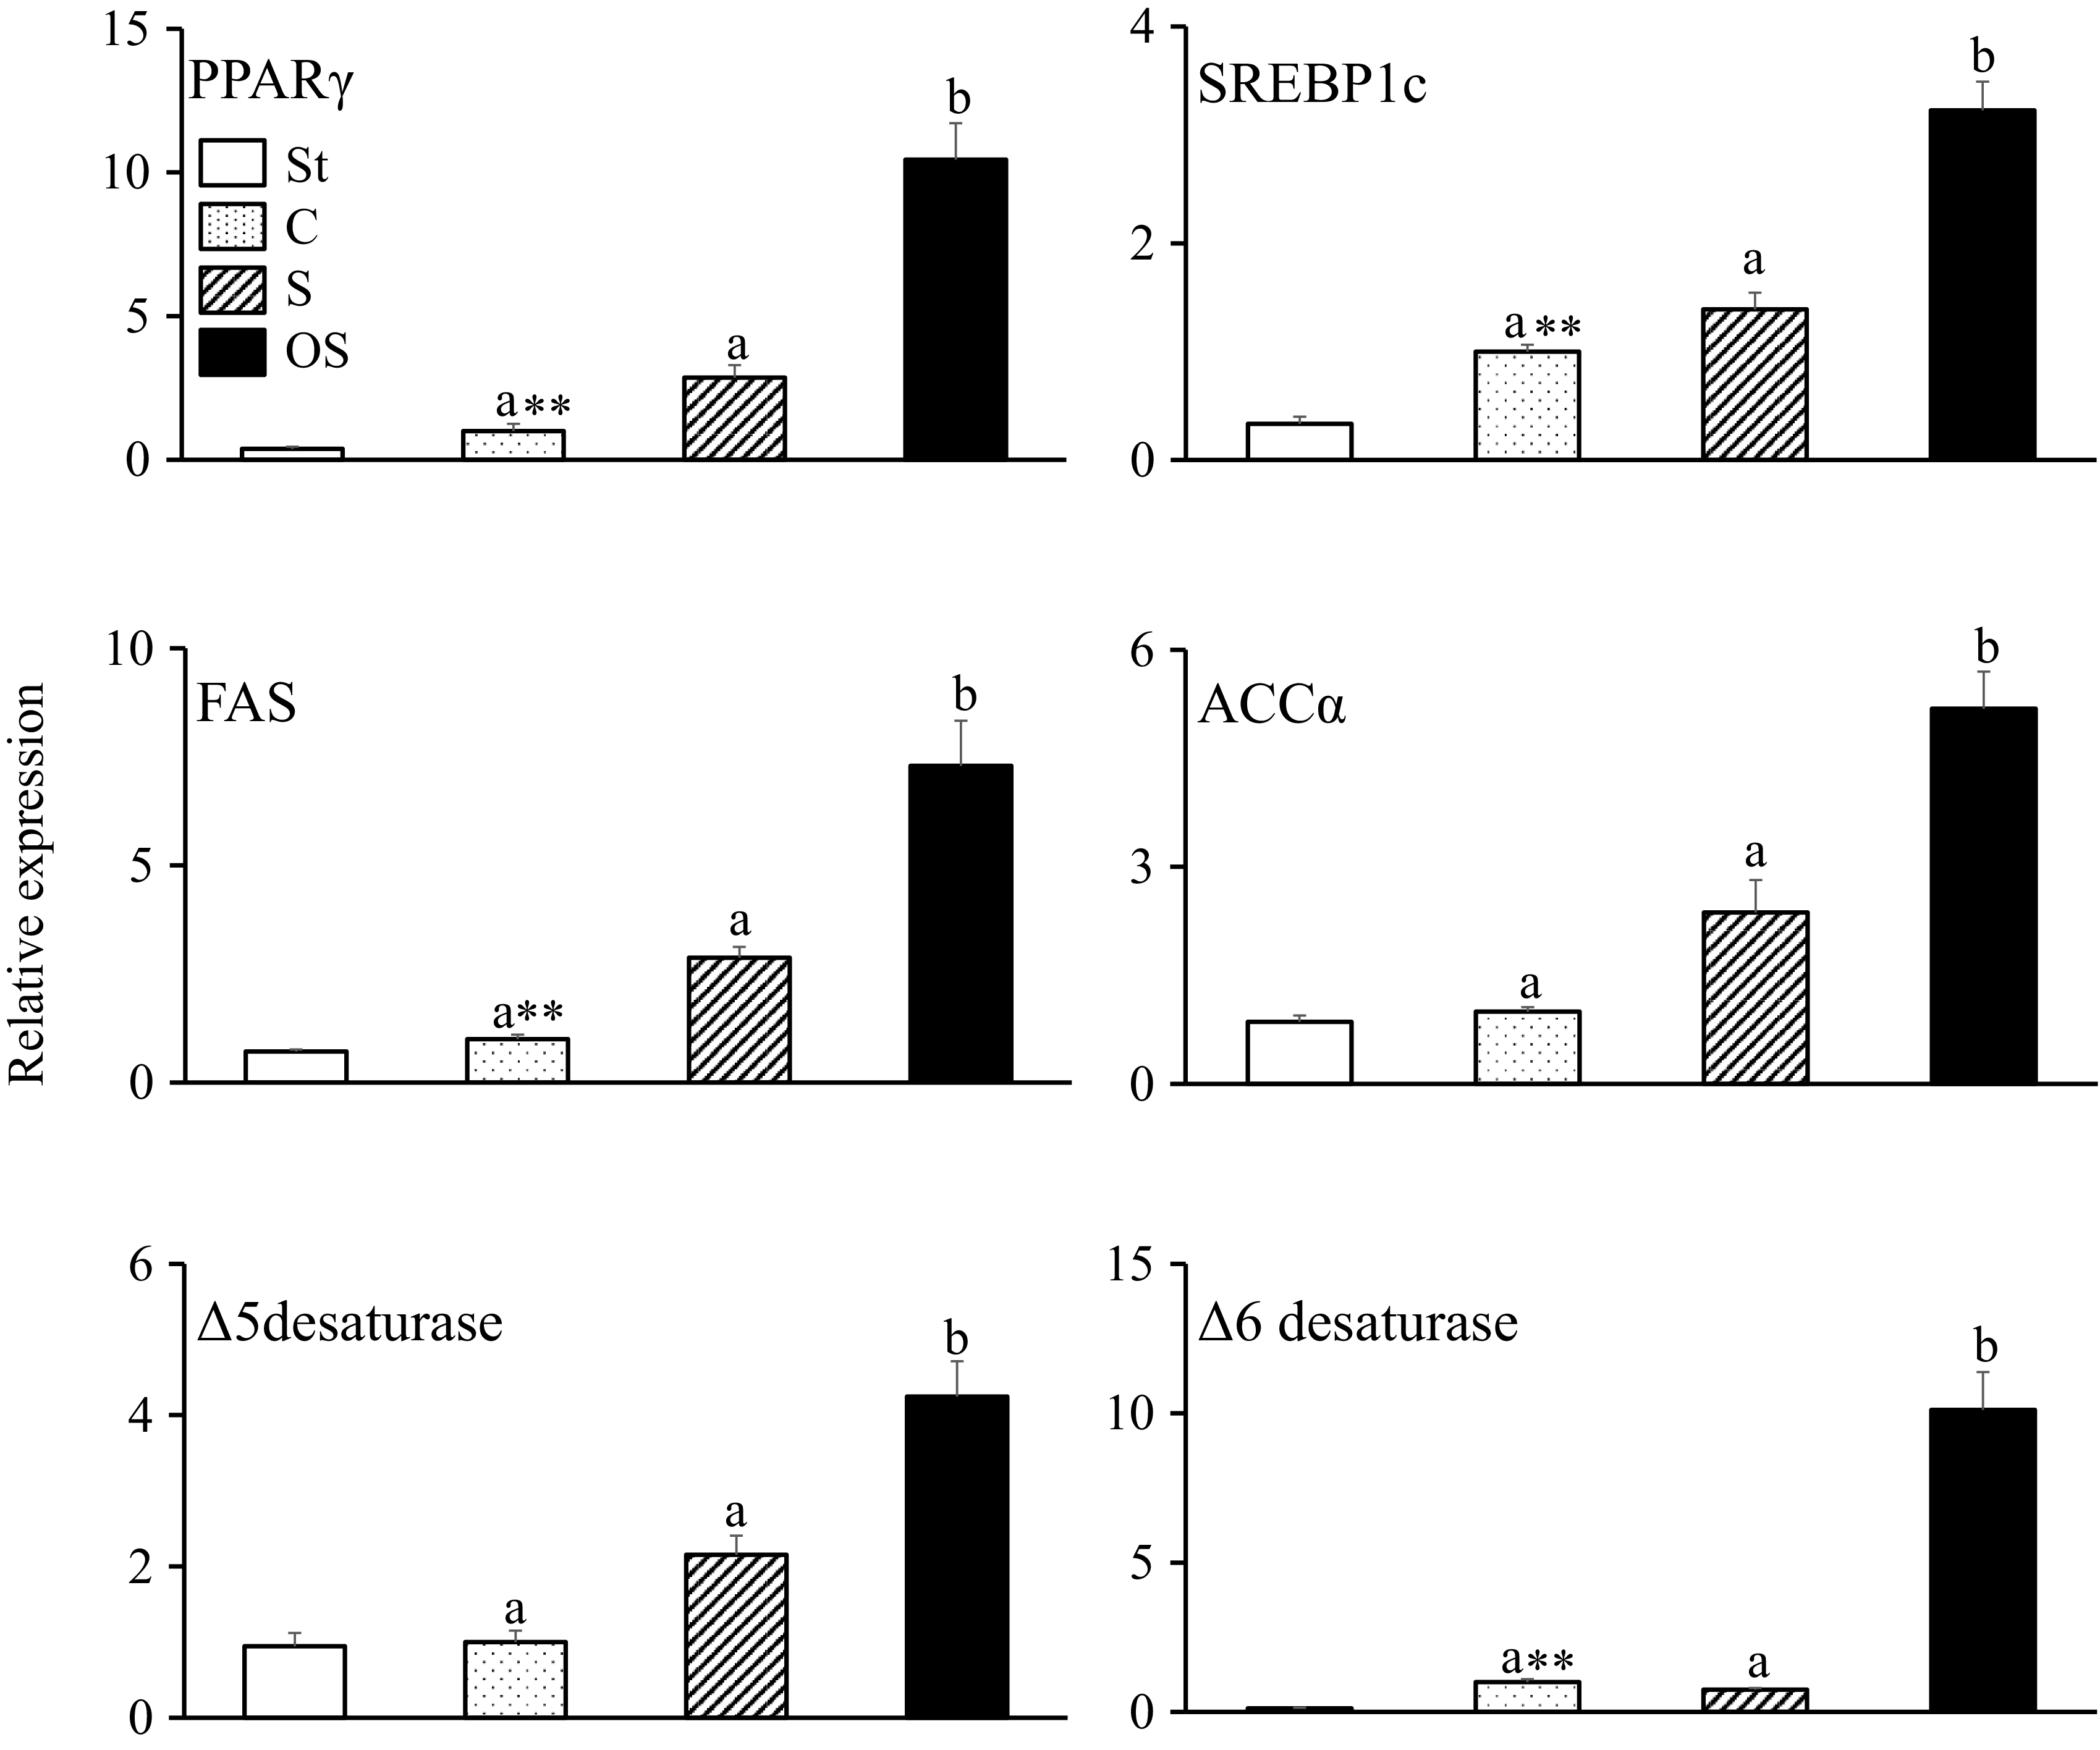
The gene expression levels of PPARγ, a nuclear receptor that is expressed in fatty liver and upregulates gene expression in fatty acid uptake and synthesis; SREBP1c, a nuclear receptor that upregulates gene expression in fatty acid synthesis; fatty acid synthase, an enzyme involved in the fatty acid synthesis pathway; Δ6 desaturase, a rate-limiting enzyme of PUFA (especially arachidonic acid) synthesis pathway, were significantly higher in the C group than in the St group and higher in the OS group than in the C and S groups (Figure 3). In contrast, ACCα, a rate-limiting enzyme of the fatty acid synthesis pathway in the liver, and Δ5-desaturase, an enzyme of the polyunsaturated fatty acid synthesis pathway, did not differ between the St and C groups but were significantly higher in the OS group than in the C and S groups.
Effects of dietary stigmasterol and oxidised stigmasterol on the gene expression of enzymes and nuclear receptors involved in fatty acid synthesis in the liver. Data are presented as the mean and sem of 5–6 mice in each group. Significant differences between values of the St and C groups at P < 0·01**. abValues without a common superscript letter are significantly different among values of the C, S and OS groups at P < 0·05. St: standard diet fed group; C: 0·25 % cholesterol fed group; S: 0·25 % cholesterol and 0·25 % stigmasterol fed group; OS: 0·25 % cholesterol and 0·25 % oxidised stigmasterol fed group.

Figure 3. Long description
The bar graph compares the relative expression of six genes: PPARγ, SREBP1c, FAS, ACCα, Δ5 desaturase, and Δ6 desaturase in the liver of mice fed different diets. The x-axis lists the genes, and the y-axis shows the relative expression levels. There are four groups represented by different bar patterns: St (white), C (dotted), S (striped), and OS (black). Each gene’s expression varies significantly among the groups, with the OS group generally showing the highest expression levels. The graph includes annotations indicating significant differences between groups at P < 0.01 and P < 0.05. The color scheme uses different patterns to distinguish between the diet groups. All values are approximated.
Effects of dietary stigmasterol and oxidised stigmasterol on the gene expression of nuclear receptors and hormones involved in fatty acid synthesis in the mucosa of the small intestine
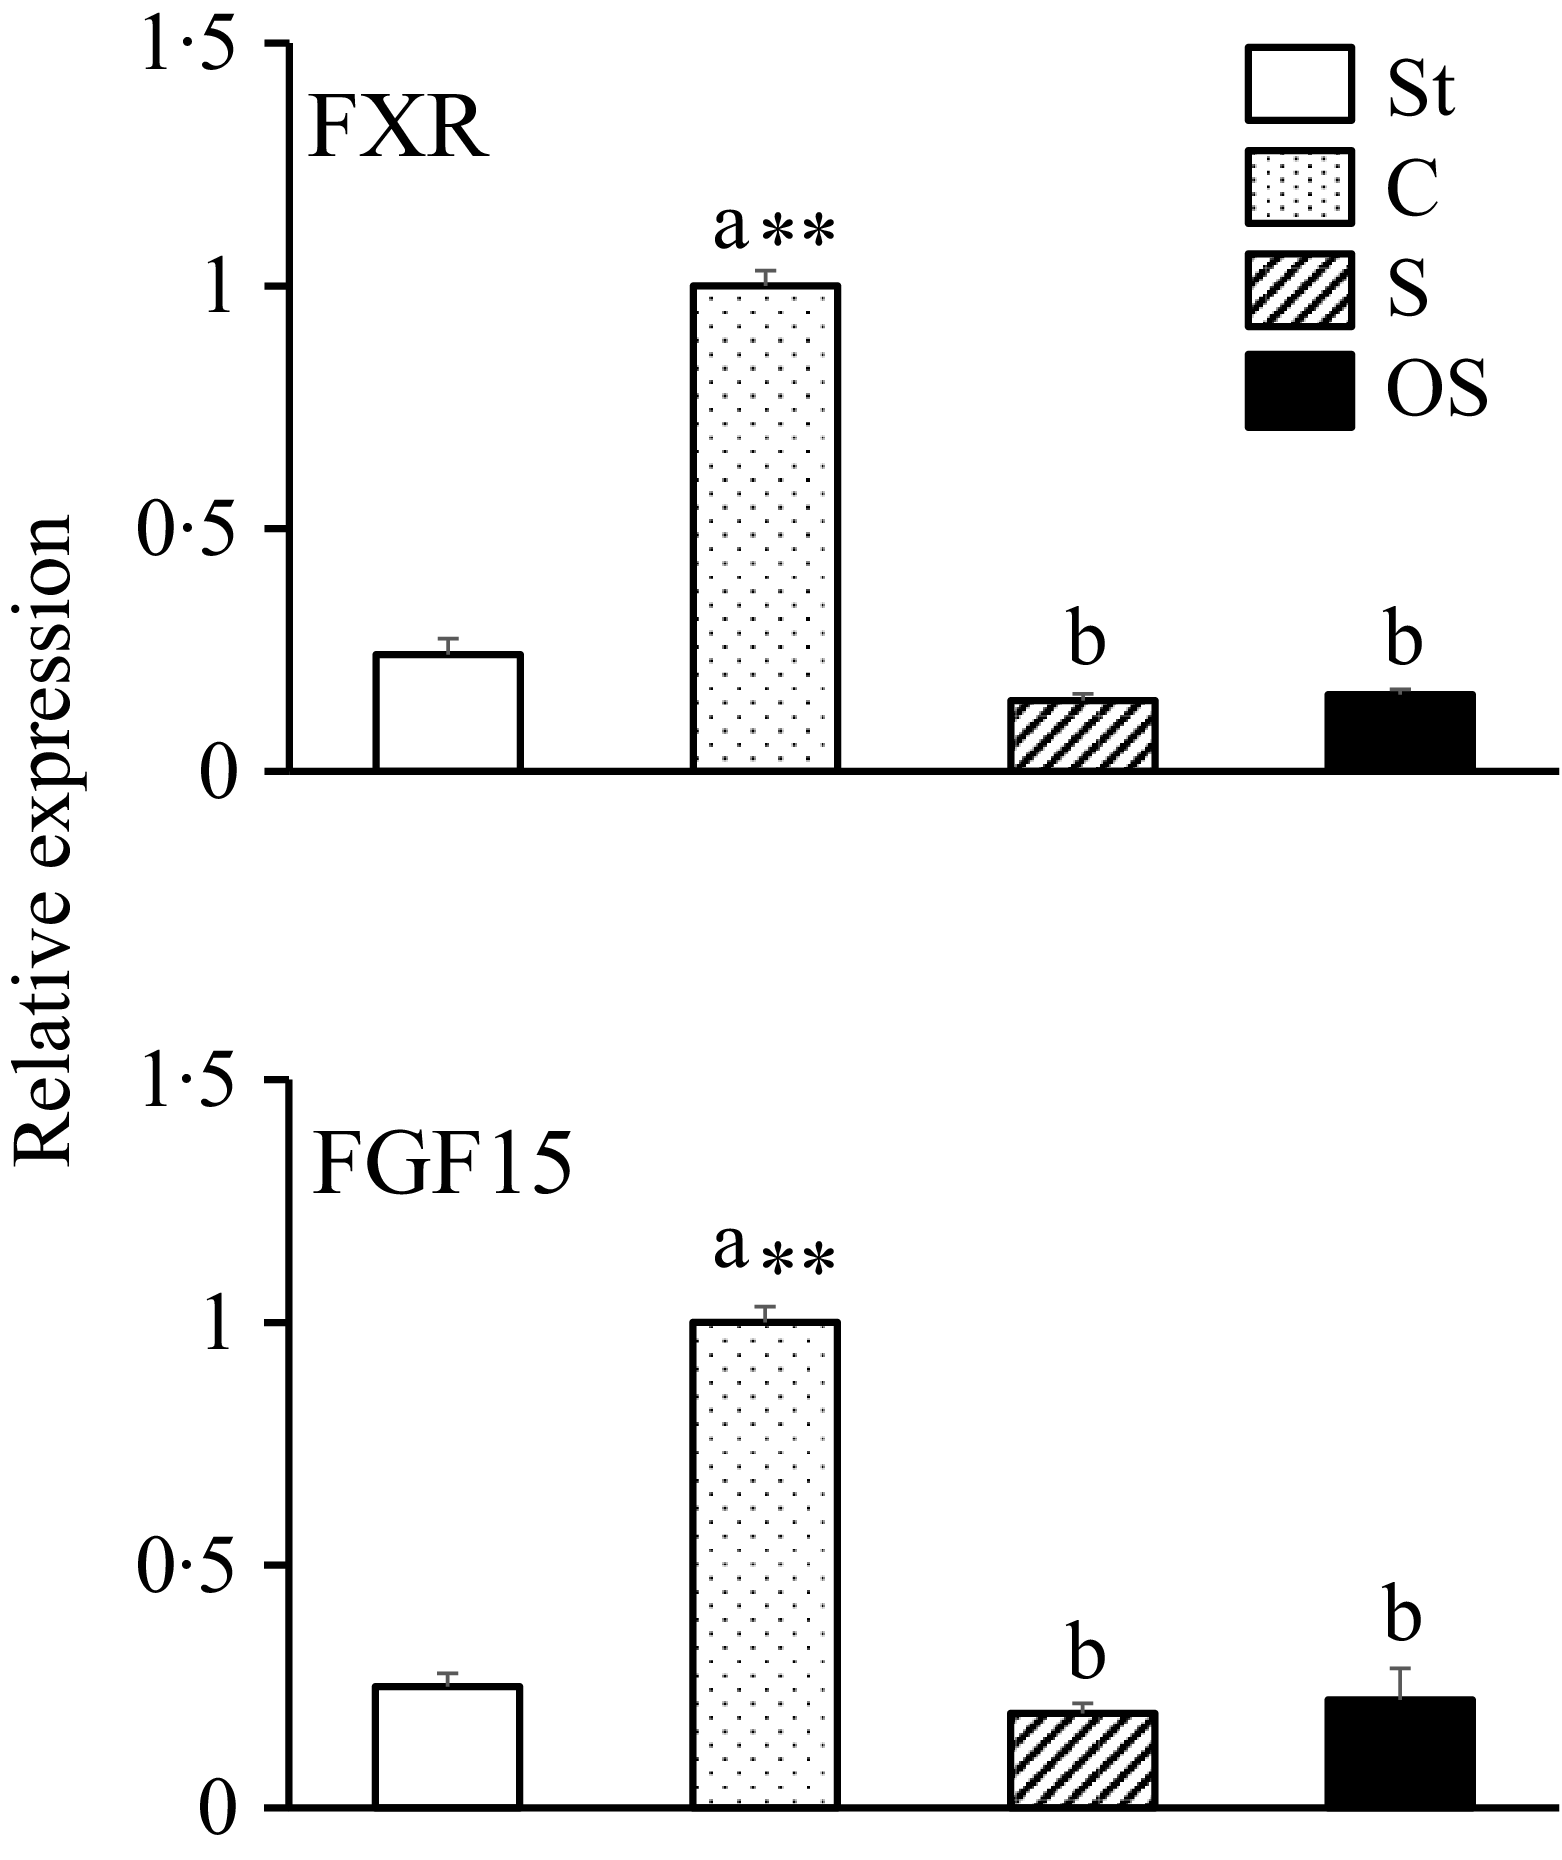
The gene expression levels of FXR, a nuclear receptor that is activated by bile acids, and FGF15, a hormone that inhibits bile acid synthesis, were significantly higher in the C group than in the St group and lower in the OS and S groups than in the C group (Figure 4).
Effects of dietary stigmasterol and oxidised stigmasterol on the gene expression of nuclear receptors and hormones involved in fatty acid synthesis in the mucosa of the small intestine. Data are presented as the mean and sem of 5–6 mice in each group. Significant differences between values of the St and C groups at P < 0·01**. abValues without a common superscript letter are significantly different among values of the C, S and OS groups at P < 0·05. St: standard diet fed group; C: 0·25 % cholesterol fed group; S: 0·25 % cholesterol and 0·25 % stigmasterol fed group; OS: 0·25 % cholesterol and 0·25 % oxidised stigmasterol fed group.

Figure 4. Long description
The bar graph compares the relative expression of FXR and FGF15 genes across four dietary groups: St, C, S, and OS. The x-axis represents the dietary groups, and the y-axis represents the relative expression levels. The graph includes two sets of bars, one for FXR and one for FGF15. The St group is represented by white bars, the C group by dotted bars, the S group by striped bars, and the OS group by black bars. The C group shows the highest expression levels for both FXR and FGF15, significantly higher than the other groups. The St, S, and OS groups show lower and similar expression levels. Annotations indicate significant differences between groups, with the C group marked with ‘a **’ and the other groups marked with ‘b’. All values are approximated.
Effects of dietary stigmasterol and oxidised stigmasterol on the gene expression of enzymes and nuclear receptors involved in fatty acid β-oxidation in the liver
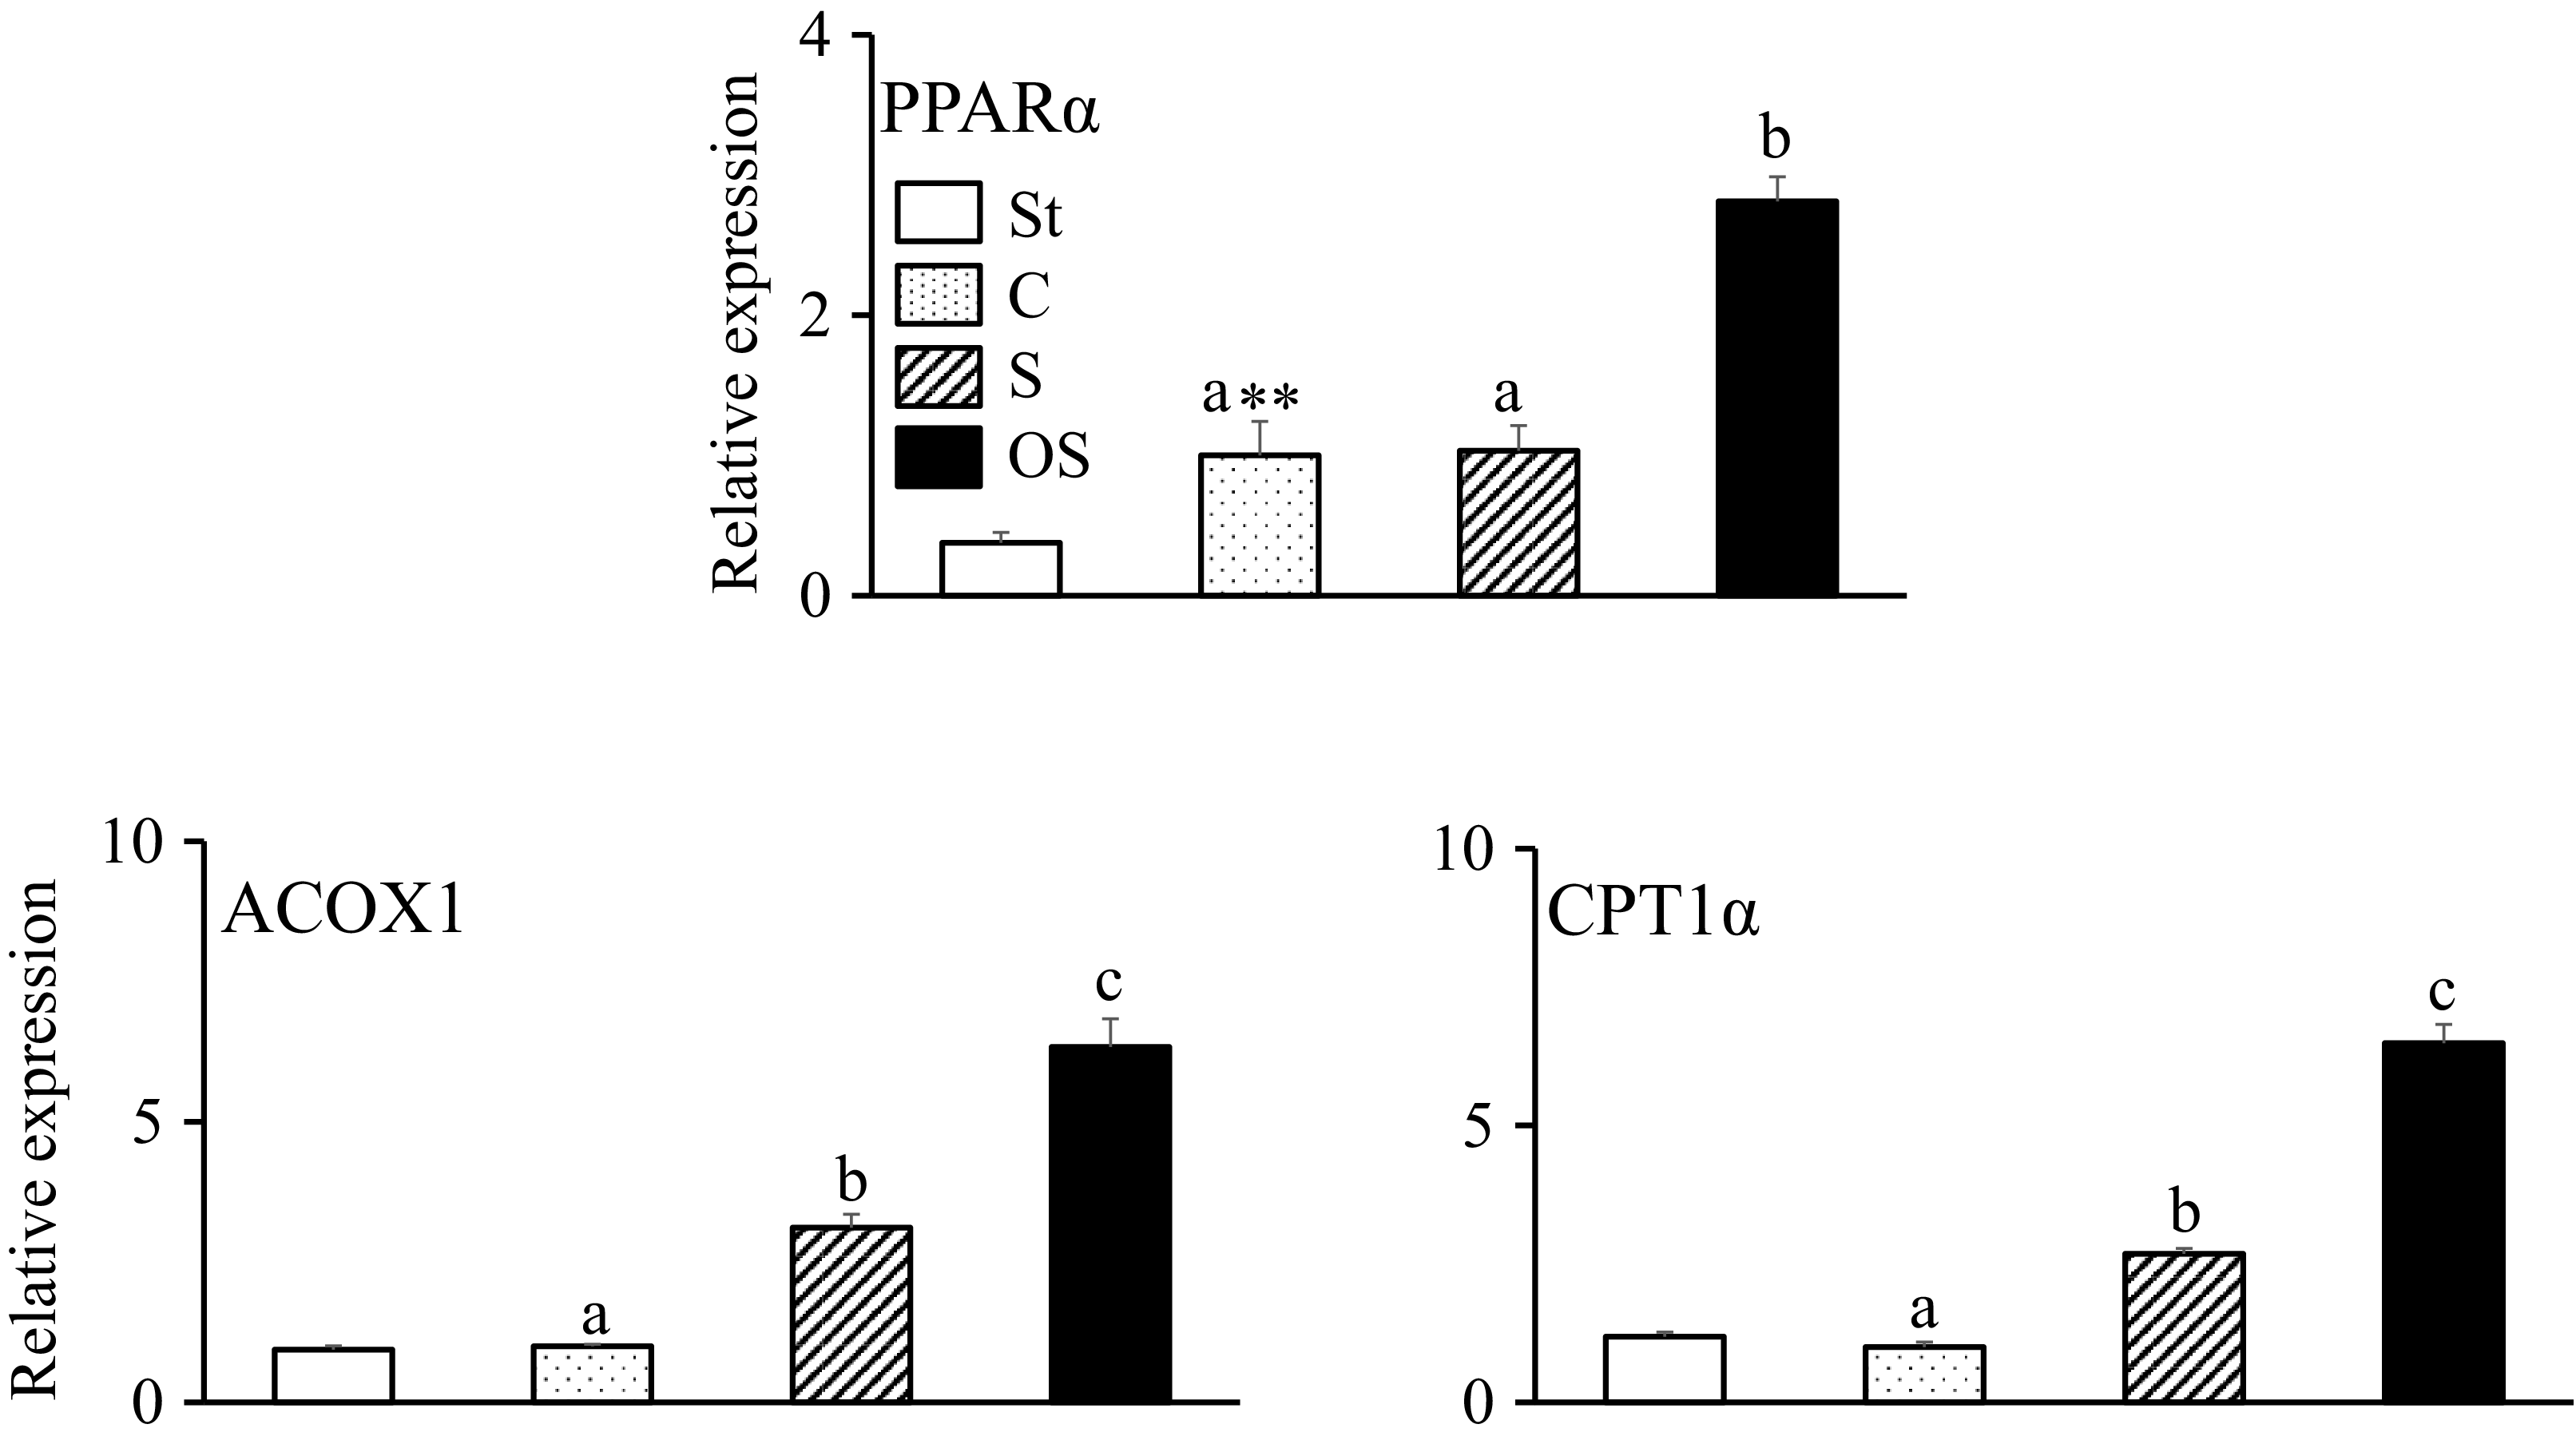
The gene expression level of PPARα, a nuclear receptor that upregulates gene expression in the fatty acid β-oxidation pathway in the liver, was significantly higher in the C group than in the St group and significantly higher in the OS group than in the C and S groups (Figure 5). The gene expression levels of ACOX1, an enzyme of the fatty acid β-oxidation pathway, and CPT1α, a rate-limiting enzyme of the fatty acid β-oxidation pathway, did not differ between the St and C groups but were significantly higher in the S group than in the C group and in the OS group than in the C and S groups.
Effects of dietary stigmasterol and oxidised stigmasterol on the gene expression of enzymes and nuclear receptors involved in fatty acid β-oxidation in the liver. Data are presented as the mean and sem of 5–6 mice in each group. Significant differences between values of the St and C groups at P < 0·01**. abValues without a common superscript letter are significantly different among values of the C, S and OS groups at P < 0·05. St: standard diet fed group; C: 0·25 % cholesterol fed group; S: 0·25 % cholesterol and 0·25 % stigmasterol fed group; OS: 0·25 % cholesterol and 0·25 % oxidised stigmasterol fed group.

Figure 5. Long description
The bar graph compares the relative expression of PPARα, ACOX1, and CPT1α in different groups of mice. The x-axis represents the groups: St, C, S, and OS, while the y-axis represents the relative expression levels. The graph is divided into three sections: PPARα, ACOX1, and CPT1α. For PPARα, the St group shows the lowest expression, while the OS group shows the highest. The C and S groups have intermediate levels of expression. For ACOX1, the St group again shows the lowest expression, with the OS group showing the highest. The C and S groups have intermediate levels. For CPT1α, the pattern is similar, with the St group showing the lowest expression and the OS group the highest. The C and S groups have intermediate levels. The bars are color-coded: white for St, dotted for C, striped for S, and black for OS. Significant differences between groups are indicated by different letters and asterisks. All values are approximated.
Effect of stigmasterol and oxidised stigmasterol on the incorporation of trilinolenin into micellar solutions
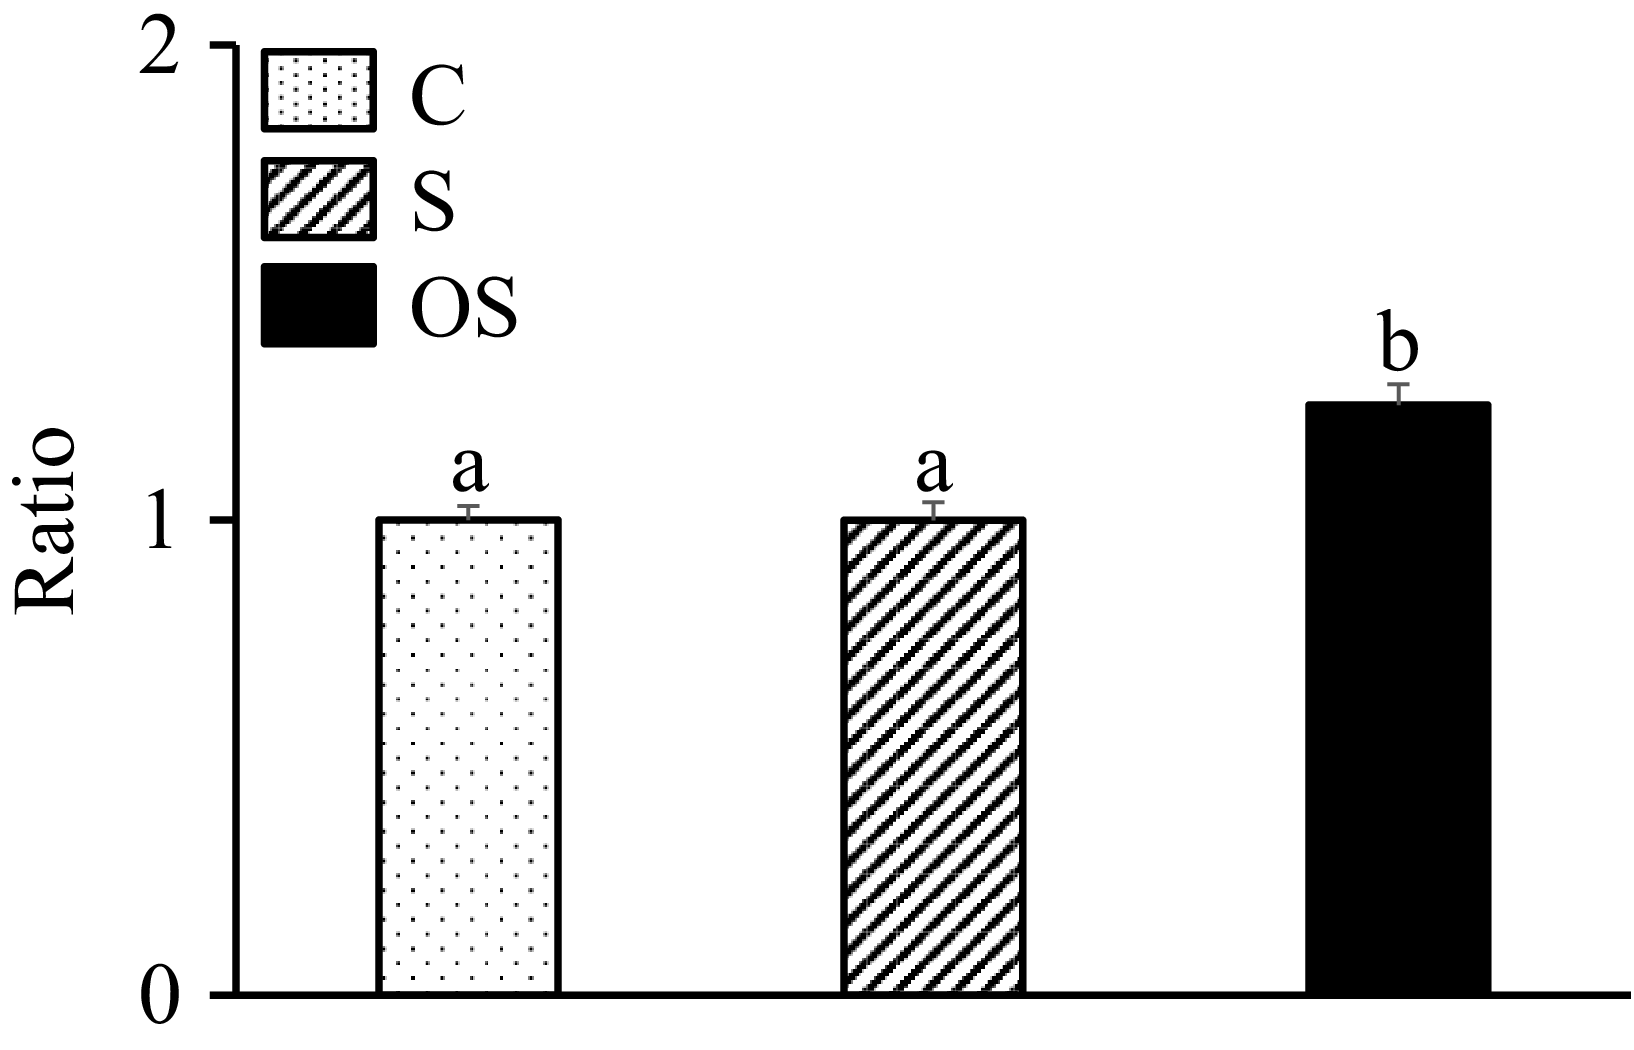
The level of α-linolenic acid in the micellar solutions was significantly higher in the OS group than in the C and S groups (Figure 6).
Effect of stigmasterol and oxidised stigmasterol on the incorporation of trilinolenin into micellar solutions. Data are presented as the mean and sem of 4 samples in each group. abValues without a common superscript letter are significantly different among values of the C, S and OS groups at P < 0·05.

Figure 6. Long description
The bar graph compares the effect of stigmasterol and oxidised stigmasterol on the incorporation of trilinolenin into micellar solutions. The x-axis represents three groups: C, S, and OS, while the y-axis represents the ratio. The graph features three vertical bars, each representing a different group. The C group is represented by a dotted bar, the S group by a striped bar, and the OS group by a solid black bar. The C and S groups have similar ratios around 1, marked with the letter ‘a’, indicating no significant difference. The OS group has a higher ratio, marked with the letter ‘b’, indicating a significant difference from the C and S groups at P less than 0.05. The data are presented as the mean and standard error of the mean of 4 samples in each group. All values are approximated.
Discussion
Stigmasterol exerts various beneficial effects, such as prevention of non-alcoholic fatty liver disease(Reference Feng, Dai and Liu17). However, our previous study revealed that dietary oxidised stigmasterol accumulates in the liver and induces oxidative stress in mice(Reference Ohara and Osada25). Koyama et al. (Reference Koyama and Osada23) found that oxidised phytosterols promoted linoleic acid metabolism in rats. Moreover, we recently reported that oxidised stigmasterol modulates cholesterol metabolism in mice(Reference Ohara and Osada26). In that study(Reference Ohara and Osada26), we discovered that oxidised stigmasterol also affects fatty acid metabolism. Therefore, we compared the effects of dietary stigmasterol and oxidised stigmasterol on fatty acid metabolism in mice.
Unlike stigmasterol, dietary oxidised stigmasterol increased TAG levels in the liver. Dietary oxidised stigmasterol increased Δ6 desaturation index in the plasma, although it did not markedly affect the fatty acid composition in the liver. It will also be necessary to examine changes in the gene expression of fatty acid transporters, such as CD36, in the liver as potential contributors to the differences in fatty acid composition between plasma and hepatic tissue. However, further changes may occur with prolonged administration of oxidised stigmasterol. Furthermore, because this study assessed the fatty acid composition of total hepatic lipids, future studies should examine the fatty acid composition of the TAG fraction to verify changes resulting from de novo fatty acid synthesis.
We recently found that dietary oxidised stigmasterol increased the gene expression of LXRα in the liver(Reference Ohara and Osada26). Janowski et al. (Reference Janowski, Willy and Devi36) demonstrated that oxidised cholesterol acts as an LXR agonist in vitro. Plat et al. (Reference Plat, Nichols and Mensink37) and Kaneko et al. (Reference Kaneko, Matsuda and Yamada38) have shown that phytosterols act as LXR agonists in vitro. Moreover, Schultz et al. (Reference Schultz, Tu and Repa39) reported that LXR activation increased the gene expression of SREBP1c, which in turn increases the gene expression of its downstream enzymes. Dietary oxidised stigmasterol increased the gene expression levels of SREBP1c and its downstream enzymes, including ACCα, fatty acid synthase, Δ5 desaturase and Δ6 desaturase in the liver. These effects may have contributed to the increased TAG levels in the liver. Therefore, unlike stigmasterol, dietary oxidised stigmasterol may promote fatty acid synthesis through its agonist-like activity on LXRα. The exact absorption rate of stigmasterol remains unknown. Previous studies have reported that the absorption rates of phytosterol, which generally occur as mixtures, range from approximately 0·5 % to 5 %(Reference Katan, Grundy and Jones40). Tomoyotri et al. reported absorption rates of 5·47 % for campesterol and 2·16 % for β-sitosterol(Reference Tomoyori, Kawata and Higuchi24), whereas Batt et al. found that the absorption rate of stigmasterol is lower than those of these two sterols(Reference Batta, Xu and Bollineni5). Additionally, some studies have suggested that the oxidation of phytosterols increases their absorption(Reference Tomoyori, Kawata and Higuchi24). Therefore, it is plausible that the absorbed oxidised stigmasterol contributed to the effects described above. However, the bioavailability of oxidised stigmasterol requires further precise investigation in future studies.
We observed that dietary oxidised stigmasterol decreased the gene expression levels of FXR and FGF15 in the mucosa of the small intestine. Zhai et al. (Reference Zhai, Zhou and Yan41) reported that the administration of astragaloside IV increased the levels of β-muricholic acid levels, an endogenous FXR antagonist, which in turn suppressed FXR and its downstream target FGF15 in the intestine. This suppression activates FXR and inhibited the gene expression of SREBP1c in the liver. In fact, we found that dietary oxidised stigmasterol increased β-muricholic acid levels in faeces and the gene expression of FXR in the liver in our recent study(Reference Ohara and Osada26). Thus, we hypothesised that oxidised stigmasterol, similar to astragaloside IV, would inhibit the gene expression of SREBP1c. However, dietary oxidised stigmasterol increased the gene expression levels of SREBP1c. This suggested that the activation of SREBP1c by oxidised stigmasterol via the LXR pathway may be stronger than its inhibition via the FXR pathway. However, β-muricolic acid, a bile acid primarily found in rodents, mediates metabolic changes in mice. In humans, it is unlikely that β-muricolic acid induces similar metabolic effects. Previous studies have reported that the absorption of phytosterols containing oxidised derivatives is low in humans(Reference Ostlund42), and the bioavailability of oxidised phytosterols remains incompletely understood. Our results suggest that dietary oxidised stigmasterol in mice may promote SREBP1c expression via LXRα activation, thereby enhancing fatty acid synthesis. Nevertheless, given potential interspecies differences, further studies are required to determine how oxidised stigmasterol influences lipid metabolism in humans.
Furthermore, we observed that dietary oxidised stigmasterol increased the gene expression levels of PPARα and its downstream enzymes, including CPT1α and ACOX1, in the liver. This observation may be exerted as a compensatory response to excessive TAG accumulation in the liver. Reddy et al. (Reference Reddy and Hashimoto43) showed that PPARα-dependent genes were induced as a compensatory mechanism against TAG accumulation in the liver. Alternatively, the increase in the gene expression of PPARα and its downstream enzymes may be caused by the agonist-like activity of oxidised stigmasterol on PPARα. Wongphukhiaw et al. (Reference Wongphukhiaw, Jako and Puengpan44) revealed that a molasses extract containing phytosterol exhibited PPARα-agonist-liked activity. Kramer et al. (Reference Kramer, Wang and Loque45) reported that 10-hydroxystearic acid, an oxidised fatty acid, ameliorated lipid metabolism through PPARα activation in the liver of mice fed aflatoxins. Therefore, dietary oxidised stigmasterol, unlike stigmasterol, may promote fatty acid β-oxidation in the liver through a PPARα-agonist-like activity. However, changes in gene expression alone cannot fully explain these effects. Depending on the administered level of oxidised stigmasterol, the PPARα pathway may be antagonised. Measurement of ketone bodies, such as β-hydroxybutyrate, could provide an effective approach to clarify the effects of oxidised stigmasterol on PPARα in future studies. With regard to hepatic TAG accumulation, future studies should examine not only changes in the expression of SREBP1c and PPARα but also downstream processes, including fatty acid synthesis, β-oxidation, VLDL secretion and gene expression and enzyme activities associated with fatty acid influx from the small intestine and adipose tissue. Furthermore, in addition to gene expression, protein levels of each factor should also be evaluated.
We observed that dietary oxidised stigmasterol, unlike stigmasterol, decreased the total fatty acid levels in faeces. Moreover, we found that oxidised stigmasterol increased the α-linolenic acid level in the micellar solution in vitro. Krut et al. (Reference Krut46) demonstrated that oxidised cholesterol interacts with phosphatidylcholine, thereby facilitating cholesterol solubilisation in phospholipid micelles in aqueous media. Penumetcha et al. (Reference Penumetcha, Merchant and Parthasarathy47) reported that oxidised linoleic acid promotes cholesterol solubilisation and increases the intestinal absorption of fatty acids by an action similar to that of bile acid. Therefore, dietary oxidised stigmasterol may increase fatty acid absorption in the small intestine by altering micellar solubilisation properties in the intestinal lumen, thereby increasing TAG levels in the liver. However, further in vivo verification using fat labelled with stable isotopes will likely be necessary to determine whether oxidised stigmasterol enhances fat absorption because these in vitro results do not fully replicate the intestinal environment.
In summary, dietary oxidised stigmasterol, unlike stigmasterol, may promote fatty acid synthesis in the liver rather than fatty acid β-oxidation. Furthermore, the increase in fatty acid absorption from the small intestine may have contributed to increased TAG levels in the liver. These findings indicate concerns regarding the use of foods and health supplements containing phytosterols.
In this study, a high level of oxidised stigmasterol was given to elucidate the mechanism underlying its effects on fatty acid metabolism. Future research should examine the effects of lower level in long-term feeding trials to better characterise impact of dietary oxidised stigmasterol on lipid metabolism. Furthermore, building on previous research, we employed a hypercholesterolaemic mouse model to investigate the distinct effects of stigmasterol and oxidised stigmasterol on fatty acid metabolism under a high-cholesterol diet. Our results demonstrate that these compounds differentially modulate fatty acid metabolic pathways. However, it remains unclear how these effects manifest in mice under normal dietary conditions – that is, in a healthy mouse mode. Therefore, further studies under cholesterol-free conditions are warranted.
Conclusion
In this study, we found that dietary oxidised stigmasterol, unlike stigmasterol, reduces faecal fatty acid excretion and promotes hepatic fatty acid synthesis. Notably, this enhancement of hepatic fatty acid synthesis may have contributed substantially to the observed increase in hepatic triglyceride levels. Oxidised stigmasterol also upregulated genes involved in fatty acid β-oxidation in the liver; however, this may represent a compensatory response against TAG accumulation and /or activation of PPARα in the liver. Our results suggest that, unlike stigmasterol, oxidised stigmasterol exerts distinct and potentially harmful effects on fatty acid metabolism.
Acknowledgements
We would like to thank Editage (www.editage.jp) for English language editing.
This study was supported by the JSPS KAKENHI (Grant Number: 25K08989).
Y. O.: Investigation, Formal analysis, Data curation, Writing – original draft. K. O.: Conceptualization, Methodology, Supervision, Funding acquisition, Writing – review & editing.
The authors declare no competing interests relevant to the contents of this article.
The manuscript does not contain clinical studies or patient data.

 Open access

