


Introduction
When does bilingualism begin? Recent evidence suggests that, even before individuals show proficiency in using or understanding a language in communicative settings, individuals may have implicit knowledge of that language. This consists of knowledge of lexical items (although not necessarily their meaning; §1.2), as well as fine-grained details about their phonotactics.
Recent research into this knowledge was evaluated through experimentation with New Zealanders who did not speak Māori (the indigenous language of New Zealand). Despite not speaking it, most New Zealanders are exposed to Māori to a limited degree, and thus have the opportunity to build up implicit knowledge of the language. Oh et al. (Reference Oh, Todd, Beckner, Hay, King and Needle2020) found that non-Māori Speaking New Zealanders (NMS) have intuitions about the gradient phonotactics of Māori, matching the judgments of proficient speakers of Māori. Furthermore, they were able to distinguish real Māori words from Māori-like nonwords. Panther et al. (Reference Panther, Mattingley, Todd, Hay and King2023) replicated and extended this result, finding that participants who were better able to distinguish real Māori words from Māori-like nonwords were also better able to track fine-grained gradient phonotactics.
These results point to a form of latent bilingualism. That is, an apparently monolingual (see §1.3) population can develop implicit, latent knowledge of a language through long-term exposure. Based on their results, Oh et al. (Reference Oh, Todd, Beckner, Hay, King and Needle2020) and Panther et al. (Reference Panther, Mattingley, Todd, Hay and King2023) hypothesise that this knowledge derives from a large memory store of forms that recur with statistical regularity in their experience with Māori. The construction of this memory store appears to be mostly passive, and the knowledge it endows appears to be unconscious, because participants in both studies self-reported relatively low levels of Māori language ability.
Oh et al. (Reference Oh, Todd, Beckner, Hay, King and Needle2020) and Panther et al. (Reference Panther, Mattingley, Todd, Hay and King2023) focused on word recognition and on phonotactic knowledge. In their discussion and computational modelling of results, Oh et al. (Reference Oh, Todd, Beckner, Hay, King and Needle2020) hypothesised that the memory store of forms that underpins this knowledge contains not only whole Māori words, but also parts of words. It follows that NMS should be able to segment words into parts, but this has not yet been confirmed experimentally.
In this paper, we present and analyse the results of an experiment in which non-Māori-speaking New Zealanders (NMS), who have ambient exposure to Māori, and non-New Zealanders, who do not have ambient exposure to Māori, were asked to segment Māori words into parts. The results show that the segmentations of NMS strongly correlate with the segmentations of fluent Māori speakers, and that they pick up on statistical patterns evidenced in the segmentations of fluent Māori speakers much more than do the segmentations of non-New Zealanders. Thus, NMS can identify the parts of words, and can use their knowledge to make reasonable estimates about where the boundaries between parts are likely to be in morphologically complex words. We hypothesise that this shows that NMS are aware of the morphological structure of Māori words, and possess knowledge of the probabilistic cues associated with morphological boundaries. This adds to the existing evidence of widespread latent knowledge of Māori among non-Māori speakers in New Zealand.
In order to contextualise this experiment, we first review literature on implicit language learning. We then outline work on the ‘proto-lexicon’ – work showing that infants and adults develop memories of wordforms, without semantic knowledge.
1.1. Implicit Language Learning
The literature contrasts explicit and implicit learning of a second language (DeKeyser, Reference DeKeyser1994; DeKeyser, Reference DeKeyser2003; Hulstijn, Reference Hulstijn2005; MacWhinney, Reference MacWhinney1997; Rebuschat, Reference Rebuschat2015; Sanz & Leow, Reference Sanz and Leow2011). Explicit language learning refers to learning through language instruction and education, while implicit language learning refers to learning through inference and exposure.
Implicit learning also impacts language learning in the classroom (Talley & Hui-Ling, Reference Talley and Hui-Ling2014). The literature generally presents a view that children learn implicitly, while adults learn explicitly, with adults generally losing the ability to implicitly learn language (Bialystok, Reference Bialystok and Ellis1994; Ellis, Reference Ellis2005, Reference Ellis2009; Ullman, Reference Ullman2001). More recent research has challenged this approach, arguing that the appearance of a loss of implicit learning in adults is the result of pedagogical approaches to adult language teaching, rather than to do with age (Lichtman, Reference Lichtman2013).
Further evidence for this idea is from the evidence of implicit learning outside of formal language education. Kuppens (Reference Kuppens2010) found that children and adolescents in Belgium that watched subtitled English television regularly performed better at English tests than those who did not, indicating that through exposure to English language media, participants were learning English. This ability to identify patterns in an unfamiliar language begins early: one study showed that eight-month old infants were able to correctly identify words in an artificial language and distinguish them from word parts after short-term exposure (Aslin et al., Reference Aslin, Saffran and Newport1998; Saffran et al., Reference Saffran, Aslin and Newport1996; see also Saffran, Reference Saffran2001; Saffran et al., Reference Saffran, Werker and Werner2007).
Surprisingly, research with adult participants found similar results. A study with adults who had little to no experience with Norwegian showed that they were able to distinguish Norwegian words from non-words after brief exposure to the language (Kittleson et al., Reference Kittleson, Aguilar, Tokerud, Plante and Asbjørnsen2010). Research into artificial language learning found adults are able to identify words in that artificial language after a short period of familiarization (Saffran et al., Reference Saffran, Newport, Aslin, Tunick and Barrueco1997). This research found adults’ ability to do this was comparable to that of young children, adding to the evidence that adults are capable of implicit learning.
The literature also identifies the ability of adults to implicitly learn morphological patterns. Rogers et al. (Reference Rogers, Révész and Rebuschat2016) exposed a cohort of 51 young adults to an artificial language system based on Czech morphology for approximately 25 minutes. The learning process involved audio and prompted the participants to repeat sentences. It also included picture matching, with no feedback or explicit teaching given to the participants. After exposure, the participants were tested with a grammaticality judgment task, to determine if the participants had identified patterns in case marking in the stimulus materials. The results showed that participants outperformed a control group in the grammaticality judgment task, showing implicit learning of the correct grammatical forms after relatively little exposure.
Other research in this area supports these findings. Grey et al. (Reference Grey, Williams and Rebuschat2014) conducted an experiment on second language learning adults with a constructed language that was based on Japanese. Participants were presented with 128 aural sentences as a learning procedure. In order to test their learning, an acceptability judgment task was used to determine how participants learned the word order rules, and a picture-matching task was used to test the ability of participants to correctly identify the meanings of the case inflections. Each task was conducted twice: participants were tested immediately after the learning procedure, and also after two weeks. The results showed that participants performed well in both acceptability judgment task tests. However, participants performed poorly in the immediate picture matching task, with answers not significantly greater than chance. Surprisingly, their answers improved significantly in the delayed test, with an average accuracy of 56.3%, which a t-test showed was greater than chance. This supports the notion that even a short period of implicit language learning results in long-term linguistic knowledge. These studies show that learners can implicitly learn form-meaning associations in morphological systems, and a precursor to learning morphological associations is learning to recognise morphs themselves, and storing them in memory.
There is a lack of research into how non-speakers learn to segment words, and to process other forms of morphological complexity, such as compounding. However, adults are able to use phonotactic cues to segment words from sentences in an unfamiliar language (Newport & Aslin, Reference Newport and Aslin2000; Onnis et al., Reference Onnis, Monaghan, Richmond and Chater2005; Peña et al., Reference Peña, Bonatti, Nespor and Mehler2002), and the phonotactic cues of morpheme boundaries frequently resemble the cues at word boundaries (Hay, Reference Hay2004). Given the degree to which language contains recurring morphemes, with distinctive phonotactics at morpheme boundaries, it could be difficult for learners to implicitly learn words without also learning morphemes in the process.
This view is supported by the literature on the modelling of morphological segmentation processes. This literature supports the proposition that morphological segmentation can be achieved without semantic knowledge, by providing a variety of algorithms in which recurrent morphological patterns can be learned in a bottom-up fashion from exposure to word forms alone (Creutz & Lagus, Reference Creutz and Lagus2007; Goldwater et al., Reference Goldwater, Griffiths and Johnson2011). Indeed, it has been shown that the learnability of morphs is statistically possible, even with a relatively low level of language exposure (Fang et al., Reference Fang, Ostendorf, Baumann and Pierrehumbert2015). Native English speakers are also able to decompose non-words into morphological components, showing that morphological decomposition does not need to involve the association of meaning to any of the subparts (Needle et al., Reference Needle, Pierrehumbert, Hay, Sims, Ussishkin, Parker and Wray2022; see also Hay et al., Reference Hay, Pierrehumbert, Beckman, Local, Ogden and Temple2004). In sum, the existing literature supports Oh et al.'s conjecture that implicit exposure to a language may contribute to implicit morphological knowledge about that language.
1.2. The L2 Proto-Lexicon
The term ‘proto-lexicon’ refers to a mental lexicon that consists of sound sequences stored in long-term memory. It is not endowed with the morpho-syntactic and semantic properties of a fully-developed lexicon (Hallé & de Boysson-Bardies, Reference Hallé and de Boysson-Bardies1996; Johnson, Reference Johnson2016; Martin et al., Reference Martin, Peperkamp and Dupoux2013; Ngon et al., Reference Ngon, Martin, Dupoux, Cabrol, Dutat and Peperkamp2013).
The proto-lexicon is generally associated with infant language acquisition. Experimental research into the lexical knowledge of infants provides evidence of the nature of the proto-lexicon (Johnson, Reference Johnson2016; Junge, Reference Junge, Westermann and Mani2017; Jusczyk, Reference Jusczyk2000; Swingley, Reference Swingley2005, Reference Swingley2009). For example, research found that 11 month olds were able to recognise word forms, including word forms that they did not know the meaning of (Vihman et al., Reference Vihman, Nakai, DePaolis and Hallé2004; see also Swingley, Reference Swingley2005).
Important to this current research is the notion of a proto-lexicon in L2 acquisition. The literature in this area shows that adults are capable of retaining words in an unfamiliar language in their long-term memory. For example, Frank et al. (Reference Frank, Tenenbaum and Gibson2013) exposed adults to an artificial language for 10 hours. Experimentation three years later showed that the participants were still able to recognise certain high frequency words from that artificial language. The nature of the task means that the participants were able to remember these words, but not associate to them meaning. The evidence from implicit learning in adults (§1.1) also supports the idea that adults retain latent linguistic (including lexical) knowledge through language exposure, which will include both overt knowledge of words and their meanings, as well as more implicit knowledge of words and word parts. Consequently, there is evidence that adults who are exposed to a language will begin to automatically identify and retain words in that language. The resulting set of remembered items forms a proto-lexicon.
1.3. The Māori Language
Māori is the indigenous language of New Zealand. The 2018 New Zealand Census reported 185,955 people as Māori speakers. This is approximately 3.9% of the total population of New Zealand (Statistics New Zealand, 2020). Māori has ten consonant phonemes /p, t, k, m, n, ŋ, w, f, r, h/ and five vowels /i, e, a, o, u/. Vowel length is phonemic, and each vowel has a long counterpart. The orthography is highly transparent, with the consonants represented by the letters <p, t, k, m, n, ng, w, wh, r, h>, and the vowels represented by <i, e, a, o, u> respectively. Long vowels are represented with a macron: <ī, ē, ā, ō, ū>. Māori also has a transparent morphological system, in which there is relatively little inflectional and derivational morphology, and in which zero derivation and compounding is frequent (Harlow, Reference Harlow2007). The only inflectional suffix in Māori is the passive suffix -Cia.Footnote 1 There are three productive derivational affixes: (i) the causative prefix whaka-; (ii) the agentive prefix kai-; (iii) the nominal suffix Canga (Bauer, Reference Bauer1993; Harlow, Reference Harlow2007). There are a number of other fossilised affixes that are no longer productive (see e.g., Krupa, Reference Krupa1966). All morphemes in Māori must end with a vowel – consonant-final forms are ungrammatical (Bauer, Reference Bauer1993).
Māori vocabulary and language are used in media and education, as well as cultural contexts in New Zealand. Several television and radio stations broadcast partly or exclusively in Māori. Furthermore, there are public initiatives to increase the visibility of the Māori language, including Māori language week/Te Wiki o Te Reo Māori. While individuals in New Zealand receive consistent, low level exposure to Māori, fluency is rare. Research has shown that the average non-Māori New Zealander knows the meaning of fewer than 100 Māori words (Macalister, Reference Macalister2004).
1.4. Previous Research
Previous research into the knowledge of Māori that NMS possess has hypothesised the existence of a Māori proto-lexicon (Oh et al., Reference Oh, Todd, Beckner, Hay, King and Needle2020; Panther et al., Reference Panther, Mattingley, Todd, Hay and King2023). Both of these studies conducted two experiments. The first experiment, an Identification Task, presented participants with a set of real Māori words and phonotactically matched Māori nonwords, and asked them to rate on a 5-point Likert scale how confident they were that the stimulus was a real word. In both studies, participants generally rated real words higher than the fake words. This shows the existence of a high degree of proto-lexical knowledge among NMS.
The second experiment was a Wellformedness Rating Task. In this experiment, participants were presented with nonwords, and were tasked with rating how Māori-like the word was on a Likert scale. The nonwords spanned a range from very phonotactically non Māori-like, to very phonotactically Māori-like. In both studies, participant ratings positively correlated with how Māori-like the word was. Consequently, NMS possess not only lexical knowledge of Māori, but also fine-grained phonotactic intuitions. Furthermore, Panther et al. (Reference Panther, Mattingley, Todd, Hay and King2023) showed that a participant's performance in the Identification Task could predict their performance in the Wellformedness Rating Task. This result suggests a link between the lexical and phonotactic knowledge displayed by NMS, consistent with the idea that both derive from a proto-lexicon.
A key question in Oh et al. (Reference Oh, Todd, Beckner, Hay, King and Needle2020) was whether the NMS proto-lexicon consists of word forms, or word parts. In that study, Monte Carlo analyses found that assuming a proto-lexicon consisting of word parts (which Oh et al., Reference Oh, Todd, Beckner, Hay, King and Needle2020 call “morphs”) provided the best explanation of the results. Importantly, however, there is no independent evidence of this; in particular there is not yet any experimental evidence of the ability of NMS to identify the sub-components of words.
The goal of this paper is to provide experimental evidence for this finding in previous research, and to identify general trends in how NMS segment Māori words. This will be conducted in comparison with how fluent Māori speakers segment words.
1.5. Establishing a Baseline from Fluent Māori speakers
In order to assess the ability of NMS to segment words, we need first to determine a baseline of word segmentations that might be expected on the basis of strong knowledge of Māori.
For items with inflection or derivational morphology, word parts can be inferred procedurally from the dictionary through identification of the relevant morpheme. This includes words with the causative prefix whaka-, verbs with the passive suffix (when the verb base also occurs in the dictionary), and words with the nominal suffix. Total reduplicants can also be inferred from their structure. We used such a procedural approach here as a first pass. In the case of affixes, a boundary was inferred at the affix boundary (e.g., whakatinana ‘embody’ → whaka|tinana, arumia ‘followed’ → aru|mia). In the case of total reduplication, the boundary was placed in the middle of the word (kanikani ‘dance’ → kani|kani). We can be confident that any fluent speaker of Māori will identify these transparent morphemes as word parts.
For many other words, for example, potential compounds (e.g., karangarua) or partial reduplicants (e.g., pepeha), no ‘ground truth’ can be directly inferred from the dictionary. For these words, then, a segmentation was obtained prior to the experiment reported in this paper. Two highly proficient speakers of Māori (the “Expert Raters”, henceforth ERs) were tasked to segment words in the Te Aka dictionary (Moorfield, Reference Moorfieldn.d.) into parts. Both ERs were in their early 20s, and went through Māori language medium preschooling (kōhanga reo) and schooling (kura kaupapa). For each word, the ERs either segmented it into parts, or could choose to not segment it. If the word was the base of a complex word with an affix (and therefore there was an inferred segmentation), the analysis that the ER provided for that word was applied to that base. For example, the word whakawhānui ‘expand’ includes the prefix whaka, and consequently there is an inferred segmentation at that boundary: whaka|whānui. However, if an ER segmented whānui ‘broad’ as whā|nui, the resulting inferred segmentation for whakawhānui is whaka|whā|nui for that ER. For some words, the ERs did not know how to segment it, and decided not to give an analysis at all. Any items that at least one ER did not analyse were removed prior to analysis. The resulting dataset consisted of a list of 18,630 words that both ERs provided segmentations for, and this set also includes the 7,260 items that include an inferred segmentation.Footnote 2
It is important to emphasise at this point that we do not treat the segmentations by the ERs (or the NMS, for that matter) as morpheme boundaries. Whether or not the segmentation of word parts reflects the “real” morphology of complex words is an empirical question that will be analysed in future research. However, we do assume that the decision to segment at particular positions relates to the structures of Māori morphemes; indeed, we show below that the positions that the ERs segmented show patterns that are consistent with the properties of Māori morphemes. However, the focus here is on the intuitions that ERs relied on when segmenting Māori words, not the status of the segmented word parts themselves.
In order to utilise the ER judgments for analysis in this paper, we coded three categories for judgment based on whether or not both ERs segmented at a particular location in each word: “Yes”, “Disagree”, and “No”. For example, if one ER segmented the word “waenganui” as waenga|nui, and the other ER segmented this word as waenga|nui, then both ERs agree on a segmentation between “waenga” and “nui”. In this case, the segmentation would be coded as “Yes”, because both ERs agreed on it. However, if there was a disagreement – for example, one ER segmented the word as wae|nganui, and the other ER segmented as waenga|nui – both of these positions were coded as “Disagree”, due to one ER placing a segmentation in those positions, but not the other. Locations that neither ER segmented were coded as “No”. The inferred segmentations were treated as “Yes” for the purpose of this analysis.
Our focus in this paper is on polymoraic words – words containing four or more moras. The polymoraic words are a class of words without transparent morphology, but are also potentially complex. Our goal is to identify trends in how ERs segment polymoraic words, and evaluate whether NMS segment using the same strategies. In order to generate our hypotheses, then, we first examine the patterns of segmentations of polymoraic words by the ERs. For simplicity, in the current section we disregard words that contain any “Disagree” segmentations. In the statistical analysis later in the paper, we group the “Disagree” category with the “Yes” category.
In this paper we focus on a set of 1,317 polymoraic words, the set of polymoraic words in the segmentation experiment reported in this paper, excluding the words that the ERs could not provide an analysis for (§2.1). In this section, we focus on the ER ratings, and thus also exclude words that the ERs disagreed on. There are 924 words with a clear ER analysis. 817 (88.4%) words contained four moras, 53 (5.7%) contained five moras, 53 (5.7%) contained six moras, and one contained seven moras. In terms of the possible segmentable positions (i.e., all positions following a vowel, excluding word boundaries), 17 (1.8%) words have one position, 365 (39.5%) have two, 465 (50.3%) have three, 68 (7.4%) have four, and 9 (1.0%) have five.
Figure 1a shows how the ERs analysed polymoraic words. Of the 924 words with no disagreements, 860 (93.1%) were segmented by ERs.
Expert Rater Segmentation Patterns. (a) Number of dictionary headwords that the Expert Raters segmented or left unsegmented. (b) Segmentation patterns on initial bimora vs. other segmentations. (c) Segmentation patterns prior to vowel vs. prior to consonant. (d) Segmentation patterns after a long vowel vs. after a short vowel.
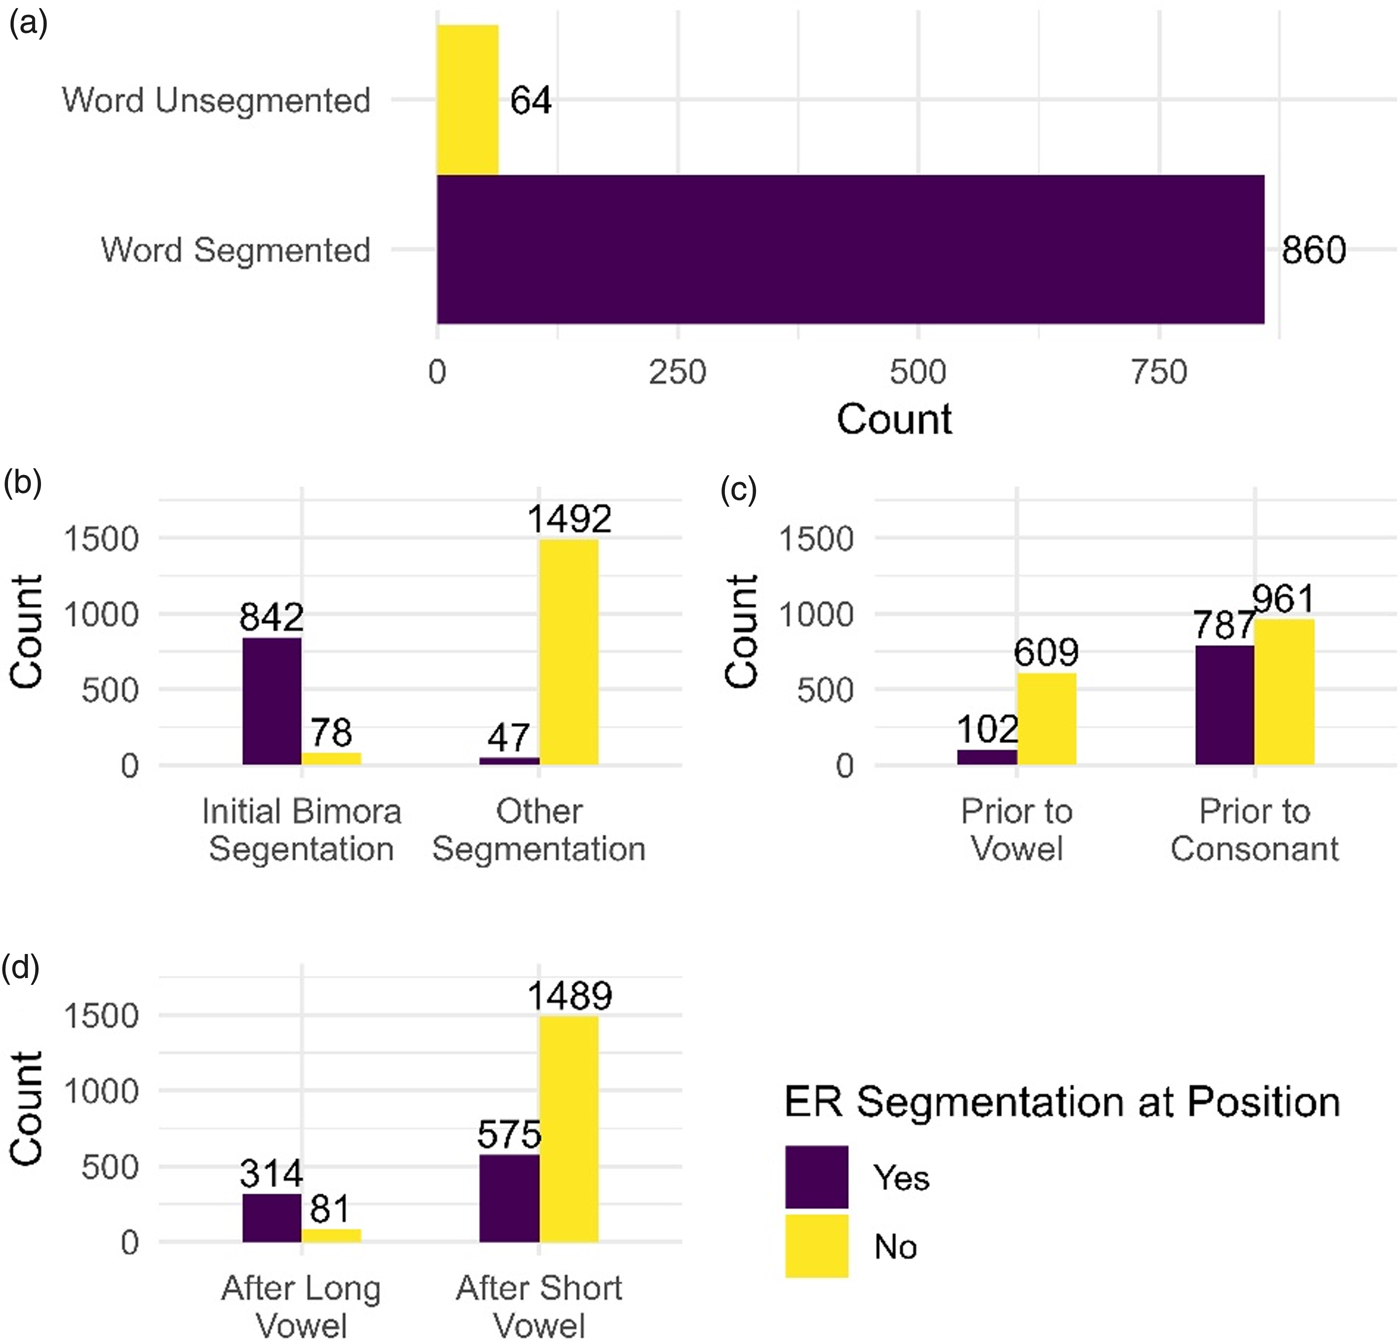
Figure 1b–d shows the distribution of the individual segmentations in these words. They show three trends. The first is that ERs were very unlikely to segment positions other than the initial bimora. Of the 1,544 segmentable positions that are not on the initial bimora boundary, only 47 (3.1%) were segmented by both ERs. On the other hand, 842 of the 920 segmentable initial bimoras (91.5%) are segmented, showing an overwhelming pattern of segmenting the initial bimora of a word from the rest of it. Note that this matches the prevalent structure of Māori morphemes. There is a general minimal bimoraic restriction on the size of Māori content words (Bauer, Reference Bauer1993, p. 544), and previous studies have noted the strong tendency for a bimoraic structure to Māori words. Krupa (Reference Krupa1966, p. 51) treats all words larger than bimoraic as morphologically complex, a view that is rejected by other authors (see Harlow, Reference Harlow2007, pp. 113–114). However, the intuition about a bimoraic tendency to Māori morphemes is supported by other authors: Bauer (Reference Bauer1993, p. 538) identifies the bimora as the ‘canonical’ shape of Māori morphemes. Consequently, it is likely that this segmenting trend matches the real facts of Māori morphemes tending to be bimoraic.
Second, ERs were more likely to segment prior to consonants than prior to vowels. Of the 711 segmentable positions prior to a vowel, 14.3% are segmented, while 45% of the 1,748 segmentable positions prior to a consonant are segmented. This matches with the phonotactics of Māori words. In Māori, a majority of words and morphemes begin with consonants. Note that in the polymoraic set, 1,190 (90.4%) words begin with a consonant. Observations of Māori dictionaries (Moorfield, Reference Moorfieldn.d. Williams, Reference Williams1971, see also Bauer, Reference Bauer1993, p. 534) show the same trend. Affixal morphology also has a strong tendency to be consonant-initial (see Harlow, Reference Harlow2007, pp. 114–126).
Finally, ERs were more likely to segment if the position was after a long vowel. Of the 395 segmentable positions with a prior long vowel, 79.5% were segmented by the ERs. In contrast, only 27.9% of segmentable positions with prior short vowels were segmented. Consequently, it appears that the presence of a long vowel made it a more likely position for the ERs to segment at. This likely relates to patterns in Māori: Māori content words are minimally bimoraic, and consequently the shortest permissible word is (C)V: or (C)VV. This makes long vowels likely boundaries in complex words.
Consequently, at positions that the ERs segmented, there are three key trends: (i) a strong tendency to segment the initial bimora of the word; (ii) a tendency to segment prior to consonants; (iii) a tendency to segment positions after long vowels.
1.6. Hypotheses
Based on the above literature, our primary hypothesis is that non-Māori Speakers (NMS) have some knowledge of the structure of Māori words and the structure of Māori morphemes. This will be reflected in greater alignment with ERs than non-New Zealanders, in terms of their segmentations. If we assume that NMS don't have complete knowledge of Māori words and morphemes, but nonetheless have a very high degree of knowledge, then they would also have access to statistical generalizations about where there is more or less likely to be a “good” place to segment, especially in comparison to non-New Zealanders. Namely, segmentations will be more likely to be identified at locations that are phonologically appropriate for a word-internal boundary. Specifically, we propose the following hypotheses about how NMS segment Māori polymoraic words:
H1 NMS will be more likely to segment at the same positions as ERs than non-New Zealanders.
H2 NMS will be more likely to segment at locations that phonologically resemble word or morpheme boundaries than at positions that do not resemble word or morpheme boundaries than non-New Zealanders.
H2a NMS will be more sensitive to the overall phonotactics of Māori than non-New Zealanders. They will also be more sensitive to Māori phonotactics than English phonotactics when segmenting Māori words.
H2b NMS will be less unlikely to segment after a consonant than non-New Zealanders, as this is ungrammatical in Māori.
H2c NMS will be more likely to segment the initial bimora of a word than non-New Zealanders.
H2d NMS will be more likely to segment before a consonant than a vowel, than non-New Zealanders.
H2e NMS will be more likely to segment following a long vowel than a short vowel, than non-New Zealanders.
2. Methods
All information in this methods section is provided in more detail in the supplementary materials to this paper.
2.1. Stimuli
The stimuli of interest consisted of polymoraic dictionary headwords from the Te Aka Māori Dictionary. The list of stimuli was reduced by removing any items that did not occur in a set of Māori text corpora, among other filtering processes (see supplementary materials). This resulted in 1,337 polymoraic words that were sampled to participants. These were combined with words of a variety of other shapes, forming a total of 4,481 stimuli.
In addition to the polymoraic words, there were 9 other categories, as summarised in Table 1, along with the criteria used to determine whether a stimulus belongs to that category. Any item that met more than one criterion in the morphological category (e.g., they both belonged to the ‘whaka’ and the ‘passive’ categories) were removed.
Stimulus Categories, with Criteria for Assignment to that Category, and Counts

Thus, each participant rated a different random sample of 100 polymoraic words, comprising 41.6% of the stimuli in each random sample. Each polymoraic word received an average of 14 ratings by the NMS.
Following the experiment, for the analysis, 20 words were filtered from the set of polymoraic words because at least one ER chose not to analyse them, resulting in the final set of 1,317 polymoraic words for statistical analysis.
2.2. Participants
The first round of advertisements targeted only New Zealanders. There were 307 New Zealanders who were recruited to take part in the experiment using a Facebook advertisement. Prior to launching the experiment, we determined several criteria for being able to take part:
• Be a native speaker of New Zealand English and 18 years old or older.
• Not have lived outside New Zealand, for any period of longer than a year, since they were seven.
• Never have studied linguistics at a university.
• Not be able to hold a basic conversation in Māori.
We removed participants that did not meet these criteria. We then removed participants who did not meet certain demographic criteria, including participants who indicated that they could speak or understand Māori well. These are included in the supplementary materials. Following this filtering, there were responses from a total of 195 New Zealand-based participants available for analysis.
Details about the New Zealand-based participants are shown in the supplementary materials, including figures relating to their demographics. They were predominantly women (159, 81.5%) and generally young, with 110 (59.0%) under 40 years of age. A majority (134, 68.7%) have spent most of their life on the North Island of New Zealand. Thirty-four participants (17.4%) self-identified as Māori.
In general, the New Zealand participants reported low levels of proficiency in Māori. The post-experiment survey asked participants to self-rate both their Māori language speaking and comprehension abilities on a 0–5 scale, combining into a 0–10 language ability scale, with 10 indicating “highly proficient”, and 0 indicating “absolutely no proficiency”. Due to the filtering criteria, the maximum a participant could have in this combined language ability score was 4 (see supplementary document). In fact, of the resulting participants, 149 (76.4%) scored 2 or lower, indicating generally poor language abilities; only 23 scored 4. However, participants did identify a range of very basic Māori language skills that they are capable of (e.g., counting, being able to sing songs in Māori, etc.). Of the set of nine skills, there was a wide range of capabilities: 82 participants (42.1%) reported that they were capable of at least seven skills, and 49 (25.1%) reported capability of three or fewer. This shows that participants were generally capable of a range of very basic language skills, with much variation across speakers.
A second round of data collection aimed to recruit non-New Zealanders to take part in the experiment, in order to facilitate a contrastive analysis of New Zealand and non-New Zealand intuitions of Māori. Recruitment was through social media and word-of-mouth. The following conditions applied to the non-New Zealand participants:
• Be 18 years old or older
• Be a native speaker of English
• Not have lived in New Zealand
• Not have any experience with Māori
Every participant met these criteria, and there was no filtering. In all, there were 43 non-New Zealand participants. These participants tended to be older, with 74.4% 50 or older. 30 (69.8%) of these participants were female, while 35 (81.4%) lived in the USA; six lived in Canada, and two lived in Europe.
2.3. Experimental Procedure
The experiment was distributed as a web interface that was accessible through a URL link. Participants were required to read an information sheet and agree to a consent form before beginning the experiment. All experimentation was carried out with full ethical clearance from the Human Ethics Committee at the University of Canterbury.
Participants were first presented with instructions on what they were expected to do. They were introduced to the concept of morphological complexity in English, using ‘careful’ and ‘disagreement’ as examples of morphologically complex forms, and ‘yellow’ as an example of a morphologically simple form. Participants were then told they would see Māori words in this experiment, and were instructed to “split each word into parts”. Participants were given an example using the word ‘kaimoana’, which includes two relatively transparent morphemes in Māori to NMS: kai ‘food’; moana ‘sea’.Footnote 3 Participants were given several examples of how to segment this word. Participants were instructed to click between any two letters if they wished to assign a segmentation there, or to click a box under the word if they wished to leave the word unsegmented. Participants were able to make more than one segmentation, if they wished, including phonotactically ungrammatical boundaries in Māori (i.e., following a consonant, or within the digraphs “wh” and “ng”).
Following the 240 stimuli, participants filled out a questionnaire which queried their Māori language skills and their demographics. The details of this questionnaire are in the supplementary materials.
2.4. Modelling Procedure
Three mixed-effects logistic regression models were developed for the three analyses of the participants in the experiment reported in this paper. Analysis 1 uses the full set of segmentations, while Analyses 2 & 3 only use the subset of the data where segmentations are grammatical (i.e., they do not follow a consonant). In analysis 1, we analyse the distribution of segmentations based on grammaticality.
In analysis 2 we analyse the distribution of segmentations based on Expert Rater agreement. In analysis 3 we analyse the distribution of segmentations based on the three phonotactic contexts identified in §1.5. These two steps were conducted separately because models that included both Expert Rater agreement and phonotactic patterns exceeded acceptable levels in terms of multicollinearity. Following analysis 3 we therefore also present some posthoc analysis that establishes that our reported effects are independent of each other.
Modelling was conducted in R, and used the lme4 package (Bates et al., Reference Bates, Mächler, Bolker and Walker2015). The modelling procedure involved the use of a model ‘pruning’ process, which begins with a complex model, and removes non-significant interactions. The modelling process is shown in the supplementary materials to this paper. All models use the stimulus and participant ID as random intercepts. We aimed to keep random intercepts as maximal as possible in line with Barr et al. (Reference Barr, Levy, Scheepers and Tily2013). However, in practice, models that include random slope interactions resulted in singular fits; consequently, random slopes used fixed factors in the modelling with no interaction terms. The analysis 1 model had no random slopes.
In all three models, the dependent variable was whether or not a segmentation was made at a given position. All three models also included the following fixed factors:
• Location: Whether the participant was part of the New Zealand-based cohort, or whether the participant was part of the non-New Zealand cohort. Levels: New Zealand (reference), non-New Zealand.
• English Score: a phonotactic score of a given segmentable bigram based on morphs in the CELEX database (Van der Wouden, Reference Van der Wouden1990). This measure is the negative base-2 log conditional probability of the bigram. Simple Good Turing smoothing was used to assign frequencies to missing bigrams (Gale & Sampson, Reference Gale and Sampson1995). A higher English Score indicates a more complex, less probable bigram. This score is used to measure how sensitive participants are to English phonotactics when segmenting the words in this experiment. For the purpose of this analysis, all English scores were centred and scaled to their z-scores.
• Māori Score: a phonotactic score of a given segmentable bigram based on morphs from the Te Aka Dictionary (Moorfield, Reference Moorfieldn.d.). These morphs were based on the Expert Rater segmentations, using a modified form of Morfessor (Todd et al., Reference Todd, Huang, Needle, Hay and King2022; Virpioja et al., Reference Virpioja, Smit, Grönroos and Kurimo2013). This measure was calculated using the same method as the English Score, and likewise, a higher score indicates a more complex, less probable bigram, and is used to measure how sensitive participants are to Māori phonotactics when segmenting the words in this experiment. For the purpose of this analysis, all Māori scores were centred and scaled to their z-scores.
The supplementary materials provide more information on how the English and Māori phonotactic scores were calculated. Note that in the modelling, one bigram ‘aa’ was excluded from analysis, due to its very high English and Māori scores. Alongside these fixed factors, the following were used in one of the three models:
• Grammatical (Analysis 1): Whether a segmentable position was ungrammatical or not, defined as following a consonant (i.e., within a CV bigram). Levels: Grammatical (reference), Ungrammatical.
• ER Segmentation (Analysis 2): Whether an Expert Rater segmented at a position for the same word. Levels: No (Reference), Yes.
• Prior Vowel (Analysis 3): Whether the segmentable position has a prior long vowel or not (i.e., within a V:C bigram). Levels: Long Vowel (reference), Short Vowel.
• Following Segment (Analysis 3): Whether the segmentable position is followed by a consonant or a vowel (i.e., witihn a VC or VV bigram). Levels: Vowel (reference), Consonant.
• Initial Bimora (Analysis 3): Whether the segmentable position immediately follows the second mora of a word, either after the second short vowel in a word, or after an initial long vowel. Levels: No (Reference), Yes.
3. Results
3.1. Analysis 1: Grammaticality of Splitting
Analysis one models all segmentable positions, with a focus on whether the position is a grammatical position for a split.
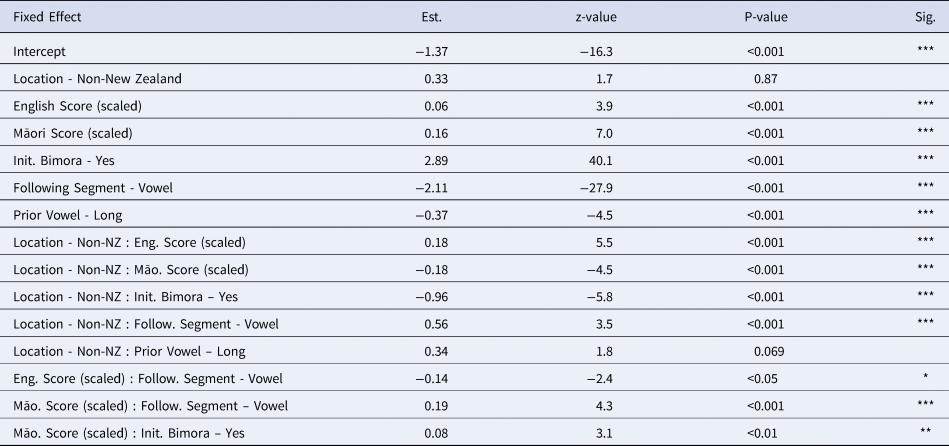
Table 2 shows the fixed effects of the Analysis 1 model. The fixed effects show a significant three-way interaction between grammaticality, location, and Māori phonotactic score. This indicates that the model found significant variation based on the grammaticality of a position, whether the participant was a New Zealander or non-New Zealander, and these factors varied according to the wellformedness of the segmentable bigram based on Māori phonotactics. Importantly, the model also found significant interactions between location and English score, and grammaticality and English score.
Fixed effects of the Analysis 1 Model

Figure 2 shows the predicted values of the Analysis 1 model. The x-axis shows scores indicating the probability of the bigram in English (on the left) and Māori (on the right). Less probable bigrams in a language have lower scores for that language. Lines are shown for the segmentation probability within both grammatical and ungrammatical bigrams. We note that both grammatical and ungrammatical locations for splitting have a range of probabilities of occurrence within morphs. Variation in this probability could theoretically be used by participants to estimate the probability of an intervening boundary. However if they also have grammatical knowledge about illegal positions for boundaries, this is likely to override usage of these kinds of probabilities.
Predicted segmentation probability in Analysis 1 Model by location of participant, the grammaticality of the segmentation, and English and Māori phonotactic scores. The shaded areas indicate 95% confidence intervals.

There are three key results. The first is that non-New Zealanders are significantly more likely to make ungrammatical segmentations than NMS. This effect is across the board, as indicated in the figure, as well as the significant interaction between grammaticality and location, as indicated in Table 2. This result supports Hypothesis H2b – the hypothesis that NMS would be less likely to segment at ungrammatical locations, i.e., after consonants.
The second result is that non-New Zealanders are significantly more sensitive to the English phonotactics of the segmentation than the New Zealand cohort. This is shown by the fact that both grammatical and ungrammatical segmentations in the non-New Zealand data positively correlate with the English phonotactic score. There is a positive trend for NMS and English phonotactic score, but it is much more subtle than that of non-New Zealanders. This fact is further supported by the significant interaction between location and English phonotactic score in the model.
Third, the non-New Zealander cohort was significantly less sensitive to the Māori phonotactics than NMS. Figure 2 shows that non-New Zealanders were insensitive to Māori phonotactics, as shown by the negative correlation between segmentation and Māori Score. Note that this effect for non-New Zealanders is across both grammatical and ungrammatical segmentations. In comparison, there are two patterns in the New Zealander data. For grammatical segmentations, there is a positive correlation between Māori phonotactic score and segmentation probability. For ungrammatical segmentations, the probability appears to stay at almost zero, and does not seem to rise with Māori phonotactic score. This indicates that, above all, NMS were able to identify ungrammatical segmentations beyond their phonotactic wellformedness. These second and third results support Hypothesis H2a – that NMS will be more sensitive to the overall phonotactics of Māori.
3.2. Analysis 2: Agreement with Expert Raters
Having established that there is a difference in the rate of ungrammatical segmentations, the rest of the analysis focuses on the subset of the data which comprises just the grammatical locations for splitting – i.e., postconsonantal locations are excluded.
Both the analysis 2 and analysis 3 models used the subset of the experimental data in which all segmentable positions modelled were grammatical. The model for analysis 2 predicts the probability of segmentation by the location of the participant, and whether an Expert Rater segmented at the same position in the same word. Table 3 presents the fixed effects of this model. First, the results show a significant effect of ER segmentation, as well as a significant interaction between ER segmentation and the location of the participant. In other words, NMS were generally more likely to agree with the Expert Raters than non-New Zealanders. Second, the results show a significant three-way interaction between ER segmentation, location, and Māori phonotactic score. A corresponding three-way interaction with English phonotactic score is not significant, but location and English phonotactic score do show a significant effect, indicating that non-New Zealanders were more sensitive to English phonotactics than New Zealanders in this model.
Fixed effects of Analysis 2 model

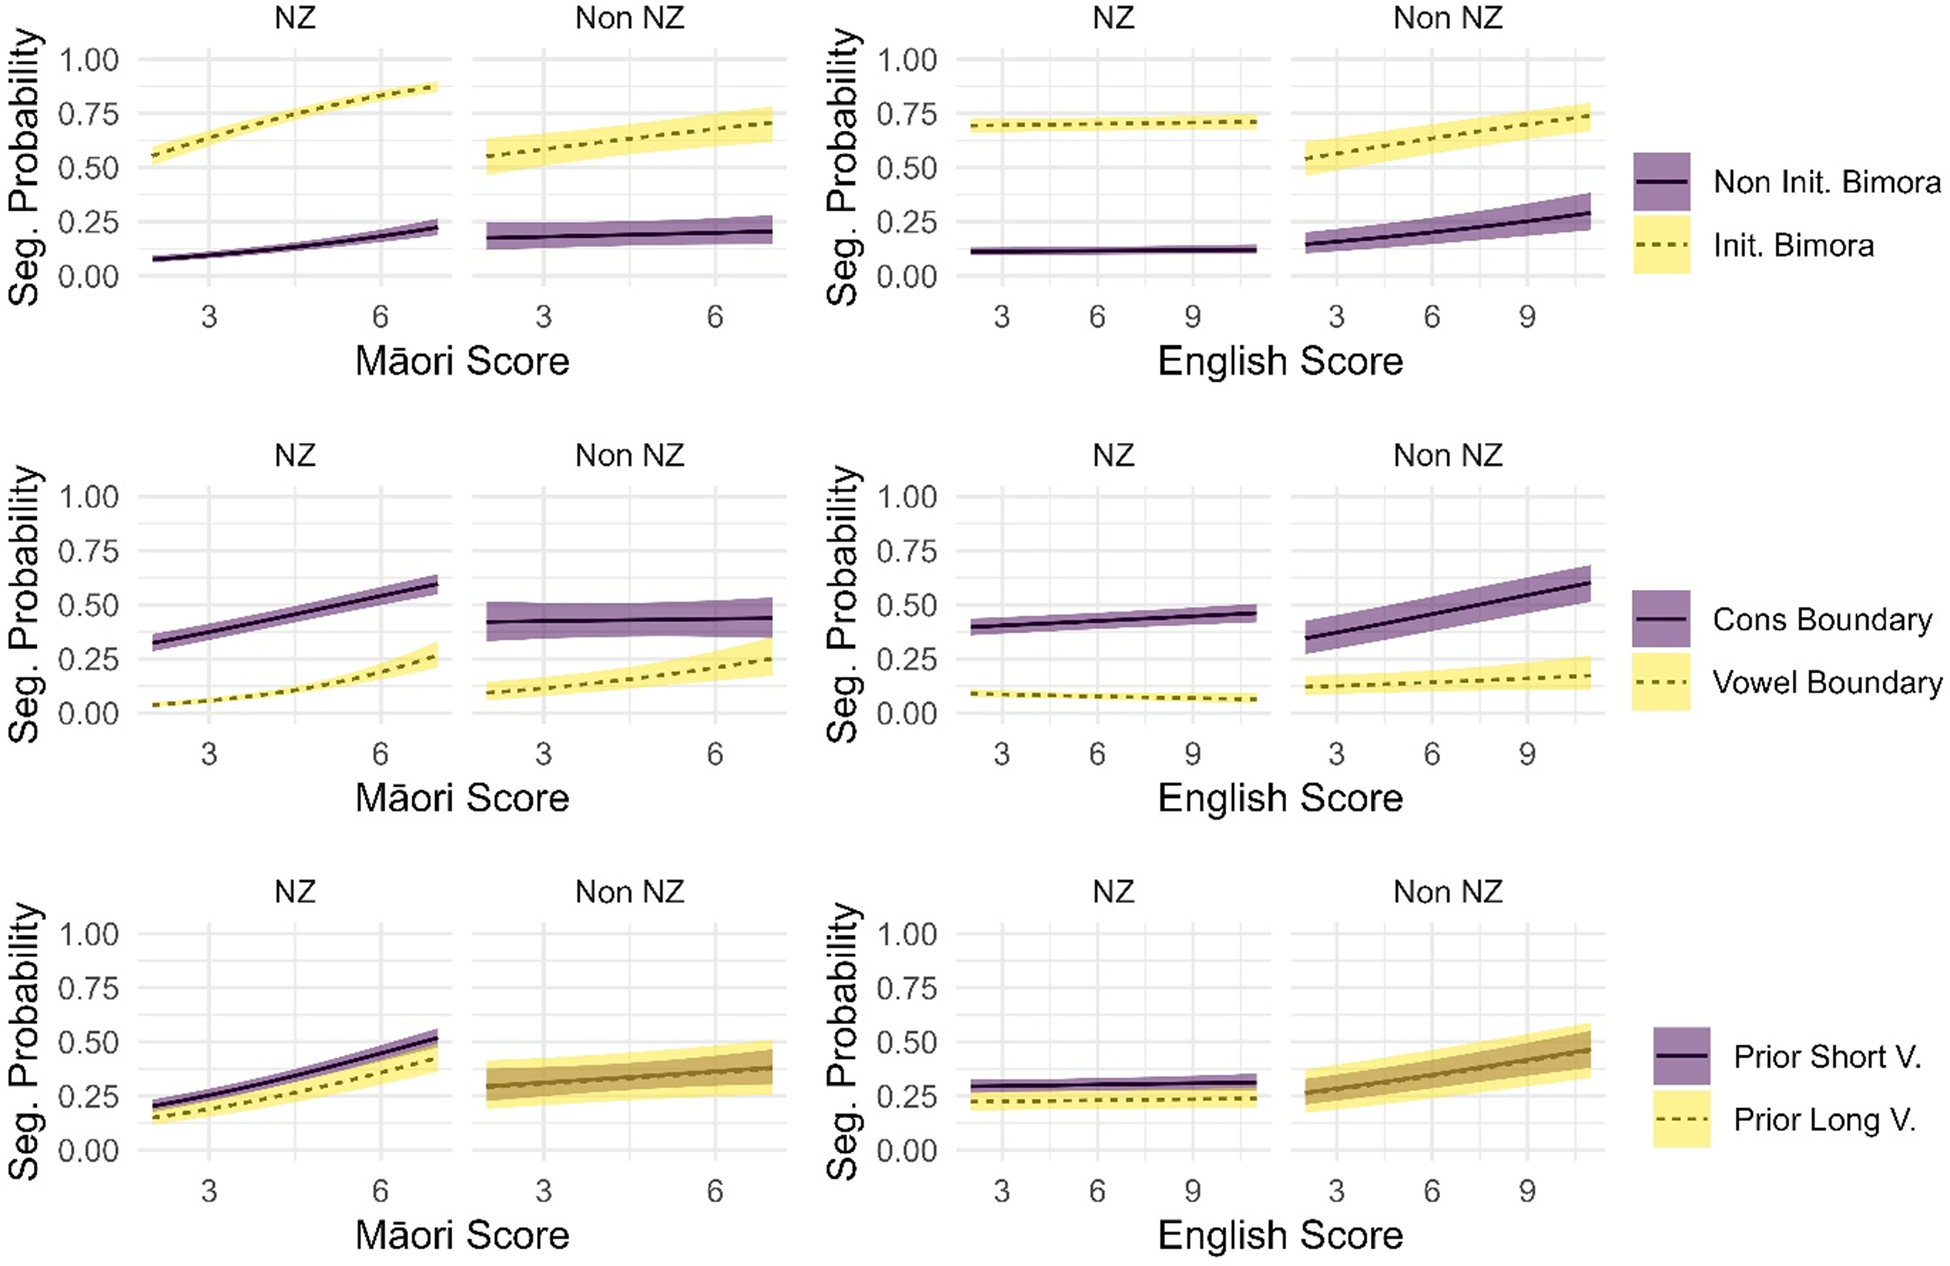
Figure 3 shows the interactions between location, ER segmentation, and English and Māori phonotactic scores. The three-way interaction between ER segmentation, location, and Māori phonotactic score shows two things. First, for NMS, the difference in segmentation probability between positions that the Expert Raters did and did not segment is larger when the Māori phonotactic score is higher for the segmented bigram. In other words, when a bigram is highly complex, according to Māori phonotactics, it is more likely to be segmented in agreement with the Expert Raters than with less complex bigrams. We interpret this as follows: at more probable (i.e., more phonotactically complex) boundaries, NMS, through their latent exposure to Māori, are more likely to have segmented in these positions in their past experience. Consequently, the difference between morpheme and non-morpheme boundaries are easier for them to recognise in these positions. However, in places where there are not probabilistic cues, they have less past experience segmenting at these positions, and so they have not built as robust a proto-lexicon when it comes to these positions.
Predicted segmentation probability in Analysis 2 Model by location of participant, agreement with Expert Raters, and English and Māori phonotactic scores. The shaded areas indicate 95% confidence intervals.

However, importantly, at all probabilities, NMS show greater separation between the positions that the Expert Raters did and did not segment than the non-New Zealanders do. The fact that NMS show much greater sensitivity to where the Expert Raters segmented than the non-New Zealanders do supports hypothesis H1.
Second, while there is an overall effect of agreement with the Expert Raters even with non-New Zealanders, their segmentations, no matter their agreement with the Expert Raters, negatively correlate with Māori phonotactic score, demonstrating a general insensitivity to Māori phonotactics.
Note the comparison between English phonotactics and Māori phonotactics in this model. For NMS in particular, Māori phonotactic score better explains their segmentation patterns. The model does show a significant interaction between Expert Rater segmentation and English phonotactic score, but this effect is significantly smaller than the Expert Rater and Māori phonotactic score effect. It is likely that any effect relating to the English score for the NMS is simply a result of the New Zealander sensitivity to Māori phonotactics. Data exploration found that, in the set of bigrams in the experimental data, Māori score ~ English score has a Pearson's r of 0.53, indicating a moderately strong correlation. Thus, it is likely that even if a participant relied strongly on Māori phonotactics when segmenting, this will also impact the corresponding results in the English score measurements. It is significant, then, that the Māori phonotactic scores show a key pattern, i.e. the contrast between Expert Rater segmentations and non-segmentations at higher score ranges, that the English score does not correspondingly show. This shows that it is likely that the NMS were not using English phonotactics, but their own knowledge of Māori phonotactics.
This effect is even clearer when we compare this with the non-New Zealanders. The non-New Zealanders show a positive correlation with their segmentations with English phonotactic score, no matter whether an Expert Rater segmented the position. However, unusually, where the Expert Raters did not segment, there is large increase in segmentation probability at higher English phonotactic scores. Compare this with the negative correlation associated with the Māori phonotactic score, and it seems clear that the non-New Zealanders relied strongly on the English phonotactics to make their segmentations. This is further supported by the significant interaction between English phonotactic score and location in the model.
Thus, this analysis shows two key results. First, New Zealanders show greater agreement with the Expert Raters – that is, they appear to have knowledge of actual morphs (H1). And second, on top of this, concerning the phonotactic pattern they show sensitivity to Māori phonotactics in a way than non-New Zealanders do not (H2a).
3.3. Analysis 3: Phonotactics of Segmentation
In the analysis in this section we look in detail at the types of locations that NMS split. In particular, following H2c-H2e, we expect greater rates of splitting in initial bimora position, before consonants, and following long vowels.
Table 4 shows the fixed effects of the analysis 3 model, which considers these factors. We note that the distribution of data precluded the successful inclusion of ER Segmentation in the modelling procedure – a point we will return to in post-hoc analysis below. This model therefore does not control for ER Segmentation.
Fixed effects of Analysis 3 model
In this model, there is a significant interaction between the location of the participant, and whether position is an initial bimora, as well as whether it is followed by a vowel. The “Prior Vowel” factor is not significant in interaction with location, but its z-value of 1.8 indicates nonetheless a small effect. Both English and Māori scores are significant in interaction with certain phonotactic factors: English score with the following segment, and Māori score with the following segment and the initial bimora.
Figure 4 visualises these effects. A number of patterns are apparent. First, NMS are much more likely to segment on the initial bimora position than the non-initial bimora position in comparison to non-New Zealanders. This result supports hypothesis H2c. Furthermore, when the Māori phonotactic score of the position is higher, NMS are much more likely to segment, and this effect is true for both initial bimoras and other positions. This effect is not as strong for non-New Zealanders. However, the English phonotactic score has a large effect for non-New Zealanders, and an almost negligible effect for NMS.
Predicted segmentation probability in Analysis 3 Model by location of participant, the three phonotactic conditions, and English and Māori phonotactic scores. The shaded areas indicate 95% confidence intervals.
Second, both NMS and non-New Zealanders were more likely to split on a following consonant than a following vowel. However, as Table 4 shows, this effect is significantly larger for NMS than non-New Zealanders, indicating that NMS are more sensitive to this condition than non-New Zealanders. The effect of Māori and English phonotactic scores is more mixed. In Table 4, the interaction between Māori score and following segment shows that when the following consonant is a vowel, Māori score more strongly predicts segmentation; this effect is true for both NMS and non-New Zealanders. The opposite is true for English score: increasing English score negatively correlates with segmentation prior to vowels. Figure 4 shows that this is true for the NMS, while the evidence is less clear for non-New Zealanders: they do not show a similar drop in segmentation probability. The model does not include an interaction with location, and so this is not considered statistically significant. In any case, the evidence shows a stronger effect of the following segment on NMS than non-New Zealanders, supporting Hypothesis H2d.
Third, both NMS and non-New Zealanders appear to be less likely to segment with a prior long vowel than a prior short vowel. This result is surprising, and is discussed in more detail in §5. As stated above, the interaction between location and prior vowel is not significant, but its effect size is large enough to be retained in the model during the pruning process. This effect appears to indicate that non-New Zealanders are less sensitive to the contrast between short vowels and long vowels than NMS.
4. Relationships between predictors
Analysis 2 and Analysis 3 together suggest that NMS are sensitive to phonotactic probabilities, and to particular phonotactic patterns, and also that they can recognise actual morpheme boundaries significantly above chance. Do these patterns definitely exist independently of each other? Due to multicollinearity constraints, ER agreement is not in the model that explores phonotactic patterns (Analysis 3), and phonotactic patterns are not controlled in the model that explores ER agreement (Analysis 2). This section therefore contains a posthoc exploration of the patterns within the different subsets of the data. This shows that NMS's superior knowledge of phonotactic patterns and superior agreement with the ER are indeed separate effects. It is not the case that one is an artefact of the other.
As a model could not be successfully created that included an interaction of the phonotactic contexts in the analysis 3 model and the ER agreement factor in the analysis 2 model, separate simple binomial regression models showing these interactions were graphed using the ggplot package in R (Wickham, Reference Wickham2016). Figure 5 shows these plots, which enable us to assess the effect of ER agreement, controlling for each phonotactic effect (and vice versa). First, the patterns show that neither English nor Māori scores, in combination with the phonotactic factors, fully explain the effect that Expert Rater segmentation has on both the New Zealand and non-New Zealand results: there is a clear independent effect of Expert Rater segmentation even when including the phonotactic factors. Second, even after including the phonotactic factors, the effect size of Expert Rater segmentation is consistently larger for NMS than non-New Zealanders; this is the case even when including Māori or English scores.
Simple Binomial Regression Models Between the Phonotactic Factors of the Analysis 3 Model, whether an Expert Rater Segmented at a Position, the location of the participant, and the Māori and English scores of the segmented bigrams. The shaded areas indicate 95% confidence intervals.
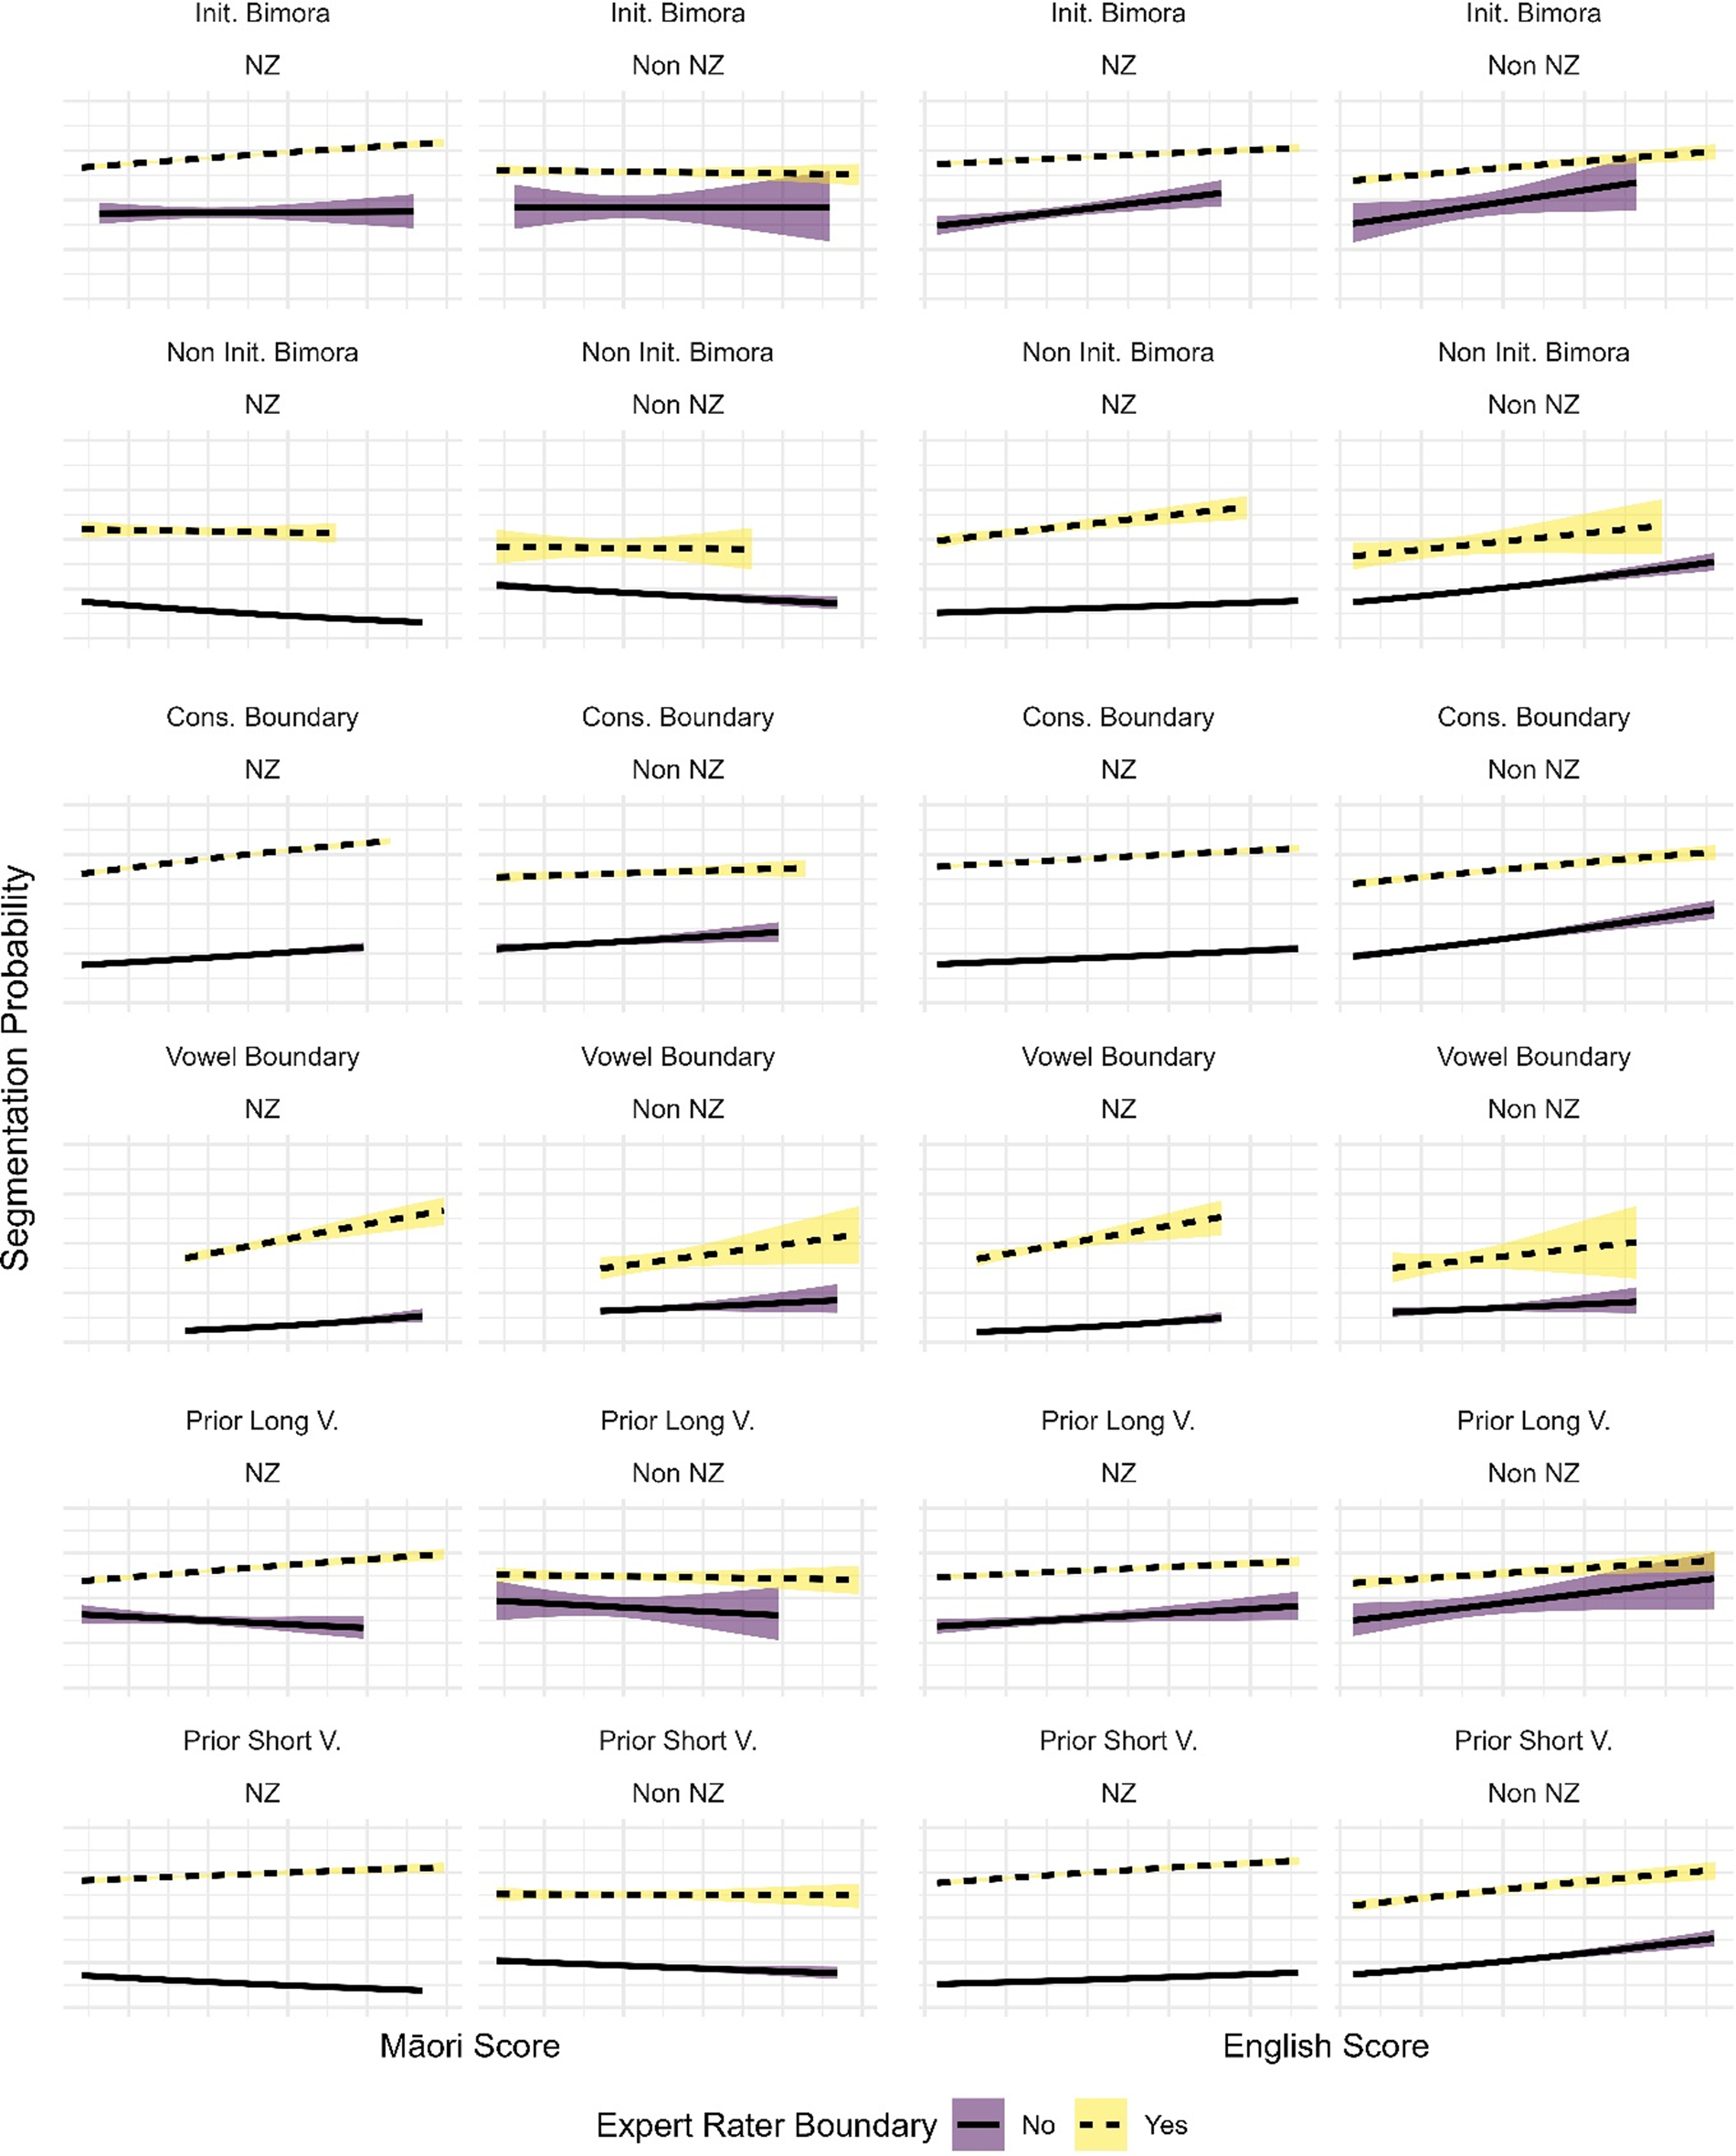
Third, in general, for NMS, positions where an Expert Rater segmented show a more positive correlation between the Māori phonotactic score and segmentation probability than positions where an Expert Rater did not segment, seen also in the analysis 2 model. Note that while in the non-initial bimora category there appears to be a negative correlation, the negative slope is steeper for non-Expert Rater segmented positions than Expert Rater segmented positions. Non-New Zealanders do not show the same pattern as NMS; while in several cases the Māori scores show a stronger correlation where the Expert Raters segmented (e.g., vowel boundary), in other cases, the opposite is true (e.g., consonant boundary, prior short vowel), and in other cases there does not appear to be a significant difference (as is the case with the initial bimora segmentations). Furthermore, while the English scores somewhat correlate with the Māori scores, there are key differences where the English scores do not account for New Zealander segmentations as effectively as the Māori scores, especially in the Initial Bimora and Prior Long Vowel categories. These do not show the otherwise clear pattern that the Māori scores show, that NMS show greater sensitivity to the phonotactics positions where the Expert Raters segmented in comparison to positions where they did not segment.
Finally, holding ER agreement constant, we can see that NMS show high rates of segmentation at both initial bimoras and consonant boundaries than non-NZers, consistent with the effects reported in Table 4. Also consistent with table 4, the effect of prior vowel length appears to be less robust.
5. Discussion
The results in section 3 show that Hypotheses H1, H2a, H2b, H2c, and H2d are all supported by the evidence from this experiment. Consequently, both Hypothesis 1 and 2 are well supported by the experimental evidence: NMS have substantial implicit knowledge of not only the structure of Māori morphemes, but also possess knowledge of specific morphemes in Māori.
Hypothesis H2e, that NMS will more likely segment following long vowels, does not appear to be supported by the experimental evidence. In fact, the evidence of the analysis 3 model shows that NMS were less likely to segment with a prior long vowel. While it was not statistically significant, there was an effect of location on this, and Figure 4 shows that non-New Zealanders likely did not have a difference between prior short vowel and prior long vowel segmentations. Both the New Zealander and non-New Zealander segmentation patterns in this category differ from the Expert Raters, who were more likely to segment following a long vowel, as shown in Figure 1.
We speculate that the prior long vowel condition interacts with the initial bimora condition. The results show that there is a very strong tendency for both ERs and the NMS to segment initial bimoras. This affects the distribution of the data with respect to preceding long vowels. In the Expert Rater data, there are only two stimuli where the ERs placed a segmentation following a long vowel that did not segment the initial bimora: hau|ā|uru ‘west’ & inā|ia, a morphologically complex particle. In other instances, long vowels tend to be the first syllable of a word, i.e., the initial bimora. Importantly, there are many fewer possible combinatoric possibilities for a single syllable containing an optional consonant and a long vowel than there are for disyllables or two vowel sequences. This is supported by the distribution of words in the Māori lexicon. Of 1,034 bimoraic words in the Te Aka dictionary, 864 (83.6%) are disyllabic (i.e., have a phonotactic shape (C)VCV). On the other hand, 124 (12.0%) contain a diphthong (i.e., (C)VV), and only 46 (4.4%) contain a long vowel. Consequently, in a population that understands Māori phonotactics, long vowels are significantly less salient than disyllables as morphemes. Given the overwhelming tendency for NMS to segment the initial bimora, having a preceding short vowel would be a condition that would result in a greater probability of segmentation by the New Zealand-based participants. The modelling did not permit analysis of interactions between the phonotactic contexts, and so we cannot demonstrate this statistically, but this account fits the evidence available. Consequently, we do not see the failure to meet the predictions of hypothesis H2e as any significant evidence against NMS possessing an understanding of Māori phonotactics.
One key unresolved question from this experiment relates to the performance of the non-New Zealanders. Analysis 2 shows that, even when including phonotactic factors, NMS still showed significantly higher agreement with the Expert Raters. Furthermore, the analysis 3 model shows that non-New Zealanders were sensitive to the initial bimora and pre-consonantal positions when segmenting. While NMS showed a greater degree of sensitivity to these phonotactic conditions, as well as the Expert Rater segmentations, the fact that the non-New Zealanders performed so well requires explanation. It is likely that there are certain unidentified factors that influence the segmentations that result from either shared features between Māori and English, or universal perception-based factors that would apply when someone attempts to analyse any unfamiliar language. Prying into these factors would likely require further experimentation to tease apart probable factors in segmentation, with specially selected stimuli. The key result of this paper is that, despite this better-than-expected performance by the non-New Zealanders, NMS still outperformed them in these areas. That is, while NMS undoubtedly would perform similarly to non-New Zealanders by default, having exposure to Māori heightens their sensitivity to Māori phonotactics and the characteristics of Māori morphemes. As stated above, exploring this may require further experimentation with specially select stimuli.
Research in probabilistic phonology standardly connects knowledge of phonotactic cues to generalizations over forms in the mental lexicon (Frisch et al., Reference Frisch, Large, Zawaydeh, Pisoni, Bybee and Hopper2001; Hay et al., Reference Hay, Pierrehumbert, Beckman, Local, Ogden and Temple2004; Richtsmeier, Reference Richtsmeier2011). Consequently, it is likely that the ability of NMS to identify these cues is grounded in a proto-lexicon that is not composed only of words, but word parts. Importantly, as described in §3.3, there was not a significant difference in segmentation of prior long vowels between NMS and non-New Zealanders, but this is likely due to the interaction with the initial bimora condition stated above.
Estimates for the proportion of the New Zealand population that is monolingual varies low as 74%, and as high as 80% of the population (Buckingham, Reference Buckingham2020; Major, Reference Major2018). These estimates show that previous research has found widespread monolingualism in New Zealand. However, the results presented here reveal a high degree of latent bilingualism. The participants’ comprehensive intuitions about Māori phonology and morphology, alongside previous evidence of lexical and phonotactic knowledge (Oh et al., Reference Oh, Todd, Beckner, Hay, King and Needle2020), points to a high degree of linguistic competence in this population. However, this competence is latent and implicit: there is no evidence that NMS are aware of their linguistic abilities.
This research program demonstrates that frequent exposure to a language can result in detailed knowledge and intuitions about the lexicon, the morphology, and the phonology of that language. It reinforces the findings of earlier research that exposure to a language can result in strong intuitions about that language (§1.1). This real-world example shows that the types of implicit learning shown experimentally have long-term consequences in a real-world setting.
The overall degree to which implicit processes can actually be involved in real-life second language learning is a central question, and has been identified as one of the more urgent matters to be addressed by second language learning researchers (Andringa & Rebuschat, Reference Andringa and Rebuschat2015; Hulstijn, Reference Hulstijn and Rebuschat2015). The proto-lexicon, and implicit morphological knowledge, suggests that a great deal of implicit knowledge – much more than hitherto thought – can be gained through incidental learning. Our experiments all involve adults who grew up in New Zealand. It has long been observed that language learning is more difficult and less effortless in adulthood than in childhood, but the extent, trajectory and cause of this decline remains a very active topic of debate (Abutalebi & Clahsen, Reference Abutalebi and Clahsen2018; Birdsong, Reference Birdsong2018; Hartshorne et al., Reference Hartshorne, Tenenhaum and Pinker2018). An important question for further work will be the degree to which childhood exposure to Māori plays a particularly important role in the development of this knowledge by non-Māori speakers.
A second important question is the degree to which this implicit knowledge can be directly applied to explicit language learning. A large implicit knowledge of word-forms and word parts will only be of optimal use to a language learner if they can convert this to active knowledge. In ongoing work, we are investigating the role of this knowledge in the language classroom, and the degree to which implicit knowledge provides a headstart for learners wishing to ‘activate’ this knowledge, and acquire explicit competence in the language (e.g., Bisson et al., Reference Bisson, Van Heuven, Conklin and Tunney2013; Frank et al., Reference Frank, Tenenbaum and Gibson2013; Majerus & D'Argembeau, Reference Majerus and D'Argembeau2011).
In sum, we have shown that individuals with low-level ongoing exposure to a language can learn to segment words in that language, despite the fact that their explicit knowledge about the language is minimal. They may develop an extensive inventory of ‘proto-forms’ of word parts, and can also generalise from that knowledge to identify locations in words that are likely to contain morphological boundaries.
Supplementary Materials
The supplementary material for this article can be found at: https://github.com/FPanther/Morphology23/.
Acknowledgments
The software underpinning the main experiment in this paper was originally designed by Jeremy Needle and Janet Pierrehumbert (Needle & Pierrehumbert, Reference Needle and Pierrehumbert2018), and implemented by Chun-Liang Chan. Robert Fromont provided modifications to the original software and technical support and help during the deployment of the online experimentation. This research has benefited from ongoing feedback from colleagues at the NZILBB. Finally, thanks are due to Te Puawai Wilson-Leahy and Tamahou Thoms who were the proficient speakers of Māori reported in the baseline data, and to Jeremy Needle, who played an important role in the collection of the baseline data. This research was supported by the Marsden Fund (UOC1502 and UOC1908).
Competing Interests
The authors declare none.


 Open access