

1 Introduction
Diode-pumped nanosecond lasers with high energy, good beam quality and high conversion efficiency have a wide range of applications such as inertial confinement fusion, material processing and hard X-ray generation. The active mirror (AM) geometry[Reference Furuse, Kawanaka, Miyanaga, Saiki and Izawa1–Reference Liu, Feng and Sui6], in which the gain medium also acts as a mirror to allow round-trip energy extraction in a single pass, has drawn much attention for its potential for high-energy lasers with superior performance. The spatiotemporal overlap effects in the AM geometry, which may, however, exert great influence on the pulsed output characteristics such as output energy, pulse shape and intensity distribution, remain as yet unexplored.
For a double-pass AM configuration, laser pulses that propagate forward and backward along the same route within the gain medium may lead to a collinear overlap, that is, both the leading and trailing edges of the pulse share an inverted population at the location they arrive at, at the same time. In addition, specifically for single-pass and multi-pass AM geometry, the non-collinear overlap occurs due to the V-shaped beam path within the AM, so that a particular location with local gain can be crossed and the gain extracted simultaneously by two rays that are both forward- or backward-propagating but travel on different routes. Moreover, collinear overlap and non-collinear overlap can happen at the same location and at the same moment in the double-pass AM configuration: that is, four pulse segments are simultaneously extracting gain at the same location, which further increases the difficulty in predicting the behaviors of double-pass AM amplifiers.
In previous studies, the pulse overlap in the double-pass amplification process was firstly investigated by Hirano et al. in 1999[Reference Hirano, Pavel, Yamamoto, Koyata and Tajime7], presenting a numerical solution by using the iterative procedure method. In 2005, a simplified analytic expression was given by Pearce et al.[Reference Pearce, Ireland and Dyer8], where only the complete temporal overlap case was considered, however. In 2017, Li et al.[Reference Li, Zhang and Wang9] presented an intuitive numerical method by meshing the pulse and gain medium into spatial grids, in which the pulse distortion caused by double-pass scaling is discussed. Furthermore, Jeong et al.[Reference Jeong, Cho and Yu10] developed a simulation method directly using the modified Frantz–Nodvik equation, demonstrating the lowest computation cost so far reported, while the pulse shape distortion was studied and compared with experimental results. The above-mentioned methods have several limitations, however, preventing their applicability to high energy AM configuration. First and foremost, all these works focused on the collinear overlap of the rod geometry with a straight-through beam path. Second, of main interest were the influences of overlap on the final amplified outputs, without characterizing the individual effects of each spatial and temporal segment that participated in the overlap process. Third, a unified gain coefficient is used for the entire gain medium, ignoring the nonuniformity of the pump distribution.
Optical paths in a double-pass laser amplifier with a single AM. (a) Three-dimensional view; (b) two-dimensional view on the xz plane, along with the initial distribution of stored energy density.

In this paper, a comprehensive spatiotemporal model is established, unraveling the pulse amplification process in double-pass AM geometry. Three types of overlap condition are studied, while temporal and spatial segments of extracting beam are characterized by p-τ diagrams in the instantaneous gain windows. To the best of our knowledge, this is the first spatiotemporal characterization of the overlap condition with four pulse segments in solid-state lasers. The model is well verified by the experimental results from a 10 J distributed active mirror amplifier chain (DAMAC) system[Reference Liu, Sui and Chen5] in terms of the influences of spatiotemporal overlap effects on the output parameters. The analysis method is also extended to zigzag geometry. We believe that the model is beneficial to the design and optimization of multi-pass pulsed laser amplifiers with AM, zigzag and other geometries.
2 Modeling
2.1 Geometry
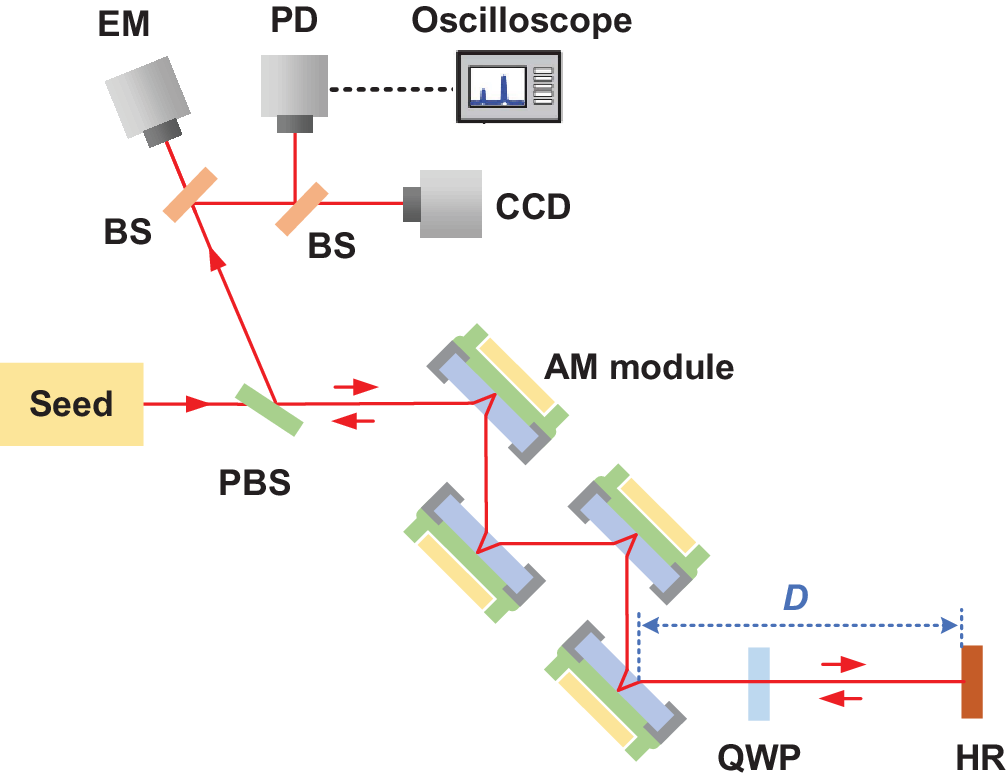
Figure 1(a) shows a schematic diagram of optical paths in a double-pass laser amplifier with a single AM, as an example describing the spatiotemporal overlap effects. It is shown that the seed beam is injected into the gain medium through its front surface, experiences one reflection at the pump surface, and exits the gain medium through the front surface. The beam is then reflected by a mirror, reenters the AM and retraces its route for the second passage. The initial distribution of stored energy density in the gain medium is simulated in Figure 1(b), using the pump parameters as detailed in Section 2.3 below. The longitudinal pumping distribution decays exponentially along the z direction, while a uniform pump distribution in the xy plane is assumed, and the following discussion neglects the variation in y distribution.
As indicated in Figure 1, the gain of a certain location M within the pumped AM (as marked by a star) can be extracted by at most four rays, including forward- and backward-propagating parts of rays #1 and #2. Generally, there are three types of overlap conditions according to the sequence of extracting pulses experienced by M. The first type is collinear two-pulse overlapping (C2PO), where only collinear overlap occurs, while non-collinear overlap is absent so that only one ray crosses M forward and backward, as indicated by I + and I −, respectively, in Figure 2(a). C2PO is the exact type of overlap that previous work[Reference Hirano, Pavel, Yamamoto, Koyata and Tajime7–Reference Jeong, Cho and Yu10] focused on when studying laser configurations with a straight-through beam path. In the double-pass AM configuration, C2PO can only occur in very limited regions, which are defined in Section 3.2 below.
Sequence diagrams of three types of overlap conditions. (a) C2PO; (b) N2PO; (c) 4PO.
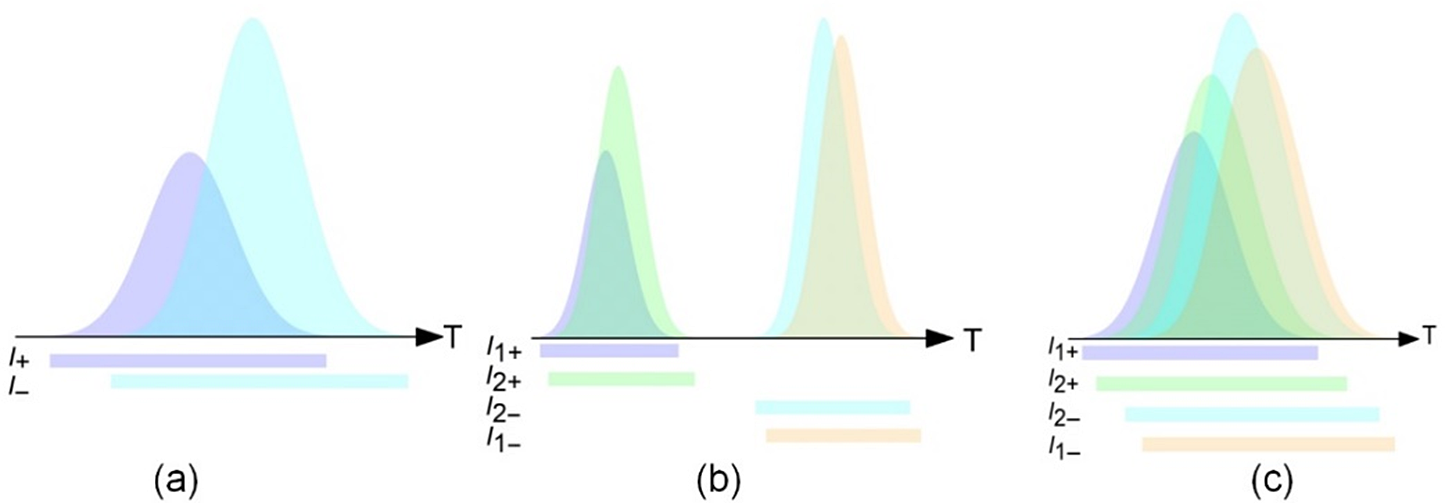
The second and third types are the main overlap conditions in double-pass AM geometry. The second type is non-collinear two-pulse overlapping (N2PO), where only non-collinear overlap occurs while collinear overlap is absent, that is, as Figure 2(b) illustrates, pulse segments of rays #1 and #2 propagating in the forward direction (I 1+ and I 2+) arrive at M at the same time, while their backward-propagating counterparts (I 1− and I 2−) also meet at M but for a different duration due to a sufficiently long free-space propagating distance between the two passages. The third type is four-pulse overlapping (4PO), where pulse segments of I 1+, I 2+, I 1− and I 2− simultaneously arrive at M for a certain duration so that both collinear and non-collinear overlaps occur, as shown in Figure 2(c). Clearly, the 4PO and C2PO conditions can transform to each other by adjusting the free-space propagating distance between two passages. The overlap degree of collinear overlap is defined as
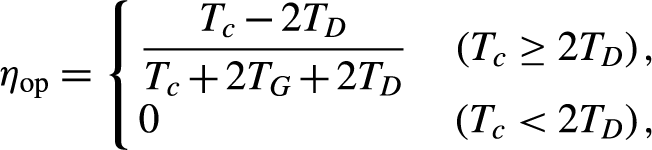 \begin{align}{\eta}_{\rm op}=\left\{\kern-4pt\begin{array}{l}\dfrac{T_c-2{T}_D}{T_c+2{T}_{{G}}+2{T}_D}\quad \left({T}_c\ge 2{T}_D\right),\\ {}0\qquad\qquad\qquad\ \ \ \,\,\left({T}_c<2{T}_D\right),\end{array}\right.\end{align}
where TG is the time of flight (TOF) of beam through the single passage within the gain medium, TD is the TOF of the single-pass free-space distance D, and Tc is the input pulse width for the Gaussian profile we used in this paper. For an intensity-normalized Gaussian-shape pulse, the intensity has the form
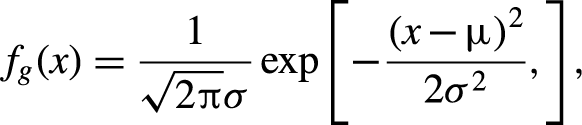 \begin{align}{f}_g(x)=\frac{1}{\sqrt{2\pi}\sigma}\exp \left[-\frac{{\left(x-\mu \right)}^2}{2{\sigma}^2},\right],\end{align}
where μ is the mathematical expectation and σ is the standard deviation. Note that to precisely model the pulse scaling process, Tc is calculated by 5σ width, that is, all the pulse segments within μ ± 5σ are considered in the calculation, containing 99.99994% of the whole energy in the Gaussian shape. According to Equation (1), η op is defined as the ratio of the time duration of collinear overlap to the total TOF of the laser beam during the amplification. It is apparent that η op can be tuned by varying D. For the case of Tc < 2TD, the trailing edge of the seed pulse completes the first passage (forward) before the leading edge begins the second passage (backward), which means pulse segments propagating in the collinear route never overlap with each other. Otherwise the leading and trailing edges would encounter within the gain medium and extract the stored energy together.
2.2 Simulation method
A numerical loop iteration method to characterize the amplified pulse with spatiotemporal overlaps is introduced as follows. With the temporal grid size of dt, the propagation distance in the gain medium during dt is calculated as dl = c dt/n, where c is the speed of light in vacuum and n is the refractive index of the gain medium. The spatial grid sizes along the x and z directions are set as dx = dl sinβ and dz = dl cosβ, respectively, where β is the beam refraction angle in the gain medium. The stored energy density at the xz plane of the gain medium is expressed as E st(x, z, T), where T is the absolute time since the amplification begins, identified by TOF as beam propagates. In the simulation, the pulse has a Gaussian shape temporal profile and flat-top spatial profile. The beam is spatially discretized into a great number of rays (spatial slices) along the x direction, while each ray has the beam width dx, and is identified by the ray index nx. The pulse is temporally discretized into a series of successive pulse segments (temporal slices), identified by the pulse segment index nt.
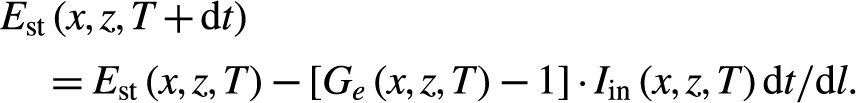
Note that the calculation is operated not by tracing each ray, but by concentrating on the pulse segments of rays that are experienced by each location M(x, z) at each moment. For each location M(x, z) within the gain medium, there are at most four rays crossing M(x, z), with respective intensities of I 1+, I 1−, I 2+ and I 2−, as defined in Figure 1(b). At a certain time interval T∼T + dt, the corresponding ray indexes of these four rays crossing M(x, z) are nxj(x, z, T), j = 1±, 2±, and the corresponding pulse segment indexes nt of the overlapping pulse segments at M(x, z) are ntj(x, z, T), j = 1±, 2±. Thus, the intensities of these four rays are rewritten as I(nxj(x, z, T), ntj(x, z, T), T), j = 1±, 2±. The geometrical relationships among ntj and nxj of four overlapping rays are detailed in Section 3.2 below.
Thus, the overall input fluence at M(x, z) at time interval T∼T + dt can be expressed as
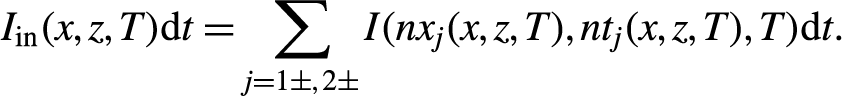 \begin{align}{I}_\mathrm{in}(x,z,T)\mathrm{d}t=\sum \limits_{j=1\pm, 2\pm }I({nx}_j(x,z,T),{nt}_j(x,z,T),T)\mathrm{d}t.\end{align}
According to the Frantz–Nodvik equation[Reference Jeong, Cho and Yu10], the scaling factor of the energy amplification at M(x, z) at time interval T∼T + dt, with the input fluence of I in(x, z, T)dt, is given by
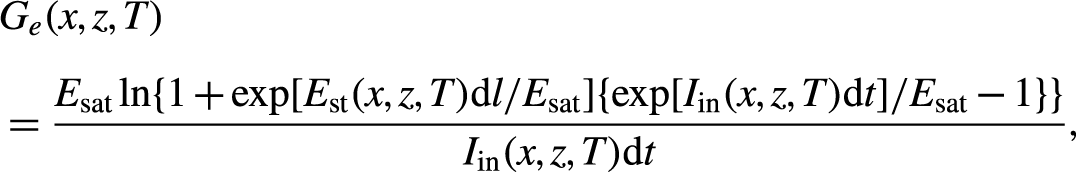 \begin{align}&{G}_e(x,z,T)\nonumber\\[4pt]&=\frac{E_{\mathrm{sat}}\ln \{1+\exp [{E}_{\mathrm{st}}(x,z,T)\mathrm{d}l/{E}_{\mathrm{sat}}]\{\exp [{I}_\mathrm{in}(x,z,T)\mathrm{d}t]/{E}_{\mathrm{sat}}-1\}\}}{I_\mathrm{in}(x,z,T)\mathrm{d}t},\end{align}
where E sat is the saturation fluence of the gain medium.
Hence, the spatiotemporal intensity of the laser beam and the instantaneous stored energy density in the gain medium at time interval T + dt∼T + 2dt are calculated as
 \begin{align}&I\left({nx}_j\left(x,z,T\right),{nt}_j\left(x,z,T\right),T+\mathrm{d}t\right)\nonumber\\&\quad={G}_e\left(x,z,t\right)I\left({nx}_j\left(x,z,T\right),{nt}_j\left(x,z,T\right),T\right),\kern0.75em j=1\pm, 2\pm,\end{align}
 \begin{align}&{E}_{\mathrm{st}}\left(x,z,T+\mathrm{d}t\right)\nonumber\\&\quad={E}_{\mathrm{st}}\left(x,z,T\right)-[{G}_e\left(x,z,T\right)-1]\cdot {I}_\mathrm{in}\left(x,z,T\right)\mathrm{d}t/\mathrm{d}l.\end{align}
Note that as the time increases by dt, the intensities of the four pulse segments extracting the gain at M(x, z) change to I(nxj(x, z, T), nt j(x, z, T) + 1, T + dt), j = 1±, 2±. As T increases in succession, by using Equations (3)–(6), I(nxj, ntj, T) and Ge(x, z, T) are updated over the gain medium region at the xz plane for every elapsed time interval of dt, until the entire pulse exits the gain medium after double passage.
The simulation is run on a personal computer with 2.1 GHz CPU (Intel i5-10210U) and 16 GB RAM. It takes 10 min to perform a full spatiotemporal calculation for the double-pass chain with four AM modules with a spatial grid size of dz = 0.05 mm.
2.3 Experimental setup
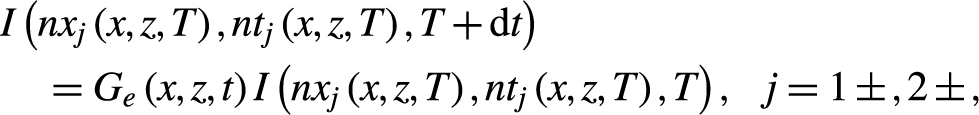
The validity of the spatiotemporal model of double-pass AM geometry is examined based on a 10 J DAMAC system with an experimental method similar to that reported by Liu et al.[Reference Liu, Sui and Chen5] The seed beam to be scaled has a maximum output energy of 3 J at a repetition rate of 10 Hz and a pulse width (full width at half maximum, FWHM) of 10 ns. The double-pass amplifier contains four AM modules as shown in Figure 3, and a 0.6 at.% doped Nd:YAG slab as the gain medium in the AM module has a transverse aperture of 60 mm× 40 mm and a thickness of 8 mm. The laser diode array for each slab provides a maximum pump energy of 13.3 J for a duration of 300 μs, with an illuminated size of 52 mm× 36 mm at the pump surface of the slab. The seed beam size of 10 mm× 10 mm is used to realize a wide range of available input fluence (up to 3.84 times the saturated fluence) for investigating the tendencies for pulse distortion and intensity distribution variation of the output beam. A full-aperture seed beam size of 32 mm× 32 mm is used for studying the output energy of the AM chain, maximizing the spatial matching with the pump distribution and thus the extraction efficiency of stored energy. For the amplified beam after double passage, the output energy is measured by an energy meter (Standa), the intensity distribution is measured by a charge-coupled device (CCD) (Ophir Photonics, SP300), and the pulse shape is measured by a photodetector (Thorlabs, DET08) and a high-speed oscilloscope (Tektronix, MDO 3104).
Experimental layout of the double-pass AM amplifier. PBS, polarization beam splitter; BS, beam splitter; QWP, quarter-wave plate; HR, high-reflection mirror; EM, energy meter; PD, photodetector.
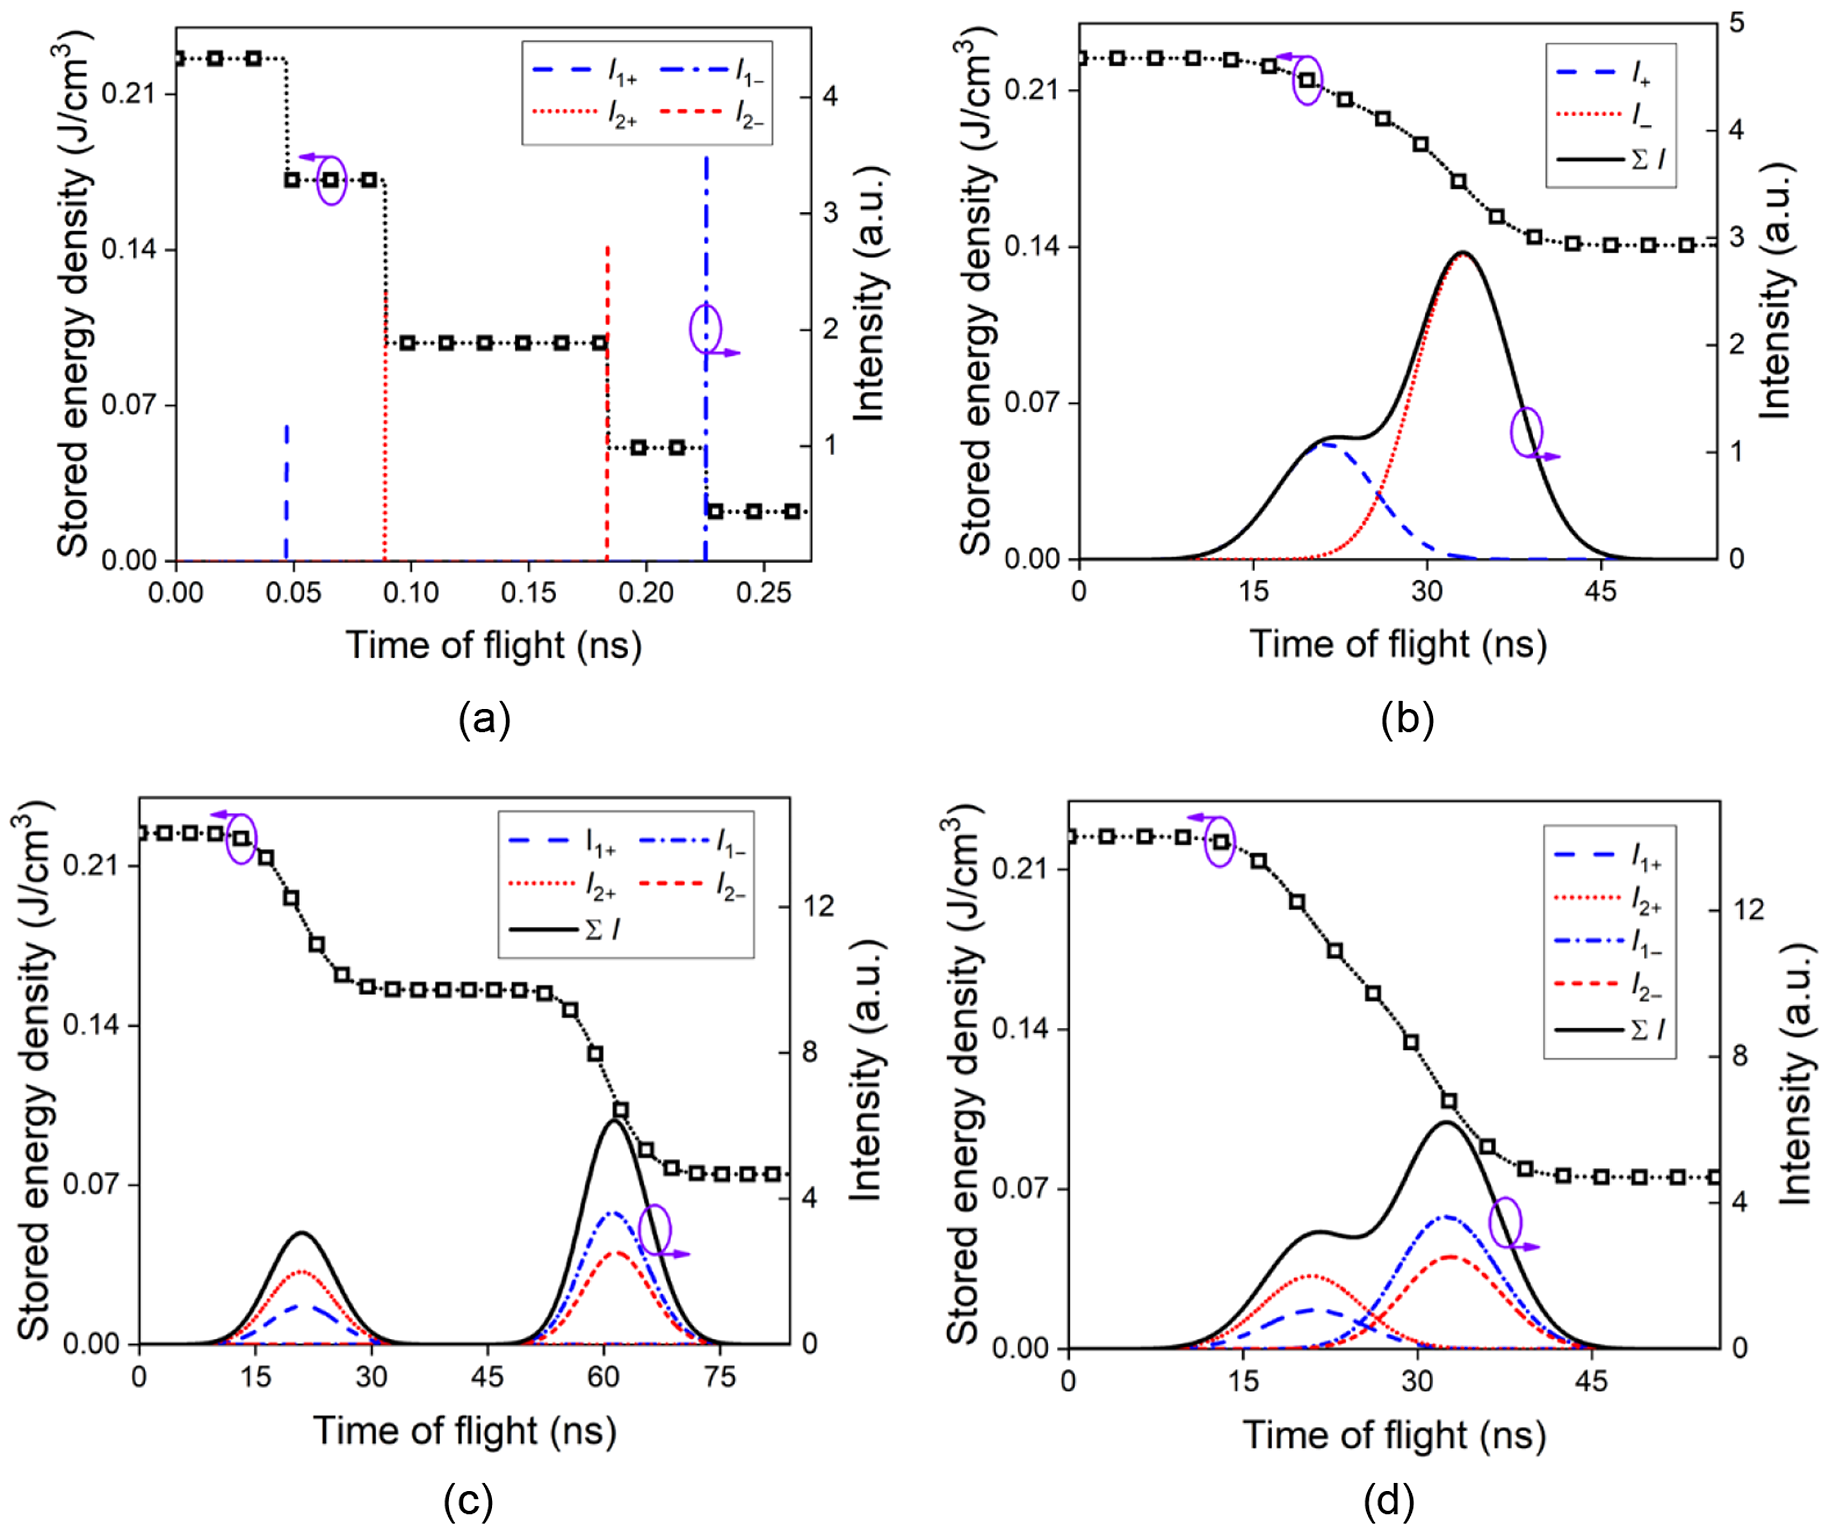
Instantaneous stored energy density and extracting beam intensity at M versus TOF. (a) Successive extraction with no overlap, considering a seed beam of zero temporal width; (b) C2PO; (c) N2PO; (d) 4PO.
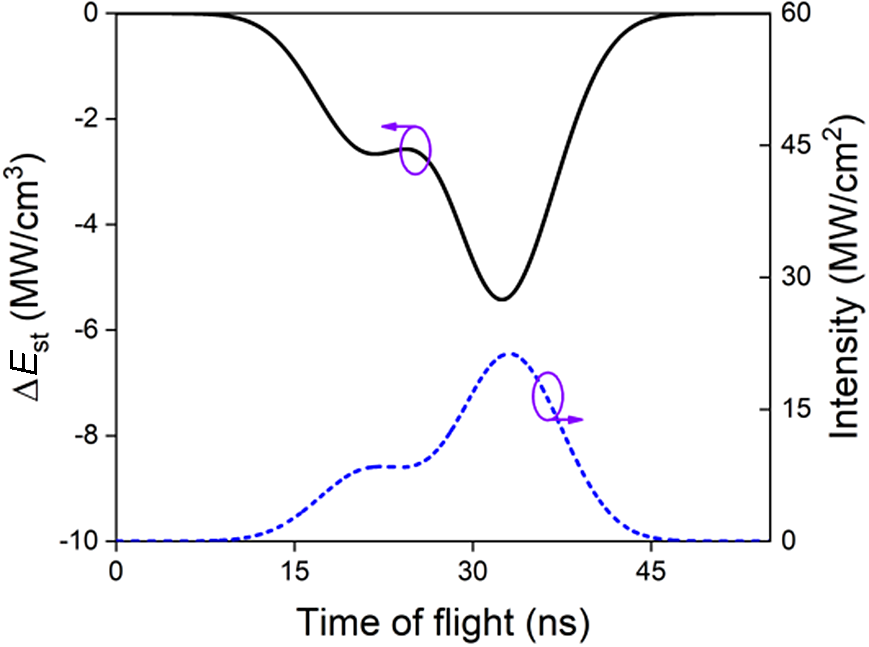
Relationship between ΔE st and instantaneous overall beam intensity ∑ I at location M for the C2PO condition.
3 Results and discussion
3.1 Variation of stored energy
For every TOF, the instantaneous stored energy intensity E st at M and the instantaneous overall beam intensity ∑I at M are calculated and demonstrated in Figure 4. Note that Figure 4(a) shows an extreme case where the seed beam has zero temporal width and no overlap occurs, so that E st at M reduces stepwise, as the four segments (I 1+, I 2+, I 2− and I 1−) pass M and extract the gain in succession. Figure 4(b) shows the C2PO condition with a practical pulse width for the extracting beam where E st reduces continuously and ∑ I has a two-peak profile versus TOF, as combined by the instantaneous intensities of two segments at M (I 1+ and I 1−), each of which has a Gaussian shape versus TOF. The gradient of change in the stored energy density ΔE st, as indicated in Figure 5, can be connected to ∑I at M by
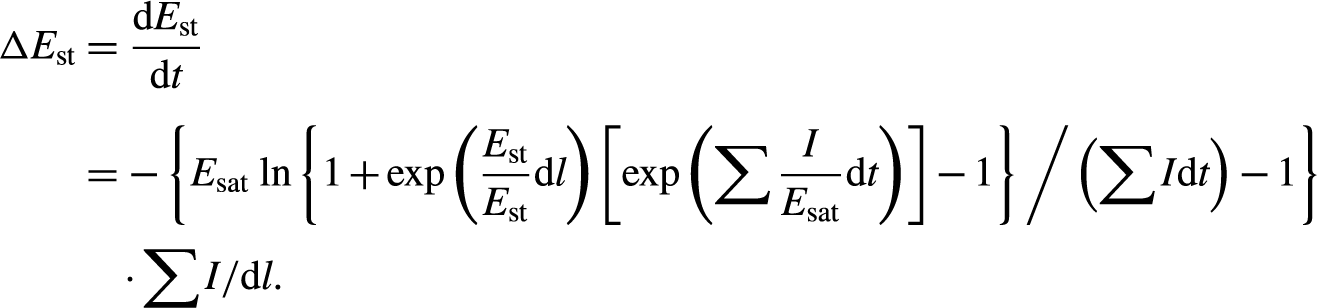 \begin{align} \Delta {E}_{\mathrm{st}}&=\dfrac{\mathrm{d}{E}_{\mathrm{st}}}{\mathrm{d}t}\nonumber\\[4pt] &=-\left\{{E}_{\mathrm{sat}}\,\ln \left\{1+\exp \left(\dfrac{E_{\mathrm{st}}}{E_{\mathrm{st}}}\mathrm{d}l\right)\left[\exp \left(\sum \dfrac{I}{E_{\mathrm{sat}}}\mathrm{d}t\right)\right]-1\right\} \Bigg/ \left(\sum I\mathrm{d}t\right)-1\right\} \nonumber\\ & \quad \cdot \sum I/\mathrm{d}l.\end{align}
Figures 4(c) and 4(d) describe E st and ∑I versus TOF for N2PO and 4PO conditions, respectively, where ∑I sums I 1+, I 2+, I 1− and I 2−. Note that the central flat portion of the E st curve in Figure 4(c) denotes the duration of the beam travelling in free space between two passages.
3.2 Spatiotemporal scaling of single AM
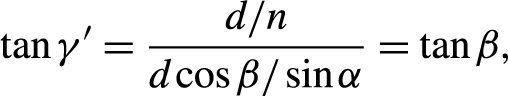
Figure 6 illustrates the instantaneous stored energy density at a given TOF for a double-pass amplifier with a single AM operating under the 4PO condition. Forward-propagating routes of rays #1 and #2 have a non-collinear overlap at M, and thus have 4PO at M together with their backward-propagating counterparts. For a double-pass extracting beam with a pulse width of several nanoseconds, there are only two temporal segments of ∼100 ps width that can be amplified at a specific TOF, named hereinafter as the gain window of forward-propagating pulse (GWF) and the gain window of backward-propagating pulse (GWB), as shown in Figure 7. The width of each gain window is calculated as τs = 2L 0n/c + d/c = 137 ps, where 2L 0 = 17.4 mm is the single-pass optical length within the AM, and d/c is the time delay difference between the beam outer and inner edges, as illustrated in Figure 6. The time interval between GWF and GWB is equal to 2D/c. Note that the p-τ diagrams for GWF and GWB are symmetrical to each other, because the forward-propagating route of ray #1 and backward-propagating route of ray #2 are symmetrical relative to the z-axis crossing M, the symmetry of which also applies to ray #2 going forward and ray #1 going backward, as shown in Figure 6.
Instantaneous stored energy density at a given TOF in a double-pass amplifier with single AM.
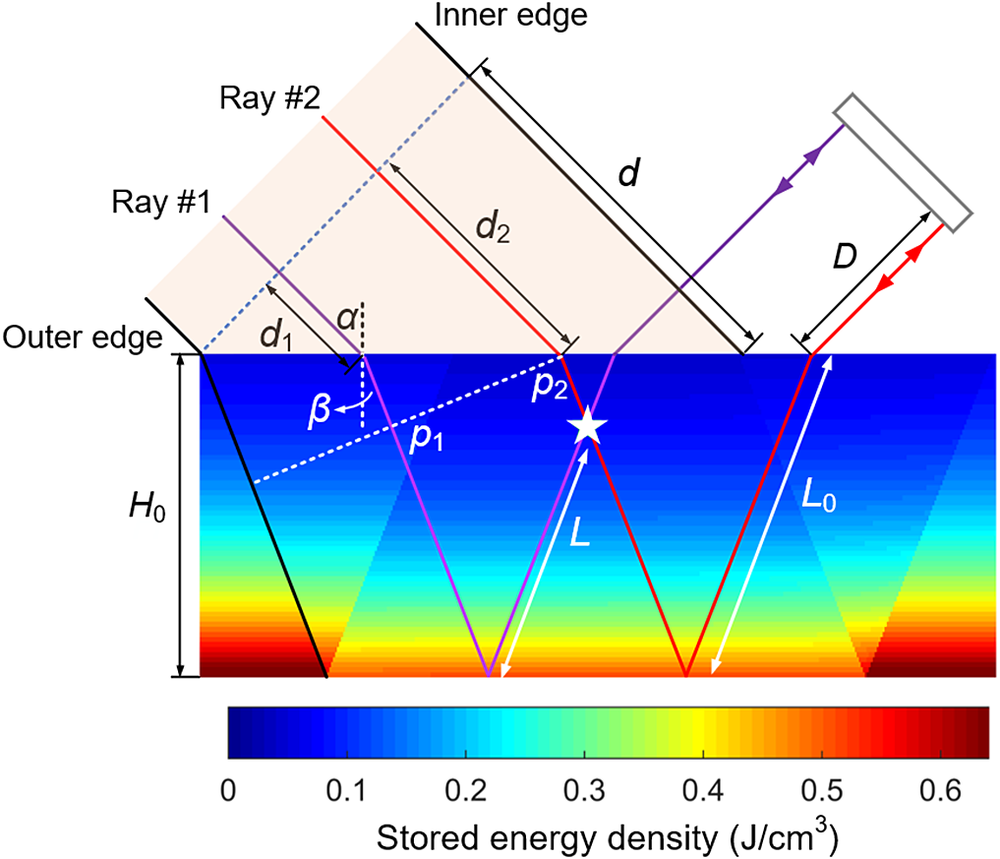
Figure 7(b) describes both gain windows at TOF of 25.5 ns for a group of four pulse segments (PS #1, #4 from ray #1, and PS #2, #3 from ray #2) that participate in the same 4PO process, i.e., simultaneously extracting the gain at M. The instantaneous pulse shapes of rays #1 and #2 are demonstrated in Figure 7(b), with GWF and GWB opening at t GWF = TOF − τs = 25.38 ns and t GWB = t GWF − τs − 2D/c = 13.18 ns, respectively, in the framework of a 5σ-width pulse shape of the extracting beam from 0 to 42.47 ns.
As shown in Figures 7(a) and 7(c), the p-τ diagram for a gain window illustrates the instantaneous stored energy density experienced by a certain pulse segment of a certain ray at a given TOF, while the ray is identified by the coordinate p according to its distance to the outer edge beam within the AM (p = nx dx cosβ), and τ represents the segment timing relative to the opening time of the gain window. For example, the color of PS #1 in the p-τ diagram for GWF denotes the stored energy density experienced by a pulse segment, with the pulse timing of t GWF + τ 1 = 25.38 ns + 105 ps, for ray #1 passing through the point at p 1 = 4.1 mm, while PS #3 for GWB corresponds to the pulse segment of ray #2 passing through the point at p 2 = 9.0 mm, with a pulse timing of t GWB + τ 2 = 13.18 ns + 31 ps. The hexagonal region in the p-τ diagram as marked by an orange dashed line is defined as the 4PO region where the 4PO process can occur, while the other region that the beam passes through is where C2PO happens.
For the geometric relationship of the p-τ diagram, we have
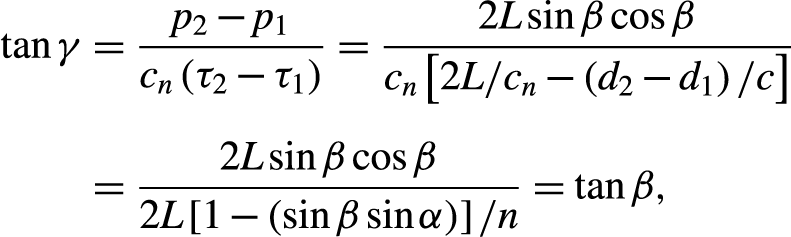 \begin{align}\tan \gamma& =\dfrac{p_2-{p}_1}{c_n\left({\tau}_2-{\tau}_1\right)}=\dfrac{2L\sin \beta \cos \beta }{c_n\left[2L/{c}_n-\left({d}_2-{d}_1\right)/c\right]}\nonumber \\[5pt]&=\dfrac{2L\sin \beta \cos \beta }{2L\left[1-\left(\sin \beta \sin \alpha \right)\right]/n}=\tan \beta,\end{align}
 \begin{align}\tan {\gamma}^{\prime }&=\frac{d/n}{d\cos \beta /\sin \alpha }=\tan \beta,\end{align}
where the law of refraction yields sinα = nsinβ and cn = c/n is the speed of light within the AM.
(a) p-τ diagram for GWB; (b) gain window for four pulse segments (PS #1–#4 from rays #1, #2) that participate in the same 4PO process at TOF of 25.5 ns; (c) p-τ diagram of GWF. The colorbar setting is the same as that for Figure 6.
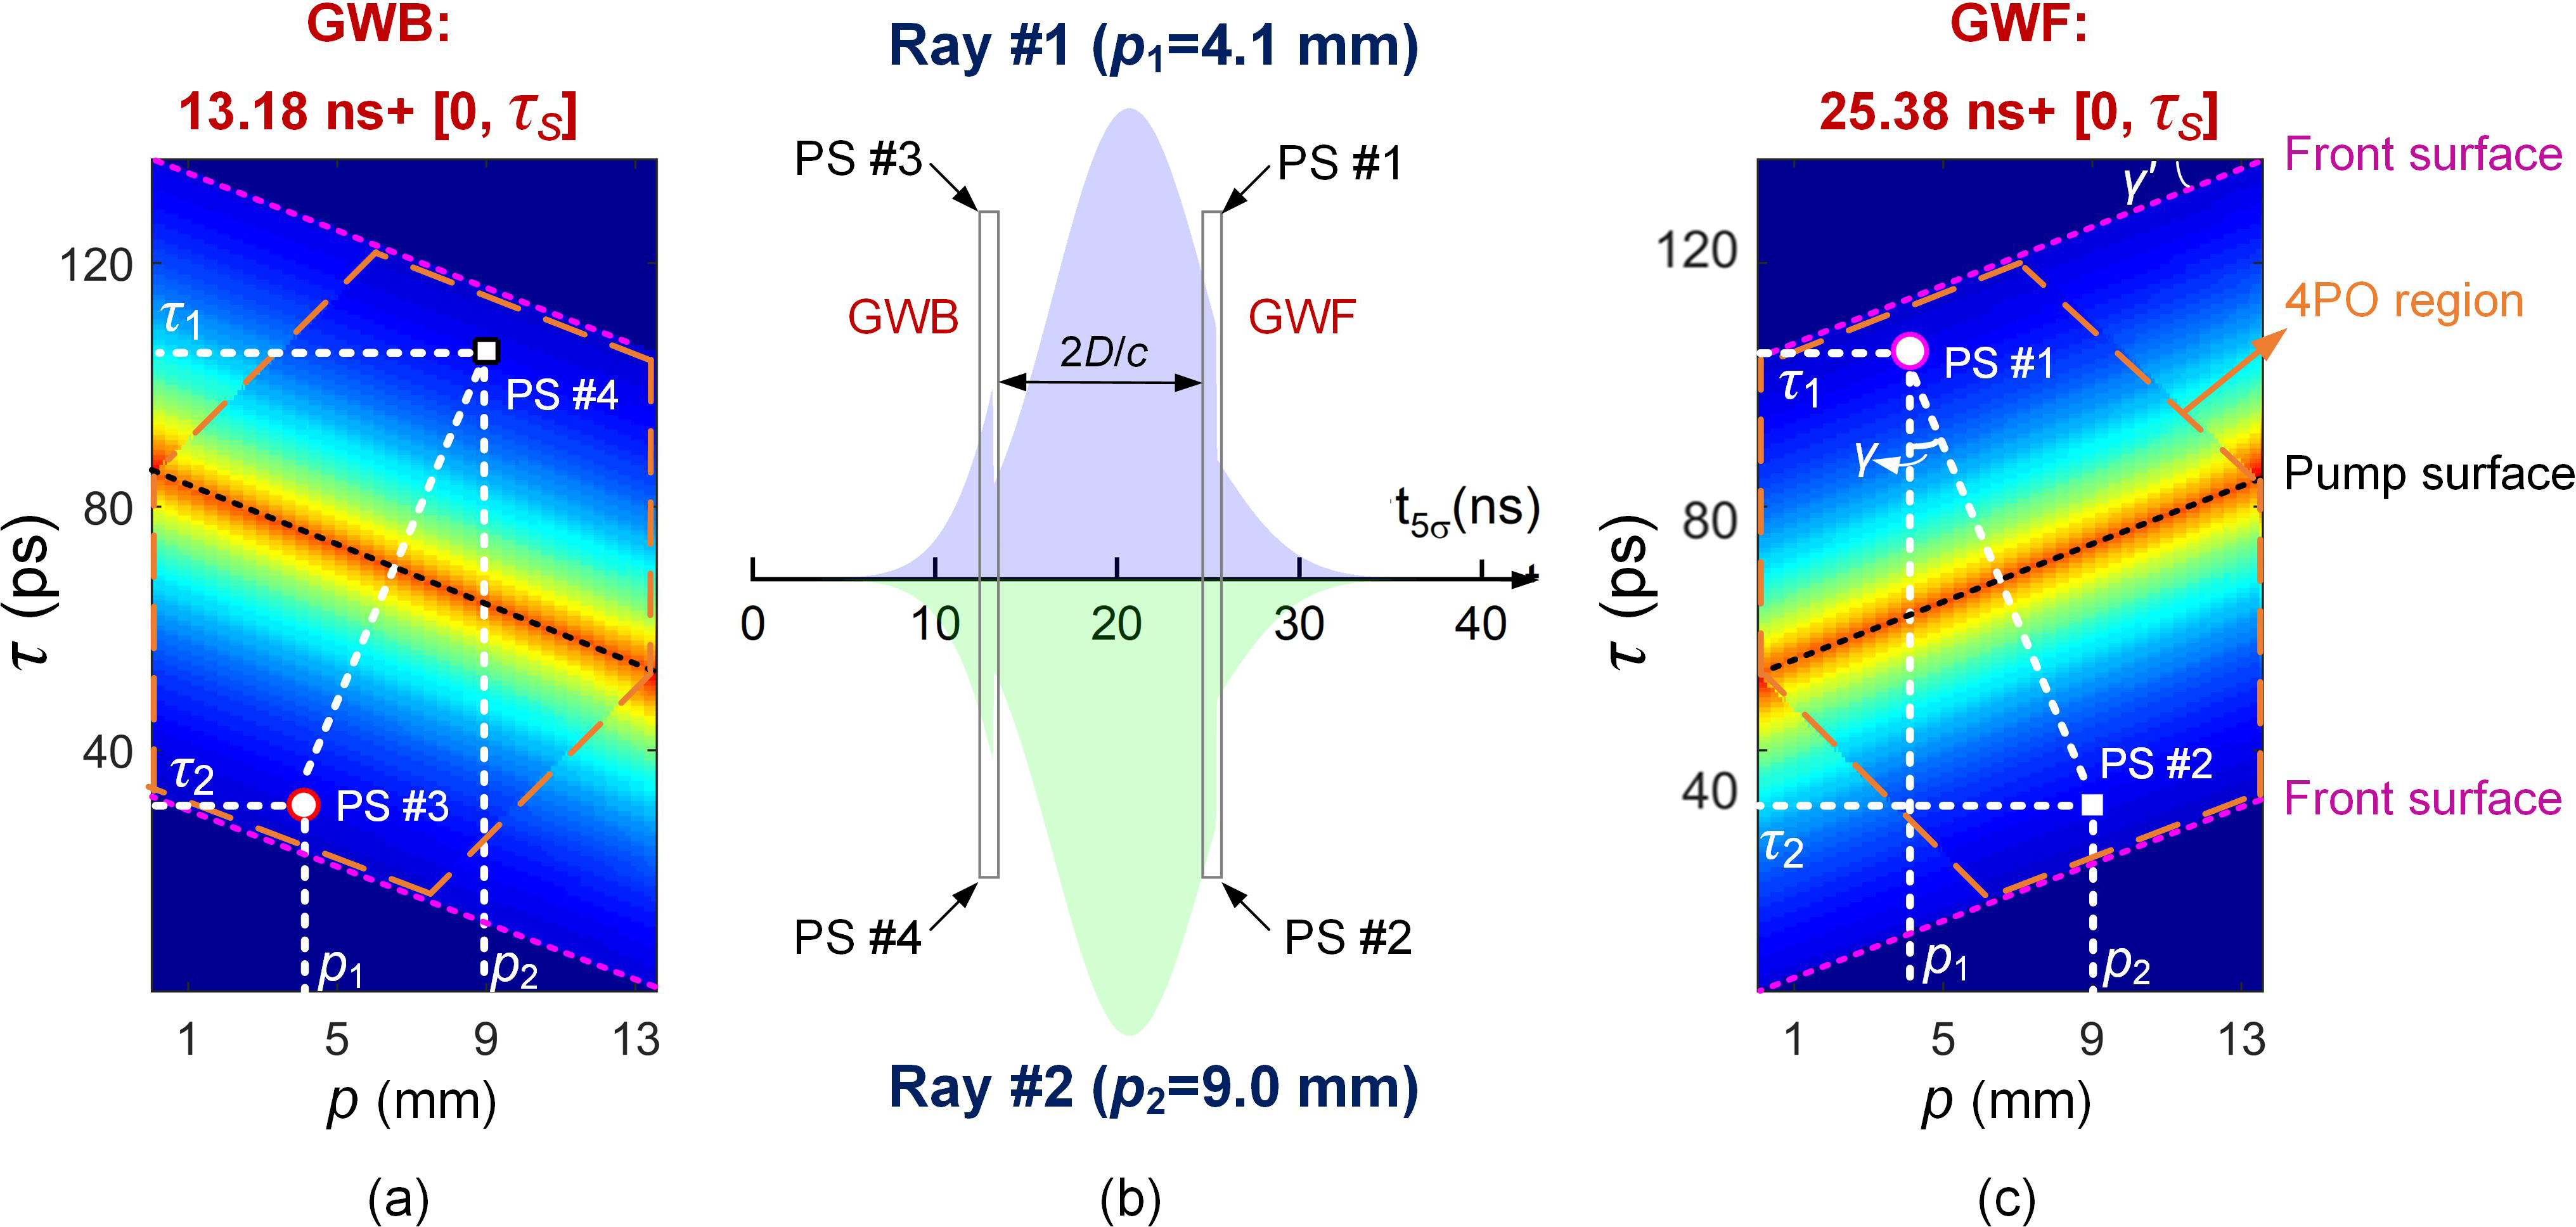
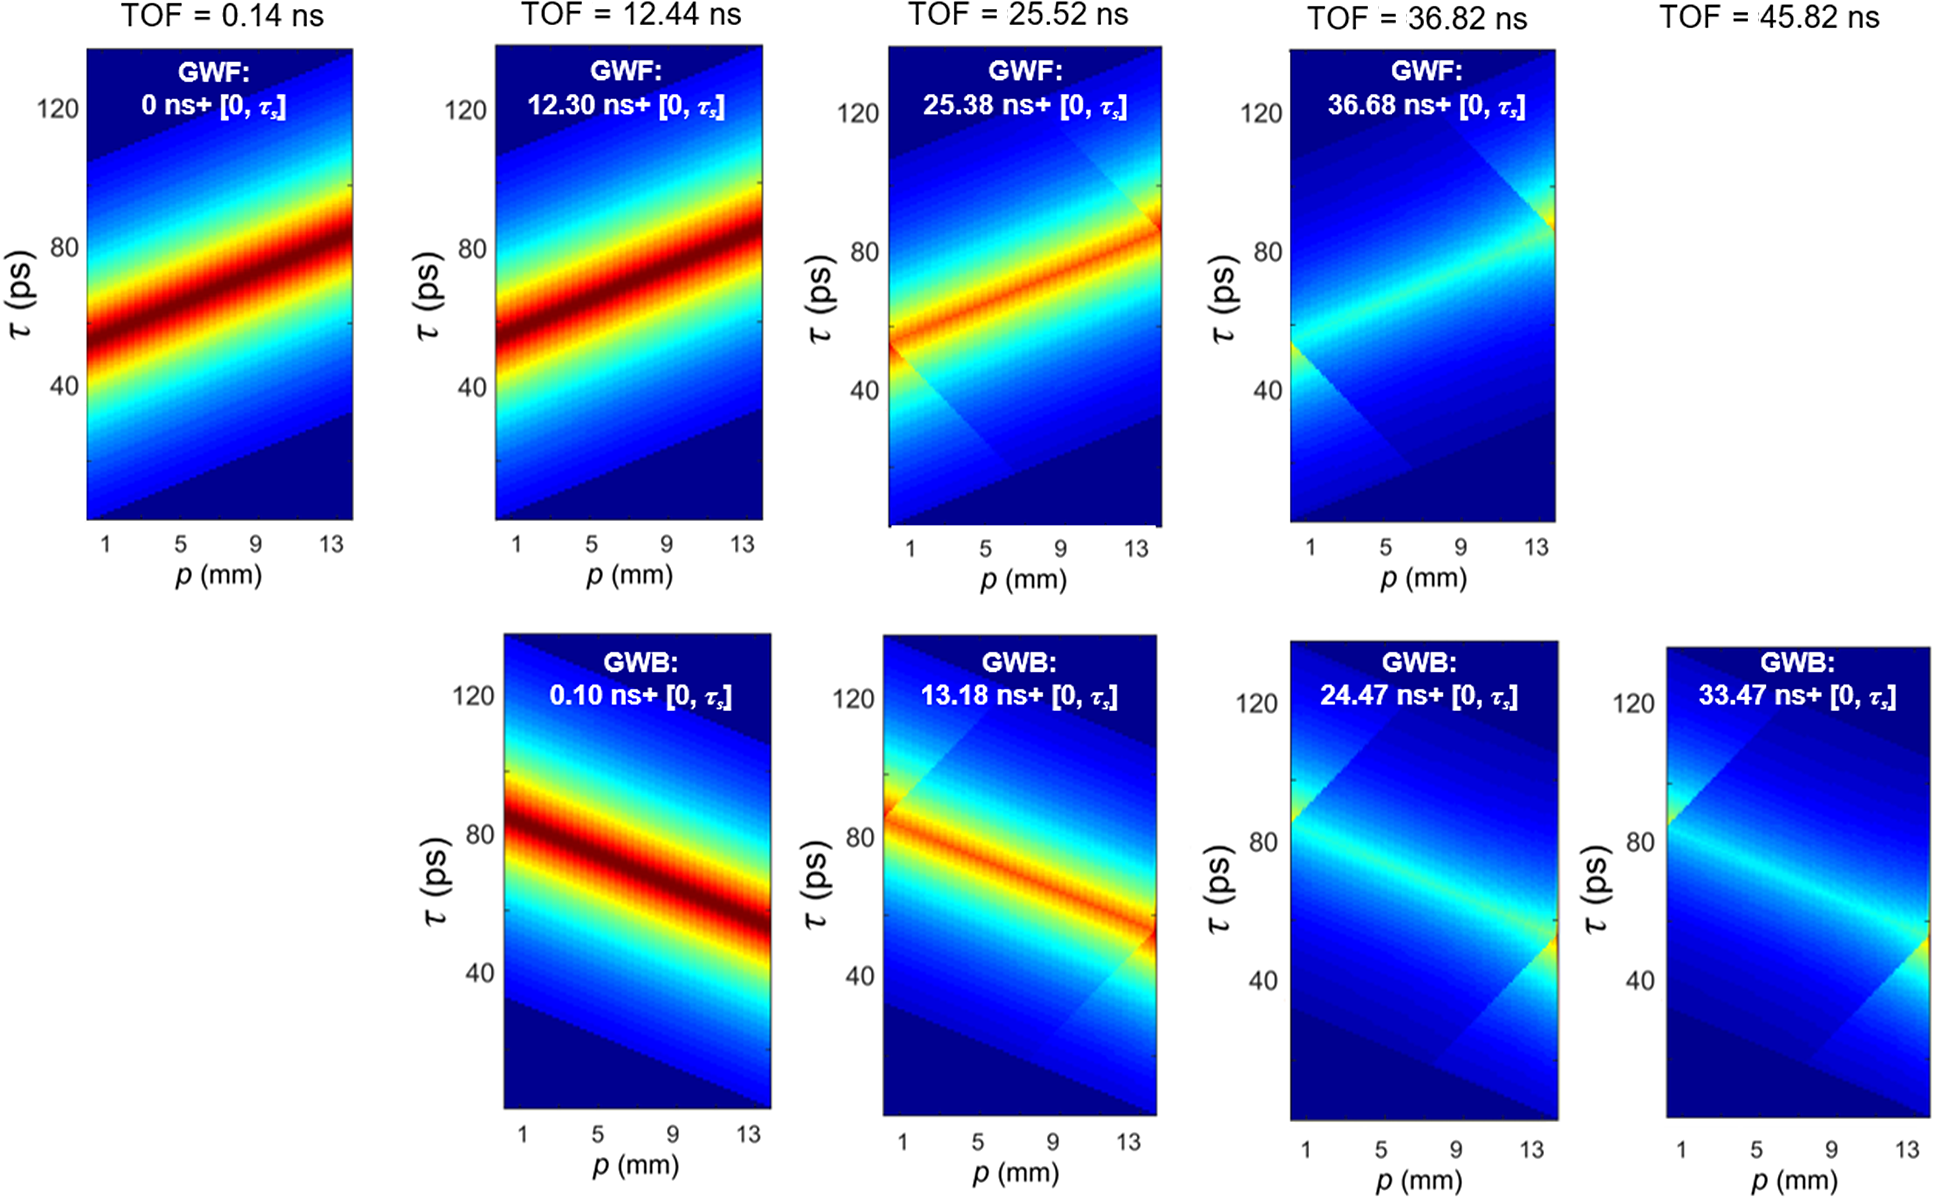
Gain windows at different TOFs throughout the amplification. The colorbar setting is the same as that for Figure 6.
From Equations (6) and (7), we have γ′ = γ, thus the connecting line between PS #1 and #2 is perpendicular to the pump surface in the p-τ diagram for GWF. Note that PS #1 and #2 coincide by folding the p-τ diagram in Figure 7(c) along the pump surface, and simultaneously one can obtain the exact instantaneous distribution of stored energy density in the beam passage regions shown in Figure 6. The (p, τ) coordinates of the pulse participants of 4PO at an arbitrary location M(x, z) within the 4PO region for a given TOF are calculated as
 \begin{align}\left\{\kern-4pt\begin{array}{l}{p}_1=x\cos \beta -\left({H}_0+z\right)\sin \beta, \\ {}{p}_2=x\cos \beta -\left({H}_0-z\right)\sin \beta, \\ {}{\tau}_1=\left[x\sin \beta +\left({H}_0+z\right)\cos \beta \right]/{c}_n,\\ {}{\tau}_2=\left[x\sin \beta +\left({H}_0-z\right)\cos \beta \right]/{c}_n,\end{array}\right.\end{align}
where H 0 is the AM thickness.
Pulse shape variation through the AM chain with D = 0.3 m. (a) Input energy of 0.1 J; (b) input energy of 1 J.
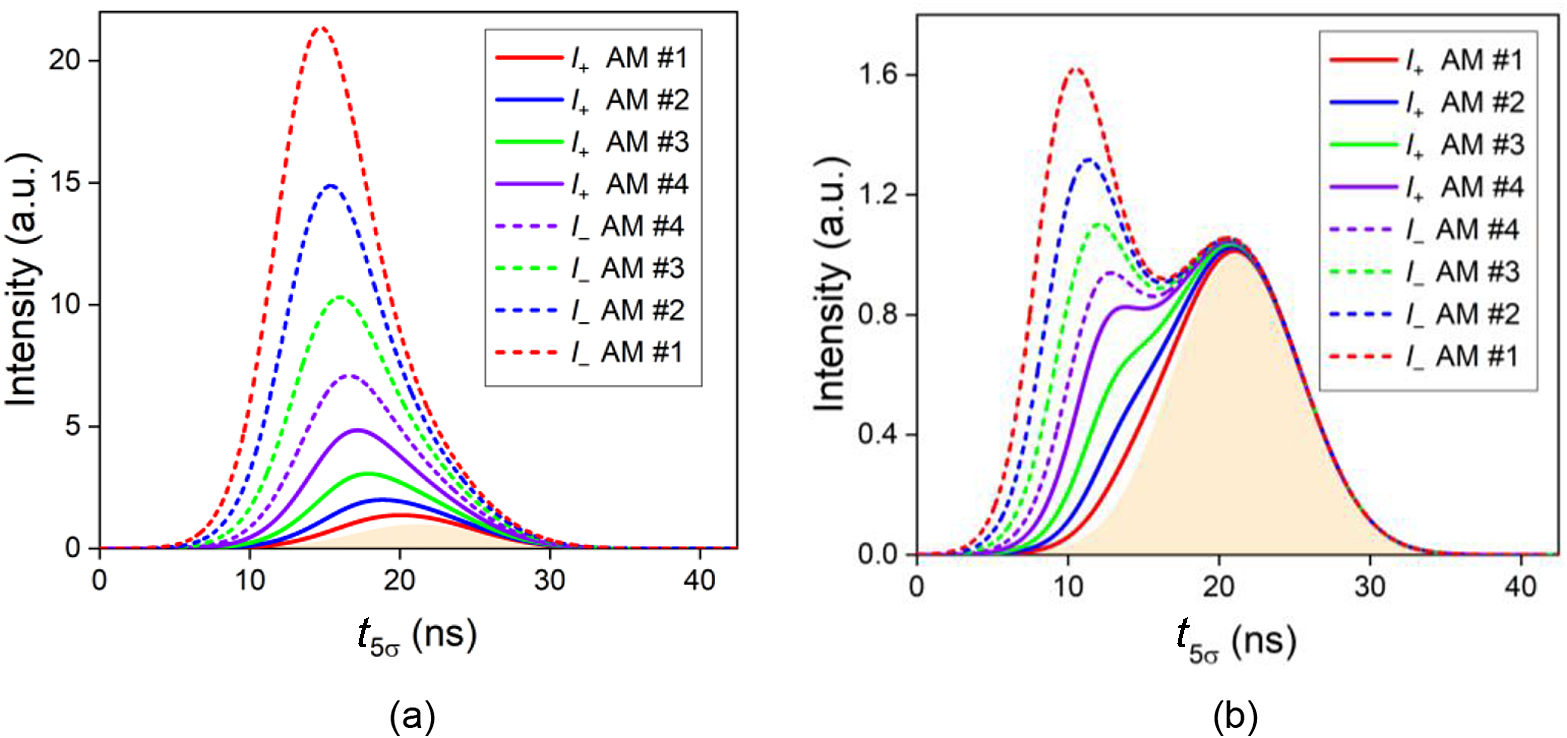
Figure 8 shows the variation of p-τ diagrams versus TOF throughout the amplification process. For a TOF of 0.14 ns, 4PO does not happen and GWB does not exist, because the leading edge of the pulse has not yet reentered the AM for the second passage. For the TOFs of 12.4 ns, 25.5 ns and 36.8 ns, 4PO occurs and E st dramatically decreases as time elapses. After the completion of the first passage of the entire pulse, only the trailing pulse segments going backward are extracting the gain, as shown in the GWB at TOF of 45.8 ns.
3.3 Spatiotemporal scaling of an AM chain
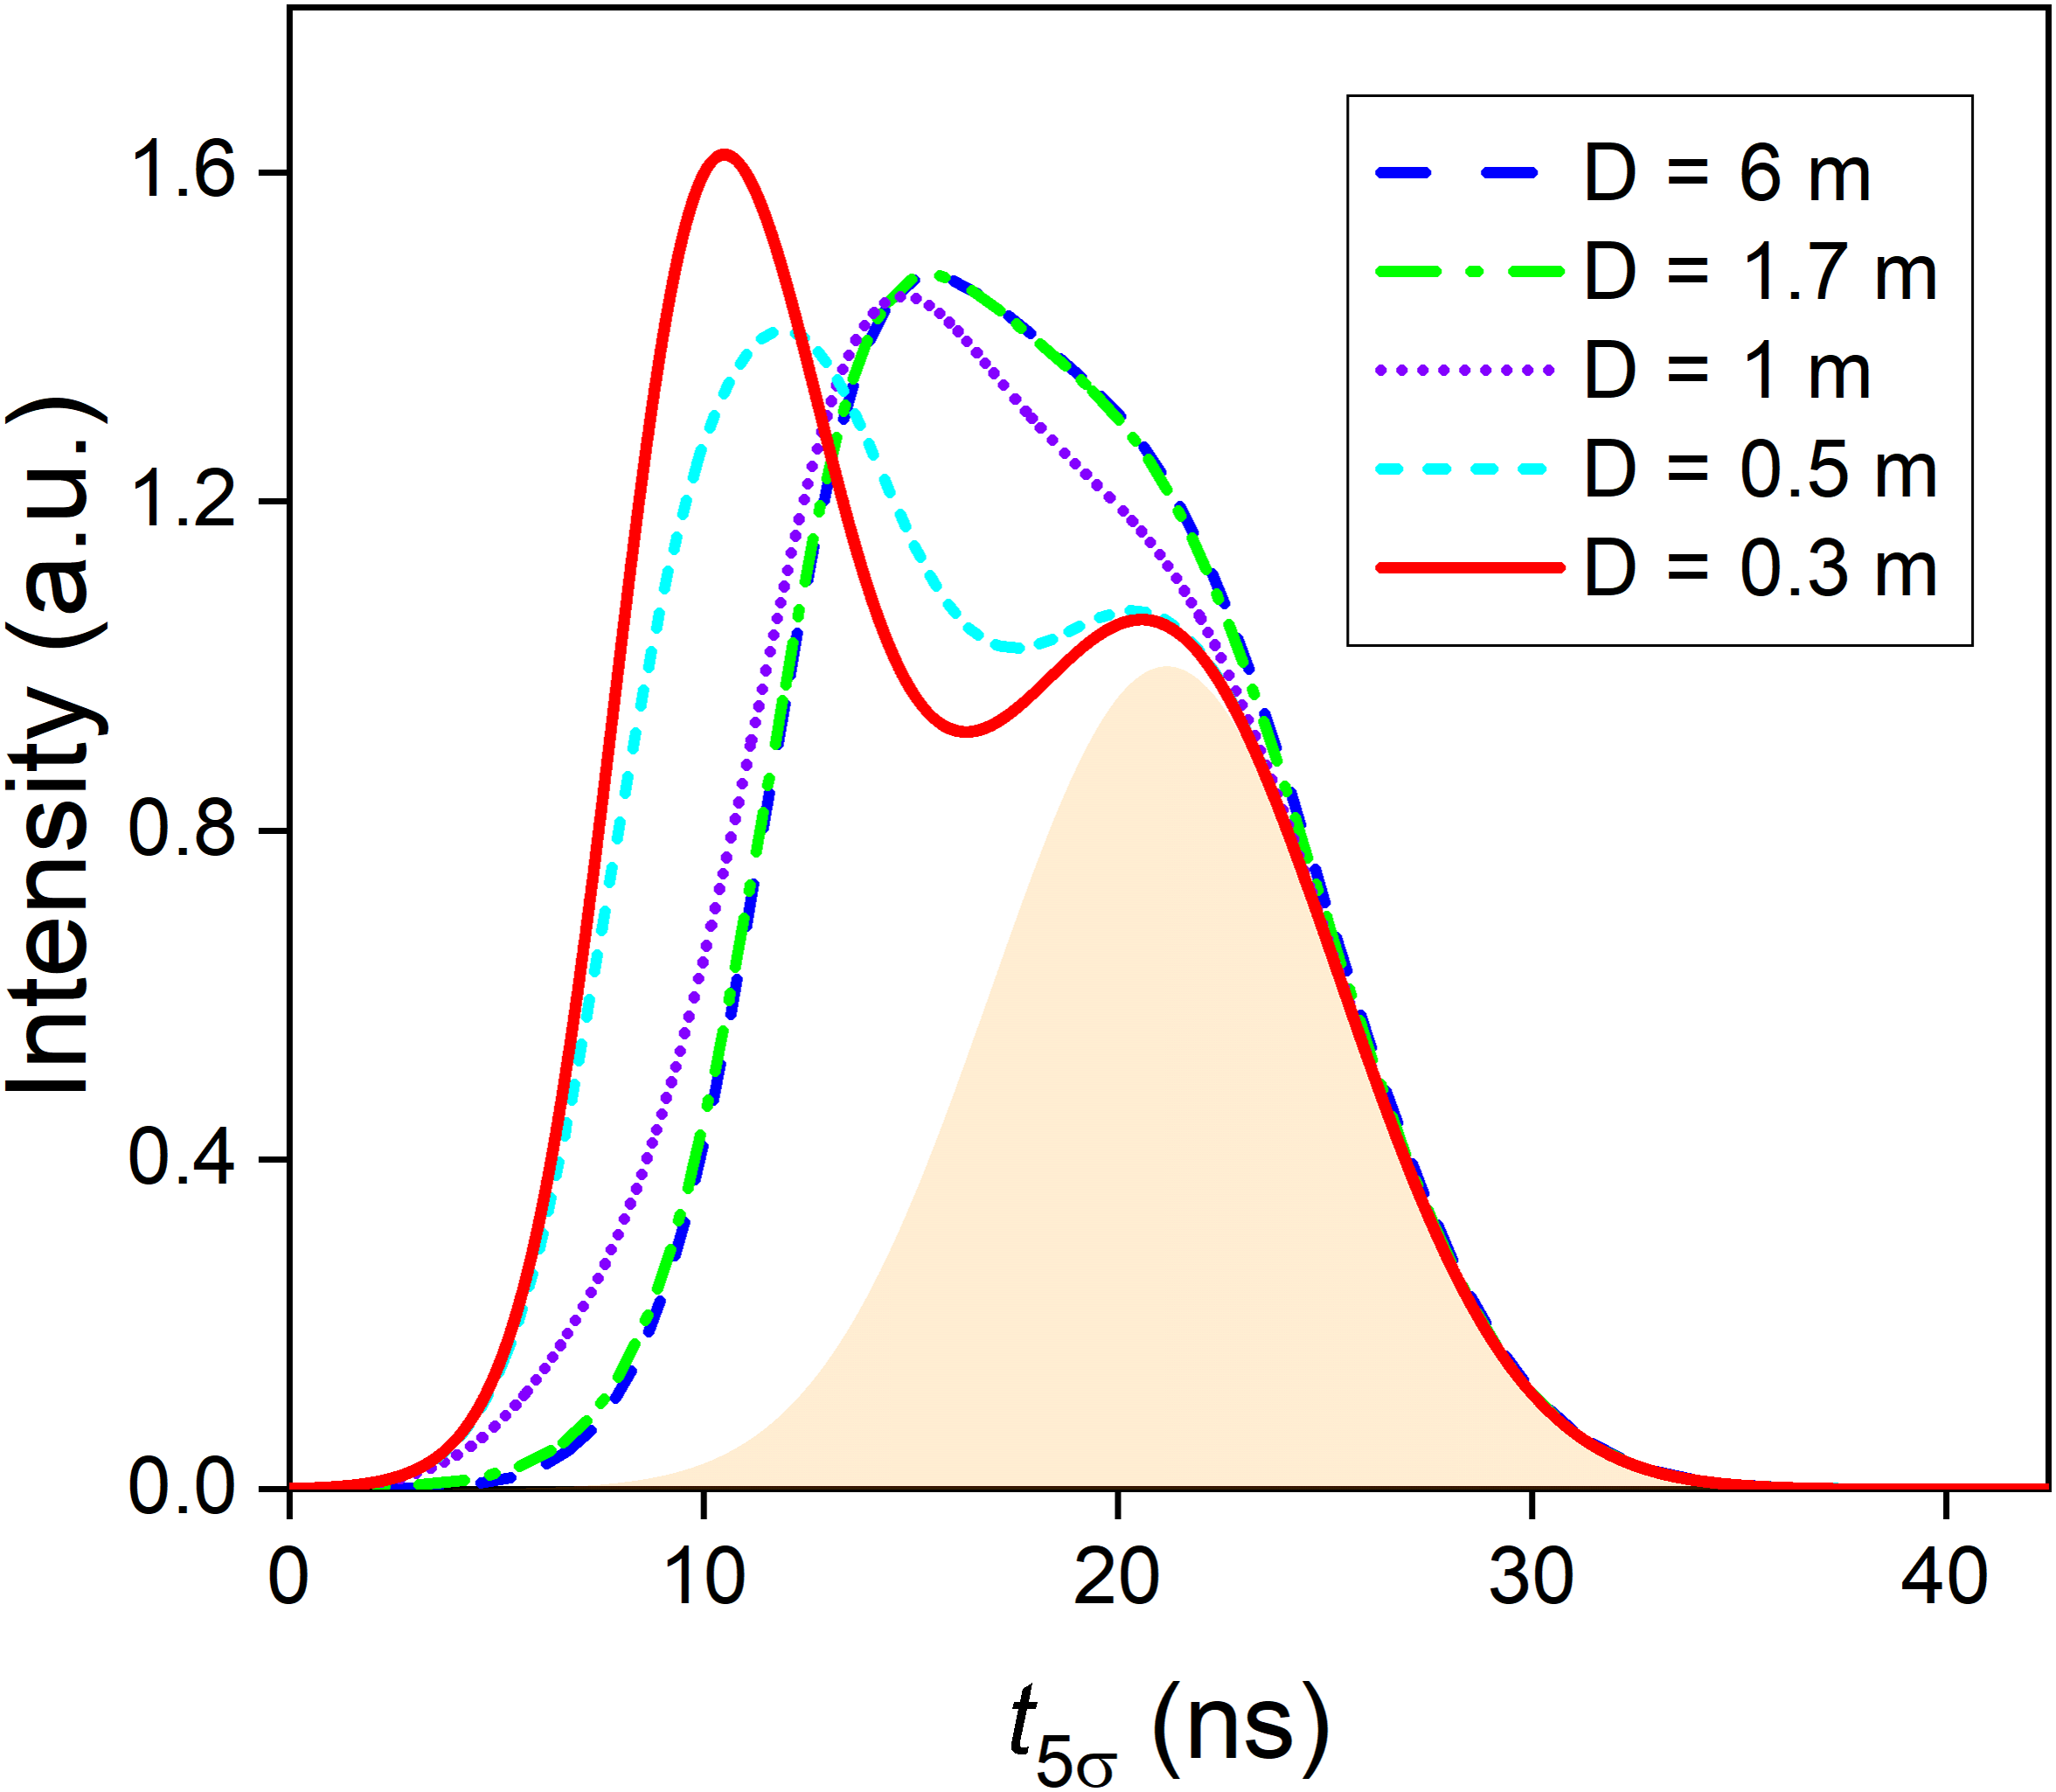
Using the setup introduced in Section 2.3, pulse-scaling experiments through four AM modules were conducted to verify the predicted results. In the experiment, the minimum available value of free-space distance D is 0.3 m due to practical limits. The simulated pulse shapes of forward- and backward-propagating pulses at AM #1–#4 are summarized in Figures 9(a) and 9(b) for the input energies of 0.1 J and 1 J, respectively. One can understand that the leading segments experience higher gain and enjoy more magnification than the trailing segments, and thus the pulse peak moves forward for both input energies. For the case of relatively low input fluence, the original peak is completely covered, as shown in Figure 9(a). At the input energy of 1 J, however, the scaling factor difference between the leading segments and the original peak is not large enough, and thus the peak of the leading segments cannot cover the amplified original peak, generating the two-peak profile as shown in Figure 9(b). With the overall gain of the amplifier further enhanced, more peaks may appear, with examples shown in Section 3.4 below. Figure 10 demonstrates that the two-peak distortion becomes weaker as D enlarges, and even vanishes with D over 1 m.
Pulse shape for different D with an input energy of 1 J.
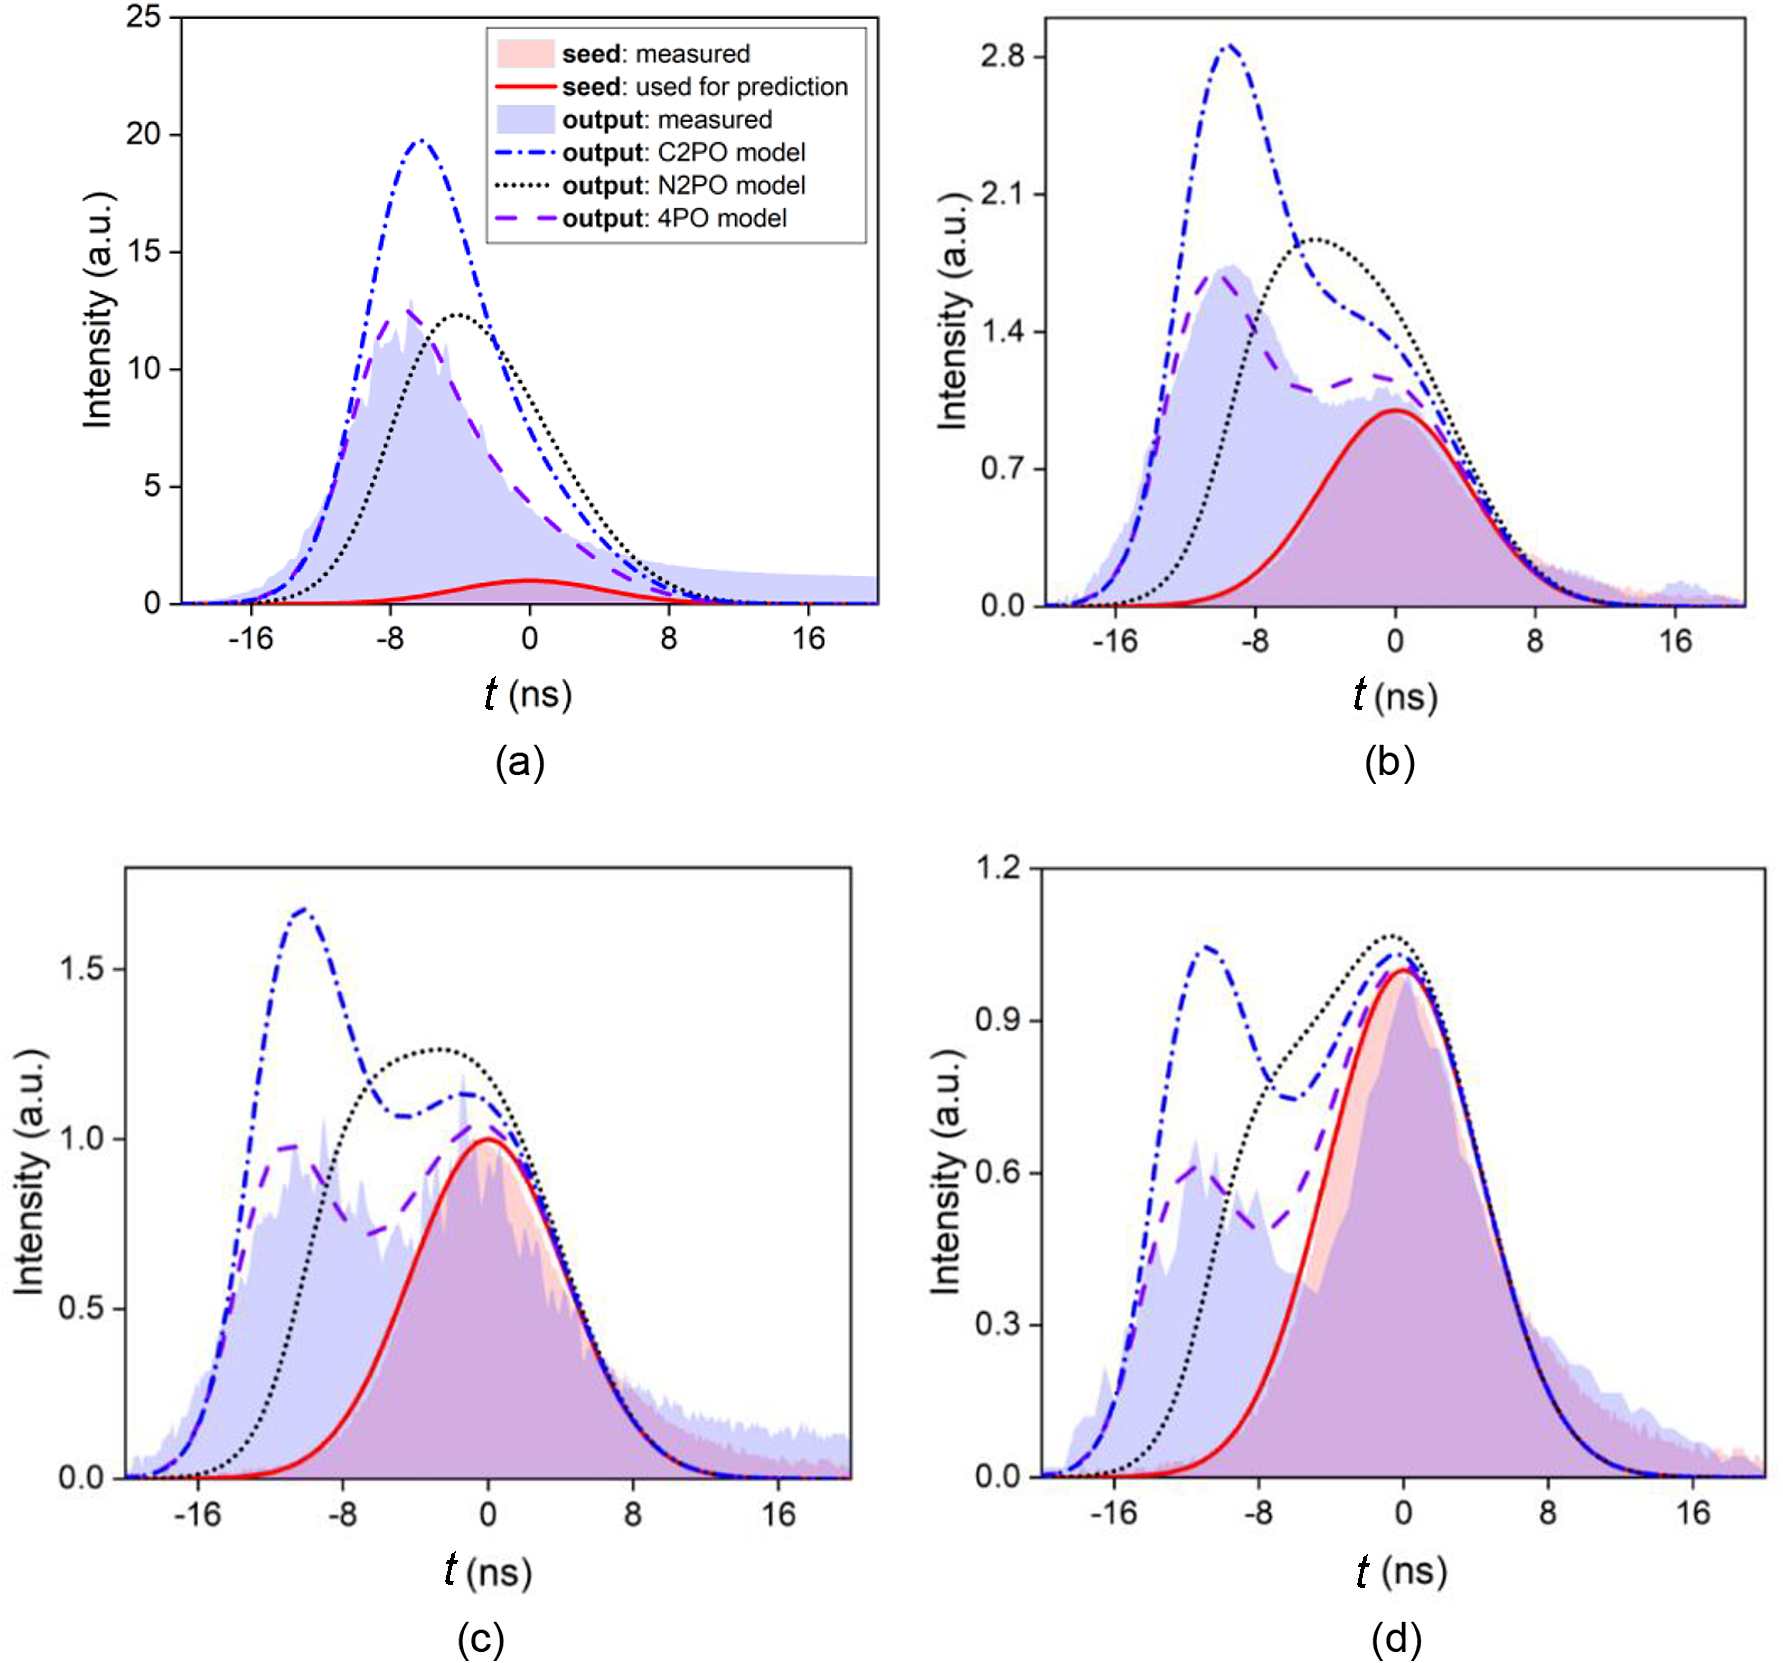
Measured pulse profiles under the 4PO condition, along with predicted results, versus different input energies. (a) 0.1 J; (b) 1 J; (c) 1.8 J; (d) 3 J.
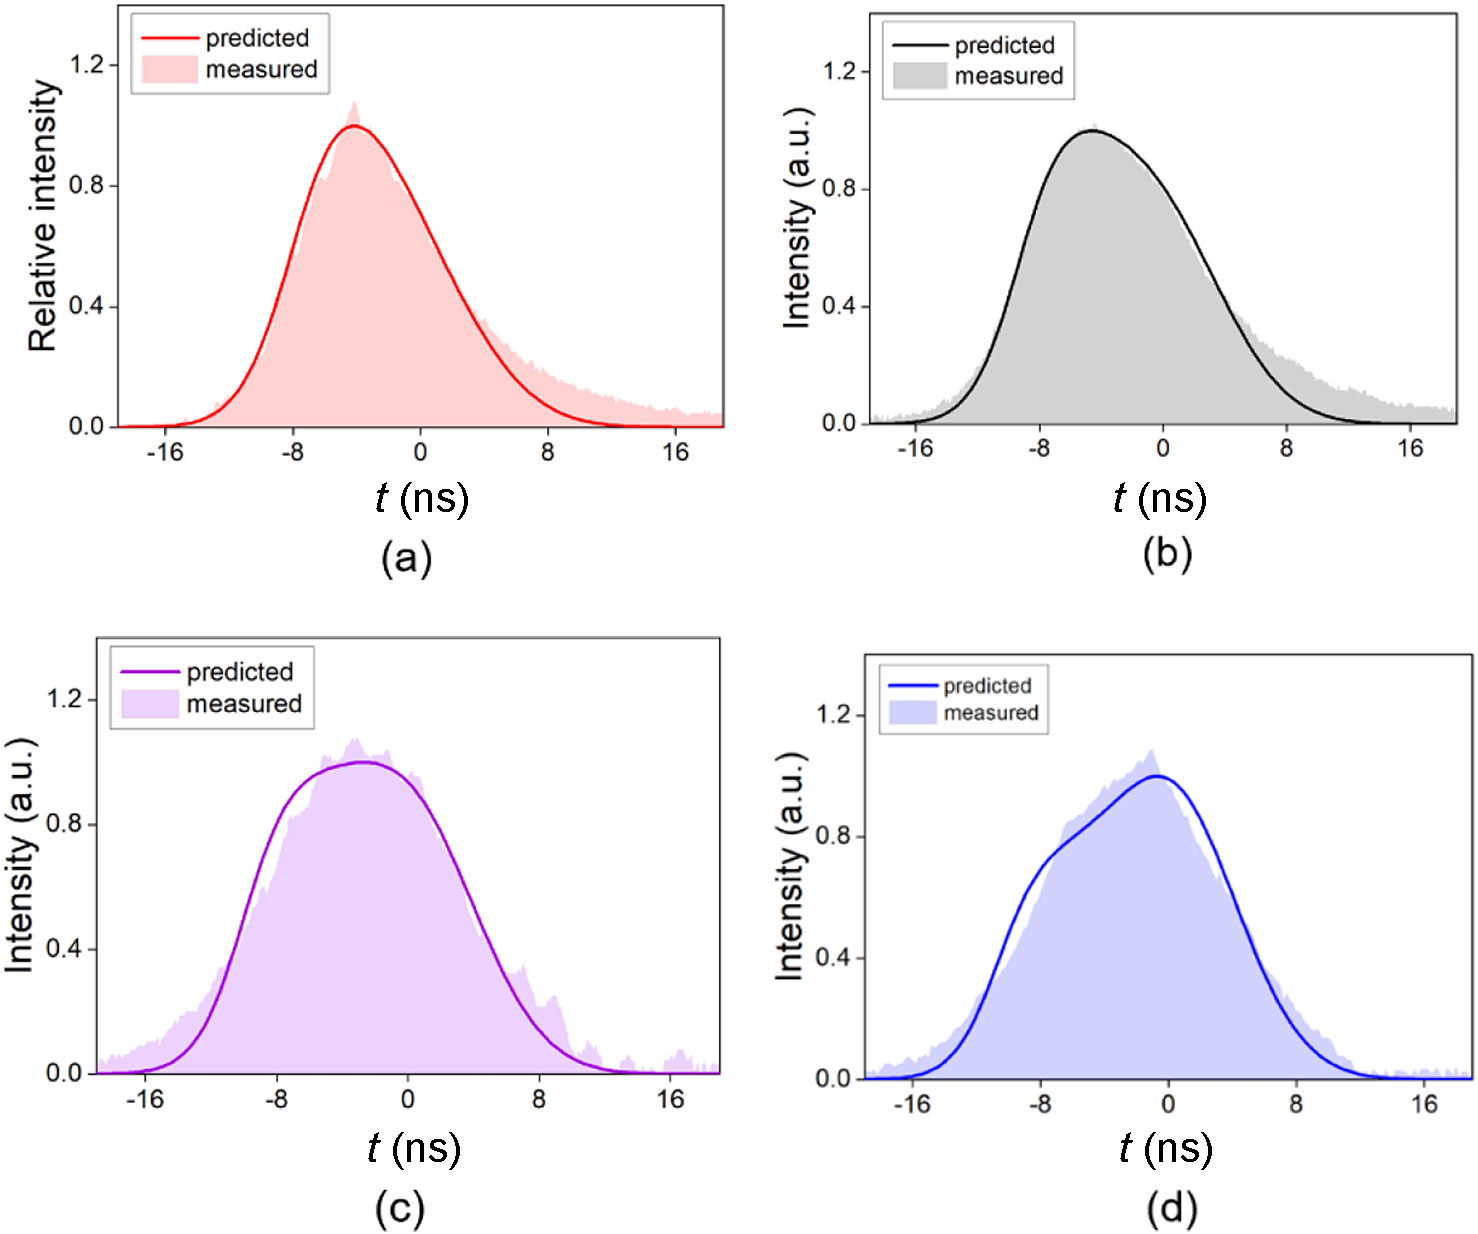
Predicted and measured results for an amplified pulse profile under the N2PO condition versus input energy. (a) 0.1 J; (b) 1 J; (c) 1.8 J; (d) 3 J.
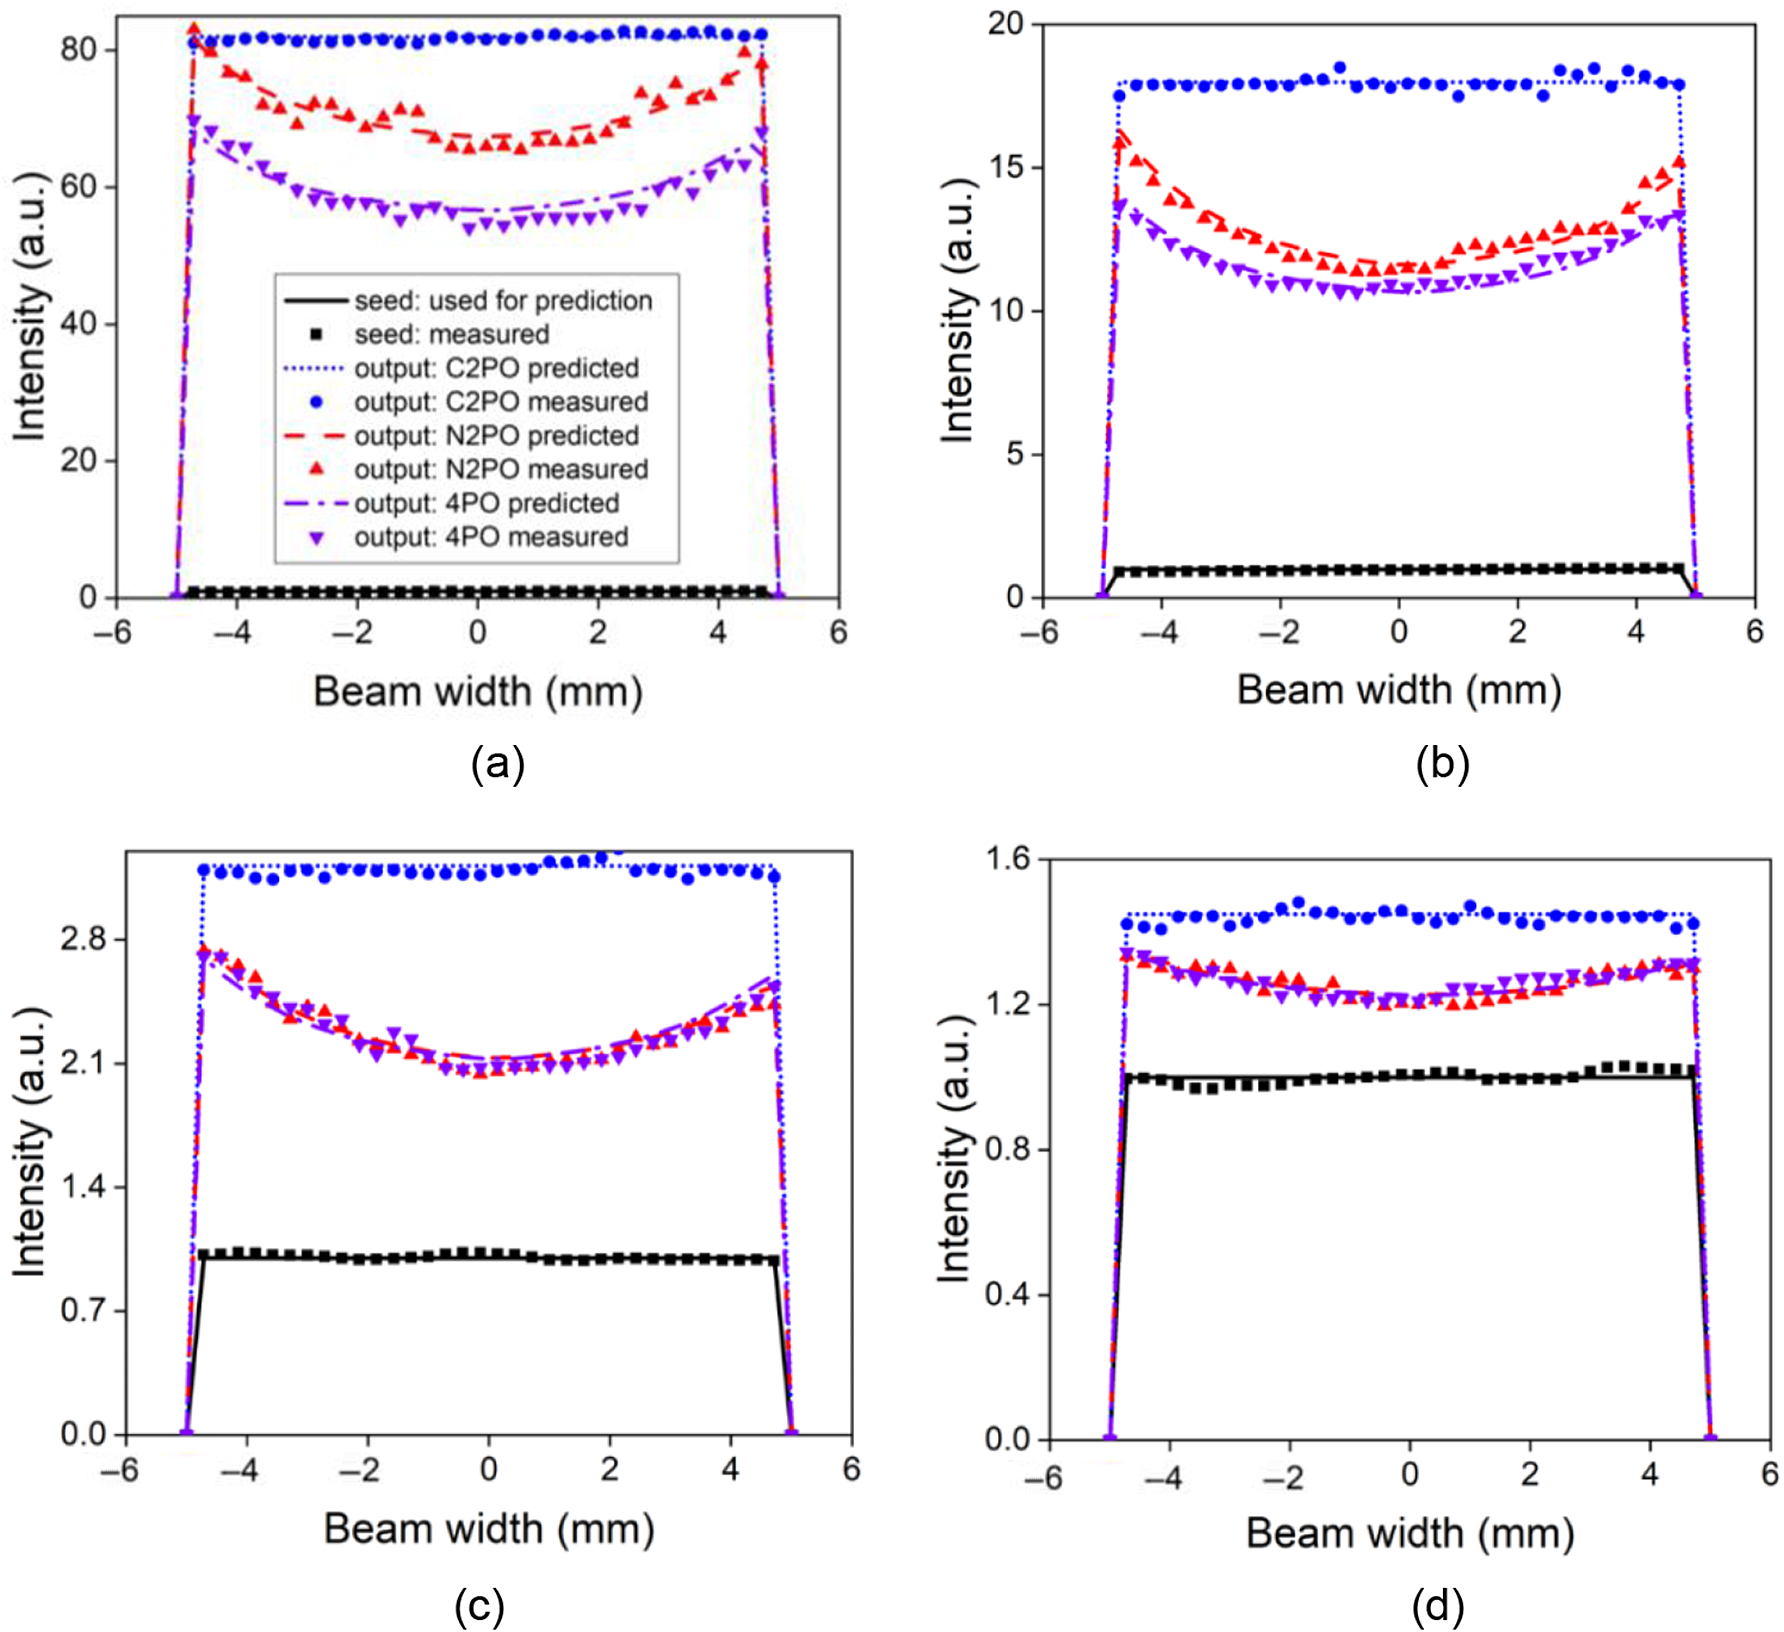
Transverse intensity profiles of amplified beam versus the input energy. (a) 0.1 J; (b) 1 J; (c) 1.8 J; (d) 3 J.
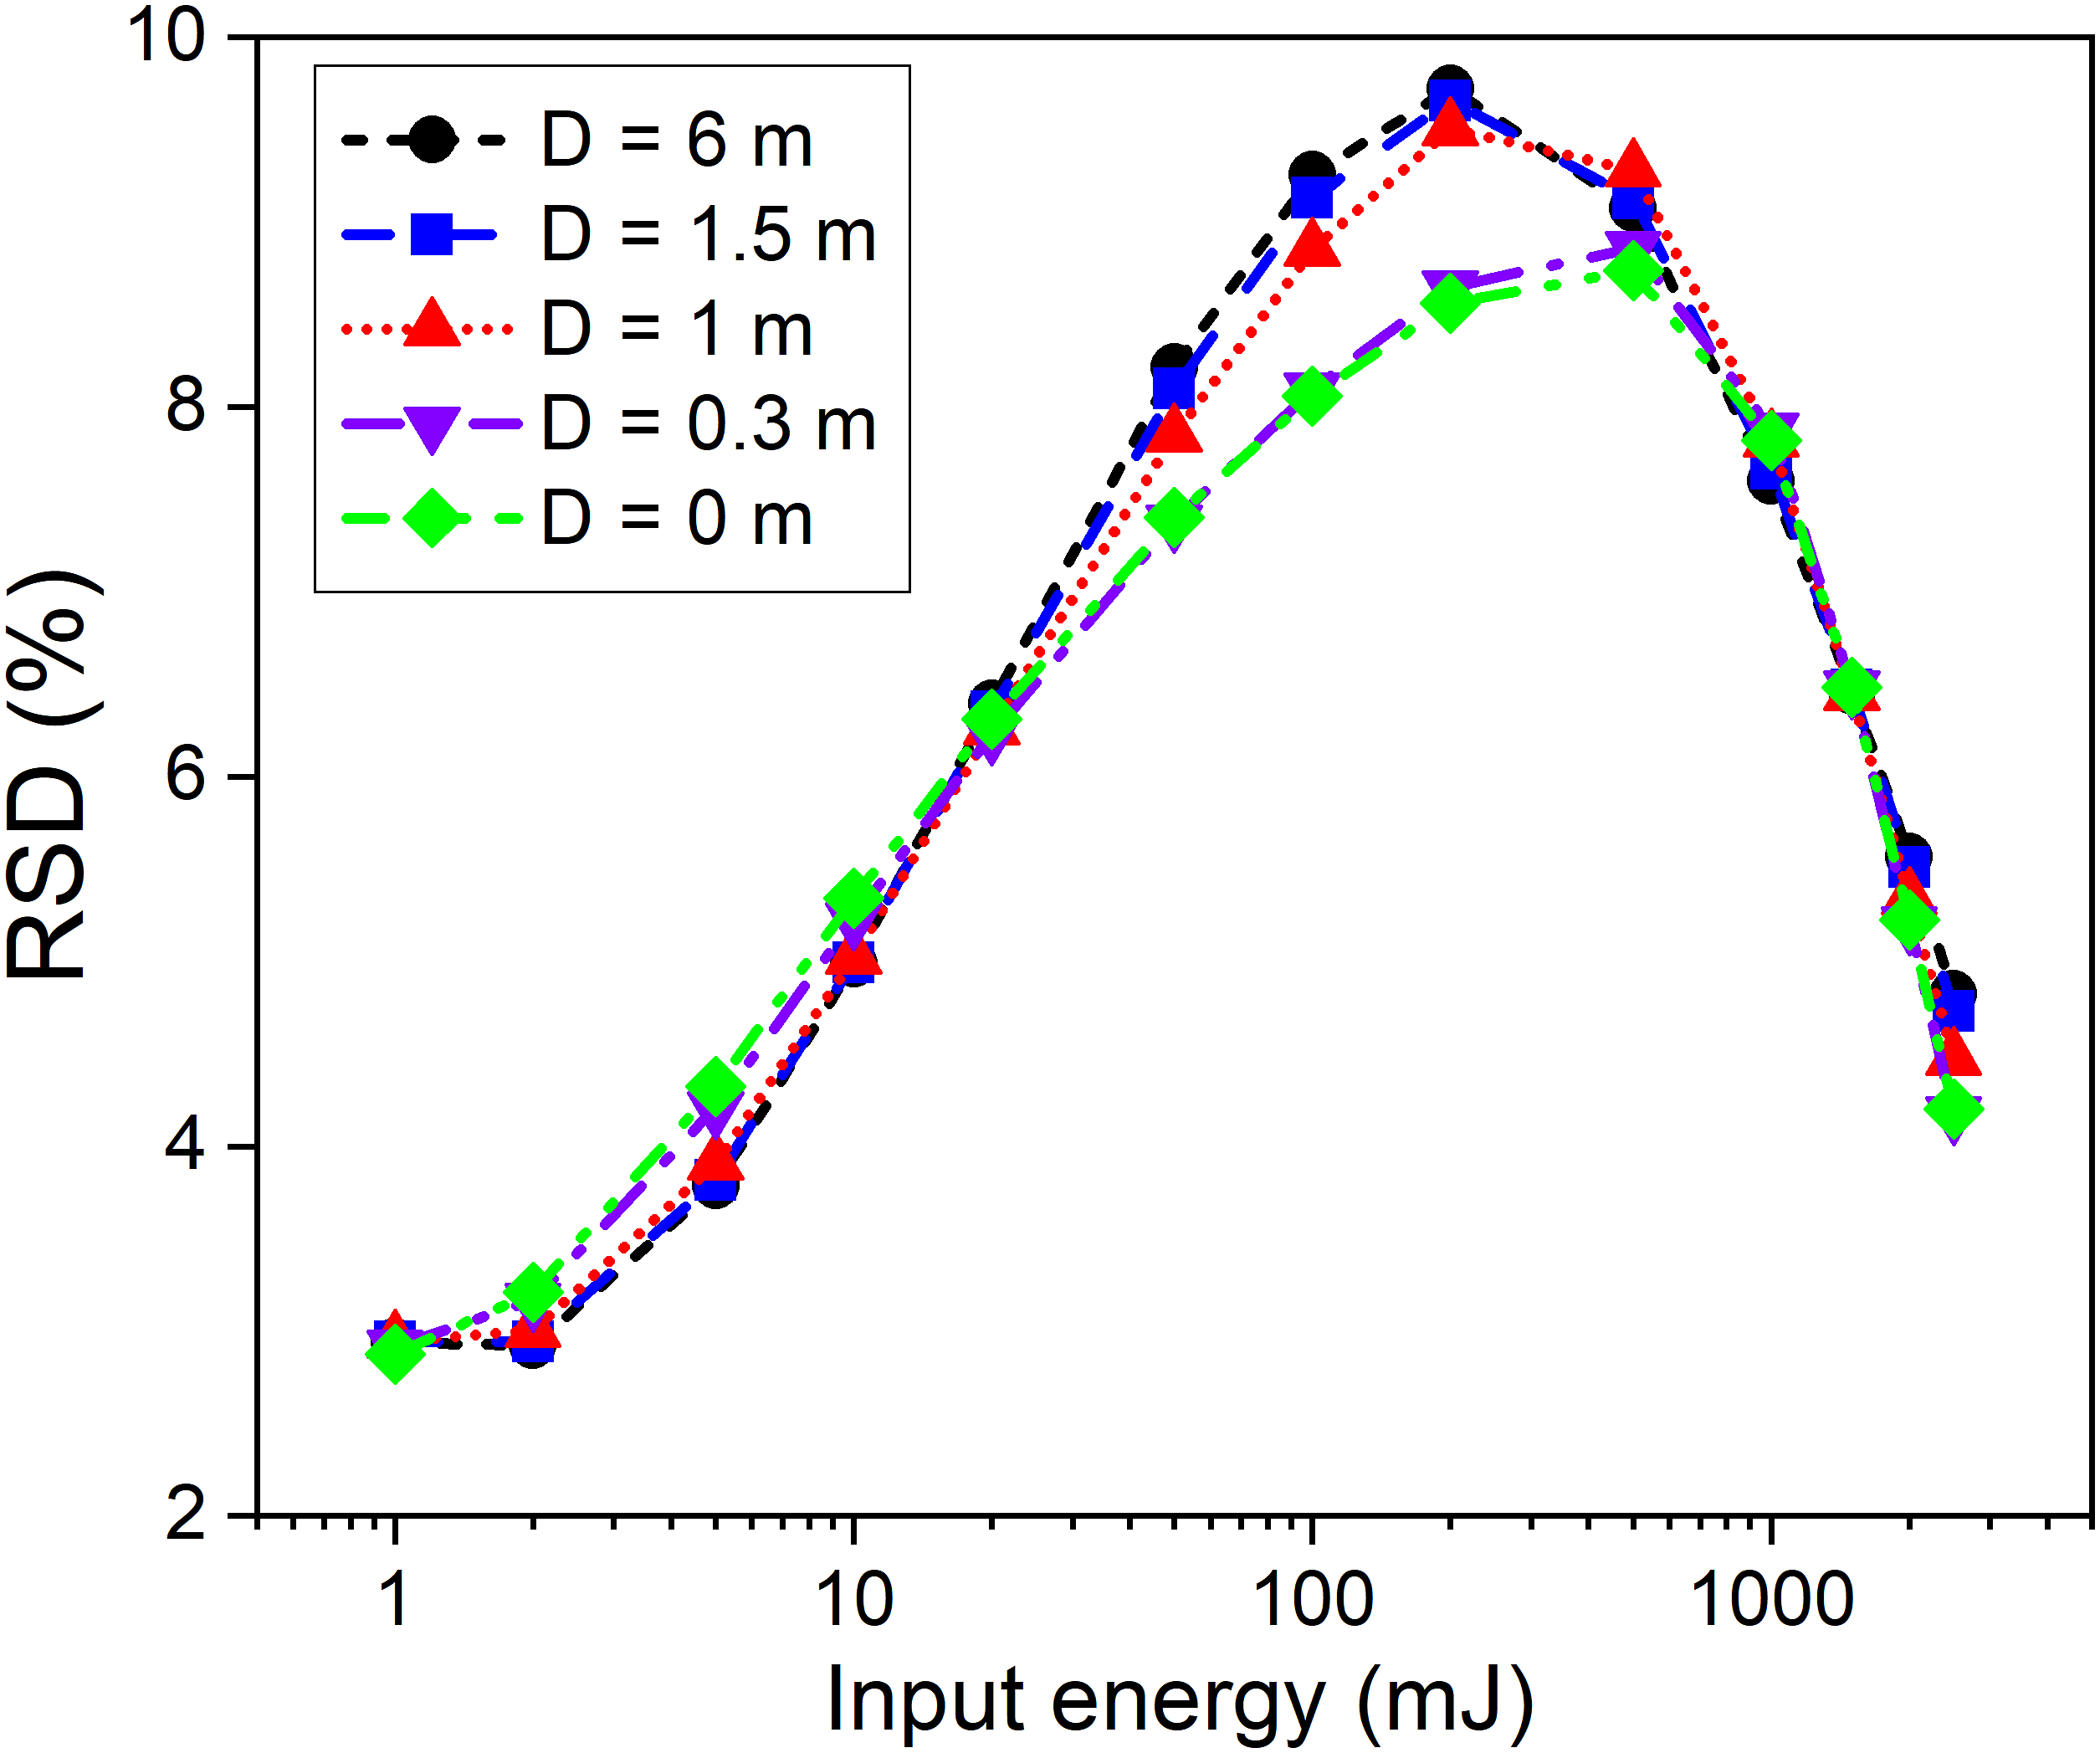
RSD of transverse intensity distribution versus the input energy and D.
Experimental results on the temporal profile of amplified output under 4PO condition are shown in Figures 11(a)–11(d) with seed energies of 0.1 J, 1 J, 1.8 J and 3 J, respectively, demonstrating four representative pulse profiles including a stretched single-peak shape, a two-peak shape with the former peak higher, a two-peak shape with equal intensity and a two-peak shape with the latter peak higher. Note that for a high input fluence (3.84 times the saturation fluence) in Figure 11(d), the leading segments extract almost all the stored energy while the trailing segments barely get amplified. Furthermore, predicted profiles using three models for C2PO, N2PO and 4PO are added in Figure 11 to compare with experimental results operating under 4PO condition. It is shown that the 4PO model agrees well with experimental results in all four scenarios, while the N2PO model fails to predict two-peak profiles and the C2PO model always overestimates the scaling factors of the leading segments. Experimental results under the N2PO condition (with a sufficiently long D) are obtained as well, showing good agreement with the predicted results using the N2PO model, as shown in Figure 12.
The transverse intensity profiles of an amplified beam with seed energies of 0.1 J, 1 J, 1.8 J and 3 J are shown in Figures 13(a)–13(d), respectively, in which the experimental results agree well with the simulation results under all conditions of C2PO, N2PO and 4PO. Note that the experimental conditions for C2PO can be approximately realized by reducing the seed beam diameter to 0.5 mm with a serrated aperture. Figure 13 also shows that the beam edges achieve stronger power scaling than the beam center in both N2PO and 4PO conditions, while the flat-top intensity profile remains through the amplification for C2PO condition. To evaluate the nonuniformity of intensity distribution versus input energy and free-space traveling distance D, the relative standard deviation (RSD) was calculated and illustrated in Figure 14, showing that RSD reaches up to 9.7% at an input energy of 200 mJ and improves to 4.8% at an input energy of 2.5 J, while RSD is insensitive to variation of D.
To investigate the energy loss caused by 4PO, we define the energy-loss ratio as
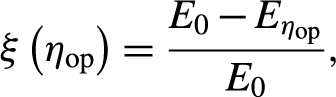 \begin{align}\xi \left({\eta}_\mathrm{op}\right)=\frac{E_0-{E}_{\eta_\mathrm{op}}}{E_0},\end{align}
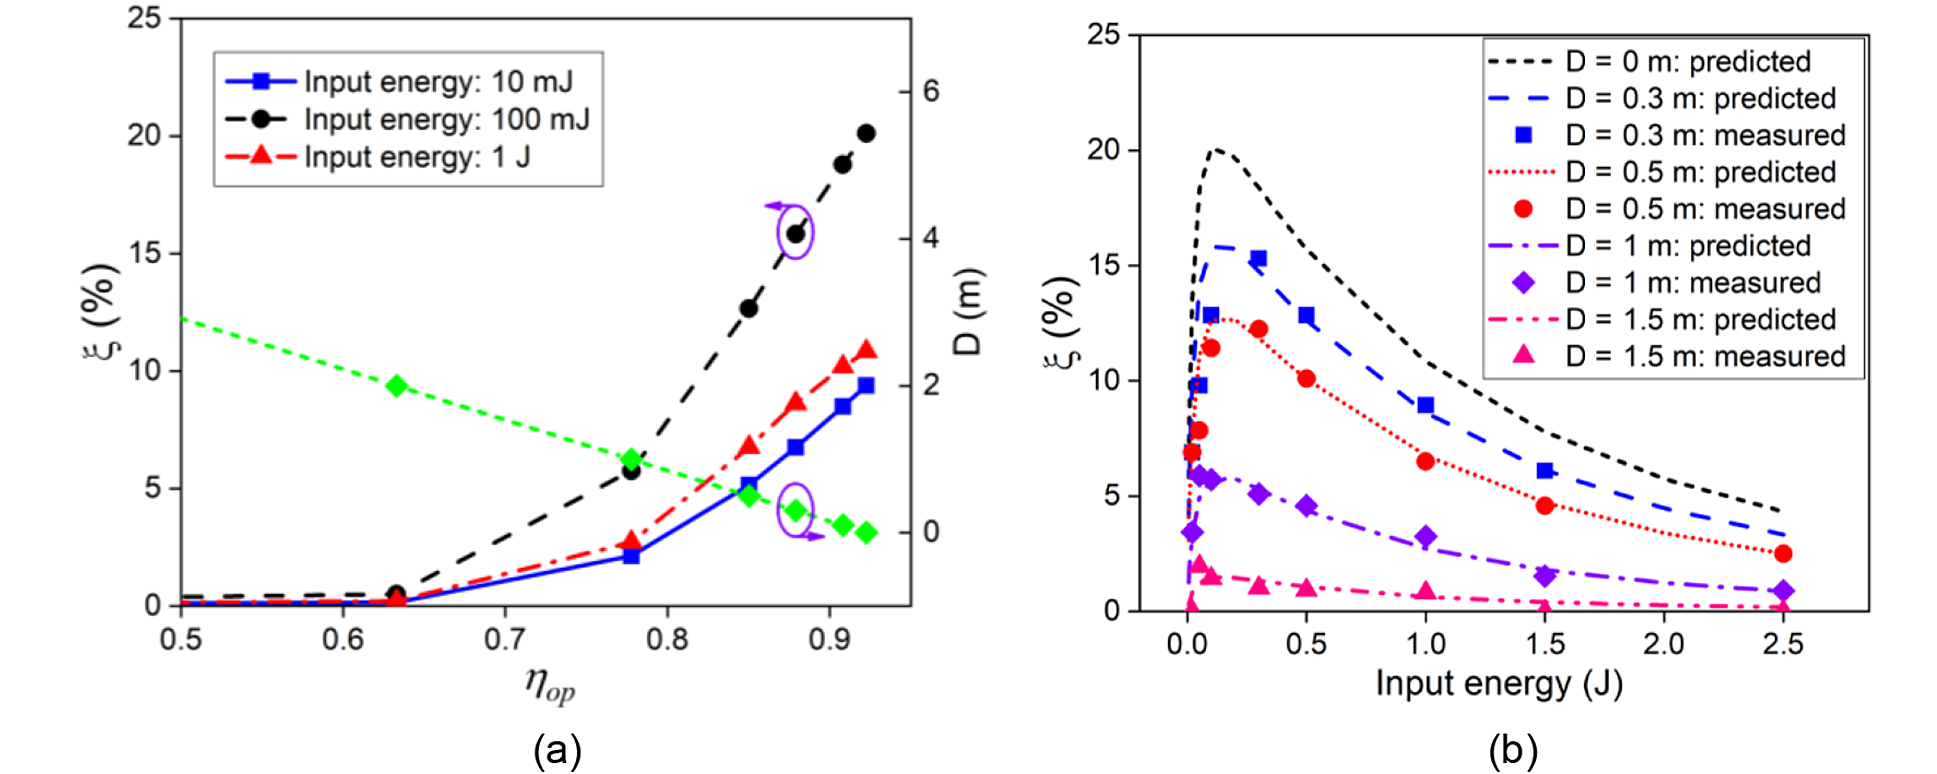
where E 0 is the output energy in the N2PO condition (with a sufficiently long D to ensure η op = 0), and E ηop is the output energy in the 4PO condition for a particular η op. Figure 15(a) indicates a linear relationship between D and η op, and describes the variation of the energy-loss ratio versus different input energy and D, showing that the energy-loss ratio remains at an extremely low level for cases of η op below 0.6 (with D over 2.2 m), but rises rapidly with larger η op (smaller D). For an input energy of 200 mJ, the energy-loss ratio due to spatiotemporal overlap is as high as 15.7% for D of 0.3 m and 1.5% for D of 1.5 m, as shown in Figure 15(b), while the energy-loss ratio can be kept below 5% for D of 0.3 m and an input energy of 2.5 J.
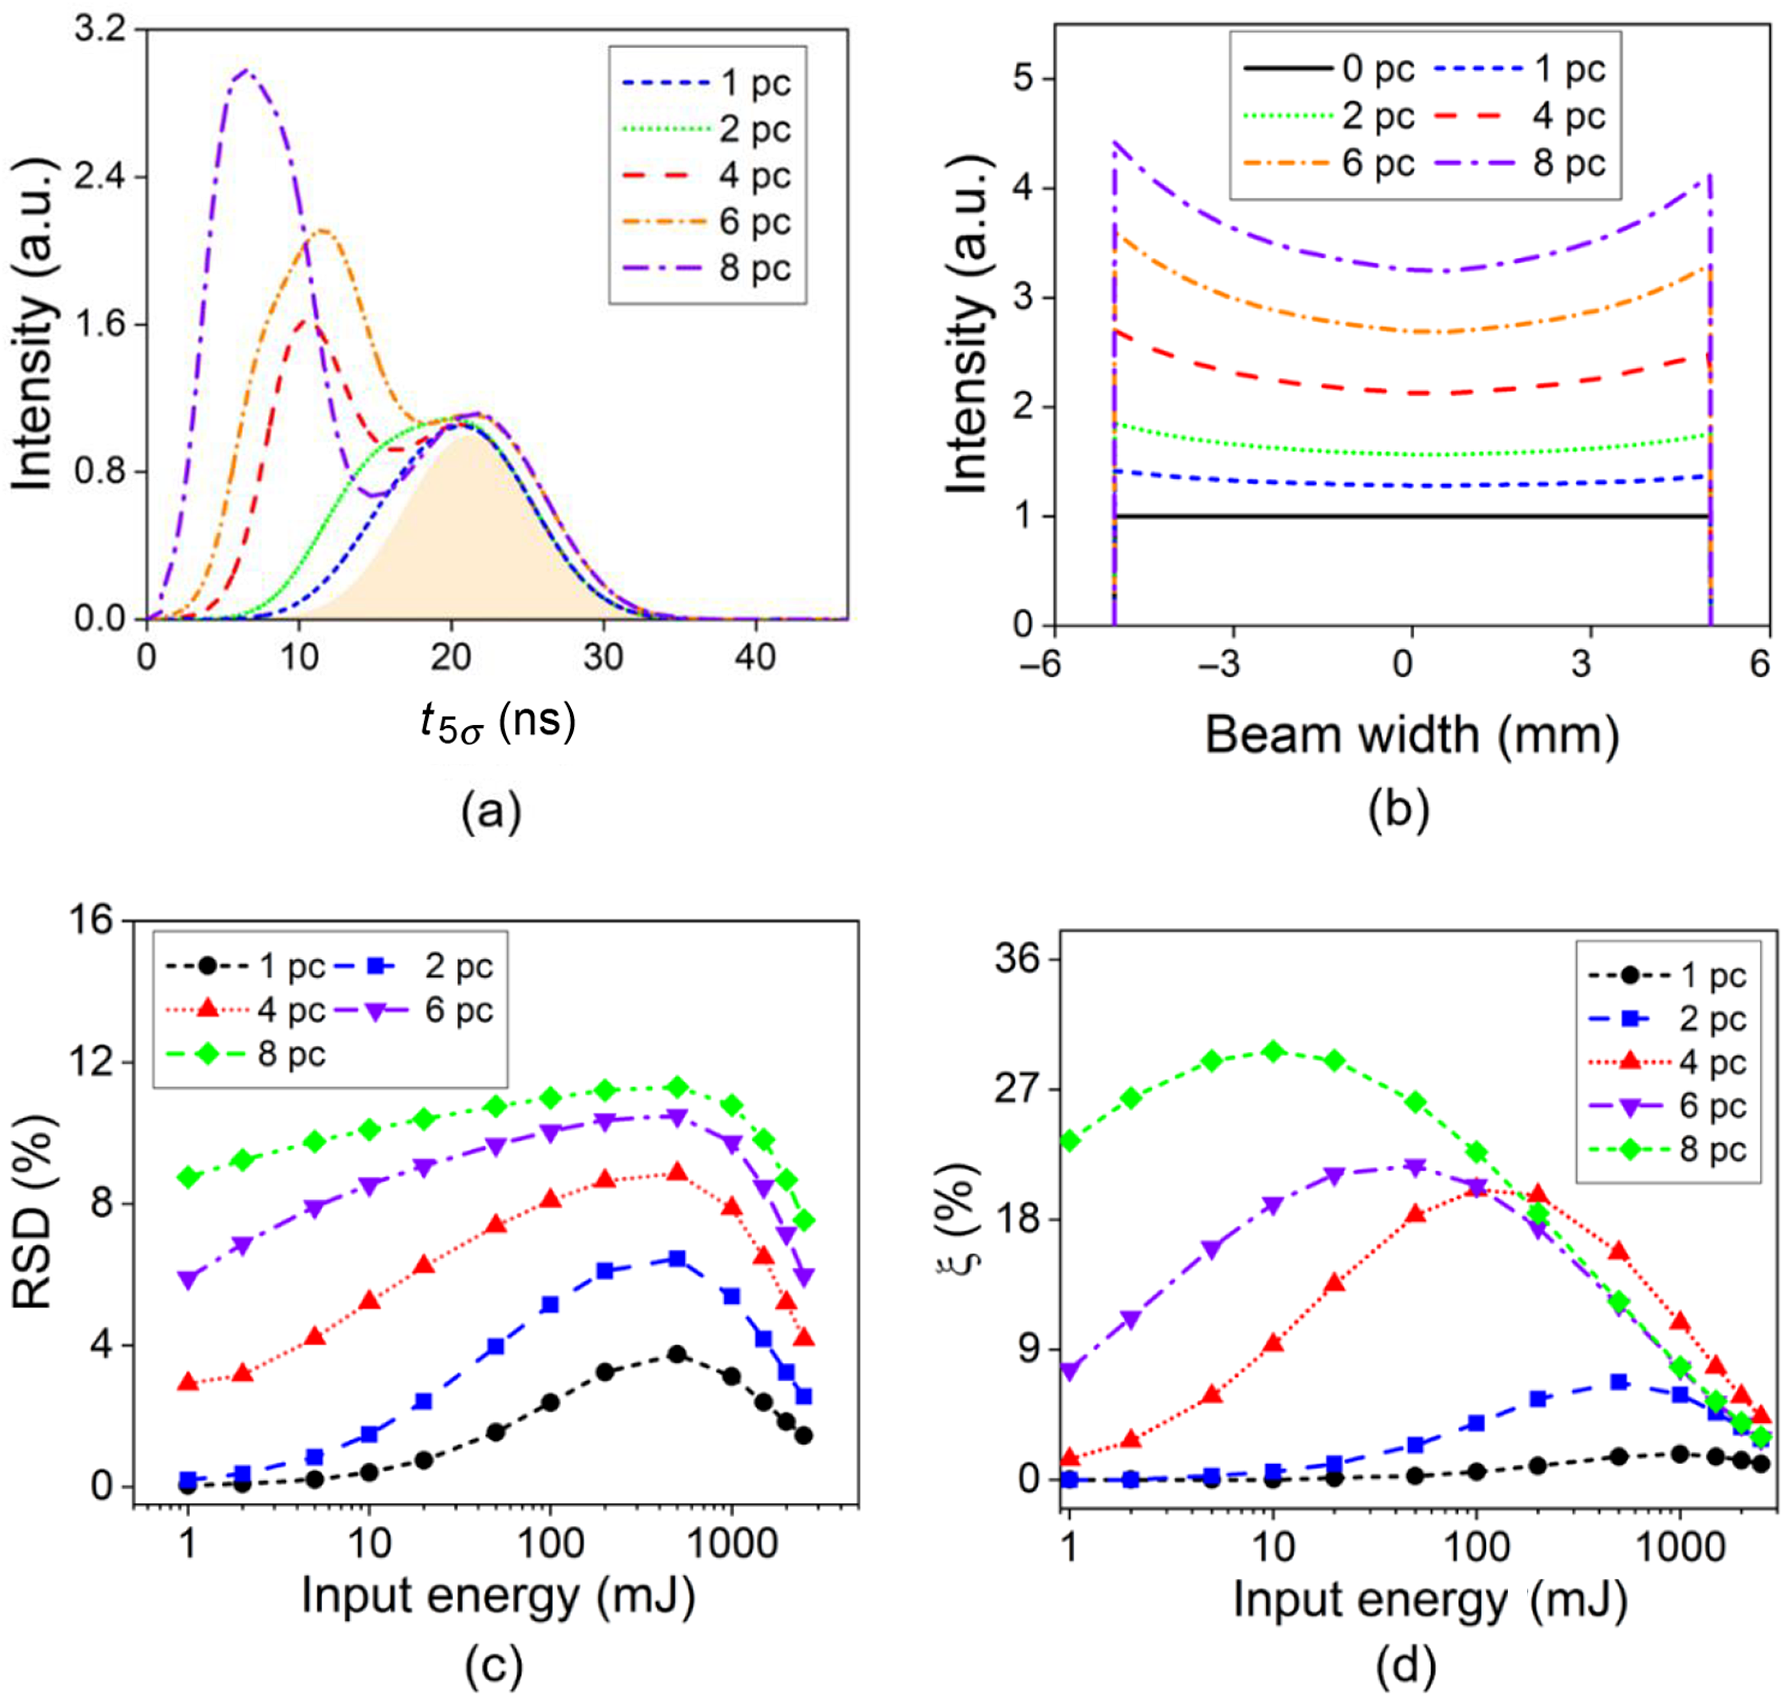
Figures 16(a)–16(d) show the influence of the number of AMs in a chain on the laser output characteristics including the pulse shape, intensity distribution and its nonuniformity, as well as the energy-loss ratio. For the two-peak pulse profile, the first peak becomes much higher than the amplified original peak of the Gaussian shape pulse, and moves forward as the number of AM increases, as shown in Figure 16(a). Figures 16(b) and 16(c) indicate a similar profile of intensity distribution and larger RSD with more AMs in the chain. According to Figure 16(d), as the number of AMs increases from four to eight, the maximum energy-loss ratio increases from 20.1% to 29.7%, while the corresponding critical input energy reduces from 100 mJ to 10 mJ.
Hence, as Figures 15 and 16 suggest, the energy loss due to spatiotemporal overlap needs to be seriously considered for the selection of the input energy and free-space distance D for designing a double-pass AM amplifier. In some circumstances, a trade-off between the output energy and the system compactness is inevitable. Also note that, for a sufficiently high input fluence, since most of the stored energy is extracted in the first passage, the double-pass geometry should be avoided to prevent severe distortion of the pulse shape, nonuniform intensity distribution, and a considerable energy loss due to spatiotemporal overlap.
Energy-loss ratio of 4PO. (a) Versus η op; (b) versus the input energy.
Influence of the number of AMs in a chain on the laser output characteristics. (a) Pulse shape; (b) intensity distribution; (c) RSD of intensity distribution; (d) energy-loss ratio.
Evolution from an AM chain to zigzag geometry. (a) Four AM modules closely arranged; (b) zigzag geometry.
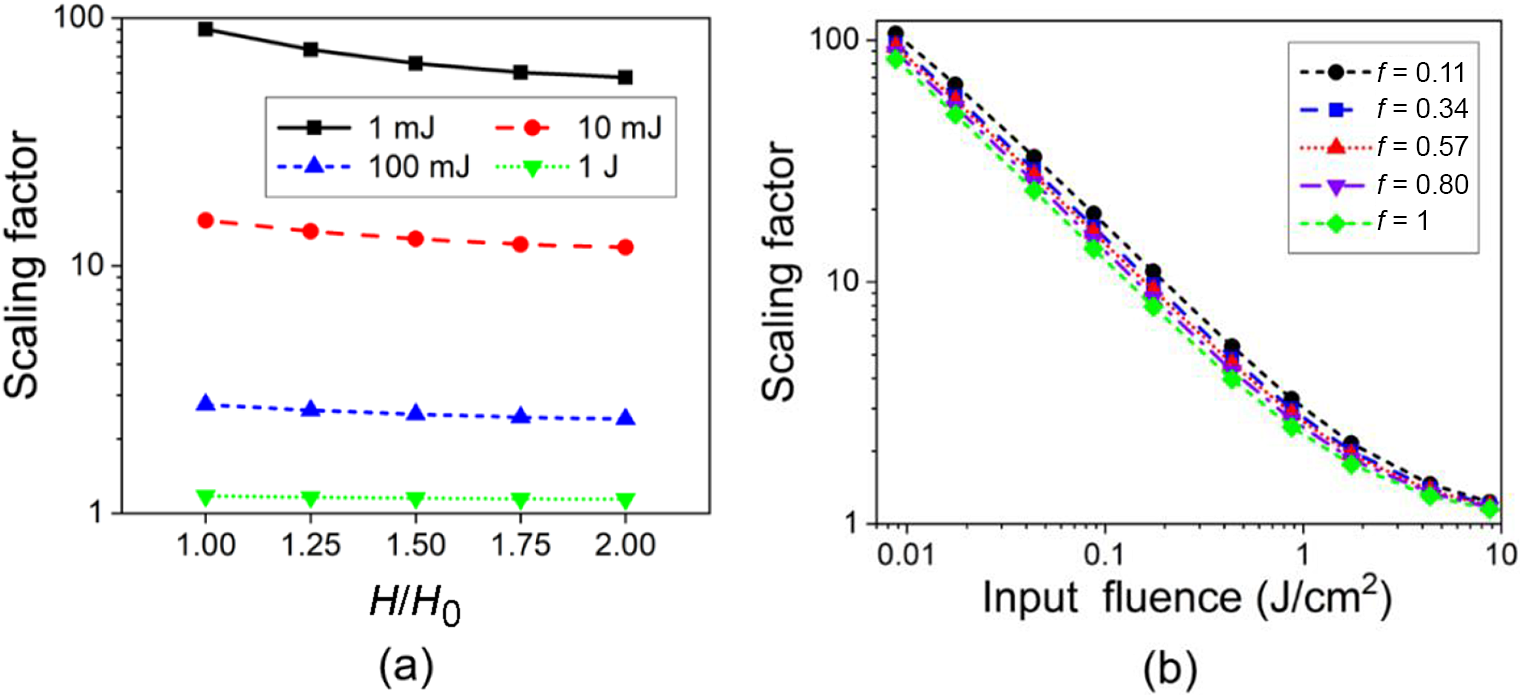
Scaling factor (a) versus the ratio of H to H 0 and (b) versus the input fluence.
3.4 Extension to zigzag geometry
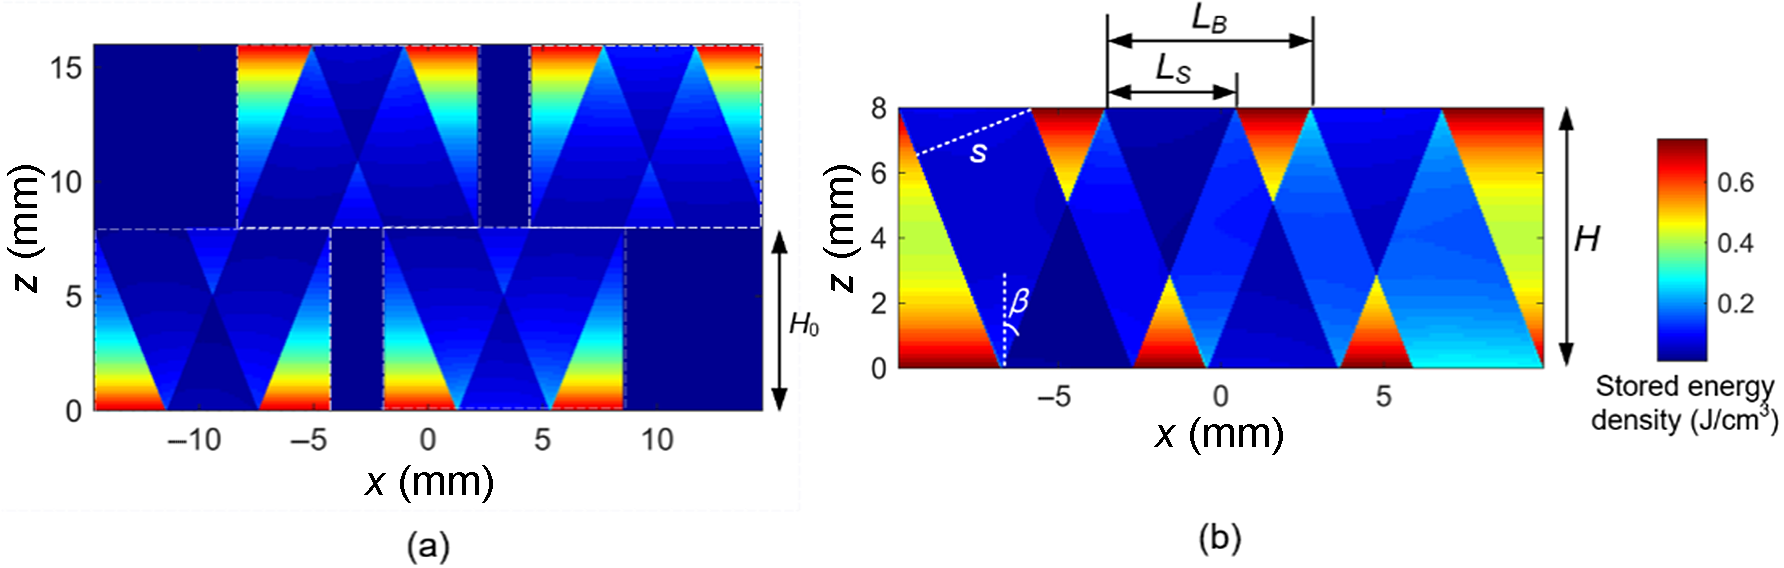
The spatiotemporal model established above for the double-pass AM geometry can be extended to double-pass zigzag geometry, since they share a series of V-shaped paths inside the gain medium. Figures 17(a) and 17(b) demonstrate the evolution process from four pieces of AM closely arranged, with coinciding front surfaces of the upper and lower AM modules, to a zigzag configuration as the distance H between two pump surfaces shortens from 2H 0 to H 0, while keeping the pump intensity unchanged. The input beam size here is reset as 3 mm× 3 mm to accommodate both geometries.
Figure 18(a) shows that a higher output energy can be obtained as H decreases from 2H 0 to H 0, since the energy storage is more concentrated, leading to the scaling factor enhancement of 36.1%, 22.2%, 12.6% and 3.0% for the input energies of 1 mJ, 10 mJ, 100 mJ and 1 J, respectively. As Figure 17(b) indicates, according to the traditional modeling of zigzag geometry[Reference Eggleston, Frantz and Injeyan11, Reference Kay, Poulios, Coyle, Stysley and Clarke12] based on a modified Frantz–Nodvik equation, the fill factor f is calculated as
 \begin{align}f=\frac{L_S}{L_B}=\frac{s/\cos \beta }{2H\tan \beta }=\frac{s}{2H\sin \beta }.\end{align}
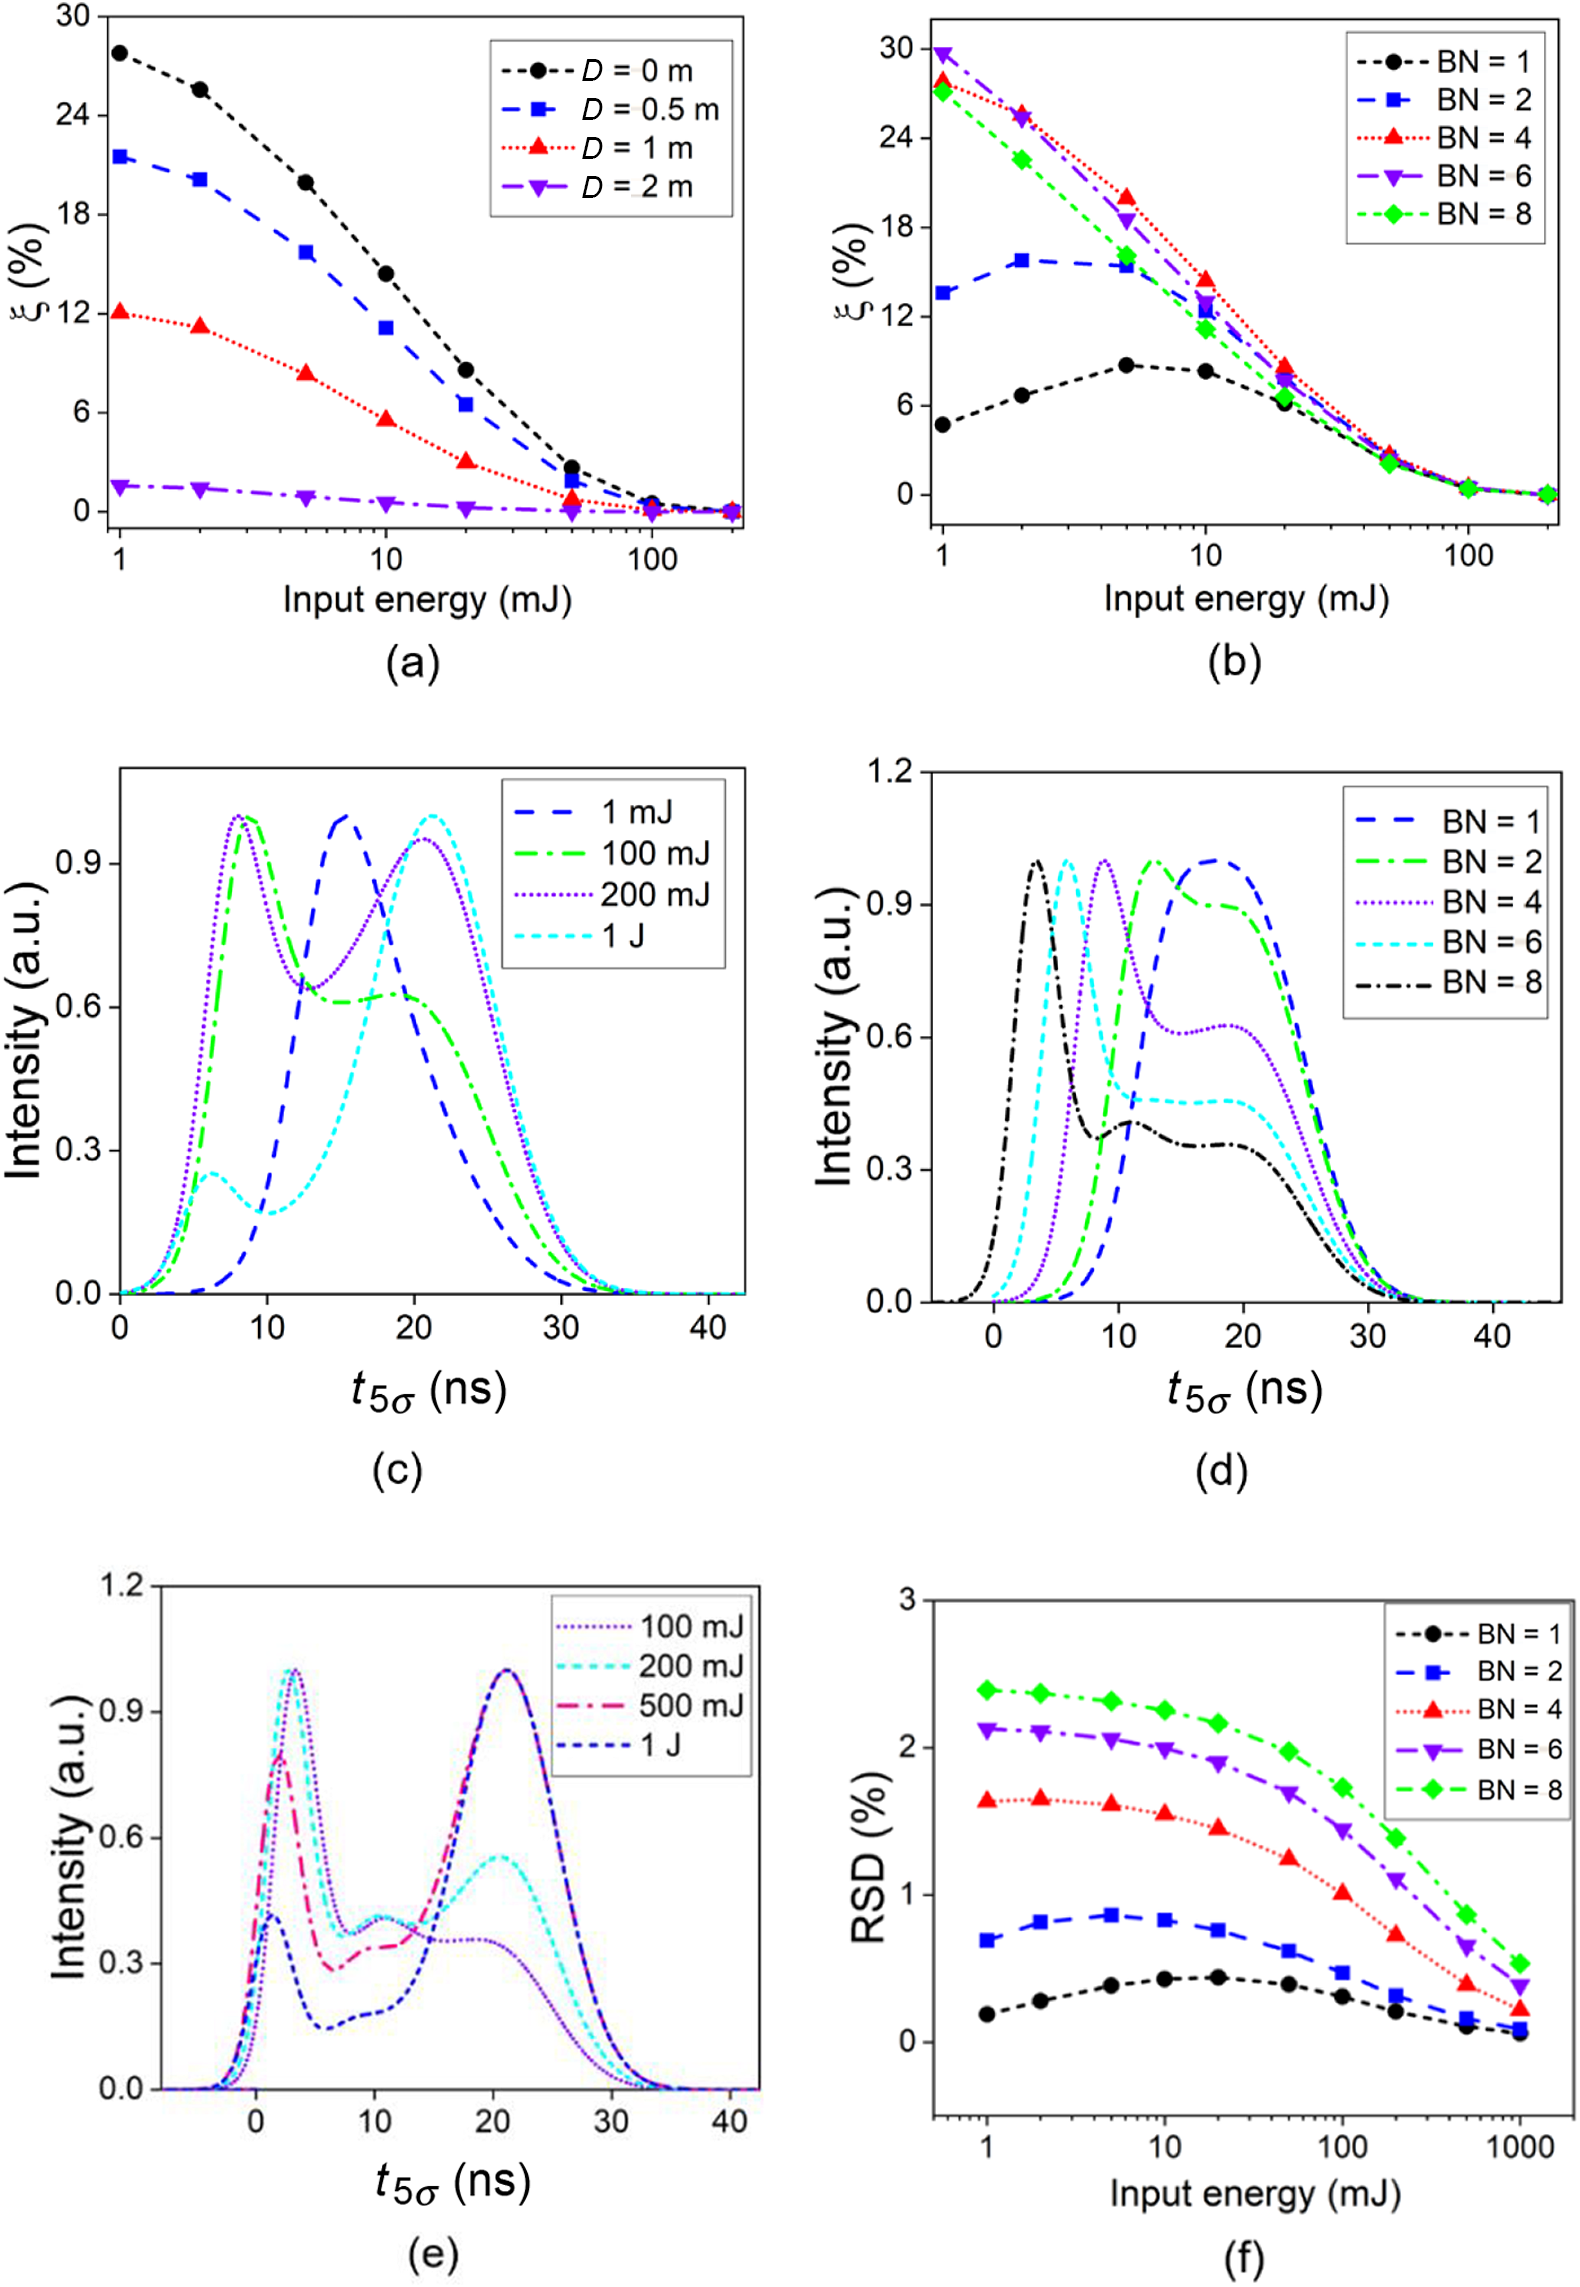
Influence of spatiotemporal overlap on the amplified zigzag output. (a) Energy-loss ratio versus D (BN = 4); (b) energy-loss ratio versus BN (D = 0 m); (c) pulse shape versus input energy (BN = 4); (d) pulse shape versus BN (input energy of 0.1 J); (e) pulse shape versus input energy (BN = 8); (f) RSD of intensity profile versus BN.
With the same input fluence, enlargement of f leads to an increased overlap region and thus a lower scaling factor, as Figure 18(b) depicts.
The influence of spatiotemporal overlap on the amplified zigzag output for H = H 0, is investigated in Figure 19, by adjusting D and the bounce number (BN) of the zigzag beam path inside the gain medium during a single passage. Figures 19(a) and 19(b) show that the energy-loss ratio due to spatiotemporal overlap in the zigzag geometry is quite sensitive to D and BN at low input, having a distinct reduction by 94.3% with 2 m enlargement of free-space traveling distance, and a reduction by 84.1% with five less bounces for a seeding of 1 mJ. For an input energy above 100 mJ, however, the energy-loss ratio remains below 0.6%, being robust against D and BN. For the pulse profile, the variation tendencies for pulse-shape distortion with boosting gain are similar to cases of an AM chain. Figure 19(c), where BN = 4, illustrates that the four representative pulse profiles of AM geometry shown in Figure 11 can also be obtained in zigzag geometry at the input energies of 1 mJ, 100 mJ, 200 mJ and 1 J, respectively. Specifically, with an extremely high overall gain, as shown in Figures 19(d) and 19(e) for BN = 8, there can be more than two peaks in the output pulse profile. Figure 19(f) shows the RSD of the transverse intensity distribution versus BN, which is maintained at the level of 0–2.5% and is much smaller than that of Figure 16(c), mainly due to the largely reduced beam size and thus rapidly increased input fluence.
4 Conclusions
In this paper, spatiotemporal characterization of laser pulse amplification in a double-pass active mirror amplifier has been investigated. For three types of overlap conditions (collinear two-pulse overlapping, non-collinear two-pulse overlapping and four-pulse overlapping), the instantaneous stored energy intensity and beam intensity at a certain moment and a certain location are described. In particular, spatiotemporal scaling under four-pulse overlapping condition at every single moment (identified by time of flight) is fully characterized for the first time, by mapping the temporal and spatial segments of beam to p-τ diagrams in the instantaneous gain windows for forward- and backward-propagating pulses at an arbitrary location within the active mirror. Furthermore, the significant impact of spatiotemporal overlaps on the amplified energy, pulse distortion and intensity profile is discussed in detail, for both active mirror and zigzag configurations. The validity of modeling based on the loop iteration method is well verified by the excellent agreement between the predicted results and the measured results obtained using a 10 J experimental setup. The comprehensive spatiotemporal model presented is crucial for our work of further scaling the energy of DAMAC, and also acts as a powerful tool for the general design and optimization of multi-pass pulsed laser amplifiers with active mirror, zigzag and other geometries.
Acknowledgements
The authors thank National Key Research and Development Program of China (No. 2017YFB0405100), National Natural Science Foundation of China (No. 61975087), and Beijing Young Talents Support Project (No. 2017000020124G044).


 Open access