

Type 2 diabetes is a major public health problem with increasing incidence rates( Reference Danaei, Finucane and Lu 1 ). Genetic predisposition has an indisputable role in the aetiology of type 2 diabetes and constitutes a non-modifiable risk factor for the individual. Dietary intake, on the other hand, can be modified and is a key element in the prevention of type 2 diabetes( Reference Ley, Hamdy, Mohan and Hu 2 ). Indeed, large randomised controlled trials have shown that lifestyle interventions, including dietary modification, can prevent the onset of type 2 diabetes( Reference Lindström, Peltonen and Eriksson 3 , 4 ). With a projected continuing increase in the incidence of type 2 diabetes in the coming years( 5 ), further solutions to combat this epidemic are warranted.
Low-fat dairy products are part of most dietary recommendations to adult populations( Reference Weaver 6 ). However, the role of dairy products in the prevention of type 2 diabetes is currently being debated and some argue that there is no evidence to support that whole-fat dairy products increase the risk of type 2 diabetes and other metabolic diseases( Reference Kratz, Baars and Guyenet 7 ). Further, a recent cohort study, using data from the Malmö Diet and Cancer cohort, found that whole-fat dairy products, not low-fat dairy products, were inversely associated with risk of type 2 diabetes( Reference Ericson, Hellstrand and Brunkwall 8 ).
Dietary modifications usually imply changing the dietary composition rather than the total energy intake. Thus, the vast majority of cohort studies that investigated the association between dairy products and type 2 diabetes adjusted for total energy intake. It follows that a higher intake of one food item implies a concomitantly lower intake of other foods. Specifying the substitution is important because the substituted foods may be neutral, harmful or beneficial in relation to type 2 diabetes. However, few cohort studies have specified the substitution. One of the cohort studies that did specify the food substitution found that replacing snacks with yogurt was associated with a lower risk of type 2 diabetes( Reference O’Connor, Lentjes and Luben 9 ). In another cohort study, using data from the PREvención con DIeta MEDiterránea study, no association with type 2 diabetes was found when biscuits and chocolate were replaced with low-fat milk, whereas an inverse association with type 2 diabetes was found when biscuits and chocolate were replaced with yogurt( Reference Díaz-López, Bulló and Martínez-González 10 ). Substitution of one type of dairy product for another may be more relevant, than, for example, substituting dairy products for snack foods. In this study, we investigated the associations for specified substitutions between different subgroups of dairy products and the risk of type 2 diabetes.
Methods
Study design and population
Data for this investigation were obtained from the Danish Diet, Cancer and Health cohort( Reference Tjønneland, Olsen and Boll 11 ). Subjects from the greater Copenhagen and Aarhus areas were recruited between December 1993 and May 1997. A total of 160 725 individuals (50 % women) were invited to participate in the cohort. The inclusion was based on three criteria: (1) born in Denmark, (2) aged between 50 and 64 years and (3) no diagnosis of cancer registered in the Danish Cancer Registry. In total, 57 053 participants (52 % women) were recruited and participated in a baseline examination at one of the two study centres.
Participants diagnosed with cancer who were not registered in the Danish Cancer Registry at the time of invitation because of processing delay were later excluded (n 569) as well as participants previously diagnosed with diabetes (n 1385). In addition, individuals with missing data in either exposure variables or covariates of relevance to this study were also excluded (n 822). The remaining 54 277 participants (53 % women) were included in this study. Fig. 1 outlines the flow of participants in this study. The present study will be able to detect a hazard ratio (HR) of 0·96 per daily serving of dairy product substituted with 90 % power and a two-sided significance level of 0·05, assuming that 40 % of the variance in the model is explained by other covariates( Reference Hsieh and Lavori 12 ). The protocol for the Diet, Cancer and Health cohort was approved by the regional ethical committees on human studies in Copenhagen and Aarhus and by the Danish Data Protection Agency. Written informed consent was obtained from all participants.
Flow chart of participants in the Danish Diet, Cancer and Health cohort and in the present study.

Exposure assessment
Dietary intake was assessed at baseline using a validated self-administered semi-quantitative 192-item FFQ designed for this study( Reference Overvad, Tjønneland and Haraldsdóttir 13 , Reference Tjønneland, Overvad and Haraldsdóttir 14 ). Participants were asked to report their average intake of foods during the past 12 months within twelve possible categories ranging from ‘never’ to ‘eight times or more per day’. The food items included in the FFQ were identified through a stepwise regression approach based on nutrients considered important for carcinogenesis( Reference Overvad, Tjønneland and Haraldsdóttir 13 ), and the FFQ was validated against two 7-d diet records taken 2 to 3 weeks apart( Reference Tjønneland, Overvad and Haraldsdóttir 14 ). At the baseline examination the FFQ was handed-in and the data were processed by optical scanning and checked for missing values by trained personnel. At this visit, subjects were asked to clarify any missing values or uncertainties. Dairy products were identified through four separate questions in the FFQ that addressed: beverages, including milk (four types), breakfast products (four types of yogurt products), cheese (five groupings including similar types of cheese) and type of fat on bread (open question). Food and nutrient intake in g/d and kJ/d for each participant was calculated in FoodCalc( Reference Lauritsen 15 ) based on sex-specific portion sizes and using the Danish national food tables( 16 ). In total, seven exposure groups of dairy products were constructed (Table 1). Buttermilk was investigated as a single product item because of its distinct production method and nutritional composition compared with other types of milk.
Types of dairy products

* Fat content of the product.
† Buttermilk was investigated as a single product item because of differences in production methods and nutritional composition compared with other types of milk.
Case ascertainment
The outcome for this study was type 2 diabetes. Diabetes cases were identified from the Danish National Diabetes Register( Reference Carstensen, Kristensen, Marcussen and Borch-Johnsen 17 ). For an individual to be registered in the National Diabetes Register one of the following criteria must be met: (a) registration in the Danish National Patient Registry with a diagnosis of diabetes, (b) registration of chiropody, as a diabetic patient, in the Danish National Health Service Register (c) five blood glucose measurements in a 1-year period in the Danish National Health Service Register, (d) two blood glucose measurements per year in five consecutive years in the Danish National Health Service Register, (e) purchase of prescribed oral anti-diabetes drugs, except women aged 20–39 years with a prescription for metformin alone, in the Danish National Prescription Registry or (f) purchase of prescribed insulin registered in the Danish National Prescription Registry( Reference Carstensen, Kristensen, Marcussen and Borch-Johnsen 17 ). The Danish National Diabetes Register has been validated against records from a subsample of patients’ general practitioners with a positive predictive value of 89 %( Reference Carstensen, Kristensen, Marcussen and Borch-Johnsen 17 ). The date of appearance in these records was used as the date of diagnosis, although this may not be the actual date of diagnosis. The register does not distinguish between cases of type 1 diabetes and type 2 diabetes. However, given the age of the participants, it is assumed that all incident cases are type 2 diabetes.
Covariates
Established risk factors of type 2 diabetes and potential dietary factors associated with the development of type 2 diabetes were identified through literature reviews. Information on education (years of education), smoking habits (never, former, amount tobacco/d), physical activity (hours/week spent on various physical activities) and history of hypertension and/or hypercholesterolaemia (yes, no, do not know) was obtained through a self-administered lifestyle questionnaire filled in at the baseline visit. In addition, at the baseline visit, a physical examination was conducted including anthropometric measurements (height, weight and waist circumference). BMI was calculated as weight divided by height squared. Information on alcohol consumption, total energy intake and intake of other foods was obtained from the FFQ.
Statistical methods
Analyses of the baseline characteristics were carried out separately among men and women and for the cohort and for the cases. Medians and 80 % central ranges for continuous variables and proportions for categorical variables of the baseline characteristics were calculated. Cox proportional hazards regression was used to estimate the HR and the 95 % CI of type 2 diabetes associated with substitutions of dairy products with age as the underlying time metric. The follow-up time was calculated as the difference between the date of the first visit to one of the two study centres and the date of a registered diagnosis of diabetes mellitus, death, emigration or 31 December 2011, whichever came first. The substitutions were modelled as servings/d which was 200 g/d for all types of dairy products except for cheese (20 g/d) and butter (6 g/d). In addition, we modelled the substitutions per 418 kJ/d (100 kcal/d). The substitution models included a total dairy product variable (servings/d or kJ/d (kcal/d)) and the specific dairy product subgroups (servings/d or kJ/d (kcal/d)) except for the dairy product subgroup to be substituted( Reference Würtz, Hansen and Tjønneland 18 ). Thus, the estimated HR for type 2 diabetes may be interpreted as the estimated difference in risk for a serving/d or 418 kJ/d (100 kcal/d) higher intake of a specified subgroup of dairy products in place of another specified subgroup of dairy products. The basic model (model 1a) included six of the seven dairy product subgroup variables (servings/d or kJ/d (kcal/d)), total dairy products (servings/d or kJ/d (kcal/d)), sex, age at inclusion (50–54, 54–59, 59–67 years) and total energy intake (excluding alcohol, kJ/d (kcal/d), continuous). Sex and age at inclusion were both entered into the model in the strata statement. Model 1b included the variables from model 1a and established risk factors: educational level (<8, 8–10, >10 years), alcohol abstinence (yes, no), alcohol intake (g/d, restricted cubic spline with three knots), smoking status (never, former, current <15 g tobacco/d, current 15–25 g tobacco/d, current >25 g tobacco/d), physical activity (<3·5 h/week, ≥3·5 h/week) and self-reported history of hypertension and/or hypercholesterolaemia (yes, no, do not know). Model 2 included all variables from model 1b and the dietary variables fruit and vegetables, red and processed meat, sugar-sweetened beverages, whole grains, fatty potatoes and coffee (all in g/d, continuous). Model 3 included the variables in model 2 and BMI (kg/m2, continuous) and waist circumference (cm, continuous). The proportional hazards assumption was examined using Schoenfeld residuals, including visualisation of scaled Schoenfeld residuals against time for all substitution models, and no appreciable violations were detected. Linearity of the exposure variables was investigated by plotting predicted values against Martingale residuals and was found to be appropriate. In addition, we restricted the follow-up time to the point in time at which 50 % of the cases had occurred (9 March 2005) in order to investigate associations for a shorter follow-up time. In sensitivity analyses, reverse causation was taken into account by excluding cases identified during the first 2 years of follow-up. Furthermore, participants who were registered with a diagnosis of CVD at baseline were identified and excluded and in a further analysis participants with hypertension, hypercholesterolaemia and/or individuals who were obese at baseline were excluded. The rationale was potential changes in dietary habits as a result of these conditions.
Because intake of dairy products has been associated with a healthy lifestyle, we investigated the underlying dietary patterns related to intake of low-fat milk, whole-fat milk, low-fat yogurt products, whole-fat yogurt products and cheese using radar charts. We chose, based on the available data, ten food groups related to type 2 diabetes. Dietary factors were median intake of low-fat milk, whole-fat milk, low-fat yogurt products, whole-fat yogurt products, cheese, butter, fruit and vegetables, red and processed meat, sugar-sweetened beverages, whole grains and fatty potatoes. Participants in the lowest and highest quintiles of dairy product subgroups were compared with the median of the entire cohort, using the entire cohort as denominator to calculate percentage differences. Food intake was depicted in the radar charts using g/d, and was energy-adjusted using the residual method( Reference Willett, Howe and Kushi 19 ). Non-consumers of the respective dairy products were not included.
Analyses were conducted using Stata 14.1 software (StataCorp) and HR where the 95 % CI did not include 1 were considered statistically significant.
Results
During a median follow-up of 15·3 years (5th and 95th percentile: 5 and 17 years), 7137 cases were identified. Baseline characteristics for the entire cohort and cases are shown in Table 2. Cases tended to have a higher BMI and a higher waist circumference and were more likely to be smokers, physically inactive and have a history of hypertension and/or hypercholesterolaemia compared with the entire cohort. Table 3 presents the intake of the different types of dairy products in servings/d and 418 kJ/d (100 kcal/d) for the entire cohort and cases. Cases tended to have a higher intake of low-fat milk and a lower intake of whole-fat yogurt products, cheese and butter compared with the entire cohort. No considerable differences between cohort and cases were observed for the remaining dairy products.
Baseline characteristics of cohort and cases within the Danish Diet, Cancer and Health cohort (Medians and 10th to 90th percentiles (p10–p90) or proportions)

* Among consumers, men: cohort, n 25 286; cases, n 6944; women: cohort, n 27 786; cases, n 3053.
Intake of dairy products in servings/d and kJ/d (kcal/d) in the Danish Diet, Cancer and Health cohort (Medians and 10th to 90th percentiles (p10–p90) or proportions)
* Servings are 200 g for all products except for cheese (20 g) and butter (6 g).
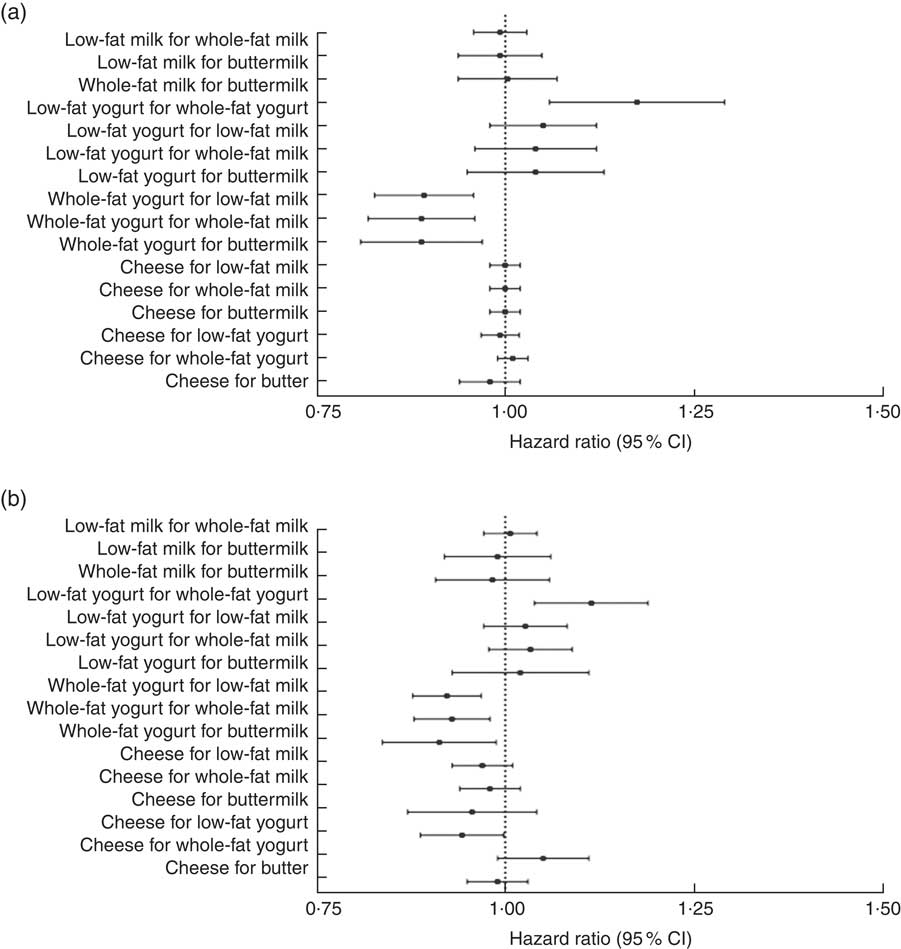
Fig. 2 and Table 4 show HR and 95 % CI for incident type 2 diabetes associated with substitution between dairy product subgroups in servings/d and 418 kJ/d (100 kcal/d). No associations between low-fat milk in place of whole-fat milk or buttermilk and the rate of type 2 diabetes were observed (Fig. 2(a)). Substitution of low-fat yogurt products in place of whole-fat yogurt products was associated with a higher rate of type 2 diabetes (HR 1·17; 95 % CI 1·06, 1·29) per serving/d substituted. Substitutions of whole-fat yogurt products in place of low-fat milk (HR 0·89; 95 % CI 0·83, 0·96), whole-fat milk (HR 0·89; 95 % CI 0·82, 0·96) or buttermilk (HR 0·89; 95 % CI 0·81, 0·97) were associated with a lower rate of type 2 diabetes per serving/d substituted (Fig. 2(a)). No associations with type 2 diabetes were observed when cheese substituted other dairy products (Fig. 2(a)). The same pattern of associations was observed when intake was expressed as kJ/d (kcal/d) and when men and women were analysed separately (online Supplementary Tables S1 and S2). Also, the same pattern of associations was observed after the analyses were restricted to the time when half of the cases had occurred (9 March 2005) (online Supplementary Table S3), when cases that occurred during the first 2 years of follow-up were excluded (online Supplementary Table S4) and when participants who were registered with a diagnosis of CVD at baseline were excluded (online Supplementary Table S5). When participants who at baseline were at high risk of developing type 2 diabetes were excluded, the positive association between low-fat yogurt products in place of whole-fat yogurt products became stronger and positive associations between low-fat yogurt products in place of low-fat milk, whole-fat milk and buttermilk were also observed (online Supplementary Table S6).
Forest plots of hazard ratios and 95 % CI for substitutions between dairy product subgroups (per serving/d (a); per 418 kJ/d (100 kcal/d) (b)) and risk of type 2 diabetes adjusted for sex (women, men; as strata), age at inclusion (50–54, 54–59, 59–67 years; as strata), total energy intake (kJ/d (kcal/d); continuous), education in years (<8, 8–10, >10 years), alcohol abstinence (yes, no), alcohol intake (g/d; continuous), smoking status (never, former, current <15 g tobacco/d, current 15–25 g tobacco/d, current >25 g tobacco/d), physical activity (<3·5 h/week, ≥3·5 h/week), history of hypertension and/or hypercholesterolaemia (yes, no, do not know), fruit and vegetables, red and processed meat, sugar-sweetened beverages, whole grains, fatty potatoes, coffee (all diet variables in g/d; continuous), BMI (kg/m2; continuous) and waist circumference (cm; continuous). Alcohol intake was entered into the models as a restricted cubic spline with three knots. All serving sizes (a) were per 200 g/d, except for cheese (20 g/d) and butter (6 g/d).
Type 2 diabetes associated with substitutions of serving/dFootnote * or kJ/d (kcal/d) of dairy products in the Danish Diet, Cancer, and Health cohort (Hazard ratios (HR) and 95 % confidence intervals)

* All serving sizes were 200 g/d except for cheese (20 g/d) and butter (6 g/d).
†Model 1a adjusted for sex (women, men; as strata), age at inclusion (50–54, 54–59, 59–67 years; as strata) and total energy intake (kJ/d (kcal/d); continuous); model 1b further adjusted for education in years (<8, 8–10, >10 years), alcohol abstinence (yes, no), alcohol intake (g/d; continuous), smoking status (never, former, current <15 g tobacco/d, current 15–25 g tobacco/d, current >25 g tobacco/d), physical activity (<3·5 h/week, ≥3·5 h/week) and history of hypertension and/or hypercholesterolaemia (yes, no, do not know); model 2 further adjusted for: fruit and vegetables, red and processed meat, sugar-sweetened beverages, whole grains, fatty potatoes and coffee (all in g/d; continuous); model 3 further adjusted for BMI (kg/m2; continuous) and waist circumference (cm; continuous). Alcohol intake was entered into the models as a restricted cubic spline with three knots.
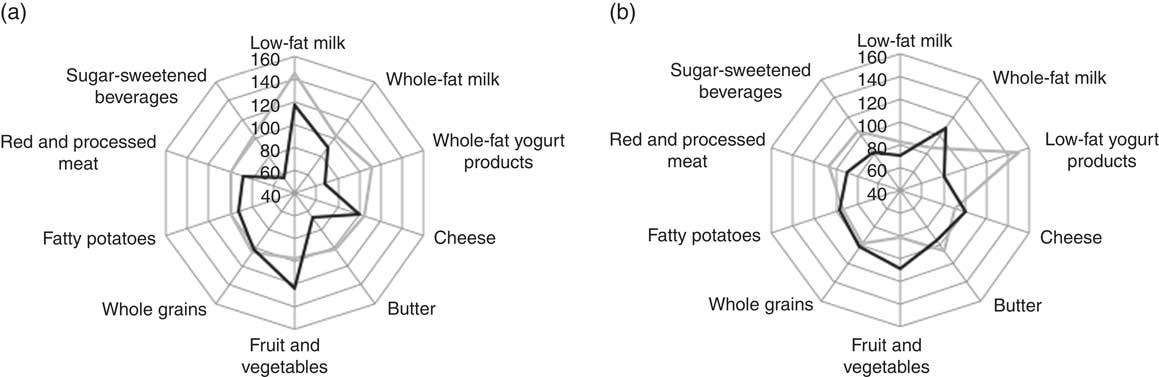
Fig. 3 shows the underlying dietary patterns, represented by ten food and beverage groups related to low and high intake of low-fat yogurt products and whole-fat yogurt products. Overall, dietary patterns differed between consumers with a low and high intake. Of note, participants with the highest intake of low-fat yogurt products had a lower intake of whole-fat milk, whole-fat yogurt products, butter, red and processed meat and sugar-sweetened beverages, and a higher intake of fruit and vegetables compared with the lowest intake group (Fig. 3(a)). In addition, high-consumers of low-fat yogurt products were more likely to have a history of hypertension and/or hypercholesterolaemia than low-consumers (data not shown). The dietary pattern among participants with the highest intake of whole-fat yogurt products was similar to those with the highest intake of low-fat yogurt products, except for a lower intake of low-fat milk and low-fat yogurt products (Fig. 3(b)). Radar charts for low-fat milk, whole-fat milk and cheese are depicted in the online Supplementary Fig. S1. The dietary patterns for subjects with the highest intake of low-fat and whole-fat milks seem to reflect an overall high dairy product intake but a preference for milk of a specific fat content. Participants with the highest intake of cheese were more likely to have a high intake of whole-fat yogurt products and having an overall diet similar to those with the highest intake of whole-fat yogurt products.
Radar charts of the percent-wise differences from the median in energy-adjusted food intake of ten food and beverage groups among individuals with the lowest (![]() ) and highest (
) and highest (![]() ) intake of low-fat yogurt products (a) and whole-fat yogurt products (b). Non-consumers of the respective dairy products were not included. 100 % is equivalent to the median of the entire cohort.
) intake of low-fat yogurt products (a) and whole-fat yogurt products (b). Non-consumers of the respective dairy products were not included. 100 % is equivalent to the median of the entire cohort.
Discussion
In this cohort study investigating substitutions of different types of dairy products in middle-aged Danish men and women, a lower rate of type 2 diabetes was observed when whole-fat yogurt products replaced low-fat yogurt products, low-fat milk, whole-fat milk and buttermilk. Thus, these findings suggest a potential role of substitution of whole-fat yogurt products for other subgroups of dairy products in the prevention of type 2 diabetes.
In essence, the substitution models compared individuals with the same total energy intake, but different intake of dairy product subgroups. Thus, participants with a higher intake of one dairy product and a lower intake of another dairy product were compared with participants with a concomitantly lower intake of the former dairy product and a higher intake of the latter. Because dairy products either have a beneficial, neutral or detrimental effect on the risk of type 2 diabetes, specifying the food substitution is important when the composition of the diet is being investigated. Dairy product subgroups were expressed in terms of 1 serving/d (200 g for all products except for cheese (20 g) and butter (6 g)) or 418 kJ/d (100 kcal/d). The choice of units has consequences for the interpretation of the results. Keeping energy intake constant while substituting foods with different energy content, as in the servings/d substitutions, entails an unspecified residual substitution of energy from other foods. In contrast, substitutions of foods equal in energy (i.e. substitutions in 418 kJ/d (100 kcal/d)) entail no residual substitution of energy from other foods, but the amounts of the foods may differ. In this study, the choice of units had little influence on the results, except for cheese which showed different patterns of associations depending on the unit. For cheese, the results from substitutions in kJ/d (kcal/d) may be more relevant than the results from substitution in servings/d as substitutions in servings/d differed both in amount and in energy. For milks and yogurt products, both approaches revealed a similar pattern of associations, but substitutions in servings/d translate directly into dietary guidelines and thus have greater relevance for public health recommendations.
The recruitment of participants to the Diet, Cancer and Health cohort was based on data from the Danish Civil Registration System, and broad inclusion criteria unrelated to type 2 diabetes were applied. Although the recruited participants had a higher socioeconomic status than non-participants( Reference Tjønneland, Olsen and Boll 11 ), the observed associations are believed to be fairly representative of all socioeconomic groups. In this study loss to follow-up included emigration. However, only 0·6 % of the participants emigrated during the follow-up. Therefore, selection bias is unlikely to have affected the results.
A validated FFQ was used to assess the usual dietary intake of the participants at baseline. Thus, some measurement errors are inherent. We aimed to estimate the association between long-term exposure to substitutions of dairy product subgroups and risk of type 2 diabetes. Thus, repeated measurement of diet would have strengthened the study. However, given that this was a middle-aged population, only small changes to the diet would be expected, as observed in another cohort study of middle-aged adults for whom repeated dietary measurements were available( Reference Maskarinec, Lim and Jacobs 20 ). The comprehensive information on intake of dairy products enabled us to distinguish between different types of dairy products based on characteristics such as fat content and fermentation status. An exception was the intake of cheese which may have different effects on the risk of type 2 diabetes according to, for example, fat content and ripening. Longer ripening time of cheddar cheese has been shown to reduce the amount of plasma non-esterified fatty acids and serum insulin compared with cheese with a shorter ripening time in a pig model( Reference Thorning, Bendsen and Jensen 21 ). Intake in some of the dairy product subgroups was low, especially that of whole-fat milk, low-fat yogurt products, whole-fat yogurt products and buttermilk. However, the variation of the intake of these dairy product subgroups was within the modelled range. For example, the 95th percentile of intake of low-fat and whole-fat yogurt products in both men and women was 1·00 and 1·04 servings/d, respectively. Cases of type 2 diabetes were obtained from the Danish National Diabetes Register, which used frequency of blood glucose measurements, not specific cut-offs, as one of several criteria. However, The Danish National Diabetes Register has been validated against records from a subsample of patients’ general practitioners with a positive predictive value of 89 %( Reference Carstensen, Kristensen, Marcussen and Borch-Johnsen 17 ). As the diagnosis of type 2 diabetes was established independently of the dietary information, information bias is unlikely to have affected the results.
Residual confounding cannot be excluded. The observed lower risk associated with substitution of whole-fat yogurt products for other types of milk products may be confounded by differences in underlying lifestyle and dietary patterns. However, after control for established risk factors of type 2 diabetes and dietary factors associated with development of type 2 diabetes, the pattern of associations was the same. Among participants with a high intake of low-fat yogurt products, the dietary pattern was similar to that of those with a high intake of whole-fat yogurt products, but they were more likely to have a history of hypertension and/or hypercholesterolaemia and thus more likely to have changed their dietary habits as a consequence of this. However, after excluding cases that occurred during the first 2 years of follow-up, participants who were registered with a diagnosis of CVD at baseline or participants with elevated risk of type 2 diabetes at baseline, we observed similar patterns of associations.
Most previous studies that investigated the association between intake of dairy products and type 2 diabetes did not specify the food substitution. However, three other studies have investigated substitutions of dairy products( Reference O’Connor, Lentjes and Luben 9 , Reference Díaz-López, Bulló and Martínez-González 10 , Reference Pan, Sun and Bernstein 22 ). O’Connor et al.( Reference O’Connor, Lentjes and Luben 9 ) found that replacing snacks with yogurt was associated with a lower rate of type 2 diabetes. Similarly, another cohort study found that replacing biscuits and chocolate or wholegrain biscuits and homemade pastries with yogurt lowered the rate of type 2 diabetes( Reference Díaz-López, Bulló and Martínez-González 10 ). Pan and colleagues found that replacing either red meat, excluding processed meat, or processed meat with low-fat dairy products lowered the rate of type 2 diabetes( Reference Pan, Sun and Bernstein 22 ). However, substituting one type of dairy product for another may be more feasible in a real-life setting. In line with results from a previous cohort study( Reference Ericson, Hellstrand and Brunkwall 8 ), we observed that whole-fat yogurt product intake was associated with a lower rate of type 2 diabetes, here replacing other dairy product subgroups. Thus, replacing non-fermented milk, buttermilk or low-fat yogurt products with whole-fat yogurt products was associated with a lower rate of type 2 diabetes.
Fermented dairy products contain probiotic bacteria and bioactive compounds that could help alleviate dysbiosis of the gut microbiome which has been associated with insulin resistance( Reference Pei, Martin, DiMarco and Bolling 23 , Reference Pedersen, Gudmundsdottir and Nielsen 24 ). Our results suggested that whole-fat yogurt products, not low-fat yogurt products, were associated with a lower rate of type 2 diabetes. Findings from cohort studies that investigated biomarkers of dairy fat (pentadecanoic acid, heptadecanoic acid and trans-palmitoleic acid) have shown inverse associations between plasma and erythrocyte concentrations of these fatty acids and risk of type 2 diabetes( Reference Forouhi, Koulman and Sharp 25 , Reference Yakoob, Shi and Willett 26 ), suggesting that intake of whole-fat dairy products may lower the risk of type 2 diabetes. Thus, it could be speculated that a synergistic effect exists between dairy fat and fermentation. However, more randomised controlled trials and cohort studies are needed to further evaluate whether any potential beneficial effects of whole-fat fermented dairy products exist on the risk of type 2 diabetes.
In conclusion, the findings from this large cohort study investigating the associations for specified substitutions between different subgroups of dairy products and rate of type 2 diabetes suggest that intake of whole-fat yogurt products in place of low-fat yogurt products, low-fat milk, whole-fat milk and buttermilk are associated with a lower rate of type 2 diabetes. However, more studies, as for example cohort studies or randomised controlled trials investigating different types of cheeses or different types of fermented milks are needed.
Acknowledgements
The authors thank the Danish Cancer Society and the staff at the Danish Diet, Cancer and Health study for the collection and administration of data.
This work is part of the project ‘Diet and prevention of ischaemic heart disease: a translational approach (DIPI, www.dipi.dk) which is supported by Innovation Fund Denmark (contract 0603-00488B). No funding was received for this study.
The authors’ contributions are as follows: D. B. I., A. S. D. L., L. L. and M. U. J. contributed to the study design; A. T. and K. O. collected the data; D. B. I. performed the statistical analyses; D. B. I., A. S. D. L., L. L. and M. U. J. were involved in the interpretation of the data; D. B. I. wrote the manuscript and had primary responsibility for the final content and the integrity of the work as a whole. All authors contributed to critical revisions and have read and approved the final version of the manuscript.
The authors declare that there are no conflicts of interest.
Supplementary material
For supplementary material/s referred to in this article, please visit https://doi.org/10.1017/S0007114517002896


