

Introduction
Women policy makers all over the world experience various forms of hostility, ranging from incivility to harassment, threats, and assault (Inter-Parliamentary Union 2018; Krook Reference Krook2020), and increasingly so over time (Collignon and Rüdig Reference Collignon and Rüdig2021; Håkansson Reference Håkansson2021). They experience more violence than comparable men according to several studies (Collignon and Rüdig Reference Collignon and Rüdig2020; Håkansson Reference Håkansson2021; Herrick et al. Reference Herrick, Thomas, Franklin, Godwin, Gnabasik and Schroedel2021; Mechkova and Wilson Reference Mechkova and Wilson2021; Rheault, Rayment, and Musulan Reference Rheault, Rayment and Musulan2019), and ordinary citizens are behind a majority of the violence experienced by women politicians in Western democracies (Bjørgo and Silkoset Reference Bjørgo and Silkoset2017; Collignon and Rüdig Reference Collignon and Rüdig2021; Håkansson Reference Håkansson2021; Herrick and Franklin Reference Herrick and Franklin2019; Thomas et al. Reference Thomas, Herrick, Franklin, Godwin, Gnabasik and Schroedel2019). The research field on gendered violence against politicians is dominated by studies carried out from the perspectives of politicians: focusing on how prevalent the problem is, who the most likely targets are, and what impacts these attacks have on ambition, for example. Previous research has demonstrated that powerful and visible women are at a heightened risk of violence compared to their male counterparts (Håkansson Reference Håkansson2021; Rheault, Rayment, and Musulan Reference Rheault, Rayment and Musulan2019) and that sexualized and gender-denigrating slurs overwhelmingly target women (Bjarnegård Reference Bjarnegård2021; Bjarnegård, Håkansson, and Zetterberg Reference Bjarnegård, Håkansson and Zetterberg2022; Erikson, Håkansson, and Josefsson Reference Erikson, Håkansson and Josefsson2021; Ward and McLoughlin Reference Ward and McLoughlin2020). Furthermore, previous studies have found depressed ambition (Herrick and Franklin Reference Herrick and Franklin2019) and disrupted campaign activities among women targeted by violence in politics (Collignon and Rüdig Reference Collignon and Rüdig2021). However, to increase understanding of the problem, more knowledge is needed about what makes perpetrators select women as targets of political violence.
The present study pushes the research agenda forward by investigating potential explanations for women politicians’ higher exposure to hostility from citizens. Understanding hostile citizen contacts is pertinent because of the high prevalence of this perpetrator category. This study focuses on a scenario in which a constituent is personally aggrieved by a political decision and contacts the mayor with a hostile email. Previous research has investigated the gendered forms of violence that women politicians uniquely experience, such as sexual threats and rumors about being a bad mother or sexually immoral (e.g., Bardall Reference Bardall2013; Krook Reference Krook2017; Krook and Restrepo Sanín Reference Krook and Sanín2016a). This study investigates possible gendered drivers of violence that is not gendered in its form: that is, violence that lacks gender-denigrating language and is connected to the target’s policy-making role rather than being purely hate based. This type of violence is rarely given attention in the literature on violence against women in politics or gendered political violence. Nevertheless, it likely constitutes a significant share of the hostility that women receive in their roles as politicians. Even though women experience far more hate-based attacks than men, this is not the only type of attack they experience (Krook and Restrepo Sanín 2020; Piscopo Reference Piscopo2016),Footnote 1 nor is it the only type of attack for which gendered drivers may be relevant (Bardall, Bjarnegård, and Piscopo Reference Bardall, Bjarnegård and Piscopo2020).
Women’s higher exposure to violence as politicians is often assumed to originate from sexist norms and biased attitudes toward women politicians (Krook and Sanín Reference Krook and Sanín2016a, Reference Krook and Sanín2020). Yet few studies have specifically investigated the drivers behind hostility directed at women in politics. To study biases that may influence gender patterns in hostile citizen contacts, I argue that it is not enough to consider directly hostile attitudes toward women politicians. Sexist attitudes sometimes manifest as outright hatred of women, and at other times such attitudes may have more subtle manifestations. The previous literature has not sufficiently accounted for the multiple ways that sexism can put women at risk of violence in politics. Based on theories on gender norms on women’s leadership and representation styles and theories on sexist attitudes, I develop two hypotheses on gendered drivers of hostile contacts from citizens to women politicians. These hypotheses are tested using a survey experiment disseminated in the United States (Study 1) and Sweden (Study 2). I first hypothesize that constituents have more lenient attitudes toward hostility directed at women representatives than men. Contrary to my expectations, I do not find support for this hypothesis. Women’s higher exposure to hostility from citizens does not seem to be driven by a generalized acceptance of such behavior among the general population. Second, I hypothesize and find that constituents prefer to direct their complaints to women representatives over men. The resulting higher number of angry contacts entails an inherent risk of more hostility directed at women. This driver of hostile citizen contacts with women politicians is novel in relation to the existing literature and deserves further attention. Findings were equal across the two contexts.
In addition to these theoretical and empirical contributions, the study makes a methodological contribution. It presents the first experiment designed to causally test possible drivers of gendered violence against politicians, and a method for operationalizing and testing gendered drivers of citizen hostility that plausibly may explain why women politicians are targeted with more of this kind of violence than men. The methods developed in the study can be used to test attitudes toward hostility against politicians in other contexts and among other groups of respondents.
The two contexts included in the study differ in key aspects, giving it high external validity. Constituencies of mayoral offices are smaller in Sweden than in the United States, and smaller constituencies have been found to increase political participation in a variety of forms (see, e.g., Gerring and Veenendaal Reference Gerring and Veenendaal2020). Furthermore, the two countries’ election systems differ and generate differing degrees of attention and accountability for individual mayors. U.S. mayors are highly visible, as they are (mostly) directly elected in majoritarian elections. Swedish mayors are selected by the proportionally elected ruling coalition and receive somewhat less attention. The two countries also have different histories of female political representation. Sweden has a higher share of women mayors and a longer history of high female representation in political offices overall than the United States. The consistency of the findings across these two contexts indicates that the results are not driven by particularities having to do with either Sweden or the United States.
Gender-Motivated Violence against Women Politicians
A growing body of research investigates how gender affects the risk of violence in politics. Resistance to women’s increased political participation and political power across the world is theorized to drive violence that targets women in politics as women (VAWIP) (Biroli Reference Biroli2018; Krook and Sanín Reference Krook and Sanín2016a). Moreover, scholars have proposed that women face more violence than men as politicians because of negative attitudes toward agentic women such as political leaders (Håkansson Reference Håkansson2021; Herrick et al. Reference Herrick, Thomas, Franklin, Godwin, Gnabasik and Schroedel2021; Rheault, Rayment, and Musulan Reference Rheault, Rayment and Musulan2019). Few studies have focused on investigating perpetrators’ biases specifically.
Testimonies from women about political violence against them include a large variety of perpetrators. Similar to men, political women in contexts marked by election violence experience violence from political rivals and their supporters in countries such as Colombia (Duque Salazar, Escalante, and Peña Reference Salazar, Diego, Escalante and Peña2022), Sri Lanka (Bjarnegård, Håkansson, and Zetterberg Reference Bjarnegård, Håkansson and Zetterberg2022), and Uganda (Schneider Reference Schneider, Bjarnegård and Zetterberg2023). Also similar to men, citizens account for a large share of the violence that women politicians experience in consolidated democracies (Bjørgo and Silkoset Reference Bjørgo and Silkoset2017; Collignon and Rüdig Reference Collignon and Rüdig2021; Håkansson Reference Håkansson2021). In addition to these “traditional” perpetrator categories, women in politics describe experiencing violence from powerful copartisans who oppose women challenging male political dominance, as well as family and community members who oppose women’s political participation (Bjarnegård, Håkansson, and Zetterberg Reference Bjarnegård, Håkansson and Zetterberg2022; Krook and Restrepo Sanín Reference Krook and Sanín2016b; Schneider Reference Schneider, Bjarnegård and Zetterberg2023). In some cases, influential actors such as high-profile politicians and journalists have led the way in perpetrating violence against women politicians, prompting citizens to follow suit (Krook and Sanín Reference Krook and Sanín2020).
Studying violence committed by all these different kinds of actors is a large undertaking. At the same time, certain categories of perpetrators have been shown to be more common than others. While U.S. senators (women and men) experience aggression or harassment from colleagues very rarely (Herrick, Thomas, and Bartholomy Reference Herrick, Thomas and Bartholomy2022), harassment from citizens is widespread among U.S. mayors (Herrick and Franklin Reference Herrick and Franklin2019; Thomas et al. Reference Thomas, Herrick, Franklin, Godwin, Gnabasik and Schroedel2019). Constituents are also identified as being behind the majority of attacks on women politicians in Sweden (Håkansson Reference Håkansson2021) and other comparable contexts such as the United Kingdom (Collignon and Rüdig Reference Collignon and Rüdig2021) and Norway (Bjørgo and Silkoset Reference Bjørgo and Silkoset2017). While the same drivers may not explain why all types of perpetrators select women as targets, I argue that it is important to understand what drives hostile citizen contacts in particular. It is violence from this type of actor that shapes women’s everyday experiences of being politicians in the two contexts of interest.Footnote 2 The study focuses on the multiple ways that sexism can influence citizen perpetrators’ selection of women as targets of hostility.
This study brings the research field on gender-motivated violence against politicians forward by further specifying how sexist drivers of citizen hostility can manifest. A method for detecting gender-motivated political violence proposed by Bardall, Bjarnegård, and Piscopo (Reference Bardall, Bjarnegård and Piscopo2020) is to analyze patterns of attacks. This can reveal, for instance, an exclusive or excessive targeting of women. However, the reason for the overwhelming targeting of women remains obscure even after such analysis. This study tries to fill that gap by specifying two sets of gender-biased attitudes that may explain why citizen perpetrators choose women as targets of violence.
Krook and Restrepo Sanín (2020) propose a bias incidents framework to identify cases of VAWIP. Through close scrutiny of individual episodes of violence, sexist motives can be discerned by revealing whether the perpetrator expressed or alluded to hatred of women. Most of their criteria relate to identifying directly hostile attitudes to women. As the authors note, perpetrators may not always be aware of their own gender biases (Krook and Restrepo Sanín 2020, 746), which complicates the task of establishing whether a violent incident was motivated by gender bias. One way of detecting gendered drivers of violence against women politicians in Krook and Restrepo Sanín’s framework is to analyze whether the victim was evaluated negatively according to a double standard. In line with this reasoning, this study aims to further concretize ways of detecting the existence of gendered double standards.
It is important to note that sexist attitudes do not always manifest as hatred of women. I broaden the scope compared to previous research and argue that double standards can relate to various attitudes toward and expectations of women politicians that put them at heightened risk of violence. Similar to Bardall, Bjarnegåard, and Piscopo’s framework, I propose analyzing patterns rather than individual episodes of violence. Comparing patterns in attacks on women and men can reveal bias that perpetrators may not even be aware of. Perpetrators may think that they are acting rationally and without bias. In contrast, a comparative analysis of attitudes toward attacks on women and men can reveal, for example, whether there is greater acceptance of violence used against women for ostensibly policy-related reasons—indicating a gendered double standard.
Attitudinal Drivers of Hostile Citizen Contacts against Women Politicians
Gendered attitudes toward women politicians seem to play a key role in explaining why women are targeted with violence more than men as politicians, whether those attitudes are directly hostile to women politicians (e.g., overt resistance to women’s political participation) or more subtle (e.g., evaluating women according to a double standard). In the case of hostile contacts from constituents, attitudes about the way women should exercise their political leadership and sexist attitudes toward women leaders are important theoretical drivers to consider.
The political psychology literature illustrates the complexity of sexism and the multiple ways that facets of sexism operate to shape attitudes toward, and treatment of, women politicians (e.g., Cassese and Holman Reference Cassese and Holman2019; Winter Reference Winter2022). Ambivalent sexism theory (Glick and Fiske Reference Glick and Fiske1996, Reference Glick, Fiske and Zanna2001) encompasses two sets of attitudes: hostile sexism (HS) and benevolent sexism (BS). HS denotes a view of gender relations in which women seek to control men and negative attitudes toward women who challenge the gender hierarchy (Glick et al. Reference Glick2000; Glick and Fiske Reference Glick and Fiske1996; Glick and Raberg Reference Glick, Raberg, Travis and White2018). BS is defined as (superficially) positive attitudes that see women as wonderful and caring, but also weak and in need of men’s protection (Glick and Fiske Reference Glick and Fiske1996; Glick and Raberg Reference Glick, Raberg, Travis and White2018). These attitudes may appear contradictory, but research demonstrates that they are highly correlated. Across countries, for both women and men, endorsing HS is positively correlated with endorsing BS, and highly sexist nations at the country level are high in both HS and BS (Glick et al. Reference Glick2000).
Although HS and BS are distinct, they are both components of sexism and complement each other (Glick and Raberg Reference Glick, Raberg, Travis and White2018). Psychologically, these attitudes are consistent rather than conflicting, and it is common to be an “ambivalent sexist”—that is, endorsing both (Glick et al. Reference Glick2000; Glick and Fiske Reference Glick and Fiske1996). Ambivalent sexists divide women into “good” and “bad” types. Women who conform to expectations of their roles as carers and nurturers are adored, whereas women who fail to meet these expectations and frustrate men’s feelings of power and control are strongly disliked (Glick and Raberg Reference Glick, Raberg, Travis and White2018). Similarly, Manne (Reference Manne2017, 51) posits that misogynists do not hate women universally. While they may love their mothers, wives, and secretaries, they hate “unbecoming women”—women who enter positions of power and authority over men and opt out of male-oriented service roles.
In the following sections, I develop hypotheses on how gendered attitudes can put women politicians at higher risk of hostile citizen contacts than men. The hypotheses are based on scholarship on attitudes about how women should act as political representatives and different aspects of sexism.
Hostility Lenience: Hostility Seen as More Justified against Women Politicians
One reason to expect more hostile constituent contacts targeting female political leaders is, to put it harshly, that they are more disliked than their male counterparts. Role congruity theory explains that, contrary to men, women are punished and face backlash when they demonstrate qualities typical of agentic leadership (Brescoll, Okimoto, and Vial Reference Brescoll, Okimoto and Vial2018; Eagly and Karau Reference Eagly and Karau2002; Okimoto and Brescoll Reference Okimoto and Brescoll2010; Rudman et al. Reference Rudman, Moss-Racusin, Phelan and Nauts2012). People prefer women to exercise leadership in a communal way: being inclusive, nondominant, and non-power-seeking and instead serving in the interest of some greater good (Brescoll, Okimoto, and Vial Reference Brescoll, Okimoto and Vial2018). However, political leadership, particularly in executive roles such as mayoral offices, requires agentic qualities such as individual leadership, assertiveness, and executive decision-making. In addition to being incongruent with their gender role, agentic women are incongruent with their gender’s hierarchical status (Rudman et al. Reference Rudman, Moss-Racusin, Phelan and Nauts2012). Women political leaders’ incongruity with their stereotypical gender role and place in the gender hierarchy leads people to dislike women political leaders. Further implications include that women are judged more harshly for making mistakes as politicians (Reyes-Housholder Reference Reyes-Housholder2020; van Acker Reference van Acker2003), and it takes less to elicit negative emotions toward female than male politicians (Brescoll Reference Brescoll2016; Brescoll, Okimoto, and Vial Reference Brescoll, Okimoto and Vial2018). In the context of an unpopular political decision, we can hence expect that citizens will see violent reactions as more justified if the decision they object to is spearheaded by an agentic woman than an agentic man (e.g., a woman versus a man political leader).
Sexist attitudes may affect attitudes to hostility against women politicians in different ways. Under HS, hostile consequences are seen as justified against norm-deviant women, such as women in positions of power and authority over men (Glick and Raberg Reference Glick, Raberg, Travis and White2018; Manne Reference Manne2017). BS, on the other hand, emphasizes men’s responsibility to protect women (Glick and Fiske Reference Glick and Fiske1996). This would imply that hostility targeting women would be seen as less justified than the same targeting men. Depending on whether a target is sorted into the category of “good women” who deserve men’s protection, or “bad women” who challenge men’s power in society, different reactions to hostility can be expected.
Women political leaders, such as mayors, violate gender norms by occupying a position of leadership over men. VAWIP theory suggests that women will be at a unique risk of violence in politics because of the threat they constitute to men’s political dominance (Krook and Restrepo Sanín Reference Krook and Sanín2016b). Women politicians who occupy higher leadership positions, are more visible on social media, and are outspoken feminists report experiencing more violence than others (Biroli Reference Biroli2018; Håkansson Reference Håkansson2021; Rheault, Rayment, and Musulan Reference Rheault, Rayment and Musulan2019). Consequently, I hypothesize that attitudes toward hostility against women political leaders will be more lenient than against men counterparts. This hypothesis suggests that there will be a higher likelihood that contacts will be hostile if the recipient is a female than a male politician.
I conceptualize lenient attitudes in three ways. The first two reflect language commonly used to make moral evaluations of dubious behaviors (e.g., “It is understandable, although not acceptable, that they did this”): understanding and accepting hostility.Footnote 3 The third captures the level of sanction considered appropriate for an act of hostility. Attitudes toward appropriate sanctions are intimately connected to attitudes regarding the severity of an act (Gracia, García, and Lila Reference Gracia, García and Lila2014). Hence, accepting and understanding hostile behavior and considering lenient sanctions appropriate indicate lenient attitudes toward hostility.
H1: Constituents have more lenient attitudes toward hostility directed at female politicians than at male politicians.Footnote 4
Contact Preferences: Women as Preferred Targets of Complaints
The previous section outlined an argument in which a more hostile character of communication is tolerated against women than men in politics. Alternatively, the amount of hostility that politicians face from citizens could be a product of the amount of complaints they receive. Citizens’ propensity to contact politicians with complaints increases if they feel that representatives care about citizens’ voices (Grossman, Michelitch, and Santamaria Reference Grossman, Michelitch and Santamaria2017). I argue that representatives’ gender can affect citizens’ propensity to direct complaints to politicians. Because of gender role expectations, people might expect women to care more about citizens’ problems and views, prioritize relationships, and be more approachable and available. Not all complaints to politicians are hostile, but receiving a higher number of complaints from constituents increases the risk of receiving hostile complaints.
Norms on how women politicians should exercise leadership, as well as sexist norms on women’s gender roles, provide a theoretical foundation for the expectation that women politicians will receive a higher number of complaints from constituents. Role congruity theory demonstrates that women are expected to lead in communal, nurturing, and inclusive ways (Brescoll, Okimoto, and Vial Reference Brescoll, Okimoto and Vial2018; Eagly and Karau Reference Eagly and Karau2002). This would entail more availability to constituents and openness to their views. Similarly, BS confines women to the role of warm and caring nurturers (Glick and Raberg Reference Glick, Raberg, Travis and White2018). Hostility against women politicians is seldom phrased in positive words, but often resonates with benevolent sexism’s characterization of women as weak and best suited to caring roles. Women politicians frequently describe experiencing gender-denigrating harassment that diminishes their political competence while emphasizing their appearance and roles as mothers, wives, and sexual partners (Bardall Reference Bardall2013; Erikson, Håkansson, and Josefsson Reference Erikson, Håkansson and Josefsson2021; Krook and Sanín Reference Krook and Sanín2016a; Kuperberg Reference Kuperberg2021).
The emphasis on women politicians’ roles as nurturers implies that they should welcome citizens’ complaints. Expectations on women’s nurturing and caring traits and representation styles possibly explain citizens’ propensity to direct more issue requests to women representatives than men (Butler, Naurin, and Öhberg Reference Butler, Naurin and Öhberg2022) and the higher standard of substantive representation to which women representatives are held (Kaslovsky and Rogowski Reference Kaslovsky and Rogowski2021).Footnote 5 Women’s stereotypically nurturing leadership style leads citizens to expect a distinct form of representation from women politicians: one that emphasizes citizens’ inclusion in decision-making and care for citizens’ perspectives. A negative consequence of these attitudes is that when citizens are aggrieved, we can expect that they will be more likely to direct their complaints to women representatives than men.Footnote 6 In situations in which citizens are angry about politics, they may feel more entitled to voice that anger to women politicians. Harboring others’ feelings and taking responsibility for others’ emotional well-being is part of women’s role in the patriarchal system (Manne Reference Manne2017), which should make citizens feel more entitled to complain about political decisions to women politicians than men. Hostile attitudes toward women, such as negative perceptions of their competence for political leadership (Ditonto Reference Ditonto2017; Schneider and Bos Reference Schneider and Bos2014), may also lead citizens to direct more complaints to women than men. Moreover, constituents may expect women to be more prone to back down in response to pressure (Bjarnegård Reference Bjarnegård2018).
In short, based on sexist attitudes and communal leadership norms for women, we can expect that citizens prefer to direct their complaints to women. H 1 proposes that complaints directed at women are more likely to be of a hostile nature. However, even if each complaint has a constant likelihood of being hostile, a higher number of complaints alone implies more hostility.Footnote 7 I conceptualize constituents’ gendered contact preferences as a tendency to select women when deciding which representative to contact in the context of aggrievement.
H2: Constituents prefer to contact female over male politicians.
Data, Variables, and Methods
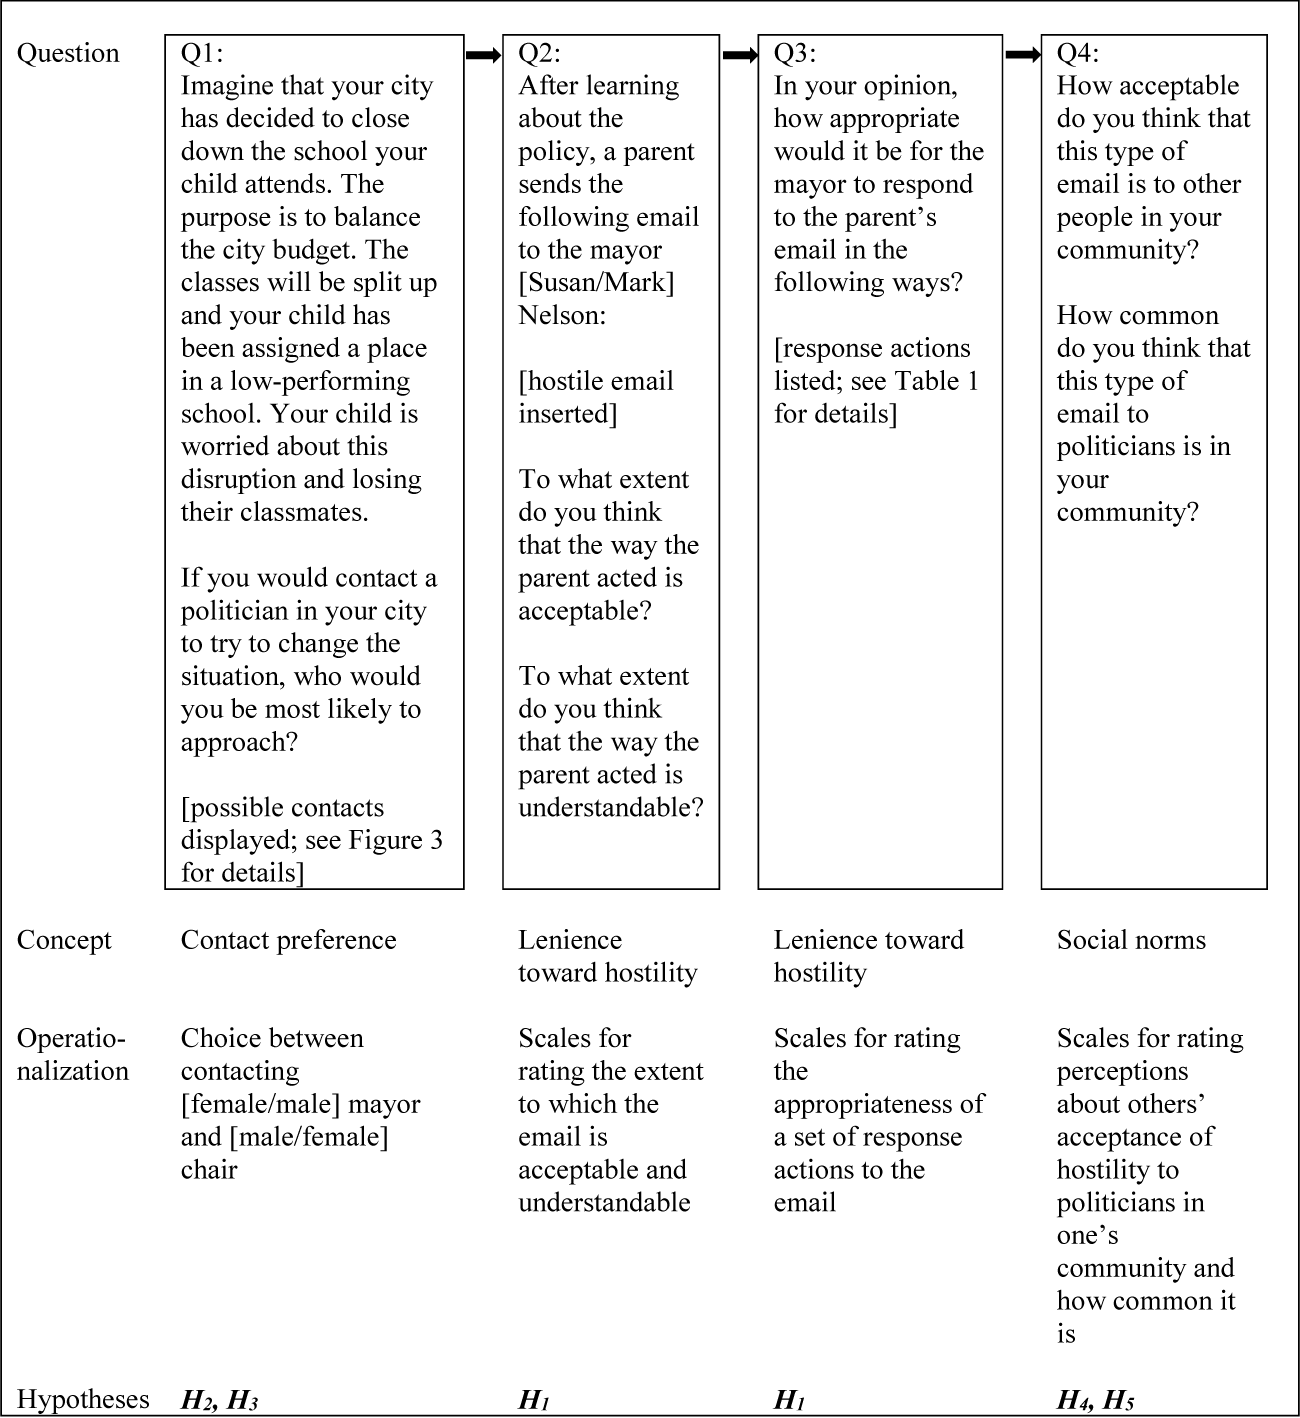
To evaluate the causal effect of these potential explanations, I use experimental methods. I designed a survey experiment portraying a hypothetical situation. Respondents were asked to imagine that their child was assigned to a low-performing school. First, they were asked which politician, either the mayor or the chair of the school board, they would be most likely to contact if they would try to change the situation. As a robustness check, some respondents were assigned to a version of the vignette portraying a building policy instead of the school policy. Next, they were presented with a hostile email sent to the mayor by another parent (/resident) who was similarly badly affected by the school (/building) policy. Respondents reported the extent to which they found the hostile email to be understandable and acceptable, and what level of sanction should be applied against the email sender. Additional questions asked how common and acceptable to others respondents thought such emails were (see Figure 1).
Survey flow and the hypotheses’ operationalizations. The example is from survey version 1. See Table A3 in the Supplementary Materials for an outline of all survey versions.
The study’s experimental design entailed that respondents were randomized into groups viewing one out of two versions of the vignette. In one version (the treatment condition), the mayor is a woman and the chair is a man, and in the other (the control condition), their roles are switched. Social desirability bias would likely affect respondents’ answers to direct questions about whether they would rather contact women or men representatives when aggrieved, or whether they think hostility directed at women or men representatives is more acceptable. As a result of the between-subjects design, each respondent saw only one version of the vignette and did not have to report e.g. the extent to which hostility is acceptable against women relative to men. They simply answered who they would rather contact out of a choice between a man mayor and a woman school board chair if this is the survey version they were randomized into. If they were randomized into the other survey version, they answered who they would rather contact out of a choice between a woman mayor and a man chair. Likewise, they only rated the acceptability of hostility directed at the mayor that figured in their vignette (either a man or a woman, depending on which survey version they received).
Since respondents were randomly assigned to one out of the two survey versions, the mix of respondents assigned to either version will be equal on average (see, e.g., Gerber and Green Reference Gerber and Green2012). This eliminates, for example, the risk that a group of respondents holding more feminist attitudes will be assigned to the survey version featuring a woman mayor. Given effectively executed randomization (and large enough samples), respondents with different political attitudes will be equally distributed across survey versions. An advantage of experimental designs compared to observational data studies is that randomization eliminates all possible factors that might bias the relationship between the independent and dependent variables; observable as well as unobservable factors. Furthermore, factors that differ between representatives in real-world settings are also eliminated. The same information about the imaginary mayor was provided in both survey versions, other than the mayor’s sex. Differences in the propensity for respondents to direct their complaints to the mayor, or to rate hostility against the mayor as more acceptable, in one survey version than the other are consequently attributable to gender, since this is the only thing that was varied between the survey versions. Lastly, presenting the information in the form of a story, rather than as isolated questions, has an additional advantage. Previous research has demonstrated that people process information better when it is presented in the form of a story (see, e.g., Berinsky and Kinder Reference Berinsky and Kinder2006). This increases the likelihood that respondents will engage with the scenario and provide thought-through answers.
A shortcoming of survey experiments such as this one is that they record people’s attitudes and hypothetical behavior rather than their actual behavior. However, vignette experiments have been shown to effectively capture actual behavior (Hainmueller, Hangartner, and Yamamoto Reference Hainmueller, Hangartner and Yamamoto2015). The advantages of hypothetical scenarios outlined earlier—that is, the possibility for causal inference that a survey experiment provides—arguably outweigh the shortcomings in this case.
The experiment, preregistered on EGAP/OSF,Footnote 8 was fielded in June 2019 using the survey company Lucid in the United States and in September 2020 through the academically managed survey institute LORE in Sweden. Lucid has a comparatively high external validity and is often recommended as a survey platform since it has been found to score closer to demographic characteristics and political variables of the probability sample of the American National Election Studies than other platforms such as MTurk (Coppock and McClellan Reference Coppock and McClellan2019). LORE provides high-quality data as an academically managed survey institute, but the sample I rely on has an overrepresentation of respondents who are highly interested in politics. This risks biasing the results in terms of the propensity to contact politicians at all. However, there is no built-in propensity that the respondents should be biased in terms of directing contacts to women over men. Neither is there any reason to believe this skewedness of the data will give a biased estimate of acceptance for hostility directed at women relative to men politicians. The survey questionnaires are found in Appendix I in the Supplementary Materials and summarized in Figure 1. A total of 3,765 responses were obtained in the United States and 3,761 in Sweden. Sample demographics are available in Tables A1 and A2, demonstrating that observable demographic traits were balanced across treatment conditions.
While previous research has demonstrated that politicians perceive ordinary citizens as accounting for a majority of violence against them, most citizens are not perpetrators. To my knowledge, there are no previous studies examining which citizens are most likely to perpetrate hostility against politicians. Hence, this study casts a wide net and investigates citizens in general. As a result, I am able to collect descriptive statistics on factors correlated with holding more lenient attitudes toward hostility against politicians. This brings us one step closer to identifying the subgroup of citizens prone to harass politicians. At the same time, investigating citizens in general can illuminate enabling structures in society. Perpetrators are more likely to act when their behavior aligns with wider held attitudes in society (more on this in Appendix III).
Vignette Design
The survey consists of four questions (see Figure 1). Figure 1 also outlines how theoretical concepts and hypotheses are measured in the survey. The hypothetical scenario in which a school is closed down in the respondent’s municipality and the respondent’s child is reassigned to a low-performing school is valid in both Sweden and the United States. Even though parents can exercise free school choice in most places in both countries, there are no guarantees that they will get their top choice (Whitehurst Reference Whitehurst2016). School placements are organized in different ways across U.S. states, but there is typically a school board at the district level. Most Swedish municipalities have a committee on education. The chair is referred to as the “school board chair” in the U.S. survey and as the “chair of the education committee” in the Swedish survey.
To make the hostile email scenario realistic and help participants imagine the situation, the illustration is made to look like an actual email, as illustrated in Figure 2. A threat via email is one of the most common forms of abuse against politicians, second only to attacks on social media (Håkansson Reference Håkansson2021). In addition, abuse via email can target any politician, as opposed to social media, which requires actively choosing to have an account. Fewer than half the mayors of the 250 largest U.S. cities have active Twitter accounts (Development Counsellors International 2016). In contrast, emailing is a central tool in the work of most political representatives. The feigned email was formulated based on examples of actual emails sent to politicians, as described by politicians themselves or security personnel at parliamentary organizations.Footnote 9 According to these actors, it is common that constituents use their real names and email addresses even in very hostile communication sent to representatives. Furthermore, reactions to specific decisions, particularly those that affect the constituent on a personal level, are common triggers of hostility according to both women and men politicians (Frenzel Reference Frenzel2019; James et al. Reference James, Farnham, Sukhwal, Jones, Carlisle and Henley2016). According to security personnel, most abusers are one-time offenders who act when they are personally affected. School placements are described as a typical trigger. It is also common for citizens to direct complaints and hostility at a politician who may not be responsible for the particular issue in question (e.g., complaining about school placements to a mayor even if that issue is handled by another office).
Hostile email. The example represents the treatment condition. Under the control condition, the recipient’s first name is Mark.
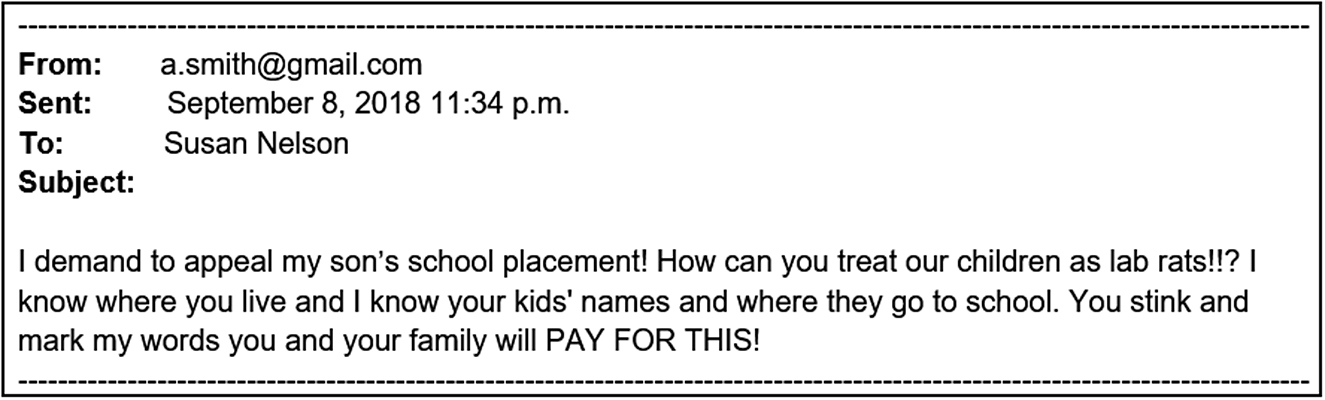
So as not to prime respondents to think about gender bias, the email does not contain gendered language. This makes it a less severe form of violence than hate-based attacks that target politicians’ social identities such as their sex or race (Chen et al. Reference Chen, Pain, Cheng, Mekelburg, Springer and Troger2020; Kuperberg Reference Kuperberg2021; Oz, Zheng, and Chen Reference Oz, Zheng and Chen2018; Ward and McLoughlin Reference Ward and McLoughlin2020). Still, the email contains severe hostility as it involves the politician’s family members, which is something politicians unanimously describe as the worst kind of hostility. Hence, the hostility presented in the vignette corresponds to a common yet rather severe scenario.
Robustness Checks
The Swedish survey used several versions as robustness checks (see Table A3). One version (2A) replicates Study 1, with minor adjustments (described in Appendix IV). One version contains a less overtly hostile email (2B), to investigate whether the degree of hostility makes respondents rate the email as more or less acceptable when directed at women relative to men. To control for the fact that education is a female-coded policy area, another version (2C) presents an alternative male-coded policy scenario (see more on the choice of policy area in Appendix IV). Here, the municipality has decided to build a high-rise apartment building in a green area close to the respondent’s residence, which decreases the value of properties in the area (see Appendix I). None of these alternative designs gave results that differed in any meaningful way from the main results.
Operationalizations of Theoretical Concepts and Hypotheses
Gendered contact preferences
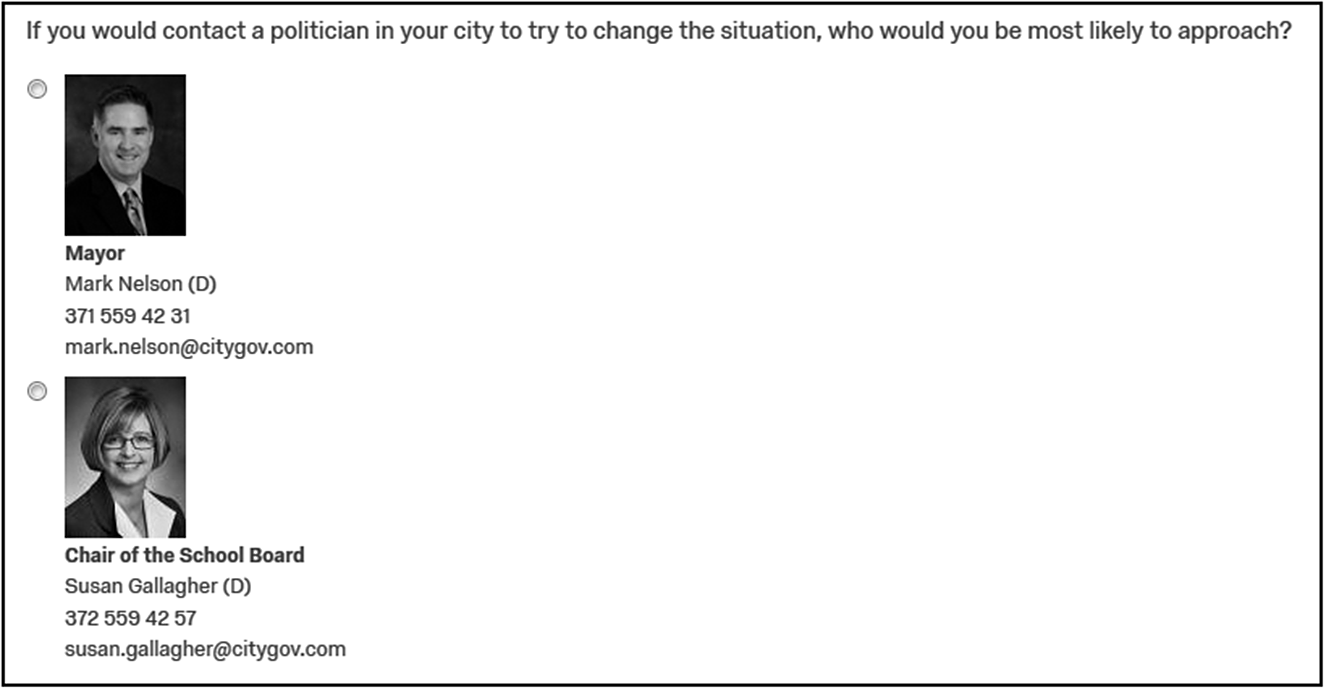
When asked which politician they would be most likely to approach, two politicians are listed as possible contacts: the mayor and the chair of the school board/planning committee. Under the treatment condition, the mayor is female and the chair is male, and vice versa under the control condition. The politician’s gender is signaled by their name (more on this in Appendix IV). The American survey also includes images of the feigned politicians to make sure that the treatment of mayor gender is effectively achieved. I used extensively pre-tested images from Clayton, O’Brien, and Piscopo (Reference Clayton, O’Brien and Piscopo2019). The Swedish version instead contains a control question on the gender of the mayor at the end of the survey.Footnote 10 The study is limited to studying gendered drivers of violence against women and men of the dominant ethnic group. Names were selected to signal this identity, and images used in the United States survey portray white women and men.Footnote 11 I added feigned email addresses and telephone numbers and highlighted the politicians’ formal roles to make it look like a typical city web page and try to avoid giving away that the politician’s gender constitutes the topic of the experiment (see Figure 3).Footnote 12 For H 2 to be supported, respondents should be more likely to select the mayor under the treatment condition and the chair under the control condition. This would indicate a gendered double standard in which constituents prefer directing complaints to women over men representatives regardless of their formal roles.
Vignette portrayal of politicians. Example print screen excerpt of Q1 under the control condition, figuring two of the randomized pictures in the U.S. survey.
Gendered hostility lenience
Lenience toward hostility against politicians is first measured by respondents rating how “acceptable” and “understandable” they find the email on two separate scales. Unbundling the concept of lenience toward problematic behavior into accepting and understanding it allows respondents to condemn it (by stating that it is unacceptable) while still providing a nuanced judgment toward it (by stating that it is understandable to some degree). The ordering of the two scales should allow respondents to first give the socially desirable answer that precludes hostility from being acceptable, which should then make it easier to admit to understanding the hostility to some extent. More variation is expected in the understandable than the acceptable scale. The third operationalization of lenience toward hostility, sanctions, comes in the subsequent question, in which respondents rate how appropriate six response actions to the email would be (listed in Table 1). Two options do not contain any sanctions: apologizing for the school/building policy and answering in a constructive tone. The rest include sanctions.
Response actions
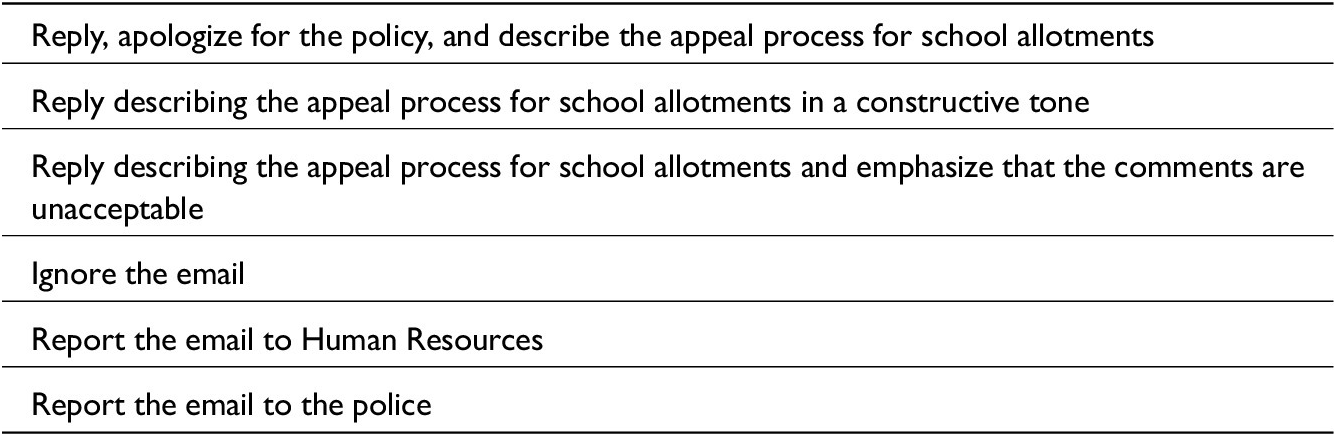
Notes: Survey item: “In your opinion, how appropriate would it be for the mayor to respond to the parent’s email in the following ways?” Respondents rated the level of appropriateness of each response action.
For H 1 to be supported, the means for the two scales for understanding and accepting the email should be higher under the treatment condition than under the control condition. This would indicate a gendered double standard in which hostility is seen as more justified in complaints to women than men representatives. Response items including sanctions should also be considered less appropriate, and those including no sanctions more appropriate, under the treatment condition to support H 1 . Summing up the response actions in one index of sanctions, the mean level of sanction should be lower under the treatment condition than under the control condition to support H 1 .
Descriptive Statistics
Descriptive statistics on the three components of lenient attitudes toward hostility (see Figure 5) show that there is variation in all three, but, as expected, there is more variation in the understandable scale than the acceptable scale. While a majority of respondents selected “completely unacceptable” in both countries and only a small percentage of respondents placed themselves toward the “completely acceptable” end of the scale, respondents are more diversely distributed across the understandable scale. In fact, 40% to 50% in both contexts place themselves between 3 and 5, where 5 indicates “completely understandable.” Similarly, although the response actions including sanctions are considered somewhat or very appropriate by over half the respondents in the United States, the response actions without sanctions are considered most appropriate. In Sweden, sanctions are considered somewhat more appropriate, but answering in a constructive tone (i.e., no sanction) is by far seen as the most appropriate response. Taken together, this indicates that there are lenient attitudes toward treating politicians with hostility at a rate that warrants consideration.Footnote 13
Further, as can be expected, attitudes are less lenient toward the email version with more overt hostility (see Table A8). This tells us something about the degree of hostility politicians are expected to put up with. Compared to an email that mentions the politician’s home and their children’s school and states that the politician and their family will have to pay, an email that accuses the politician of shameful behavior and states that the politician will have to pay is considered substantially more acceptable and understandable and less deserving of sanctions.
Characteristics Associated with Lenient Attitudes
Before investigating the hypotheses, it is informative to note that attitudes toward hostility vary across demographic and political characteristics. The same characteristics are associated with accepting hostility against women and men politicians. I present a description of associations between demographic characteristics and accepting hostility against politicians in the upper pane of Figure 4, utilizing the variables that are available in the two respective data sets. In both the American and the Swedish context, men are far more accepting of hostility than women. This aligns with the findings of Armaly and Enders (Reference Armaly and Enders2022), whose main focus is the psychological drivers of acceptance of political violence—that men accept political violence as a way for Americans to express disagreement with the government to a much greater extent than women. Furthermore, those with the lowest level of education, and highest in the United States, are more accepting of hostility than those in the middle. In the U.S. study, the youngest respondents are more accepting of hostility than the older, but this pattern is not as uniform in the Swedish study. Male sex, young age, and low education are emphasized in the literature on participation in violent protest (e.g., Van Aelst and Walgrave Reference Van Aelst and Walgrave2001). Furthermore, this literature finds that economic deprivation and poverty predict participation in political violence. The pattern in this respect is less clear, with positive but not statistically significant estimates for low income compared to the middle in both studies, and a strong positive estimate for high income in the United States. In terms of respondents’ family structure, singles appear to be more accepting of hostility than those who are married or divorced, but no clear pattern appears in relation to having children.
Hostility acceptance across characteristics. Acceptance of hostility is measured on a scale from 1, “completely unacceptable,” to 5, “completely acceptable” (1 standard deviation = 1.29 in the U.S. data and 1.49 in the Swedish data). Coefficients from bivariate regressions. All survey versions included from the Swedish study.
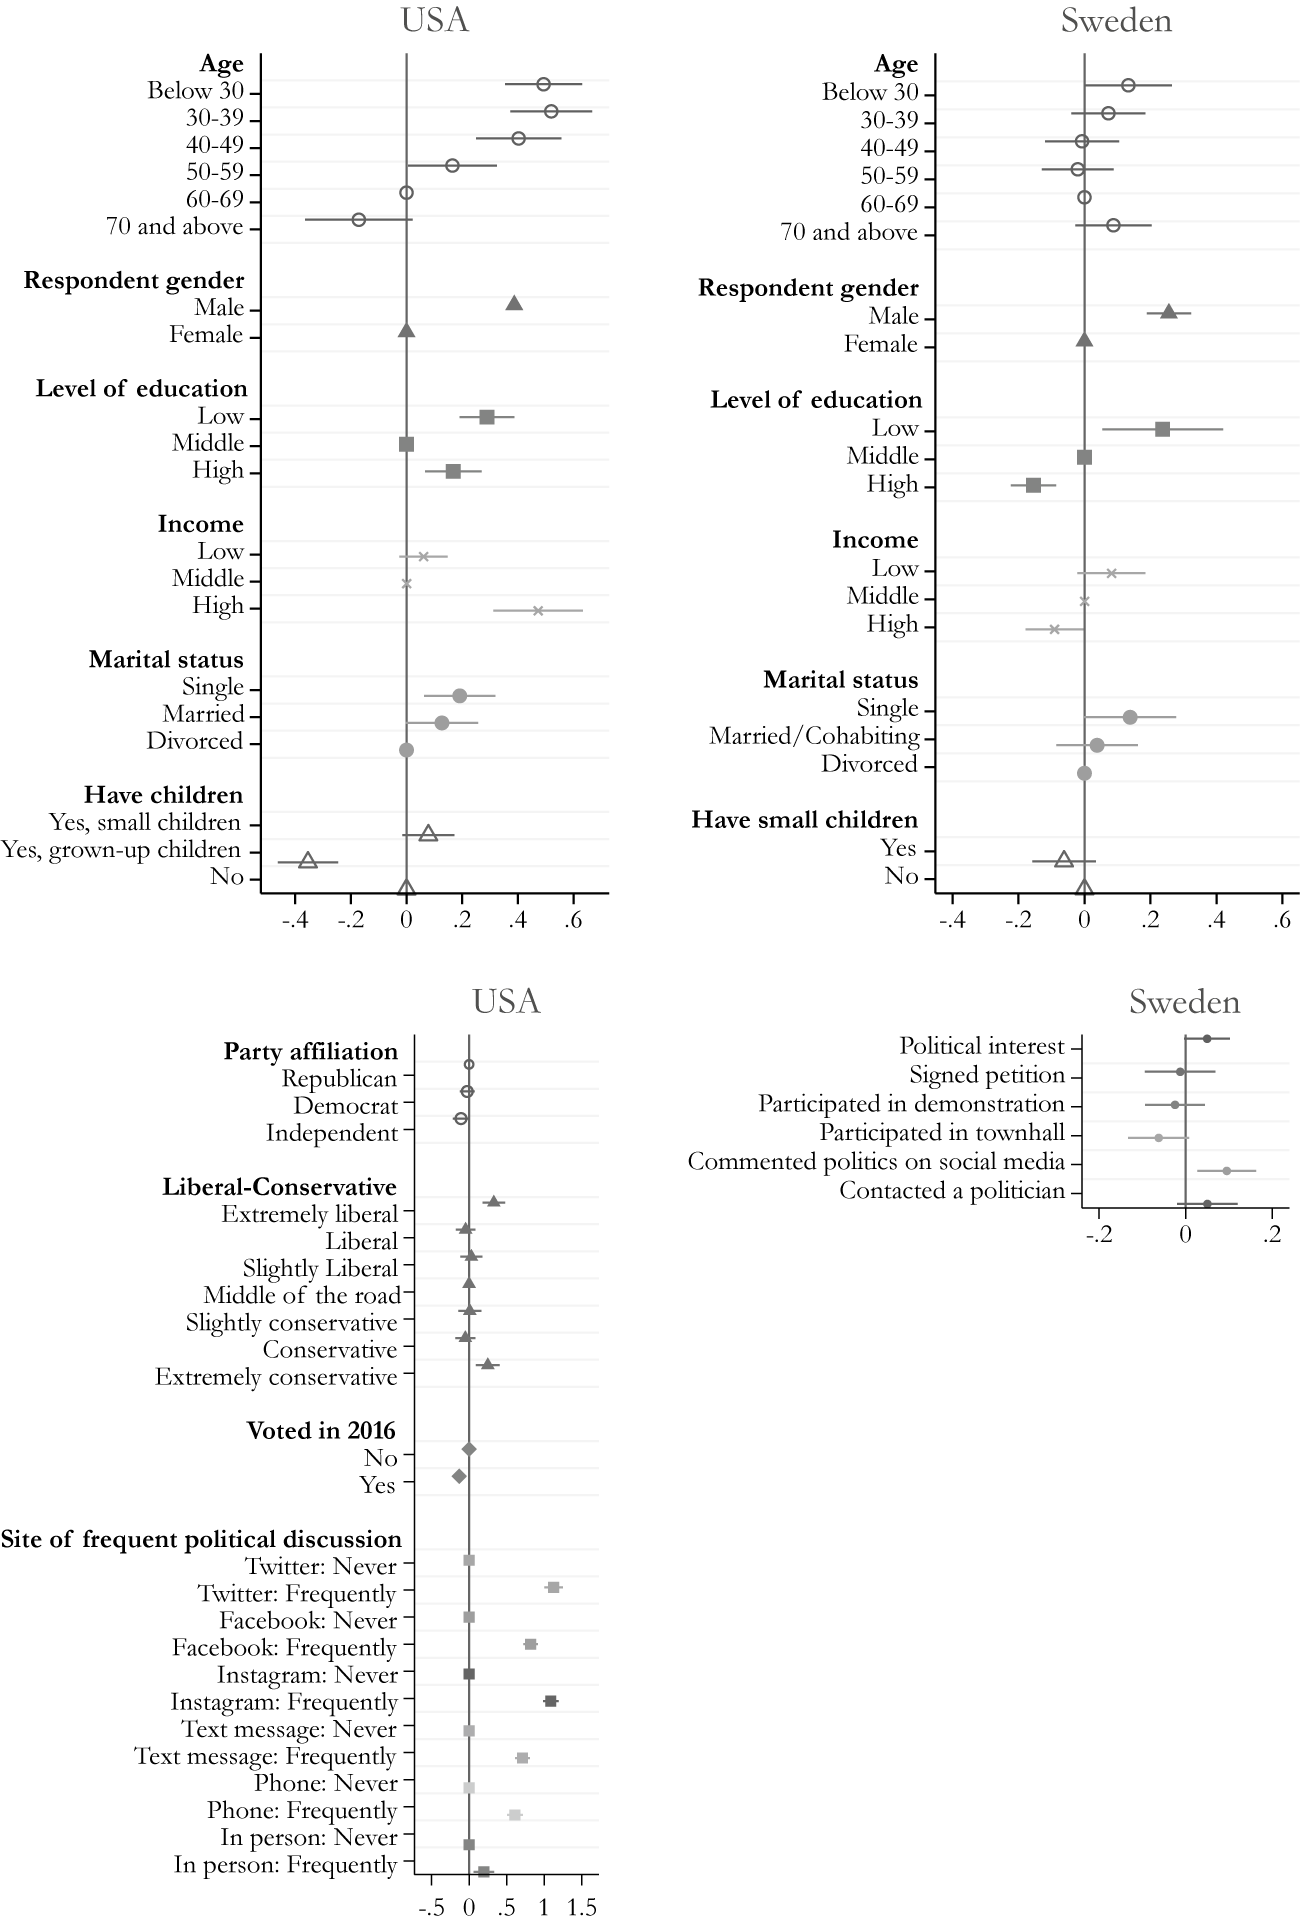
The lower pane in Figure 4 describes political characteristics associated with accepting hostility. In the U.S. data, there are no differences in acceptance of hostility between Democrats and Republicans or between those who identify as liberal or conservative. There is, however, a striking difference between those who are strongly ideological and those who are not: those who identify as “extremely liberal” or “extremely conservative” are more accepting of hostility than those who place themselves toward the middle. In the Swedish data, interest in politics is somewhat correlated with accepting hostility. Furthermore, there are two contrasting patterns related to political participation. While voting does not seem to be correlated with accepting hostility in the United States, those who frequently engage in political discussions on social media are markedly more tolerant of hostility than those who do not. This is in line with previous research that has found social media to be a common channel for hostile communication directed at politicians (Bjarnegård, Håkansson, and Zetterberg Reference Bjarnegård, Håkansson and Zetterberg2022; Håkansson Reference Håkansson2021; Kuperberg Reference Kuperberg2021; Thomas et al. Reference Thomas, Herrick, Franklin, Godwin, Gnabasik and Schroedel2019; Ward and McLoughlin Reference Ward and McLoughlin2020). Participating in politics in more traditional ways is uncorrelated, or even negatively correlated, with accepting hostility in Sweden. Just like in the United States, however, commenting politics on social media is correlated with holding more lenient attitudes to hostility against politicians in Sweden.
Results
Is More Hostility Tolerated against Women?
To empirically investigate H 1 , I compare attitudes toward hostility against women and men. First, I plot the distribution of the three leniency dimensions in Figure 5 and test whether there are statistically significant differences in the means for women and men mayors. Contrary to H 1 , there are no differences between the level of acceptance for hostility against women and men mayors (Pane A), and people are slightly more understanding of hostility toward men than women (Pane B). In the U.S. data, only 25% replied that the incident was “completely not understandable” when directed at a male mayor, compared to 29% when directed at a female mayor. The distribution of ratings is very similar, however, for female and male mayors in both the acceptable scale and the understandable scale. Likewise, there are virtually no differences in the level of sanctions considered appropriate from female and male mayors in response to hostility (Panes C and D). The three components measuring attitudes toward hostility point in the same direction, indicating that they operationalize the same underlying concept.
Attitudes toward hostility. Survey question A: “To what extent do you think that the way the parent acted is acceptable?” measured on a scale from 1, “completely unacceptable,” to 5, “completely acceptable.” Survey question B: “To what extent do you think that the way the parent acted is understandable?” measured on a scale from 1, “completely not understandable,” to 5, “completely understandable.” Survey question C and D: “In your opinion, how appropriate would it be for the mayor to respond to the parent’s email in the following ways?” measured on a scale from 1, “very inappropriate,” to 5, “very appropriate.” Estimates report the share of respondents that selected “somewhat appropriate” or “very appropriate.” Apologize: “Reply, apologize for the policy, and describe the appeal process for school allotments.” Constructive tone: “Reply describing the appeal process for school allotments in a constructive tone.” Ignore the email: “Ignore the email.” Emphasize hostile comments unacceptable: “Reply describing the appeal process for school allotments and emphasize that the comments are unacceptable.” Report to HR: “Report the email to Human Resources.” Report to police: “Report the email to the police.” Pane D reports means for a compiled measurement of sanction that ranges from 1 to 5 and gives positive values for response actions that include sanctions (ignore the email, emphasize hostile comments unacceptable, report to HR, report to police) and negative values for response actions without sanctions (apologize and constructive tone). *** p < .01; ** p < .05; * p < .1, ns p > .1.

The size and statistical significance of differences in attitudes toward hostility are further analyzed by regression analyses. Because these results confirm the null findings already shown descriptively and in the difference-in-means test in Figure 5, they are described and presented in Appendix II (Tables A4–A7). Although statistically significant, the difference in rating hostility as understandable when directed at men compared to women is very small: 0.08 higher on a 1–5 scale (Cohen’s d of .059) in the United States (see Table A4). Likewise, the coefficient for sanctions is also statistically significant but very small: 0.03 higher on 1–5 scale (Cohen’s d of .055) (see Table A4; Table A5 reports results for each sanction item). Null results are found for both Republicans and Democrats and for both women and men respondents (see Tables A11 and A12). The results are very similar in Sweden (see Table A6). Differences in lenient attitudes toward hostility against women and men are similarly small across the survey versions with the school and building policies (see Table A7). Moreover, the level of lenience toward hostility does not vary significantly across policy areas in general, indicating that hostility is seen as equally unjustified regardless of the policy context (see Table A8). While the email version with more overt hostility is, on average, considered less acceptable, less understandable, and more deserving of sanctions, the size of the gap in attitudes toward hostility against women and men does not change with the degree of hostility in the email (see Table A7).
All in all, contrary to my expectations, people do not seem to have more lenient attitudes toward hostility directed at female politicians, and H 1 does not receive empirical support. Women’s higher exposure to hostile citizen contacts does not seem to originate from different attitudes about how much hostility is justified against women and men politicians. The findings, further discussed later, suggest that people do not instinctively accept more hostility against a woman than a man when presented with a hypothetical scenario involving a fictitious politician.
Gendered Contact Preferences
To empirically investigate H 2 , I analyze who respondents select as their most likely contact choice and whether respondents are more likely to choose a politician if that politician is female relative to male. Recall that respondents assigned to the treatment condition chose from a female mayor and a male chair, and those assigned to the control condition chose from the reverse. More respondents should choose the mayor under the treatment condition and the chair under the control condition to offer support to H 2 .
First, I plot the distribution of contact choices. Figure 6 shows that people overall prefer contacting the chair over the mayor, indicating that respondents are aware that decisions on school placements usually are handled by the school board/committee rather than the mayor. However, this preference gap is much smaller under the treatment condition. Respondents are more comfortable “bothering” female than male mayors.
Contact preferences. Survey question: “If you would contact a politician in your city to try to change the situation, who would you be most likely to approach?” The figure reports the share of respondents who selected each option.

Second, I use regression analyses to estimate the size and statistical significance of the propensity to contact women politicians over men. Concretely, I estimate the effect of the mayor being a woman rather than a man on the likelihood that people will contact the mayor rather than the chair. I regress the dependent variable $ y $
, a dummy variable taking the value 1 if the person chooses the mayor and 0 if they chose the chair, on a dummy variable for the treatment condition:
$ y $
, a dummy variable taking the value 1 if the person chooses the mayor and 0 if they chose the chair, on a dummy variable for the treatment condition:
 $$ {y}_i^{mayor}\hskip0.35em =\hskip0.35em \unicode{x03B1} +{\unicode{x03B2} \mathrm{Treatment}}_i+\unicode{x03B3} X{\prime}_i+{e}_i $$
I also include a vector of covariates (X′) consisting of respondent characteristics (and policy area for Study 2) in order to increase precision (see Gerber and Green Reference Gerber and Green2012). The β coefficient will be positive in Equation 1 if respondents are more likely to choose to contact the mayor when she is female (i.e., under the treatment condition).
Table 2 shows that the preference for contacting the mayor increases by 17% (6 percentage points) if the mayor is a woman in the U.S. data and 24% (6 percentage points) in Sweden. The effect remains when controlling for respondent characteristics and policy area (see also the results across Swedish survey versions in Table A10).Footnote 14 The decreased number of observations in Model 4 is largely due to missing data on whether respondents have children. Column 5 reports estimates for a regression including all other control variables but this one. The inclusion of control variables demonstrably does not decrease the effect of the mayor’s sex on citizens’ propensity to prefer them as contacts. Furthermore, both Republicans and Democrats prefer directing complaints to women over men (see Table A11). In Appendix II, I demonstrate the same result from an alternative structure of the analysis in which I use the profiles of the politicians respondents chose between as the unit of analysis (see Table A9).
Preference for contacting the mayor
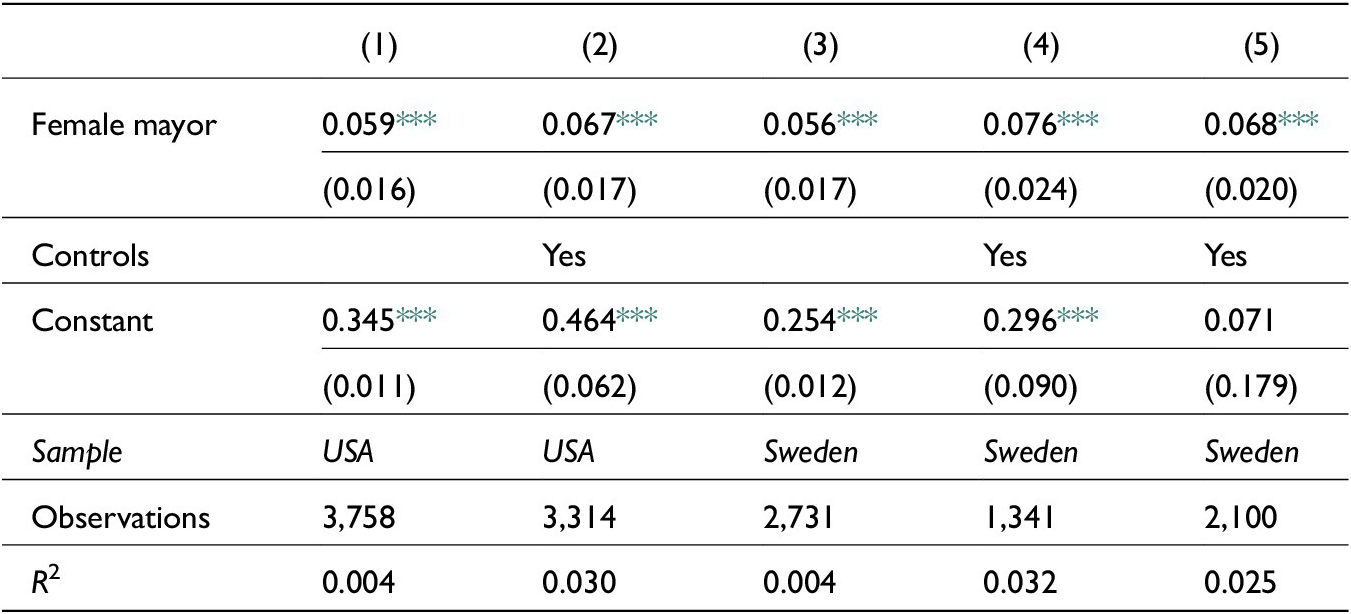
Notes: Dependent variable: “If you would contact a politician in your city to try to change the situation, who would you be most likely to approach?” Respondents selected a politician that they would contact, a forced choice between mayor and chair. Under the female mayor condition, the mayor is female and the chair is male. Under the male mayor condition, the mayor is male and the chair is female. Controls included in Columns 2 and 4: respondent sex, voter (which refers to having voted in 2016 in the United States/2018 in Sweden or not), and FE for having children, marital status, age groups, education, and income. Column 2 also controls for Democrat, referring to being a Democrat rather than a Republican or independent, and degree of ideological identification ranging from 0 to 3, where 0 is “middle of the road” and 3 is either “extremely liberal” or “extremely conservative.” Controls included in Column 4: school versus building policy, respondent sex, having children, voter, marital status, age groups, education, and Income. The same controls are included in Column 5, except for having children. Standard errors in parentheses.
*** p < .01;
** p < .05;
* p < .1.
This suggests, in line with H 2 , that gender matters independently of the formal role for which representative constituents choose to contact. When aggrieved by a policy decision, constituents prefer to contact women representatives. The higher number of complaints directed at women than men contains an inherent risk of more hostility. This result hence offers support for gendered contact preferences as a possible driver of women’s higher exposure to hostile citizen contacts.
Discussion
This study suggests that gendered contact preferences can be understood as a plausible explanation for (at least part of) women political leaders’ higher exposure to hostility. Constituents’ preferences for directing their communication regarding personal grievances and complaints to women politicians make women more likely targets of hostility. The higher number of contacts can generate more hostility against women even in light of the other main finding that hostility is seen as equally permissible against women and men. Given the constant propensity for hostility suggested by the results relating to H 1 , a higher number of complaints implies a higher number of hostile contacts.
The findings relating to H 1 warrant further reflection. An important caveat is that reactions to hypothetical political women and men might differ from those to actual women and men in politics. Several previous studies have noted a dissonance between how fictitious and actual women politicians are perceived (Clayton et al. Reference Clayton, Robinson, Johnson and Muriaas2020; Dolan and Lynch Reference Dolan and Lynch2016). Many people claim to be willing or even prefer to vote for a female candidate (Schwartz and Coppock Reference Schwartz and Coppock2022; Teele, Kalla, and Rosenbluth Reference Teele, Kalla and Rosenbluth2018), but in practice, women candidates are evaluated against higher standards than their male counterparts (Bauer Reference Bauer2020). Similarly, people might not believe that women politicians in general deserve to be treated badly, but they might think hostile treatment is justified against actual political women that they know of.
The experiment attempted to activate HS by presenting an agentic woman. However, faced with a scenario involving a hypothetical woman, respondents may imagine an idealized woman (who is nice and deserves protection) rather than a nontraditional one (who is power seeking and deserves to be put in her place), hence activating benevolent rather than hostile sexism. Furthermore, the hostile emails that mention the mayor’s family may activate BS, as threatening a woman’s children invokes images of motherhood. An extension of the present study could be to directly measure hostile and benevolent sexism attitudes using the Ambivalent Sexism Inventory and investigate the relationship between HS and BS attitudes and the two drivers of hostility that this study focuses on. For example, it is possible that individuals who score higher on HS attitudes hold more lenient attitudes to hostility against women politicians and that those who score higher on BS attitudes hold less lenient attitudes to hostility against women politicians (see, e.g., Cassese and Holman Reference Cassese and Holman2019).
Real examples of hostility against women politicians often do not come to constituents’ attention in a vacuum, but appear in a social context of gender-biased media portrayals and political debate which may activate more of HS (see, e.g., Aaldering and Pas Reference Aaldering and Van Der Pas2020; Reyes-Housholder Reference Reyes-Housholder2020). The complete social context of hostility is hard to mimic in an experiment. Future studies should develop designs that come closer to real contexts of hostility, for example, by using real politicians instead of fictitious ones.
Relatedly, the fact that the type of hostility investigated here is not gendered in its form may also influence the results. HS and negative attitudes to women politicians may be a more pronounced driver of hostility that is explicitly gendered, such as sexualized comments and threats or sexist memes (see, e.g., Erikson, Håkansson, and Josefsson Reference Erikson, Håkansson and Josefsson2021; Krook Reference Krook2020). Exploring attitudes to various forms of hostility against women and men politicians is an important task for future research.
Future research should also explore reactions to hostility toward, as well as preferences for directing complaints to, women of different intersecting social identities such as race, religion, and class. Previous research highlights that VAWIP targets women across ethnic backgrounds differently (Kuperberg Reference Kuperberg2021), suggesting that the results of this study might differ across intersectional groups of women. Politicians of color in positions of power violate racial stereotypes, which is associated with particularly severe social punishments for racial minorities (Phelan and Rudman Reference Phelan and Rudman2010). Consequently, the overall level of lenient attitudes toward hostility can be expected to be higher if the hostility is directed at racial minority politicians. By simultaneously violating gender and racial stereotypes, it is likely that powerful women of color spur particularly hostile reactions. Furthermore, Glick and Raberg (Reference Glick, Raberg, Travis and White2018, 364) note that “men’s benevolent sexism may be reserved for women who share men’s group memberships (e.g., same race or ethnicity).” We might, for example, expect white men and women to consider women politicians of color less deserving of protection from harassment (see also Crenshaw Reference Crenshaw1991). Constituents’ sense of entitlement to voice their anger, and their choice of politician to complain to, might be affected by representatives’ gender combined with race or class.
Conclusion
Previous research has noted significant gender gaps in politicians’ exposure to harassment in several contexts. This study focuses on a typical case of harassment for women politicians: hostility from a constituent. It investigates two potential explanations for why constituents harass women representatives more than men. The first focuses on whether constituents have more lenient attitudes toward hostility directed at women than men representatives. This would increase the probability that messages to women politicians include hostile content. I found no support for lenient attitudes toward hostility against women politicians, suggesting that the gender gap in hostile citizen contacts does not seem to be driven by people instinctively accepting that women are treated badly.
The second focuses on whether constituents are more likely to direct complaints to women than men representatives. A higher number of complaints would increase the number of hostile messages. This driver was supported, suggesting that in the United States as well as in Sweden, constituents apply a gendered double standard and consider it more appropriate to approach women politicians with their personal grievances. This has implications for women politicians’ time use and likely increases demands on the time they devote to constituency contacts. The lower barriers for approaching women politicians with complaints also entails an inherent risk of hostility against them. The marked preference for directing messages regarding policy grievances to women politicians implies that men representatives can feel somewhat more secure when proposing unpopular policy than women can (in Sweden as well as the United States). While hostility as a reaction to unpopular policy is perceived as equally unacceptable against both women and men, the likelihood is still higher that women will receive a hostile message since citizens prefer to vent their grievances to women representatives. Future research should explore the reasons for this gendered contact preference further.
According to VAWIP theory, women politicians face specific risks of violence due to perpetrators’ biased attitudes (Krook and Restrepo Sanín 2020). This study contributes new insights into how such biases may manifest. Even in the context of an aggrieved citizen—as opposed to an overtly misogynistic online activist, for example—and hostility with nonsexist language, gendered double standards operate subtly to increase women politicians’ vulnerability to violence. While this study does not test explanations for all forms of gendered political violence or VAWIP, it arguably increases understanding for a particular—and highly prevalent—form of violence that women politicians experience. The findings are consistent in the United States and Sweden, suggesting the validity of findings across contexts with different electoral systems, histories of women’s representation and other sociocultural aspects.
Gendered attitudes toward politicians as a driver of harassment remains an important research topic. To enhance our understanding of the role of lenient attitudes toward hostility, future studies could oversample individuals with characteristics associated with accepting more hostility, using this study’s description of those characteristics. For example, according to the descriptive statistics presented in this study, men hold significantly more lenient attitudes toward hostility against politicians than women do in both the United States and Sweden. This indicates the importance for future research to focus specifically on explaining men’s hostility against women and men politicians respectively.
The limitations and possibilities of survey experiments for studying gendered attitudes deserve further attention in future research. Survey experiments often find a preference for selecting women over men, all else equal, but this is not correlated with an overrepresentation of women in politics. One conclusion from such studies is that women and men do not have the same possibilities to reach the “all else equal” criterion: because of gender norms in society, it is more difficult for women to obtain some of the characteristics that voters prefer, such as having families (Clayton et al. Reference Clayton, Robinson, Johnson and Muriaas2020; Teele, Kalla, and Rosenbluth Reference Teele, Kalla and Rosenbluth2018). Analogously, the context of hostility against women and men politicians may not be as equal in real life as in this experiment. It can be interpreted as encouraging that people in general do not tolerate more hostility against women than men. However, in real-life situations, media commentary and discussion forums may influence how women politicians are assessed in a way that is difficult to mimic in an experiment. Future studies on the topic need to consider and address this challenge.
Supplementary material
The supplementary material for this article can be found at http://doi.org/10.1017/S1743923X23000144.
Acknowledgments
Research for this article was funded by the Swedish Research Council (grant no. 2018-00703). I would like to thank Elin Bjarnegård, Johanna Rickne, Olle Folke, Nazita Lajevardi, Josefina Erikson, Mona Lena Krook, Sarah Khan, Katrin Uba, and Axel Cronert for their helpful comments and advice. I also received valuable feedback and suggestions from anonymous reviewers at Politics & Gender, as well as participants in seminars at the Department of Government at Uppsala University, EuroWEPS 2019, and EGEN 2020.


 Open access