

Neuroleptic malignant syndrome (NMS) is a rare, idiosyncratic reaction that has been reported in association with both first- and second-generation antipsychotic drugs. Although both the incidence of NMS Reference Adityanjee, Aderibigbe and Mathews1 and NMS-related mortality Reference Shalev, Hermesh and Munitz2 appear to be declining, the accurate and timely recognition of NMS remains a priority because of its potential severity and its association with long-term neuropsychiatric and physical sequelae. Reference Adityanjee, Sajatovic and Munshi3,Reference Levenson and Fisher4 As classically described, NMS presents with abrupt onset of fever, autonomic instability, extrapyramidal signs (EPS) and altered mental state. Reference Addonizio, Susman and Roth5 This classical tetrad may be accompanied by raised serum creatine kinase, impaired liver function tests, leukocytosis, electrolyte disturbance, renal impairment, altered coagulation studies and electrocardiogram abnormalities. However, case reports and several reviews Reference Addonizio, Susman and Roth5–Reference Trollor, Xiaohua and Sachdev10 have highlighted a propensity for NMS induced by second-generation antipsychotic drugs (2G-NMS) to present in an atypical manner. Such reports raise a question about the clinical utility of existing NMS criteria, and send a confusing message to the clinician whose primary concern is diagnostic clarity and prompt initiation of appropriate management. The published data do not adequately address whether the clinical features of 2G-NMS differ substantially from that observed with first-generation antipsychotic drugs (1G-NMS), and whether the second-generation antipsychotics themselves are associated with discrete differences in NMS profile. Against the backdrop of the classical NMS profile, our recent review Reference Trollor, Xiaohua and Sachdev10 suggested that clozapine-induced NMS may present in an atypical manner, with less rigidity, a short induction period and delayed elevation of creatine kinase. The review also raised the possibility that risperidone-induced NMS may present with a lower grade of fever, and that aripiprazole may be less likely to present with altered mental status and high fever. However, the potential reporting bias and small number of published cases limits the conclusions that can be drawn from data from these sources.
The Australian Adverse Drug Reaction Advisory Committee (ADRAC) was established in 1970 under the auspices of the Adverse Drug Reactions Unit of the Australian government's Therapeutic Goods Administration. The Australian reporting system for adverse drug reactions is recognised as one of the best in the world. Reference Boyd11 The ADRAC requests the standardised reporting of all suspected reactions to new drugs and all serious reactions to other drugs that are deemed to have a significant impact on the patient's management (www.tga.gov.au/safety/problem-medicine.htm). All ADRAC reports are screened by ADRAC staff, coded, assessed for causality and entered into a database that can then be interrogated. As such, the ADRAC database is an ideal source from which to obtain relatively unbiased information relating to the presentation of NMS induced by both first- and second-generation antipsychotics. We sought to examine this data to determine whether there were meaningful clinical differences in 1G-NMS and 2G-NMS, and whether differences in NMS profile were apparent between various second-generation antipsychotics.
Method
Data extraction
A search of the ADRAC database was undertaken by ADRAC staff to identify all NMS cases reported from the time of the first ADRAC report of 2G-NMS (April 1994) until data extraction in September 2010. Case identification relied on the reporting clinician's diagnosis of NMS, which was accepted at face value, as retrospective verification of the NMS diagnosis could not be undertaken. Data extracted from the database were systematically coded for each case where available, entered into a database and transferred to PASW for Windows (Release 18.0.0) for analysis.
Data analysis
Differences in demographics, psychiatric diagnoses, risk factors and treatments between 1G-NMS and 2G-NMS were examined using independent sample t-tests or non-parametric chi-squared/Fisher's exact tests where relevant. The relationship between the use of first- or second-generation antipsychotics and the occurrence of each clinical sign was assessed with the use of a forced-entry logistic-regression model. Differences in NMS signs between the most prevalent second-generation agents (clozapine, olanzapine, quetiapine and risperidone) were examined using an omnibus chi-squared test for independence. Post hoc comparisons correcting for age and gender were then conducted using logistic regression. Alpha was set to 0.05.
Results
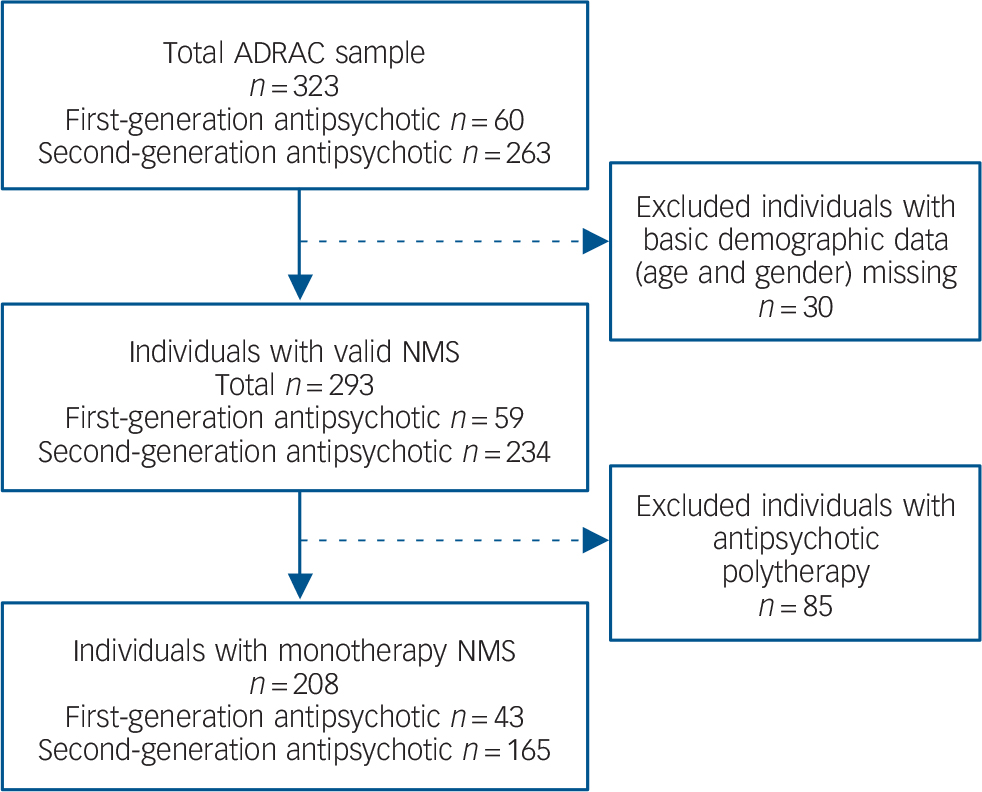
A total of 393 people with NMS were identified in the ADRAC database. Of these, 30 were excluded from further analysis because basic demographic data were missing from the case description. To exclude confounding effects, individuals with NMS induced by co-prescription of two or more antipsychotics were also excluded (n = 85). Data were therefore analysed for a total of 208 people with NMS induced during monotherapy with antipsychotic drugs (n = 165 second generation, n = 43 first generation, Fig. 1).
Table 1 presents the basic demographic data, risk factors, diagnosis, treatment profile and outcome for the individuals with NMS included in the study. Treatments for NMS were not mutually exclusive, but testing for multicollinearity revealed a variance inflation factor of less than 5 for all treatment variables.
Australian Adverse Drug Reaction Advisory Committee (ADRAC) neuroleptic malignant syndrome (NMS) sample and exclusion criteria.
Consistent with previous reports Reference Caroff, Mann and Campbell6,Reference Farver8 there was an overall male predominance (72.1%). The mean age of individuals with NMS was 49.9 years (s.d. = 21.1). The mean age of individuals with 2G-NMS was 46.8 years (s.d. = 19.4) and lower than that of people with 1G-NMS (61.7 years, s.d. = 23.6; t = 3.822, P<0.01). The median time to NMS symptom onset following initiation of the antipsychotic drug was 23.0 days (range 1–3691), with no significant difference between those with 1G-NMS and 2G-NMS.
Clinical characteristics of individuals with neuroleptic malignant syndrome (NMS)
| ADRAC NMS monotherapy reports | Statistics | ||||
|---|---|---|---|---|---|
| All reports (n = 208) | 1G-NMS (n = 43) | 2G-NMS (n = 165) | χ2 Footnote a /t | P | |
| Antipsychotic, n (% 2nd generation) | 165 (79.3) | – | – | – | – |
| Gender, n (% male) | 150 (72.1) | 30 (69.8) | 120 (72.7) | 0.149 | 0.706 |
| Age, years: mean (s.d.) median | 49.9 (21.1) 49.0 | 61.7 (23.6), 69.0 | 46.8 (19.4) 44.0 | 3.822 | <0.001Footnote *** |
| Days to onset, mean (s.d.) median | 211 (495) 23.0 | 136.3 (477.1), 8.5 | 226 (500) 27.5 | 0.773 | 0.441 |
| Risk factors, n (%) | |||||
| Intellectual disability | 3 (1.4) | 1 (2.3) | 2 (1.2) | 0.298 | 0.503 |
| Concurrent lithium | 24 (11.5) | 3 (7.0) | 21 (12.7) | 1.105 | 0.423 |
| Past history of NMS | 10 (4.8) | 4 (9.3) | 6 (3.6) | 2.393 | 0.221 |
| Concurrent serotonergic antidepressant | 41 (19.7) | 8 (18.6) | 33 (20.0) | 0.042 | 1.000 |
| Diagnosis, n (%) | 9.125 | 0.006Footnote b Footnote ** | |||
| Psychotic disorder | 93 (44.7) | 13 (30.2) | 80 (48.5) | ||
| Affective disorder | 8 (3.8) | 3 (7.0) | 5 (3.0) | ||
| Organic | 4 (1.9) | 1 (2.3) | 3 (1.8) | ||
| Anxiety | 2 (1.0) | 0 (0.0) | 2 (1.2) | ||
| Other | 4 (1.9) | 4 (9.3) | 0 (0.0) | ||
| Not mentioned | 97 (46.6) | 22 (51.2) | 75 (45.5) | ||
| Treatments, n (%) | |||||
| Supportive | 133 (63.9) | 19 (44.2) | 114 (69.1) | 9.176 | 0.004Footnote ** |
| Benzodiazepines | 30 (14.4) | 6 (14.0) | 24 (14.5) | 0.010 | 1.000 |
| Muscle relaxants | 16 (7.7) | 4 (9.3) | 12 (7.3) | 0.198 | 0.747 |
| Dopamine agonists | 24 (11.5) | 7 (16.3) | 17 (10.3) | 1.193 | 0.288 |
| Electroconvulsive therapy | 1 (0.5) | 0 (0.0) | 1 (0.6) | 0.262 | 1.000 |
| Intensive care unit admission | 14 (6.7) | 1 (2.3) | 13 (7.9) | 1.676 | 0.309 |
| Not mentioned | 59 (28.4) | 19 (44.2) | 40 (24.2) | – | – |
| Mortality rate, n (%) | 12 (5.8) | 7 (16.3) | 5 (3.0) | 6.214 | 0.020Footnote c Footnote * |
ADRAC, Australian Adverse Drug Reaction Advisory Committee; 1G-NMS, first-generation antipsychotic drug-induced NMS; 2G-NMS, second-generation antipsychotic drug-induced NMS.
a. Fisher's exact test used to compensate for the overestimate of the chi-squared value when used with a 2×2 table.
b. Diagnosis categories were combined as psychotic disorders and other for chi-squared test. Individuals where diagnosis was not mentioned were excluded for this analysis.
c. Comparison between death and residual or no residual effects for chi-squared test. For individuals where outcome was unknown these were excluded for this analysis.
* P<0.05
** P<0.01
*** P<0.001.
A variety of NMS risk factors were noted but the frequency of risk factors did not differ according to class of antipsychotic. Notably, substantial co-prescription of serotonergic antidepressants (19.7%) and lithium (11.5%) was seen in the sample as a whole. However, there was no difference in frequency of concurrent serotonergic antidepressant or lithium use between first- and second-generation groups.
Diagnostic information was available for 111 individuals and demonstrated a predominance of psychotic disorders for both first- (30.2%) and second-generation categories (48.5%). A psychotic disorder diagnosis was more likely to be found in those receiving second-generation antipsychotics (χ2(1) = 9.125, P<0.01).
Treatment details were available for 149 individuals. A range of treatments was documented, including supportive care, benzodiazepines, muscle relaxants, dopamine agonists, electroconvulsive therapy and intensive care unit admission. Supportive care was more commonly documented for 2G-NMS, compared with 1G-NMS (χ2(1) = 9.176, P<0.01). No other statistically significant differences in treatment were observed.
Outcome was known for 149 individuals. The mortality rates were 5.8% for the whole sample, 16.3% for 1G-NMS and 3.0% 2G-NMS. The differences in mortality between first- and second-generation antipsychotic groups was statistically significant (χ2(2) = 6.214, P<0.05). Neither age, gender nor year of ADRAC report made a significant contribution to the full logistic regression model (χ2(4) = 14.118, P<0.01), of which antipsychotic group was the strongest predictor (odds ratio (OR) = 0.156, 95% CI 0.033–0.729, P = 0.018).
Clinical signs in individuals with neuroleptic malignant syndrome (NMS)
| ADRAC NMS monotherapy reports | |||||||||
|---|---|---|---|---|---|---|---|---|---|
| All reports, n
(%) (n=208) |
1G-NMS, n
(%) (n=43) |
2G-NMS, n (%) (n = 165) |
Corrected for age and gender | ||||||
| Wald/F | OR | P | Wald/F | OR (95% CI) | P | ||||
| Core signs | |||||||||
| Altered sensorium | 78 (37.5) | 18 (41.9) | 60 (36.4) | 0.098 | 0.896 | 0.754 | 0.006 | 0.971 (0.47–2.00) | 0.937 |
| Rigidity | 70 (33.7) | 21 (48.8) | 49 (29.7) | 3.957 | 0.498 | 0.047Footnote * | 3.343 | 0.509 (0.25–1.05) | 0.067 |
| Hyperpyrexia | 98 (47.1) | 19 (44.2) | 79 (47.9) | 0.678 | 1.331 | 0.678 | 0.295 | 1.222 (0.59–2.51) | 0.587 |
| Autonomic dysfunction | 55 (26.4) | 15 (34.9) | 40 (24.2) | 1.260 | 0.661 | 0.262 | 2.311 | 0.551 (0.26–1.19) | 0.128 |
| Other signs | |||||||||
| Any extrapyramidal signs | 80 (38.5) | 23 (53.5) | 57 (22.4) | 3.716 | 0.511 | 0.054 | 3.278 | 0.514 (0.25–1.06) | 0.070 |
| Tremor | 18 (8.7) | 1 (2.3) | 17 (10.3) | 2.523 | 5.250 | 0.112 | 2.196 | 4.840 (0.60–39.0) | 0.138 |
| Dystonia and dyskinesia | 13 (6.3) | 4 (9.3) | 9 (5.5) | 0.606 | 0.614 | 0.436 | 0.715 | 0.572 (0.16–2.09) | 0.398 |
| Creatine kinase rise | 100 (48.1) | 23 (53.5) | 77 (46.7) | 0.266 | 0.837 | 0.606 | 0.685 | 0.740 (0.36–1.51) | 0.408 |
| White cell count rise | 38 (18.3) | 7 (16.3) | 31 (18.8) | 0.281 | 1.275 | 0.596 | 0.245 | 1.269 (0.50–3.25) | 0.620 |
ADRAC, Australian Adverse Drug Reaction Advisory Committee; 1G-NMS, first-generation antipsychotic drug-induced NMS; 2G-NMS, second-generation antipsychotic drug-induced NMS.
* P<0.05.
Clinical profile of neuroleptic malignant syndrome induced by individual second-generation antipsychoticsFootnote a
| n (%) | Test statistic | ||||||||
|---|---|---|---|---|---|---|---|---|---|
| Paliperidone (n=1) |
Amisulpride (n=7) |
Aripiprazole (n=5) |
Clozapine (n = 76) |
Olanzapine (n = 28) |
Quetiapine (n = 14) |
Risperidone (n = 34) |
χ2 | P Footnote b | |
| Core signs | |||||||||
| Altered sensorium | 0 (0.0) | 3 (42.9) | 2 (40.0) | 25 (32.9) | 11 (39.3) | 6 (42.9) | 13 (38.2) | 0.869 | 0.83 |
| Rigidity | 0 (0.0) | 4 (57.1) | 3 (60.0) | 8 (10.5) | 13 (46.4) | 5 (35.7) | 16 (47.1) | 21.24 | <0.001Footnote *** |
| Hyperpyrexia | 0 (0.0) | 4 (57.1) | 3 (60.0) | 38 (50.0) | 15 (53.6) | 7 (50.0) | 12 (35.3) | 2.963 | 0.397 |
| Autonomic dysfunction | 0 (0.0) | 2 (28.6) | 2 (40.0) | 20 (26.3) | 9 (32.1) | 2 (14.3) | 5 (14.7) | 3.224 | 0.358 |
| Other signs | |||||||||
| Any extrapyramidal signs | 0 (0.0) | 4 (57.1) | 3 (60.0) | 12 (15.8) | 14 (50.0) | 5 (35.7) | 19 (55.9) | 19.74 | <0.001Footnote *** |
| Tremor | 0 (0.0) | 4 (57.1) | 1 (20.0) | 4 (5.3) | 4 (14.3) | 0 (0.0) | 4 (11.8) | 3.622 | 0.305 |
| Dystonia and dyskinesia | 0 (0.0) | 1 (14.3) | 1 (20.0) | 2 (2.6) | 3 (10.7) | 1 (7.1) | 1 (2.9) | 3.052 | 0.384 |
| Creatine kinase rise | 1 (100) | 5 (71.4) | 3 (60.0) | 30 (39.5) | 18 (64.3) | 4 (28.6) | 16 (47.1) | 4.924 | 0.177 |
| White cell count rise | 0 (0.0) | 3 (42.9) | 0 (0.0) | 16 (21.1) | 2 (7.1) | 3 (21.4) | 7 (20.6) | 3.475 | 0.324 |
a. A statistically meaningful comparison was only able to be made between clozapine, olanzapine, quetiapine and risperidone.
b. P-value derived from chi-squared tests between clozapine, quetiapine, olanzapine and risperidone.
*** P<0.001.
Table 2 shows the specific clinical profile for 1G-NMS and 2G-NMS. Rise in creatine kinase emerged as the most commonly endorsed feature of NMS in the group as a whole (48.1%), followed by hyperpyrexia (47.1%), EPS (38.5%), altered sensorium (37.5%) and rigidity (33.7%). Comparison of signs for NMS induced by first- and second-generation antipsychotics revealed few statistically significant differences. Rigidity was less commonly observed with 2G-NMS (OR = 0.498, P<0.05), but the significance of this result was weakened after controlling for age and gender (OR = 0.509, P = 0.067). There was also a trend for 2G-NMS to be associated with fewer overall EPS (OR = 0.511, P = 0.054), which remained apparent after controlling for age and gender. No other statistically significant differences were observed in NMS symptom profiles induced by first- and second-generation antipsychotics.
The clinical profile of NMS induced by the different second-generation antipsychotics is shown in Table 3. A statistically meaningful comparison was able to be made between clozapine, olanzapine, quetiapine and risperidone only. A significant association was found between drug type and the presence of rigidity (χ2(3) = 21.24, P<0.001) and other EPS (χ2(3) = 19.74, P<0.001). No association was found between drug type and presence of hyperpyrexia (χ2(3) = 2.963, P = 0.397), altered sensorium (χ2(3) = 0.869, P = 0.833) or autonomic dysfunction (χ2(3) = 3.224, P = 0.358). Post hoc logistic regression, controlling for age and gender, revealed that clozapine-induced NMS was less likely to present with rigidity (χ2(5) = 23.336, P<0.001) than risperidone (OR = 7.16), olanzapine (OR = 6.45) or quetiapine (OR = 4.75). Clozapine-induced NMS was also the less likely to display any EPS (χ2(5) = 21.776, P<0.001) compared with risperidone (OR = 6.23) or olanzapine (OR = 4.87).
Post hoc comparison of 2G-NMS was performed using only those individuals for whom sufficient data were available to independently confirm NMS diagnosis. A total of 71 of the original 165 people with 2G-NMS met NMS diagnostic criteria based on achieving a priority score of 50 or more on items from the recent international Delphi consensus on NMS diagnosis. Reference Gurrera, Caroff, Cohen, Carroll, DeRoos and Francis12 Individuals who had been treated with clozapine showed less rigidity (χ2(5) = 24.512, P<0.001) than those treated with risperidone (OR = 16.11) and olanzapine (OR = 12.65), and a trend was observed for the difference between treatment with clozapine and quetiapine (OR = 6.091, P = 0.064).
Discussion
Main findings
We report the largest case series of 2G-NMS in the literature. The strengths of our approach include the inclusion of monotherapy cases only, the comparison with 1G-NMS from the same database and the relative lack of sampling bias. Individuals on the ADRAC database showed a male predominance, which is consistent with other large case series of 1G-NMS Reference Addonizio, Susman and Roth5 and 2G-NMS. Reference Caroff, Mann and Campbell6,Reference Farver8 In our study the mean age was about 50 years and median days to onset was just over 3 weeks, both of which are slightly above those reported previously. Reference Addonizio, Susman and Roth5,Reference Caroff, Mann and Campbell6,Reference Farver8 Our finding of a lower mean age for 2G-NMS presumably reflects a bias towards initiation of second-generation agents in treatment of de novo cases, which are more likely in younger individuals. A higher proportion of individuals with 2G-NMS had a diagnosis of a psychotic disorder. This likely reflects the historical restriction of the government subsidy for second-generation antipsychotics, which was initially limited to psychotic disorder diagnoses.
The risk-factor profile did not appear to differ between 1G-NMS and 2G-NMS. Only 1.4% of our overall sample were reported to have an intellectual disability, a rate slightly lower than that observed by others. Reference Addonizio, Susman and Roth5,Reference Shalev and Munitz13 This may also reflect the Australian subsidisation scheme for pharmaceuticals (the Pharmaceutical Benefits Scheme), which for the most part does not allow subsidisation of the cost of second-generation antipsychotics for intellectual disability in the absence of schizophrenia. Concurrent prescription of lithium was observed in 11.5% of our sample, and is slightly lower than the 16.5% reported by Addonizio et al. Reference Addonizio, Susman and Roth5 We found a high rate of prescription of serotonergic antidepressants (19.7%) in our sample. Previous studies Reference Naganuma and Fujii14–Reference Berardi, Amore, Keck, Troia and Dell'Atti16 did not identify antidepressants with serotonergic properties as a risk for NMS, however the increasing use of serotonergic agents as adjunctive treatments in schizophrenia highlights the importance of exploring this issue further. It is conceivable that stimulation of 5-hydroxytryptamine (5HT2A) receptors exaggerates the downregulation of dopaminergic activity already promoted by the antipsychotic agent, thereby potentially enhancing the risk of NMS.
The overall mortality rate in our study of 5.8% is substantially below that historically reported from large case series. Reference Shalev and Munitz13,Reference Caroff17,Reference Levenson18 This finding likely represents improvements in identification and management of NMS over time. The mortality rate of 3.0% in individuals with 2G-NMS was significantly lower than the 16.3% observed with first-generation antipsychotics, but this effect was reduced after correction for age differences. Explanations for this observation include differences in severity or identification and management between groups. Supportive treatment was documented more commonly with 2G-NMS, yet admission rates to an intensive care unit were non-significantly higher in the second-generation antipsychotic group. These figures are hard to reconcile but raise the possibility that the 2G-NMS group was managed more assertively. A post hoc analysis (data not shown) revealed that although the time frame for collection of NMS cases from the ADRAC database was the same for first- and second-generation antipsychotics (1994–2010), 1G-NMS occurred on average 4 years earlier than 2G-NMS during antipsychotic treatment. In our view, this small but statistically significant difference is unlikely to have resulted in a dramatic difference in clinical approach or mortality rates.
The ADRAC data support the notion that, with the exception of clozapine, clinical presentations of NMS are similar, whether induced by first- or second-generation antipsychotic agents. Any differences in rates of rigidity between those with 1G-NMS and 2G-NMS were of borderline significance only once corrected for age and gender. Subsequent analysis of differences in NMS presentation between individual second-generation antipsychotics suggested a contribution from clozapine alone. A post hoc comparison of individuals with 1G-NMS and 2G-NMS after excluding clozapine (data not shown) did not reveal any group differences in core signs of NMS, confirming our view that with the exception of clozapine, 2G-NMS presents in the characteristically described manner.
Clozapine-induced NMS was significantly less likely than NMS induced by risperidone, olanzapine or quetiapine to manifest with rigidity or other EPS. Previous work by one of us suggested a differential time course of symptom evolution between those treated with clozapine and individuals with 1G-NMS. Reference Sachdev, Kruk, Kneebone and Kissane19 If EPS is a delayed feature in those with clozapine-induced NMS, lower rates of this core symptom could result, which could explain our finding. However, we do not have data directly comparing the time course in evolution of clozapine-induced NMS compared with NMS induced by other second-generation antipsychotics. Furthermore, the ADRAC data reflect a summary of NMS symptomatology across the whole NMS episode as data are typically only submitted to ADRAC after resolution of the episode. We would therefore not expect ADRAC data to be strongly influenced by differences in temporal evolution of symptoms. Although time course of symptom evolution is unlikely to be the primary explanation for the distinct profile of clozapine-induced NMS, further detailed collection of data regarding the time-course of emerging NMS symptoms would assist in addressing this issue in a definitive manner. We propose the scale developed by one of us Reference Sachdev20 as a suitable tool for this purpose.
The relative absence of rigidity could conceivably be explained by differences in receptor binding profiles between antipsychotic drugs. Clozapine is an antagonist at both dopamine (D2) and 5HT2A receptors in the nigrostriatal pathway, Reference Jaan, Grimsley, Gray and Chang21 has a relatively high 5HT2/D2 ratio, low affinity for D2 and shows mesolimbic selectivity. Reference Coward, Imperato, Urwyler and White22 These factors have relevance for the lowered incidence of acute EPS during clozapine's routine use, but could also provide possible explanations for the relative absence of rigidity during NMS. Although these factors may be relevant to lower EPS during the routine use of clozapine, each is not unique to clozapine, making it hard to explain its distinct NMS profile. We have previously proposed that other factors such as clozapine's interaction at other dopamine receptors or its robust ability to produce blockade of muscarinic cholinergic receptors may be relevant to its NMS profile. Reference Trollor, Xiaohua and Sachdev10 The latter may serve to reduce rigidity associated with NMS. However, against this as the core explanation is that some other second-generation (such as olanzapine) and first-generation (such as chlorpromazine) antipsychotic drugs share the propensity for muscarinic cholinergic blockade.
Our data regarding olanzapine-induced NMS do not support an atypical presentation of NMS with this drug. Previously reported data suggest that individuals with risperidone-induced NMS may present with less severe hyperthermia compared with NMS induced by first-generation antipsychotics. Reference Trollor, Xiaohua and Sachdev10 Although our data indicated that risperidone displayed the lowest frequency of hyperpyrexia of all the second-generation antipsychotics, this failed to reach statistical significance. The smaller number of individuals in our study treated with amisulpride, aripiprazole, ziprasidone and paliperidone prevented us from reaching any conclusions about whether these drugs are associated with atypical presentations of NMS.
Strengths and limitations
Our data are free from the potential bias of published case reports, which may favour unusual cases or unexpected outcomes. We used the same time period to capture data for both second-generation and first-generation antipsychotic-induced NMS. Therefore our group comparison is less likely to be affected by time-dependent factors such as improved recognition and management. Such factors may have been a confound in previous comparisons between 1G-NMS and 2G-NMS. Some potential sources of biases relevant to the ADRAC database are worthy of mention. Although reporting of adverse events to ADRAC is encouraged it is not mandatory. Clinicians may be more likely to report 2G-NMS, especially in the case of clozapine, which is associated with closer monitoring of adverse events. Furthermore, clinician reports of NMS signs will inherently be biased by what they know, perhaps limiting the likelihood of atypical reports.
The obvious limitations of the ADRAC data relate to the lack of standardised NMS diagnosis, either by the reporting clinician or for the purposes of our review of reported cases. Insufficient data are sometimes provided in the description of individual cases to allow independent evaluation of the veracity of the NMS label. The post hoc comparison using confirmed NMS cases (according to published criteria Reference Coward, Imperato, Urwyler and White22 ) addressed the concern regarding the robustness of diagnosis, with results that closely mirrored the original analysis. For many individuals, data relating to psychiatric diagnosis, clinical presentation, treatment and outcome were missing. However, in a post hoc analysis we explored the potential confounding effect of the missing data and were satisfied that there was no systematic bias. A comparison of individuals for whom psychiatric diagnosis was mentioned v. not mentioned, and where NMS treatment was mentioned v. not mentioned did not reveal a statistically significant effect on key variables of interest, including rigidity or EPS. Furthermore, repeating the logistic regression only for individuals where psychiatric diagnosis was known enhanced the effect of antipsychotic class on rigidity (OR = 0.355, P = 0.040). Finally, the relatively small number of individuals with NMS treated with amisulpride, aripiprazole, ziprasidone and paliperidone also limits our ability to contribute to the debate on whether atypical presentations are more likely with these agents.
Implications
The profile of NMS due to second-generation antipsychotics appears to be similar to that resulting from first-generation drugs. A possible exception is clozapine-induced NMS, which is less likely than NMS induced by other second-generation antipsychotics to present with rigidity. Mortality associated with NMS appears lower with second-generation antipsychotic drugs but the reasons for this remain unclear. Neuroleptic malignant syndrome is a potentially severe adverse reaction to antipsychotic drugs, and a high index of suspicion should be maintained in individuals presenting with emerging signs and symptoms, regardless of antipsychotic class. Greater emphasis should be placed on non-motor signs when assessing individuals with potential clozapine-induced NMS.


eLetters
No eLetters have been published for this article.