


Riots are political acts in which participants engage in violence to express grievances and attempt to spur policy change. Scholars and journalists often claim that riots cause short- and long-term changes in political mobilization, attitudes, and behaviors, both among riot participants and those exposed to the riot as observers or victims. Classic survey evidence has demonstrated that rioters ascribe political motivations to their actions (Sears and McConahay Reference Sears and McConahay1973), and scholars have argued that the series of riots in the 1960s caused shifts in the policy mood of the American electorate that had long-term consequences for national politics (Edsall and Edsall Reference Edsall and Edsall1992; Manza and Uggen Reference Manza and Uggen2006; Massey and Denton Reference Massey and Denton1988; Olzak, Shanahan, and McEneaney Reference Olzak, Shanahan and McEneaney1996; Rieder Reference Rieder1985; Wasow Reference Wasow2016; Western Reference Western2006). Similar claims have also been made about political violence in other countries (Beber, Roessler, and Scacco Reference Beber, Roessler and Scacco2014; De Waal, Reference De Waal2005; Hayes and McAllister Reference Hayes and McAllister2001). In the wake of continued violent protest in the United States and around the world, the subject of political violence has enduring importance.Footnote 1
But can riots actually change support for policy? Measuring the effect of a riot on public support for the policies said to motivate the rioters has been, as of yet, challenging. We address this question by examining local shifts in referendum voting on public goods targeted at urban-dwelling racial minorities after the 1992 Los Angeles riot. We find that the riot caused a shift in support for allocating these goods and that much of the shift is attributable to changes in mobilization among both African Americans and whites. We also find that this mobilization persists over time, evidence that the riot’s political consequences were long-term.
In order to identify the effect of the riot on support for local referenda, we need not assume the underlying causes of the riot are unrelated to downstream changes in policy support. Rather, we assume the riot was exogenously timed relative to events planned long before, namely, an upcoming primary election. The triggering event for the 1992 Los Angeles riots was a video recording of police brutality and the subsequent acquittal of the police officers involved. Although the riot was a nonrandom event, the timing of the video recording and subsequent trial and conviction were unrelated to the timing of a primary election. We combine this exogenous timing with a difference-in-differences analysis of pre- and postriot policy voting to control for secular trends in policy support. This gives our analysis causal leverage not found in most previous studies of political violence. We further interrogate the validity of this causal claim by examining the spatial correlation between changes in policy support and the epicenter of the riot. We find that these changes were much more strongly correlated with distance from the riot than from other locations in Los Angeles, including other African American population centers.
POLITICAL VIOLENCE AND PUBLIC POLICY
By examining how a riot affected support for public goods allocation, our study addresses the effectiveness of rioting as a political activity. In doing so, we broaden our understanding of how political activity may contribute to policy change, a question that typically examines more common political behaviors, such as voting, lobbying, or nonviolent protest. While such activities are often argued to be ineffective, especially for low-status groups (Gilens Reference Gilens2012) such as poor African Americans, we show that violent protest is an arguably efficacious political activity, insofar as it changes local policy support.Footnote 2
Not everyone views rioting as politically motivated and not all riot participants have the same motivations. However, social scientists often view rioting as a political act (e.g., Huntington Reference Huntington1968) and classic studies of riots show that participant aims include demanding redress for political grievances (Sears and McConahay Reference Sears and McConahay1973). Scholarly examinations of the 1992 Los Angeles riots tend to interpret the event as collective action against poor economic and social conditions, triggered by police brutality (Tierney Reference Tierney1994). Indeed, postriot polls indicated that 67.5% of African Americans in Los Angeles County viewed the riots as a protest against unfair conditions (Bobo et al., Reference Bobo, Zubrinsky, Johnson and Oliver1994). As such, in addition to immediate grievances such as police brutality, riots are often characterized as demands for policy reform (Fogelson and Hill Reference Fogelson and Hill1968). In the United States, these policies include spending on public goods benefiting the urban poor, including education, housing, and poverty assistance.
If participants riot in pursuit of policy, then understanding how riots affect policy support is important to understanding the effectiveness of rioting as a political tactic. Previous studies suggest that riots decrease support for racially liberal policies (Sears and McConahay Reference Sears and McConahay1973; Wasow Reference Wasow2016) or, conversely, that riots both increase negative attitudes toward the rioting group and increase support for the policies advocated by riot participants (Beber, Roessler, and Scacco Reference Beber, Roessler and Scacco2014). But because previous scholarship was limited to measuring posttreatment outcomes, considerable uncertainty remains about whether the riots actually caused these changes.
We concentrate on the effects of rioting on a local population. While the Los Angeles riots had national prominence, certain effects of the riot may have been localized—after all, a riot is a locally destructive event. Individuals close to the riot were more likely to be materially and psychologically impacted by the event and, as such, to be more motivated in the aftermath. Few studies have examined the localized effectiveness of a riot, rather than treating the events as part of a larger phenomenon (e.g., Western Reference Western2006). While this broader focus can be valuable, it might mask differences between local and distal effects: for example, while the consensus in the literature that a riot makes citizens unsympathetic to the rioters may be accurate on a national scale, local opinion may become more sympathetic because of shared identity, special knowledge of local circumstances, or fear of further unrest. Additionally, examining the effects of a riot on national-level opinion, while potentially important, overlooks that much policy, especially in the domains of welfare and education, is controlled at the local or state level.
THE 1992 LOS ANGELES RIOTS
On March 3, 1991, four white Los Angeles police officers were videotaped beating an African American man named Rodney King. On April 29, 1992, a trial that had been relocated from Los Angeles to homogeneously white Ventura County concluded with an all-white jury acquitting the four officers of all criminal charges.
Within hours of the verdict’s announcement, a series of violent and destructive incidents occurred around the intersection of Florence Avenue and Normandie Avenue in south central Los Angeles, a predominantly African American neighborhood. Reminiscent of the Watts Riots thirty years earlier, police officers abandoned the area, leaving residents to defend themselves against looters, arsonists, and widespread violence. For the next three days, the area suffered freeway shutdowns, suspension of municipal services, racially targeted violence, and destruction of property. The violence proceeded unchecked until May 3, when 3,500 federal troops arrived to supplement 10,000 members of the National Guard. On May 27, one week before the 1992 primary election, the last troops withdrew from the area. The Los Angeles riots had resulted in 54 deaths, more than 2,300 injuries, and over 11,000 arrests; estimates of material losses exceed $1 billion (CNN 2013).
Much of the violence was covered live on television by news helicopters, including the beating and attempted murder of white truck driver Reginald Denny as he attempted to drive through the intersection of Florence and Normandie. Contemporary accounts of the events describe great anxiety among the white residents of Los Angeles. In the aftermath came a flurry of reporting, often backed by survey data, speculating on the riot’s effects on public opinion. Major themes in the media included an increase in fear and a recognition that the living conditions of urban minorities needed to change (Toner Reference Toner1992).
This initial view of aggregate opinion suggests that the riot represented a profound experience for Angelenos. Whether and how those experiences translated into policy support and mobilization is our focus. Despite the fear and destruction caused by the riot, less than a month later, voters in Los Angeles went to the polls in a statewide primary election for elected offices and ballot propositions. To understand the effects of the riot on voting in this election and in subsequent elections, we exploit the timing of this event to study changes in policy support.
THE LOCAL EFFECTS OF VIOLENT PROTEST
In order to test for the localized effect of a riot on policy support, we focus our study on the area of Los Angeles County closest to the riot. Unlike previous studies of riots that rely on aggregate units, we exploit geocoded individual- and precinct-level data to measure the effects of the riot on voters at any proximity to its epicenter, including those who lived in the immediate vicinity. Using individual voters avoids problems of aggregation, such as the modifiable areal unit problem and problems of scale (e.g., Enos Reference Enos2017), that are common to this type of analysis.
Los Angeles County is very large: spanning an area as roughly as size of Connecticut, it is the most populous county in the United States. As such, treating the effects of the riot as uniform across this area may mask important variation. As a principled way of defining “local,” so as to avoid making arbitrary choices about the relevant distance from the riot, we focus on voters who are not separated from the riot by topographic features that may lower the salience of the riot. We thus limit our study to the area known as the Los Angeles basin, consisting of parts of the city of Los Angeles and other municipalities.Footnote 3 With this, we exclude areas of the county further away from the riot, such as the desert communities to the east, and from areas that were separated from the riots by physical barriers, such as residents in the mountainous areas or in the San Fernando Valley, who were separated from the riot by the Santa Monica Mountains. Unless otherwise noted, data we describe below are limited to this area, which is within approximately thirty kilometers of Florence and Normandie, the geographic origin of the riot.
We study two demographic groups: non-Hispanic whites and African Americans.Footnote 4 These groups had substantially different baselines in terms of preriot ideology and political involvement, as well as divergent on-the-ground and psychological experiences with the riot. African Americans, whether riot participants or not, were much more likely than whites to share a social identity with the rioters and perhaps to sympathize with their grievances. Whites were a priori less likely to share a social identity with the rioters or to agree with their actions. In a nationally representative survey fielded during the riot, when asked whether the violence of the riot “was justified by the anger that blacks in Los Angeles felt over the verdict in the trial,” only 17% of white respondents said it was, while 35% of African Americans did so.Footnote 5 The policy attitudes of the white population, compared to the African American population, were likely more heterogeneous, as most political conservatives in the area where white. In short, prior to the riot, whites, on average, would have been less likely to share the policy demands of the rioters than were African Americans.
To estimate the effect of the riot, we use differences in support on ballot referenda between June 1990 and June 1992. We attribute differences in support and other behavior before and after to the effect of the riot. This is necessarily a “bundled treatment” because a riot is associated with changes on a number of fronts, including psychological effects, media coverage, action by politicians, changes in property values, and reactions to the verdict. The purpose of this study was not to isolate the effect of each of these treatments, but rather to speak to the overall effects of a riot. As a large-scale collective political act, a riot is not unlike other such large-scale political acts, such as campaigns, where scholars have measured overall effects without identifying precise mechanisms. As such, we use the phrase “effect of the riot” as short-hand for the bundled effect of all the treatments associated with the violent protest.
The treatment effect we estimate is bundled in another sense. In addition to the direct effect of being proximate to the riot, other, more indirect, mass-mediated events associated with, but prior to, the riot, such as the beating of Rodney King or the subsequent trial, occurred during this period and could affect policy support. We assume, however, that these events did not affect voter behavior nearly as much as the riot itself: well-identified studies of events that receive large doses of media coverage, such as presidential campaigns, show that media exposure has minimal mobilizing effects (Huber and Arceneaux Reference Huber and Arceneaux2007). The persuasive effects of exposure to these mass communications is also short-lived, lasting only several days (Hill et al. Reference Hill, Lo, Vavreck and Zaller2013), not long enough to directly affect the voting behavior measured over a year after the beating itself and weeks after the end of the trial. This stands in contrast to the large and persistent mobilizing effects we observe here. Furthermore, as shown below, our estimates exhibit a spatial pattern that is consistent with a distinct effect of the riot itself, rather than a more general media effect. We also do not see changes in policy support in other parts of California that, while exposed to the beating and trial through media, were not proximate to the riot. Therefore, we believe that the effects we measure are likely attributable to the riot itself, not other associated events. Still, it is important to be clear that this bundle of treatments cannot be cleanly pulled apart.
We focus on support for spending on public schools as a public good, which is associated with African Americans and racial minorities more generally and is often implicated in the social welfare demands of riot participants. Public schools have long been part of policy debates over how to address urban social and economic problems, including in official reports in the aftermath of urban rioting (California Governor’s Commission on the Los Angeles Riots 1963). Research has demonstrated that demographic considerations play a role in opinions about public school spending (Hopkins Reference Hopkins2009), with the nonwhite composition of schools affecting white support for spending. In 1992, on the eve of the riot, the Los Angeles Unified School District was 72% non-Anglo-white. In areas near to the riots, public schools were even more nonwhite, with enrollment at the 20 schools closest to Florence and Normandie 55% African American and less than 1% white.Footnote 6
Our inferential strategy holds constant general attitudes about educational spending not associated with African Americans by comparing changes in support for public school spending to changes in support for university spending. We assume that attitudes about university spending are, at most, weakly linked to attitudes about African Americans and that funding higher education would not as widely be seen as a method of addressing problems made apparent by the riot. Thus, when white voters were asked to cast ballots with the demands of the African Americans rioters fresh in their minds, these demands would have no effect on votes about university spending. We believe this assumption is plausible: in our review of the literature, we found no scholarship claiming that attitudes about university spending were associated with attitudes about race or racial demographics.
The riot may have changed local policy support through several channels, including mobilization, a general change in ideology or political outlook, or by altering the considerations citizens use when voting. The latter refers to the fact that most citizens do not have well-developed policy attitudes and so, when citizens form opinions, they are influenced by recent salient cues (Sands Reference Sands2017; Zaller Reference Zaller1992) which have been shown to influence vote choice (Berger, Meredith, and Wheeler Reference Berger, Meredith and Wheeler2008). For citizens voting on questions of public policy so soon after the riot, the riot itself was likely one of these cues.
Effects on White Policy Voting
When the riot made salient to whites the policy demands of the rioters specifically, and African Americans more generally, in what direction might their support for spending on public schools move? We might expect a riot to increase support for spending by making white voters more aware of the needs of African Americans and the demands of the rioters. In particular, the signal generated by the extreme behavior of rioting may have caused them to update their opinions about the severity of the needs of the African American community. The riot may have also activated preexisting sympathy for these policy positions. Or, the destructiveness of the riot may have caused white voters to favor investment in programs that would prevent further violence (Beber, Roessler, and Scacco Reference Beber, Roessler and Scacco2014).
Among elites, there is a history of such reactions to riots in the United States. The Kerner Commission, formed by Lyndon Johnson, attributed the urban unrest of the late 1960s to a host of inadequate welfare institutions. The commission recommended reforms of social welfare programs to prevent further riots (United States National Advisory Commission on Civil Disorders 1968). A report after the 1963 Watts riots by a commission chaired by then-CIA Director John McCone made similar recommendations on reforms, including for improved schooling for African American children (California Governor’s Commission on the Los Angeles Riots 1963). After the 1992 riot, there is evidence that voters nationwide drew similar lessons. A series of postriot surveys found that 65% of respondents agreed that “the violence in Los Angeles…has made it more urgent to address poverty”Footnote 7 and that 51% wanted to see an increased emphasis on providing social services, as compared to 37% who supported an increased emphasis on promoting law and order.Footnote 8 Moreover, 38% of respondents desired more spending for minorities in urban areas, while only 13% preferred decreased spending.Footnote 9 Perhaps the voters of the Los Angeles basin were also moved by the logic of needing improved social institutions and, thus, more spending to prevent future riots.
However, when asked to make consequential decisions about spending rather than merely state preferences on a survey, would white voters of Los Angeles County, where the riot had the greatest impact, have the same liberal reaction? The literature offers reasons to predict that the riot would dissuade voters from spending on public goods associated with a racial out-group.
It is well established that individuals display in-group bias in attitudes, behaviors, and resource allocation, all else equal (Fiske Reference Fiske2000). This behavior, repeatedly observed in the laboratory, is often cited as one of the primary reasons for the well-established finding that diversity is negatively correlated with public goods provision cross-nationally (Alesina and Zhuravskaya Reference Alesina and Zhuravskaya2008; Enos and Gidron Reference Enos and Gidron2016; Habyarimana et al. Reference Habyarimana, Humphreys, Posner and Weinstein2009). Scholars have drawn direct connections between local ethnic diversity and the willingness of voters to allocate funds for public goods, including schools (Alesina, Baqir, and Easterly Reference Alesina, Baqir and Easterly1999; Rugh and Trounstine Reference Rugh and Trounstine2011).
Furthermore, research has shown that whites in the United States draw on negative stereotypes about African Americans when forming policy attitudes about benefits perceived to disproportionately target members of that racial group (Gilens Reference Gilens1999). In laboratory experiments, making salient race or other group-based identities leads to group-based discriminatory attitudes and behaviors (Enos and Celaya Reference Enos and Celaya2019; Reicher et al. Reference Reicher, Templeton, Neville, Ferrari and Drury2016; Sidanius and Pratto Reference Sidanius and Pratto2001). With negative stereotypes made salient by the televised images of violence and looting, it is possible that whites drew on these stereotypes when asked to make decisions about allocating to public schools. With this substantial literature in mind, we might also predict that the riot, which brought attitudes about the out-group to bear on voting decisions, would precipitate a decrease in support for those public goods.
Effects on African American Policy Voting
African Americans’ perspectives on the riot were likely different from those of white voters because a group with whom they share a racial identity participated in widespread violent protest. Given the strong connection between group identity and policy attitudes, grounded in shared history (Dawson Reference Dawson1995), the riot may have increased African Americans’ awareness of in-group policy demands, thereby causing a shift in attitudes.
Salient political events, such as electoral campaigns, can help citizens learn about the policy preferences of groups with which they share an identity. This learning process can bring attitudes into line with the dominant attitude of the group (Lenz Reference Lenz2013). This might occur because voters use group membership as a heuristic for the “right attitude,” which they adopt upon learning about the group’s preferences (Cohen Reference Cohen2003). The salient politicized event of a riot could serve the same function as a campaign: as the policy demands of the rioters are extensively covered by the media and transmitted through social networks, the attitudes of people who identify with the rioters may change to reflect these demands. Of course, African Americans in Los Angeles may have already had largely liberal policy preferences and attitudes that were crystallized before the riot; if so, the riot itself may have little or no effect on their attitudes. However, we think it unlikely that the riot could cause a decrease in support for spending among African Americans.
DATA AND ESTIMATION PROCEDURE
We analyze paired ballot initiatives related to funding for education. To isolate the effect of the riot, we examine votes on two related sets of public goods: public schools, which were closely linked to African Americans and may have been seen as a way to address to policy concerns of the rioters, and universities, which were not linked to African Americans and were, at most, a very indirect way to address the policy concerns of the rioters.
We focus on four initiatives that appeared on the ballot in the two June elections: Propositions 121 and 123 in 1990 and Propositions 152 and 153 in 1992. These propositions are summarized in Table 1. We leverage the symmetry of ballot initiatives from 1990 to 1992. Both elections include both a public school and a university education initiative. Moreover, the monetary amounts associated with both 1992 initiatives are approximately twice the 1990 amounts.
Summary of Ballot Initiatives
We estimate a difference-in-differences from these four ballot initiatives:
 $$\eqalign{{\rm{EdDif}}{{\rm{f}}_i} = \left( {{\rm{PubSchoo}}{{\rm{l}}_{i1992}} - {\rm{PubSchoo}}{{\rm{l}}_{i1990}}} \right) - \cr\left( {{\rm{HigherE}}{{\rm{d}}_{i1992}} - {\rm{HigherE}}{{\rm{d}}_{i1990}}} \right).$$
PubSchooli1992 indicates precinct i’s support for the public school initiative in 1992, measured as the votes cast in support of that ballot initiative divided by the total ballots cast. The same convention holds for PubSchooli1990, HigherEdi1992, and HigherEdi1990. Thus, EdDiffi is the change in support for public schools in precinct i between 1990 and 1992, net the change in support for universities. Our primary quantities of interest are the population-weighted mean of EdDiffi for all voters, and for white and African American voters separately. By “differencing out” the change in support for universities from the change in support for public schools, we substantially reduce the threat of omitted variable bias.
Our estimate of the effect of the riot on public school spending would be biased if there were a shock to support for university funding between 1990 and 1992 that was not also a shock to public school funding. For example, a change in the composition of the local electorate could be problematic if voters in one year prioritize one type of education spending over the other for reasons unrelated to the riot. It is possible that such changes in the composition of the electorate could be induced by changes in the competitiveness of contests across elections. In Online Appendix A, we explore this possibility by subsetting our analysis based on competitiveness and are able to rule out this potential source of confounding. We also show that there are no shifts similar to those we observe in Los Angeles County elsewhere in the state, indicating that the validity of our design is not threatened by statewide shocks.
Because our estimation strategy nets out any secular change in, for example, voter ideology, we believe we have isolated the change in support for public schools that is due to the riot. To further isolate the effect of the riot, we also check for correlations between EdDiff and distance from the riot. As noted below, significant correlations between these variables give us confidence that we are isolating the riot’s effect; for an omitted variable to bias our estimate, it would have to be correlated with both distance and EdDiff.Footnote 10
To acquire precinct-level data, we digitized vote returns from the Los Angeles County Registrar-Recorder County Clerk’s Elections Division. These data allow us to examine the general effects of the riot. However, while we know the total vote outcomes and the racial demographics for each precinct, to understand the distinct voting patterns of different racial groups requires individual-level vote data. This presents an “Ecological Inference Problem” (Robinson Reference Robinson1950). We use the Ecological Inference methods developed by King (Reference King1997) to isolate behavior by racial group. While, as with all estimation techniques, this method relies on assumptions for validity, the technique has been validated on well-known problems (O’Loughlin Reference O’Loughlin2000) and used for inference in other important questions (Enos Reference Enos2016). We discuss the assumptions as they apply to our data in Online Appendix B.
The inputs to the EI model are the proportion of whites, African Americans, Hispanics, Asians, and others in each precinct, and the proportion of Yes votes out of total ballots cast for each initiative. The outputs are estimates of what proportion of each group voted Yes on a given ballot initiative, for each precinct in our data. With these outputs, we separately measure EdDiffi for whites and African Americans using the equation above.Footnote 11 Our measures of precinct-level demographics, including the racial characteristics of each precinct, come from the California Statewide Database, which merges local voter files and decennial US Census data with precinct geographies to create demographic counts by precinct. To account for the uncertainty in the EI estimates, we weight all group-specific estimates by the inverse of the standard errors of the EI estimates (Adolph et al. Reference Adolph, King, Herron and Shotts2003; King Reference King1997). Our final precinct-level dataset consists of 1,676 precincts.Footnote 12
To explore mobilization, we use data from the 1992 Los Angeles County voter file, which include 3,743,468 registered individuals, and contains address, gender, age, and party registration information for each person. We also use these data to geocode precincts because precinct-level GIS data from this time period do not exist; we geocode every address from the 1992 Los Angeles County voter fileFootnote 13 and calculate population-weighted precinct centroids from the addresses of every voter in the precinct. To validate these geocodes, a team of research assistants used Google Earth to digitize precinct maps. This geocoding procedure allows us to measure the distance of voters and precincts from the riot and to validate our claim that changes in policy support were caused by the riot. We measure the geospatial distance between the origin of the riot at Florence and Normandie and the interior centroid of the voting precincts used in our analysis.Footnote 14
We supplement the voter file with imputed information about the voters’ race by merging the voter file with two additional data sets: 1990 Census Block-level race and ethnicity data, and the Census surname list, which indicates the probability of belonging to each race given a surname. Using the surname probability as a prior, we apply Bayes’ Rule to compute the posterior probability that an individual is White, Hispanic, African-American, Asian, Native American, or other, conditioning on their address and surname (Enos Reference Enos2016).Footnote 15 From this vector of posterior probabilities, we identify the race with highest probability and use it as the imputed race of the voter.
Such imputations have been successfully validated in prior research: comparing imputed race to self-reported race using the Florida voter file, Imai and Khanna (Reference Imai and Khanna2016) show a false-positive rate in identifying African American registrants of less than three percent. The Los Angeles basin is more racially segregated than Florida, which increases the accuracy of imputation, and we are confident that by incorporating geography into race imputations our imputations are similarly accurate (see Online Appendix H for details).
Mobilization Data
From the 1992 voter file, we measure the change in partisan registration between the period just before to the period just after the riot. We do this by comparing a one-week window on either side of the riot, which lasted from April 29 to May 3. This means we compare a preriot period of April 22 to April 28 and a postriot week of May 4 to May 8. In the preriot week, we omit the Saturday and Sunday of April 25 and 26. Note that these periods contain the same days of the week, which is advantageous because registration tends to vary by day of the week.
However, if voters are more likely to register in weeks closer to the registration deadline, our pre–post comparison may be confounded. The coincidence of the timing of the riot vis-à-vis the voter registration deadline of May 4 allows us to overcome this problem. Because the riot occurred in the days leading up to the registration deadline and prevented people from registering, election officials announced after the riot that they would extend the registration deadline by four days. This provides a unique opportunity because it means there are two roughly equal periods of time prior to the registration deadline. Prior to the riot, citizens had no way of knowing that the deadline would be extended and thus would register as normal. After the riot, a new deadline appeared and everyone who was motivated to register because of the riot was able to do so. In this way, we can capture the marginal effect of the riot on the propensity of certain groups to register, while controlling for seasonal and other unobserved trends that also affect registration.
Attitude Data
We use individual-level survey data from the Los Angeles County Social Survey (LACSS) to measure attitude change. The LACSS, conducted annually from 1992 to 1998 (University of California, Los Angeles. Institute for Social Science Research 2011), captured a county-representative sample generated by Random Digit Dialing. The 1992 LACSS, themed “Ethnic Antagonism in Los Angeles,” provides a picture of racial attitudes and policy preferences expressed by a random sample of Angelenos before and after the riots. By coincidence, the verdict and the riot occurred in the middle of survey implementation, enabling us to leverage variation in survey responses recorded immediately before and after this exogenous shock, as done by Bobo et al. (Reference Bobo, Zubrinsky, Johnson and Oliver1994).
Long-Term Data
Finally, to examine long-term partisanship and participation, we merge the 1992 Los Angeles County voter file with a statewide California voter file from 2005. This was the earliest voter file we could obtain that included voter turnout data. By examining names, gender, and date of birth of the 30,166 voters who registered in the 10 weekdays before and after the riot, we successfully locate 15,244 of them in the 2005 file. Our calculations suggest that after accounting for voters who moved out of state, died, or changed their name, we successfully locate a high proportion of our sample who were still registered in 2005. We detail this matching process in Online Appendix F.
RESULTS: CHANGES IN POLICY SUPPORT
We first consider the change in Angelenos’ support for public school spending as a result of the riot. If, on average, the riot served as a negative shock to support for public school funding, then the mean of EdDiffi should be negative. If instead the riot served as a positive shock for support public school funding, then the mean of EdDiffi should be positive. These results do not rely on ecological estimates and, therefore, there is no model-based uncertainty around the result.
The distribution of EdDiffi is displayed in the top panel of Figure 1. The vertical dotted line is at the mean of the distribution. Pooling together all precincts in the Los Angeles basin, we see a population-weighted mean EdDiffi of 0.049 (95% confidence interval: [0.037, 0.061]), indicating that average support for public schools, net of the change in support for higher education, increased.Footnote 16
Histograms Represent the Distribution of EdDiffi for all Voters (Top), Whites (Middle), and African Americans (Bottom) for 1,676 Precincts in the Los Angeles Basin. Positive Values Represent an Increase in Support for Public Schools, Net of Changes in Support for Universities. The Dashed Vertical Line is the Weighted Mean of the Difference-in-Differences
Voters proximate to the riots experienced a large positive shift in their support for public schools, accounting for their overall shift in support for education. Because public schools are a public good closely associated with issues related to the riot and to the social identity of the rioters (as African Americans), this provides initial evidence that the riot was effective in generating support for the rioters’ policy demands.
Comparing these results to the same difference-in-differences in other parts of California bolsters the claim that this effect is due to the riot and not events associated with the riot or other unmeasured shocks. The county-wide difference-in-differences for Los Angeles County was 0.003. The statewide difference-in-differences was also close to zero (−0.004) and the county-level difference-in-differences in other large, urban counties not experiencing the riot, such as Alameda County (−0.004), San Diego County (−0.007), and San Francisco County (−0.009), were also close to zero. These other counties were exposed to the mass-mediated events of the televised beating and the trial, but were not exposed to the treatment of having such a large and damaging riot nearby.
Results by Race
The weighted means for both whites (0.028, CI: [0.018, 0.039]) and, especially, African Americans (0.073, CI: [0.066, 0.081]) demonstrate an increased willingness to pay for public schools relative to universities (see bottom panels of Figure 1). Also evident in Figure 1, the distribution of EdDiffi is wider for whites than it is for African-Americans, reflecting more variation in responses to the riot, as might be expected given more preriot heterogeneity among white voters in terms of distributive preferences.Footnote 17 The larger and more uniform shift by African Americans compared to whites is consistent with the claim that these changes are responses to the riot and not something else, and suggests that a significant portion of the effect of violent protest on policy support comes from rallying support from people sharing an identity with the rioters, rather than from gaining support from outside groups.
This initial evidence establishes that a riot can be locally effective in driving policy support, whereby members of the public, even those ostensibly the target of the riot (whites) and especially those sharing an identity with the rioters (African Americans), vote in accordance with the preferences of the rioters.
Changes in Policy Support by Distance from the Riot
We now present tests designed to better establish that the changes we observe were caused by the riot itself and are not a spurious association. Because we lack sufficient data to show parallel trends—the standard validity check in difference-in-differences analyses—we turn instead to correlations between distance from the riot and the magnitude of change in policy support to buttress our causal claims and provide evidence that the effect we identify is driven primarily by the riot rather than other events that occurred in this period.
Because the salience of an event often varies with a subject’s proximity to that event (Latané Reference Latané1981), if changes in policy support were caused by the riot, then we would expect these changes to be correlated with distance from the riot. Note that the direction of this effect may cut both ways; changes in support for public schools may increase or decrease with distance. Since the overall effect of the riot was an increase in support for school spending, we might expect this increase to be largest nearer to the center of the riots. However, there could be psychological forces that diminish as proximity to riot increases: research has demonstrated that traumatic events, such as violence, can induce increased discrimination toward the out-group because of basic psychological motivations to look to the in-group for protection during threat (Navarrete and Fessler Reference Navarrete and Fessler2005) or because fear induces a need for belief-reinforcing self-esteem (Greenberg, Pyszczynski, and Solomon Reference Greenberg, Pyszczynski and Solomon1986).
To examine the relationship between distance and EdDiff, we plot distance from Florence and Normandie against the population-weighted precinct-level estimates of EdDiffi in Figure 2. The overall negative linear trend suggests that those who live closer to the riots experience a greater increase in their support for public schools than voters who live further away. In Online Appendix C, we show analogous plots for white and African American voters, respectively, using EI-derived precinct-level estimates, showing similar negative linear trends. We also estimate weighted precinct-level regressions treating EdDiffi as our dependent variable and distance as our explanatory variable for all voters, as well as for white and for African American voters separately. As is expected from Figure 2, the estimated coefficient on distance for voters is negative and statistically significant.
A Loess Line and Scatterplot Displaying the Relationship Between Each Precinct’s Distance From Florence and Normandie and that Precinct’s EdDiff Values for all Voters in 1,676 Precincts in the LA Basin. Points are Sized, and the Loess Line Weighted, by the Voting Age Population in Each Precinct
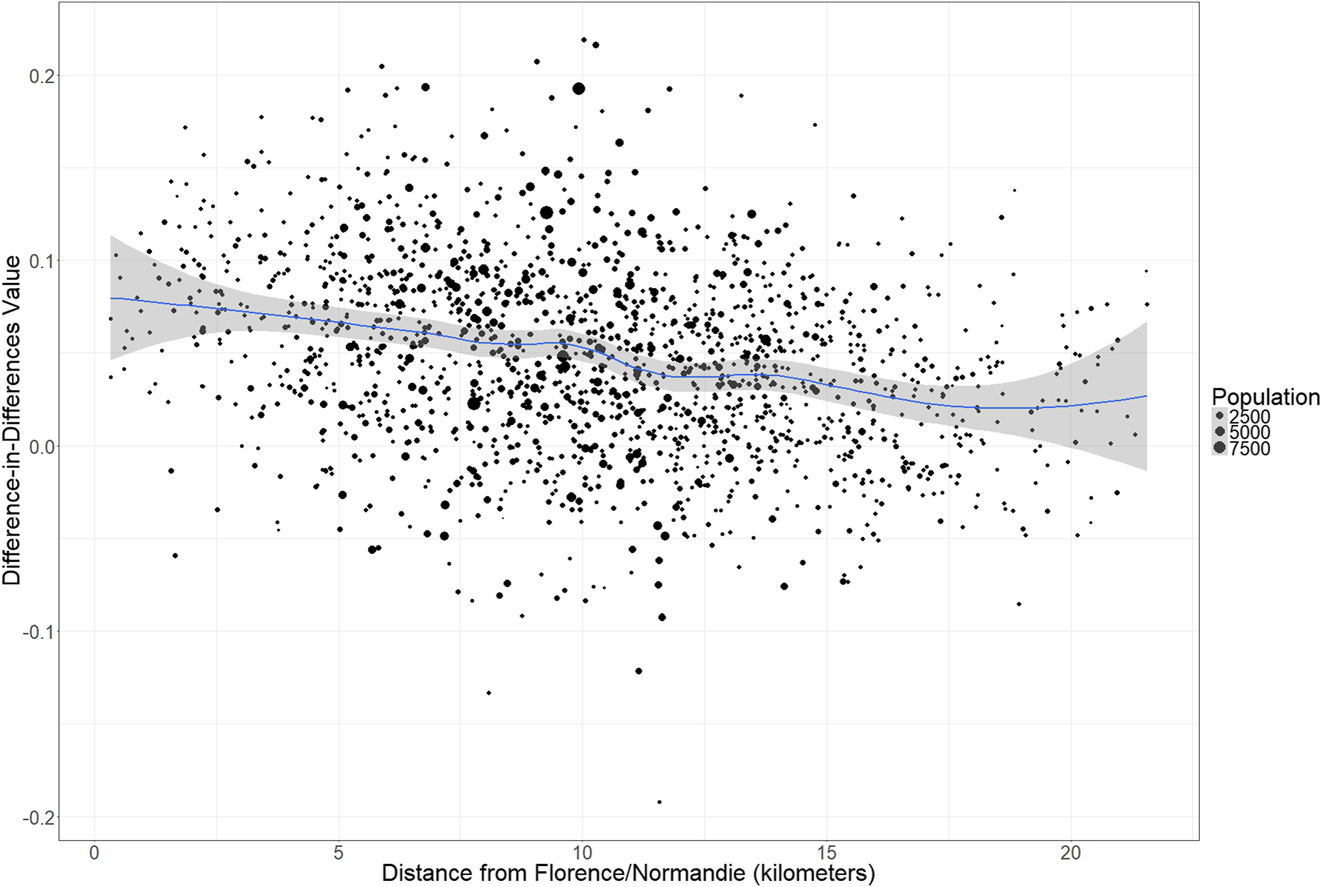
That policy support change is correlated with distance from the riot reinforces the claim that the observed shifts were in response to the riot and not to some spurious variable. In order for an observed or unobserved variable to threaten the validity of our analysis, it must be correlated with both EdDiff, the difference in the change in voting over time, and with our measure of distance from the riots. Furthermore, this is evidence that the effect we measure in EdDiff is the effect of the riot itself and not of other related events, such as the media coverage of the trial or the beating: these treatments were applied to all residents of Los Angeles and California equally via their television sets, and would not be correlated with distance from the location of the riot.
Changes in Policy Support by Distance from Other Places in Los Angeles
As a placebo test, we check for relationships between EdDiff and distance from locations other than Florence and Normandie. In particular, we test for a similarly strong correlation between distance and other areas in Los Angeles County with a high concentration of African Americans. This allows us to look for changes in behavior of African American voters generally or for changes in the behavior of white voters living near large concentrations of African Americans, other than those near the riot. Such a relationship would be evidence that something other than distance from the riot is shaping behavior, perhaps a “threat effect” of being proximate to an out-group (Enos Reference Enos2016), rather than to the riot itself.
To do this, we define a geographic area affected by the riot by drawing a one standard deviation ellipse (Wang, Shi, and Miao Reference Wang, Shi and Miao2015) around the locations of all deaths attributed the riot.Footnote 18 We then take the top quartile of precincts in all of Los Angeles County in terms of number of black voters, yielding 972 precincts, and overlay the location of these precincts with the ellipse defining the area affected by the riot to determine if they are inside or outside the “riot area,” so defined. Then, as we did in Figure 2 for distance from Florence and Normandie, we calculate the distance to each of these top quartile black precincts from every other precinct in our data. For each of these precincts, we regress EdDiff on distance using these alternative distance measures. We then compare the magnitudes of the resulting coefficient estimates for precincts inside of the riot area and precincts outside of the riot area.
The mean coefficient on distance for precincts inside the riot area is −0.02 and outside is −0.01. A t-test for difference of means of these distributions yields t = 10.70, indicating that the magnitude of coefficients in the riot area are significantly larger than those outside the riot area. In Figure 3, we display these coefficients on a map. Each of the high population African American precincts is marked by a point that is scaled by the absolute value of the coefficient on distance estimated from regressing EdDiff on distance from that point, with larger points indicating larger coefficients. The black ellipse marks the area most affected by the riot. Note that the coefficients on distance from other concentrations of African Americans are small compared to those in the riot area. For example, those west of the riot in the Venice neighborhood or northeast of the riot in the Pasadena area are relatively small. This is further evidence that it was the riot itself, rather than associated events that presumably would have affected residents in other areas similarly, that caused the shift in voting behavior.
Relationship Between Distance and Other High African American Populations. The Black Ellipse Defines an Area Most Affected by the Riot. Larger Points Indicate Larger Absolute Values of the Coefficients From the Regression where Distance From the Indicated Points is the Independent Variable and EdDiff is the Dependent Variable
EXPLORING POSSIBLE MECHANISMS FOR INCREASES IN POLICY SUPPORT
We have shown that Los Angeles voters increased their support for spending on public schools after the riot, holding constant support for spending on education more generally. Public education is a policy area associated with urban poverty and implicated in the demands of the rioters. This change, we claim, was a reaction to the riot, implying that violent protest can be locally effective in increasing support for policy demands. We demonstrated that the change in support was much greater for African Americans than for whites, that changes in support were correlated with distance from the riot, and that changes in support were more weakly related to distance from other locations.
We now turn to testing the mechanisms for this phenomenon by examining attitude change, moving and demobilization, and increases in mobilization. While we cannot establish definitive connections between these variables and shifts in policy support, we believe the data more convincingly point to mobilization as the primary driver of the change.
Attitude Change
The LACSS data, the collection of which spanned the weeks surrounding the riot, allow us to test whether changes in aggregate policy support were accompanied by changes in attitudes among survey participants. Detailed analysis for this section can be found in Online Appendix D. The validity of our claims in this section rests on the assumption that those selected to be surveyed prior to the verdict are not systematically different from those sampled afterward. To test this assumption, we examine balance on available covariates separately for whites and African Americans before and after the riot. The white sample is small (n = 185) and fails this balance test. As such, we do not examine changes in white policy attitudes. African American subjects, on the other hand, are well balanced across pre- and postriot samples and comprise a sufficiently large sample (n = 426).
Regressions based on these survey results suggest that, despite changes in aggregate voting behavior, African American support for spending on “improving our nation’s education system,” as well as ideology on a liberal to conservative scale, remained constant postriot, suggesting that attitude change is not responsible for the shift in policy support by African Americans.
Moving and Demobilization
Another possible explanation for changes in policy support is that citizens exited the electorate due to the riot or to other, nonriot related, factors occurring at the time. Citizens may have moved, or simply “hunkered down” after the violence. Perhaps, for example, citizens opposed to spending on public education disproportionately moved out of the basin after the riot. Although difficult to test directly, we believe it is implausible that citizens relocated en masse within the brief intervening time period between the riot and the June election.
On the other hand, that citizens hunkered down and chose not to participate because of the riot seems more plausible. If this occurred, it would be evident in changes in voter turnout rather than registration rates. Hunkering down is not immediately apparent in the data: turnout among registered voters in Los Angeles County increased by 10.6 percentage points between the 1990 and 1992 June elections. However, changes in turnout must be considered in light of secular changes that typically occur between a midterm election year, like 1990, and a presidential election year, like 1992. Because turnout will be higher in a presidential year, decreases in turnout caused by the riot may have been masked by this secular trend. However, this does not appear to be the case in Los Angeles County because the increase in turnout between 1990 and 1992 was unusually high: it was higher than the average change of 6.0 percentage points in the next five largest California counties.Footnote 19 This 10.6 percentage point increase was also higher than the average change in turnout in Los Angeles County between the two previous midterm and presidential primaries (2.1 percentage points) and the following two midterm and presidential primaries (7.6 percentage points). Contrary to a hunkering down mechanism, it appears that voter turnout did not decrease in Los Angeles because of the riot, and in fact increased dramatically. This leads us to suspect that a change in mobilization, rather than moving or demobilization, is the more likely cause of aggregate change in policy support.
Mobilization
Salient political events, such as elections, can cause voters to become active in politics through increased voter registration (Meredith Reference Meredith2009). Could citizens have become politically active because the riot raised their interest in politics, or because politicians used the riot to mobilize voters?
On the one hand, the riot may have mobilized African American voters who saw members of their in-group intensely involved in politics, serving as a cue for the importance of political involvement or allowing for network effects to activate political participation. Violent protests in Ferguson, Missouri, in 2014 and Baltimore, Maryland, in 2015 were followed by other forms of political participation in African American communities, such as continued protest via the Black Lives Matter movement. On the other hand, the scholarly literature also describes riots as a form of political action undertaken because other forms are ineffective or unavailable (Sears and McConahay Reference Sears and McConahay1973). Thus, it is possible that African Americans, having turned to rioting because of frustration with more mainstream forms of participation, will not be mobilized by the riot into mainstream politics.
White voters may also be mobilized by the salient political event of the riot, but the ideological direction of the mobilization is less clear than for African Americans. Both conservative and liberal politicians may have exploited the event to register sympathetic voters. While previous scholarship finds that African American political activism, especially when violent, leads to a conservative backlash in voting among whites, these studies do not explore voter registration and so it is unclear whether this backlash comes from newly mobilized voters. Alternately, low-propensity voters are also more likely to be Democrats (Enos, Fowler, and Vavreck Reference Enos, Fowler and Vavreck2014), so it may be previously unregistered Democrats who are most motivated by riots causing a liberal uptick in registration.
Because we measure mobilization through changes in voter registration, we cannot separate political conversion, where voters who would have registered anyway register with a different party, from pure mobilization, where voters who would not otherwise have registered do so because of the riot. However, in the survey data, we see little ideological change among African Americans and, as we show below, levels of new registration were unusually high after the riot. Thus, we have some reason to believe our findings primarily reflect pure mobilization rather than conversion.
The riot appears to have a significant mobilizing effect. We calculate that in the week after the riot, despite the passage of the original registration deadline, 24,587 Los Angeles basin residents registered to vote. In the 20 weeks leading up to the riot, the mean number of registrants per week was 3,614 and the median was 3,292. In the week immediately prior to the riot, with the registration deadline looming, 5,579 people registered.
A question remains as to whether this spike in registration was simply due to pent-up demand, i.e., a result of those who would have registered anyway but were prevented by the riot from doing so, or whether it reflects those who would not have otherwise registered in the absence of the riot. Definitively isolating these two groups is impossible, but comparisons to other elections suggest that this spike reflects registration by those who would otherwise not have registered. The 2004 presidential primary in California provides a reasonable baseline because, as in 1992, the primary election involved choosing a Democratic candidate to run against an incumbent Republican president in the general election. Prior to the 2004 presidential primary, 31% of Angelenos who registered in the four weeks prior to the deadline did so in the last five weekdays leading up to the deadline. Meanwhile, those who registered in the five weekdays before the new post-riot registration deadline in 1992 represent 45% of those who registered in the preceding four weeks. In Online Appendix E, we extend this comparison to registration in 1990 and between 2003 and 2005 and show the postriot registration surge was unusually high compared to other years.
Not only did the riot appear to be a mobilizing force but also it appears to have registered a different demographic than those registering in the absence of a riot. Using the covariates available in the voter file, we observe systematic differences in the composition of those who registered just before and just after the riot. We summarize these data in Table 2. Notably, compared to those registering before the riot, those registered after the riot are of similar age, but are more likely to be African American, less likely to be white, more likely to be female, and more likely to live closer to Florence and Normandie. The increased registration of people in these demographic groups is consistent with a mobilizing effect of the riot, and the increased mobilization of African Americans geographically close to the riot who are more likely to be low income than those further away is consistent with the mobilization of a group concerned with a particular interest in public primary education. This helps to explain how mobilization could cause the shift in support for primary education funding relative to higher education funding.
Demographics of Registrants Immediately Before and After the Riot. The “Before Riot” Column Includes New Registrants on the Five Weekdays Before the Riot (4/22–24 and 4/27–28) and the “After Riot” Column Includes the Five Weekdays After the Riots (5/4–8). All Variables are Proportions, Except for Age (years) and Distance (meters). Race Proportions are Calculated by Drawing From Registrants’ Imputed Posterior Race Probabilities
We also examine whether the probability that new voters register as Democrats or Republicans differs in the riot’s aftermath. We display these results in Table 3, where Pr(Reg Republican) is the proportion of registrants who affiliated with the Republican party out of the total new registrants for the two parties, and Pr(Reg Democratic) is the proportion who registered as Democrats. Consistent with the overall liberalizing effect of the riot, both white and African American voters decreased Republican registration and increased Democratic registration; however, given the already very high Democratic identification among African Americans voters, the changes among this group are small.Footnote 20
Post-riot Partisan Shift among New Voter Registrations by Whites and African Americans. Partisanship Probabilities by Race are Calculated by Drawing from Registrants’ Imputed Posterior Race Probabilities. P Values Generated by t-test for Difference of Means

How much did this mobilization contribute to the change in policy support? Our ballot data indicates that in 1990, 10,710 individuals in the LA basin voted for or against higher education bonds but abstained from voting one way or the other on public school bonds. By 1992, however, 17,301 more ballots were cast on the public school bond initiative than the higher education bond initiative. Although it is impossible to determine precisely how much of this 28,011 vote difference was due to the mobilizing effect of the riot, we note that the 24,587 people registered in the wake of the riot could represent a large portion of that shift.Footnote 21 Furthermore, a relatively large proportion of new registrants were African Americans, the voters who appear to have shifted the most in support of public schools based on the precinct results.
As noted above, the riot may have increased mobilization through a variety of channels and, as such, is a bundled treatment. The increase could come from a piqued interest in politics that results directly from the riot or from the indirect effect of politicians using the riot to mobilize supporters. However, these shifts are particularly notable because such large-scale changes in party registration over this short of a period do not usually occur in modern American politics (e.g., Erikson, MacKuen, and Stimson Reference Erikson, MacKuen and Stimson2002; Green, Palmquist, and Schickler Reference Green, Palmquist and Schickler2002), suggesting that the riot had dramatic political consequences.
LONG-TERM SHIFTS IN REGISTRATION AND PARTICIPATION
Not only was the apparent change in mobilization caused by the riot dramatic, but this mobilization might have downstream significance as those mobilized may remain active in politics and influence electoral outcomes at a later date. We check for the long-term persistence of both party identification and voter participation among those mobilized by the violent protest to get a glimpse of the long-term impact of the protest. Voters are socialized by salient events that shape their long-term partisanship, so we might believe that voter registration resulting from the riot will show greater partisan stability than usual. However, the riot being an extraordinary event, possibly used by politicians to register voters who would otherwise not be registered, might mean that voter participation activated by the riot will wane over time. If the mobilization from the riot appears short-lived, this arguably reduces the significance of the mobilization we attribute to the riot. But, if the mobilized voters remain active, this suggests that the riot may have long-term significance.
Merging the 1992 voter file with the 2005 file allows us to observe the behavior of those exposed to the riot, over a decade after it occurred. In Table 4, we show changes in party registration probabilities between 1992 and 2005 for white and African American voters, among those who registered immediately before or after the riots. Both white and African American voters who registered after the riots were more likely to register as Democrats, and less likely to register as Republicans, in 1992. Looking at those same individuals in 2005, party registration is highly consistent, with those registering after the riot, regardless of party, as likely, if not more likely, than those registering before to have the same partisan affiliation in 2005 as they did in 1992.
Long-Term Partisan Stability for Those Registering Pre- and Postriot. Proportion of Party Registrants in 2005 by Registration in 1992, Separately for Whites and African Americans Registering Before and After the Riot. Numbers of Registrants are Reported in Parentheses. Columns Totals Do Not Add up to 100% Because of Movement to Minor Parties or Non-declared

Among white voters, 82% of Democrats and 77% of Republicans registering after the riot kept their party affiliation, comparable to those registering before the riot. For African Americans, 87% of Democrats registered after the riot remained Democrats. This is identical to the stability for Democrats before the riot and higher than the stability for whites. African American Republicans show considerably less stability, but their number is small.
We can benchmark this degree of partisan stability against results reported in Green, Palmquist, and Schickler (Reference Green, Palmquist and Schickler2002), who argued that partisan identity is a social identity after comparing its long-term stability to other important identity categories, such as race and religion. Using survey panel data, they report that between 1992 and 1996, 78% of partisans kept their same affiliation. In our data, those registering in Los Angeles in 1992 in the wake of the riot were at least as likely, if not more likely, to keep their same partisan affiliation.
Having established that the people who registered just after the riot differ from those who register just before, and that the latter’s partisan affiliations largely persist years later, we turn to the question of long-term participation. In tables in Online Appendix G, we examine the difference in turnout in the 2004 primary and general elections for those registering before and after the riot by regressing turnout in those elections on a variable indicating whether an individual registered immediately before or after the riot. Notably, both with demographic controls and without, for both whites and African Americans, over 10 years after the riot the estimated coefficient on registering before or after the riot does not attain statistical significance, and, in several cases, is a precisely estimated zero. This indicates that those who were motivated to register by the riot voted just as regularly as those registering under normal circumstances, even when holding constant demographic differences. This is true even in primary elections where participation is often limited to the most politically active citizens. Combined with the stability of partisanship, the long-term mobilization of postriot registrants as regular participators is a sign of the potential long-term significance of the riot: citizens appear to have joined the party sympathetic to the demands of the rioters and not only remained in that party, but remained active voters. If the shift in policy support observed in the referendum voting remains reflected in the long-term vote choices of these citizens, this speaks to the long-term ability of rioting to affect policy support.
DISCUSSION
This study provides evidence for a plausible effect of violent protest on local policy support. Our results indicate that a riot can help build support for policy or symbolic goals by mobilizing supporters or building sympathy among others. We demonstrate that white and African American voters were mobilized to register, that new registrants tended to affiliate as Democrats, and that voters shifted their policy support toward public schools, net of a general shift in support for education spending. This mobilization appears to have persisted: those mobilized by the riot remained regular participators over a decade later and remained more Democratic than the general population, even after accounting for demographics.
Yet, our policy support finding is somewhat inconsistent with previous literature. In both the US and other contexts scholars have found that political violence is associated with a “backlash” effect; voters behave unsympathetically toward the perceived rioting group. In the United States, this means increased support for socially and politically conservative candidates and policies. A common argument in the literature is that the string of riots in the 1960s caused large swaths of white voters to abandon support for the liberal welfare state, which, especially since the Great Society of Lyndon Johnson, had been rhetorically framed around curing inner-city poverty associated with African Americans. Those riots are said to have caused changes in partisanship and voting behavior that ushered in the rise of Nixon and Reagan-era conservatism that still affects American politics today.
There are numerous plausible explanations for the differences between our findings and prior research. For example, it may be the case that the series of riots in the 1960s had nonlinear effects; perhaps, while a single riot invokes sympathy, a series of riots provokes backlash. Similarly, the difference between local and nonlocal effects may also be consequential: those observing the riot from afar may lack sympathy because they do not share an identity with the rioters. Furthermore, much of the previous literature examining the political effects of urban riots in the United States neglects whether those riots helped galvanize African American voters, a population that could be consequential in local policy voting, especially given the large populations of African Americans in the areas where riots occurred. Of course, the divergence between local support and nonlocal backlash could affect the overall efficacy of violent protest.
Our findings may also differ because of the distinct context of the riots being studied—perhaps, Los Angeles was unusually sympathetic to demands of the rioters. However, this explanation is unlikely given that Los Angeles County in the early 1990s was the type of place in which one would a priori expect a backlash against a riot. At that time, Southern California was considered a conservative stronghold in a Republican-leaning state; between 1900 and 1992, California elected only three Democrats as governor.
Theoretical and contextual considerations aside, there may also be methodological reasons to explain the differences. Despite making widespread claims about the effects of riots, most previous studies lack reliable evidence about whether riots actually cause the changes ascribed to them. To our knowledge, there have been no well-identified studies of the effects of violent protest on policy support.Footnote 22 Rather, to understand the effects of riots, scholars have had to depend on posttreatment measures of single riots or cross-sectional studies of riots across multiple cities. Such cross-sectional studies must rely on the strong assumption that a riot’s occurrence is uncorrelated with other variables that may affect politics downstream. Given that policy-oriented and scholarly accounts of riots treat them as nonrandom events caused by particular social and institutional forces (Olzak, Shanahan, and McEneaney Reference Olzak, Shanahan and McEneaney1996; United States National Advisory Commission on Civil Disorders, 1968), this assumption seems implausible.
In fact, the use of cross-sectional data presents an acute threat of bias when estimating the effects of riots on behavior that may explain why previous studies have associated riots with a backlash. If there is a preexisting trend in attitudes or policies to which rioters are reacting—that is, if riots are motivated by actions or policies that reflect locally unfavorable treatment or opinion by the majority, as the scholarly literature asserts—then public opinion measured after a riot will be confounded by the conservative shift already underway.
CONCLUSION
We focus on violent protest as a political tool for a low-status group in the United States. While other scholarship has examined other forms of political action and asked if it is efficacious for racial minorities and other low-status groups (Verba et al. Reference Verba, Schlozman, Brady and Brady1995), the scholarly literature has largely failed to ask whether rioting is a useful tool for building policy support, even though, from the perspective of the rioters, this question is paramount. Here we show that violent political protest can spur political participation among people who share an identity with the rioters.
Although it often seems extreme from the American perspective, political violence is not isolated to particular regions or eras and is still common in many parts of the world. Moreover, the implicit threat of violence underlies the relationship between governments and citizens in many places. As the use of violence continues to be an active feature of our political system, our findings and approach may help future scholars better understand this important topic.
SUPPLEMENTARY MATERIAL
To view supplementary material for this article, please visit https://doi.org/10.1017/S0003055419000340.
Replication materials can be found on Dataverse at: https://doi.org/10.7910/DVN/9B8HQN.


Comments
No Comments have been published for this article.