

With a prevalence of 19–45 %, overweight and obese horses have become a major welfare problem in modern horse management in developed countries( Reference Thatcher, Pleasant and Geor 1 , Reference Wyse, McNie and Tannahil 2 ). Obesity is associated in particular with an increased risk of insulin resistance as well as laminitis( Reference Quinn, Burk and Suagee 3 – Reference Frank, Geor and Bailey 5 ). While preventing animals from becoming obese is the preferred route, given the current scale of this problem, effective safe weight-loss protocols are required especially for the laminitic pony for which increased physical activity may be contraindicated( Reference King and Mansmann 6 ). Recently, several equine studies have been published looking at the efficacy of weight-loss programmes with and without exercise( Reference Carter, McCutcheon and Valle 7 – Reference Argo, Curtis and Grove-White 9 ).
Most recently, the concept of weight-loss resistance in the horse has been highlighted with the suggestion that whereas some animals may respond to moderate energy restriction (low-energy food intake restricted to 1·25 % of the actual body weight as DM intake (DMI)) with appropriate levels of weight loss, others may require more marked levels of reduction (1·00 % of body mass as daily DMI)( Reference Argo, Curtis and Grove-White 9 ). However, it is well known that more severe energy restriction in obese Equidae may lead to hyperlipaemia( Reference McKenzie 10 ). In dogs, the degree of energy restriction also affected long-term body-weight (BW) change. A higher energy restriction resulted initially in a greater level of weight loss, but when returned to a ‘normal’ diet, the ‘rebound’ weight gain was higher( Reference Laflamme and Kulman 11 ). This rebound weight gain was significantly correlated with the amount of lost BW and the level of energy restriction( Reference Laflamme and Kulman 11 ). This effect has also been observed in patients( Reference Weiss, Galuska and Kettel Khan 12 ).
In obese humans, oxidative stress is related to chronic disease (e.g. hypertension, diabetes, the metabolic syndrome, polycystic ovarian syndrome, liver disease)( Reference Vincent, Innes and Vincent 13 ). Human obesity increases the level of oxidative stress( Reference Suzuki, Ito and Ochiai 14 ) as indicated by increased lipid peroxidation( Reference Dandona, Mohanty and Ghanim 15 , Reference Roberts and Sindhu 16 ) and decreased systemic antioxidants( Reference Vincent, Innes and Vincent 13 , Reference Roberts and Sindhu 16 – Reference Mohn, Catino and Capanna 19 ). Moreover, the altered oxidant–antioxidant status in obese children has been reported to be reversible by a dietary restriction–weight-loss programme( Reference Mohn, Catino and Capanna 19 , Reference Kelishidaki, Hashemi and Mohammadifard 20 ). Restricted energy intake has been shown to reduce oxidative damage to proteins, lipids and DNA in rodents( Reference Gredilla and Barja 21 ). It has also been shown to reduce serum advanced glycation end-product formation in healthy and overweight or obese human adults( Reference Gugliucci, Kotani and Taing 22 ). In horses, oxidative stress has been associated with several disorders such as recurrent airway obstruction( Reference Kirschvink, Smith and Fiévez 23 , Reference Deaton, Marlin and Smith 24 ), joint disease( Reference Dimock, Siciliano and McIlwraith 25 ), neurological disorders( Reference Divers, Cummings and de Lahunta 26 ) and perfusion-related disorders( Reference Kischvink, de Moffarts and Lekeux 27 ). Laminitis can be classified under this last condition. Equine digital laminae have relatively limited superoxide dismutase (SOD) capacity, which may make this tissue more susceptible to damage by reactive oxygen species, such as superoxide anion( Reference Loftus, Belknap and Stankiewicz 28 ). However, insulin-induced laminitis has been associated with the accumulation of advanced glycation end products in the lamellar tissues of horses( Reference de Laat, Kyaw-Tanner and Sillence 29 ). Insulin resistance, together with general obesity, regional accumulations of fat tissue and hyperleptinaemia are features of equine metabolic syndrome( Reference Geor 4 ). Higher concentrations of plasma advanced glycation end products, especially pentosidine (PENT), have been found in ponies exhibiting clinical features of equine metabolic syndrome and with a recent history of laminitis or a current episode of laminitis compared with ponies with no recent history of laminitis( Reference Valle, Storace and Sanguinetti 30 ). Lower antioxidant capacity, as measured by decreased erythrocyte glutathione peroxidase activities, has also been reported in obese horses( Reference Pleasant, Suagee and Thatcher 31 ).
In Equidae, little is known about the effect of weight-reduction programmes on the oxidant–antioxidant status. Therefore, the aim of the present study was to evaluate the effect of different levels of energy restriction on weight loss and subsequent rebound weight gain, as well as oxidant–antioxidant balance. It was hypothesised that greater energy restriction would result in more weight loss, accompanied by an improved oxidant–antioxidant balance (increased antioxidant defence and decreased levels of oxidant markers). A second hypothesis was that a more rapid weight loss would be accompanied by a greater weight gain when the ponies were fed again at maintenance energy levels.
Materials and methods
Animals and husbandry
A total of eighteen obese (body condition score ≥ 7/9)( Reference Henneke, Potter and Kreider 32 ) Shetland geldings, aged 9·3 (sem 3·9) years (Table 1), were studied over a 23·5-week period (August to January). Only the ponies in good health and dental status were selected. No prior history of clinical lameness and laminitis was reported for the ponies included in the present study. In accordance with the range reported by Treiber et al. ( Reference Treiber, Kronfeld and Hess 33 ) (7·32–242·40 pmol/l; 1·22–40·40 mU/l), baseline insulin concentrations at the start of the adaptation period and the weight-loss period were normal (range 33·00–237·60 pmol/l; 5·5–39·6 mU/l). As the aim of the present study was not to evaluate the effect of weight loss on glucose and insulin dynamics, glucose tolerance tests were not implemented. Routine foot care, vaccination and anthelmintic treatments were undertaken before and, if necessary, during the study. The ponies were housed individually during feeding times in nine indoor boxes of 9 m2 or in nine stalls with an indoor and outdoor unit with a combined area of 13·83 m2. During the rest of the day, the ponies were group-housed in a large barn (inner part 285 m2; outer part 275·5 m2). On the floor of the barn, rubber mats were placed as bedding material. Water was freely available at all times. The study design was approved by the Ethical Committee of the Faculty of Veterinary Medicine, Ghent University (EC2011/098). All ponies remained healthy and no clinical abnormalities were observed.
Phenotypic summary of each study group of obese ponies at the beginning of the weight-loss period (Mean values with their standard errors)
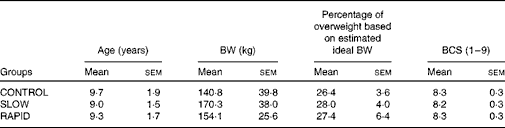
BW, body weight; BCS, body condition score; SLOW, slow weight loss; RAPID, rapid weight loss.
Study design
Before the start of the adaptation period, the ponies were given ad libitum access to the same low-energy hay (Table 2) as that fed during the trial, for 1 month. The ponies also received the same vitamin, protein and mineral supplement (Spillers Gro ’N Win®; MARS Horsecare; Table 2) as that fed during the trial. The trial itself was divided into three periods: an adaptation period of 4 weeks; a weight-loss period of 16·5 weeks; an end-phase period of 3 weeks (Table 3).
Analysed (hay) and labelled (supplement) nutrient compositions of the hay and supplement (Spillers Gro ’N Win®, MARS Horsecare) on a DM basis
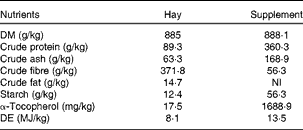
NI, not indicated on the label; DE, digestible energy.
Energy intake during the adaptation period, weight-loss period and end-phase period in obese ponies* (Mean values with their standard errors)
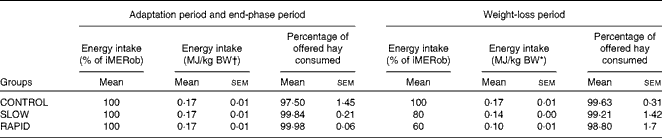
iMERob, individual maintenance energy requirements to maintain a stable obese body weight; BW, body weight; SLOW, slow weight loss; RAPID, rapid weight loss.
* Individual maintenance requirements to maintain a stable obese body weight were determined during the adaptation period. During the weight-loss period, ponies were divided into three treatment groups (n 6): the CONTROL group, which received 100 % of their individual maintenance requirements to maintain a stable obese body weight; the SLOW group, which received 80 % of their individual maintenance requirements to maintain a stable obese body weight; the RAPID group, which received 60 % of their individual maintenance requirements to maintain a stable obese body weight. Energy intake was calculated as digestible energy.
† BW at the end of the adaptation period.
During the adaptation period, the maintenance energy requirements to maintain a stable obese body weight (MERob) were determined for each pony individually. Initially, the low-energy hay was fed to provide 121 % of maintenance net energy requirements as described by Van Weyenberg et al. ( Reference Van Weyenberg, Hesta and Buyse 34 ), based on their actual obese BW. The ponies also received a protein–vitamin–mineral balancer at an amount of approximately 1·32 g/kg ideal BW daily. This amount of the balancer is similar to 12·5 % of their maintenance digestible energy requirements for (estimated) ideal BW (according to National Research Council recommendations)( 35 ) and corrected for all possible vitamin and protein insufficiencies from the hay diet. During the adaptation period, BW was measured three times per week and based on these measurements, changes in the amount of hay fed were made to maintain a stable obese BW. At the end of the last week of the adaptation period, individual MERob (100 % iMERob) could be determined for each animal.
In the following weight-loss period, the ponies were divided into three groups, stratified for a balanced distribution according to age and body condition score. Age was taken into account because concentrations of plasma protein advanced glycation end products, especially PENT, increases in horses during ageing( Reference Valentini, Valle and Bergero 36 ). The control group (CONTROL) received 100 % of their iMERob during this entire period. The ‘slow’ weight-loss (SLOW) group was fed 80 % of their iMERob. The ‘rapid’ weight-loss (RAPID) group was restricted to 60 % of their iMERob.
During the end-phase period, all ponies were again fed 100 % of their original iMERob, which were determined at the end of the adaptation period, for another 3 weeks.
Throughout the study, daily hay rations were equally divided between two meals (09.00 and 15.00 hours) and provided in small-holed haylage nets to maximise the time spent foraging. The balancer was only offered during the morning feeding.
Determination of body weight
During the adaptation period and the end-phase period, ponies were weighed ( ± 0·1 kg) three times per week between 08.00 and 09.00 hours. During the weight-loss period, the ponies were weighed between 08.00 and 09.00 hours on the 1st day of each week. All measurements were recorded on a calibrated scale (error ± 0·01 kg, serial no. 137; Bascules Robbe).
Blood sampling
Blood sampling was undertaken in the early morning before feeding. During the weight-loss period, blood samples were drawn every week on Monday into Vacuette® tubes (Z Serum Clot Activator, 4 ml; Greiner Bio-one) in order to determine the concentrations of TAG and NEFA. In weeks 1, 5, 9, 13, 17, 21·5 and 24·5, blood samples were also taken for the analysis of glucose (Vacuette® tube, FX Sodium Fluoride/Potassium Oxalate, 2 ml; Greiner Bio-one) and insulin, ferric-reducing ability of plasma (FRAP), thiobarbituric acid-reactive substance (TBARS), SOD, α-tocopherol and leptin concentrations (Vacuette® tube, Z Serum Clot Activator, 9 ml). Heparin plasma (Vacuette® tube, LH Lithium Heparin, 9 ml) was collected every 8 weeks for the subsequent analysis of protein, advanced glycation end products (PENT and carboxymethyllysine (CML)) and advanced oxidation protein products (AOPP). The blood samples were stored at 4°C until centrifugation at 3000 g for 10 min. Subsequently, plasma and serum samples were stored at − 20°C until analysis.
Measurements of plasma glucose and serum insulin concentrations
Fasting plasma glucose concentrations were measured by the enzymatic colorimetric assay method (REF 3L82-21 and 3L82-41) using an Abbott Architect C16000 autoanalyser (Abbott Diagnostic Laboratories) with the hexokinase–glucose-6-phosphate dehydrogenase method( Reference Moreaux, Nichols and Bowman 37 , Reference Bruynsteen, Erkens and Peelman 38 ).
Serum insulin concentrations were measured immunoradiometrically( Reference Van Weyenberg, Hesta and Buyse 34 , Reference Bruynsteen, Erkens and Peelman 38 ) (insulin immunoradiometric assay (IRMA) reference no. 5251; DIAsource Europe S.A.). An implementation and validation procedure has previously been described briefly by Bruynsteen et al. ( Reference Bruynsteen, Erkens and Peelman 38 ).
Measurements of lipid metabolism markers
Serum TAG concentrations were measured enzymatically (REF 7D74 304706/R02) using an Abbott Architect C16000 autoanalyser (Abbott Diagnostic Laboratories). Serum NEFA concentrations were measured by the Randox NEFA kit (REF FA 115; Randox Laboratories Limited) with modifications for use in the Daytona System (Randox Laboratories Limited).
Measurements of antioxidant status markers
FRAP was determined by spectrophotometric analysis (Monarch Chemistry System; Instrumentation Laboratories), as described by Benzie & Strain( Reference Benzie and Strain 39 ) and previously validated in horses by Balogh et al. ( Reference Balogh, Gaál and Ribiczeyné 40 ). In this assay, antioxidant activity was measured via the reduction of the ferric tripyridyl triazine complex to the ferrous form at low pH, which was monitored by measuring the change in absorption at 593 nm. Results are reported as the concentration of Fe2+ measured per litre of serum (μmol/l). SOD concentrations were measured with a commercially available assay kit (REF 19 160 SOD determination kit; Sigma-Aldrich), based on the colorimetric reaction between water-soluble tetrazolium salt and superoxide anion. Absorbance was read at 450 nm with the Victor 3 plate reader (Perkin-Elmer). α-Tocopherol concentrations were determined by reversed-phase HPLC and spectrophotometric UV detection. The reversed-phase HPLC analytical column was a Prontosil 120-3-C18 (particle size 3 μm and length 100 mm; Thermo Fisher Scientific, Inc.), and UV detection was determined at an absorbance of 295 nm (UV2000, Thermo Fisher Scientific, Inc.).
Measurements of oxidant status markers
TBARS concentrations were measured spectrophotometrically (Monarch Chemistry System; Instrumentation Laboratories), as described by Lin et al. ( Reference Lin, Decuypere and Buyse 41 ), and results are reported as the concentration of malondialdehyde measured per ml of serum (nmol/ml). Plasma protein content (protein) was determined using the bicinchonic acid (BCA) Protein Assay Kit (Pierce® BCA Protein Assay Kit; Pierce Biotechnology), according to the manufacturer's instruction. PENT concentrations were determined by the HPLC method as described by Valle et al. ( Reference Valle, Storace and Sanguinetti 30 ), with slight modifications. Chromatography was performed using a Waters system (Waters S.P.A.) equipped with a Bio-Tek SFM25 fluorimeter detector (Kontron Instruments). Briefly, after delipidation with hexane and precipitation with TCA, protein content was hydrolysed with 6 m-HCl for 18 h at 110°C in borosilicate screw-capped tubes, dried in a SpeedVac™ Concentrator (Thermo Fisher Scientific Inc.), and then reconstituted in HPLC-grade water containing 0·01 m-heptafluorobutyric acid, filtered through a 0·45 μm-pore diameter Ultrafree-MC (Millipore) and injected into an Aeris™ PEPTIDE XB-C18 100 reversed phase column (250 × 4·6 mm, 3·6 μm) (Phenomenex Inc.) with a curvilinear gradient programme of 20–40 % solvent B (methanol) for 30 min, while solvent A was water. Both water and methanol contained 0·01 m-heptafluorobutyric acid. PENT peaks were monitored using a fluorescent detector at an excited wavelength of 335 nm and an emission wavelength of 385 nm. A PENT synthetic standard (prepared as described by Grandhee & Monnier( Reference Grandhee and Monnier 42 )) was injected at the start of each run to determine the concentrations of PENT in the sample by comparison of the peak area. The concentration of PENT was expressed as pmol/mg of plasma protein content. Inter- and intra-assay CV were 4·8 and 5·4 %, respectively. CML concentrations were determined by the ELISA method (EIAab), according to the manufacturer's instructions. The detection range of the CML ELISA kit was 0·78–58 ng/ml; therefore, plasma samples were diluted at 1:50. Absorbance was read at 450 nm. Results are expressed as pg/mg protein. Inter- and intra-assay CV were 10·7 and 9·8 %, respectively. AOPP concentrations were measured by spectrophotometry, as described previously by Witko-Sarsat et al. ( Reference Witko-Sarsat, Friedlander and Capaillère-Blandin 43 ), on a microplate reader and calibrated with chloramine-T solutions that absorb at λ = 340 nm in the presence of potassium iodide. Human serum albumin preparation (200 μl, diluted at 1:10 in PBS) was added to the test wells of a ninety-six-well microtitre plate, followed by the addition of acetic acid (20 μl). Potassium iodide (10 μl, 1·16 mol/l) was added to the standard wells containing chloramine-T solution (200 μl, 0–100 μmol/l), followed by the addition of acetic acid (20 μl). The absorbance of the reaction mixture was immediately read at 340 nm against a blank containing 200 μl PBS, 10 μl potassium iodide and 20 μl acetic acid. AOPP concentrations are expressed as μmol/l of chloramine-T equivalents. The inter- and intra-assay CV were 7·2 and 6·9 %, respectively.
Measurements of serum leptin concentrations
Leptin concentrations were measured using a multispecies RIA kit (Millipore), validated for the use in horses( Reference McManus and Fitzgerald 44 ). The antibody used was guinea pig anti-human leptin. In the absence of purified equine leptin, results are reported as human equivalents of immunoreactive leptin.
Statistical analysis
Statistical analysis was based on a linear mixed model with pony as the random effect and treatment, time and their interaction as (categorical) fixed effects. A separate analysis was carried out for the weight-loss period and the end-phase period. Because there was a large difference in initial BW at the start of the weight-loss period (100–243·3 kg), changes in BW are expressed as relative differences (% change) from the baseline value (i.e. week 5 for the weight-loss period and week 21·5 for the end-phase period), which were used as the response variable. Absolute values were used for the other measured parameters. After the overall analysis, the three treatment groups were compared pairwise at each time point using Bonferroni's adjustment technique for multiple comparisons. The global significance level was set at 5 %.
Results
Feed intake
The daily hay intake throughout the study is described in Table 3. All ponies ate all of the supplement throughout the study. The average DMI was 1·86 (sem 0·18), 1·96 (sem 0·15) and 1·95 (sem 0·27) % of obese BW in the CONTROL, SLOW and RAPID groups, respectively, at the end of the adaptation period. DMI was 1·86 (sem 0·18), 1·57 (sem 0·12) and 1·17 (sem 0·16) % of BW in the CONTROL, SLOW and RAPID groups, respectively, at the start of the weight loss period. During the end-phase period, the ponies received the same DMI as that in the adaptation period. Energy intake from hay is described in Table 3.
Relative weight changes
During the entire weight-loss period (weeks 5–21), the CONTROL, SLOW and RAPID groups lost an average of 0·42 (sem 0·45), 3·59 (sem 0·63) and 10·81 (sem 0·77) % of their initial BW, respectively (Fig. 1). A more rapid weight loss was observed in the group with the highest energy restriction (RAPID group, P< 0·001); however, the relationship between energy restriction and the percentage of weight loss was not proportional as a doubling of the percentage of energy restriction (20 % v. 40 %) was accompanied by a tripling of the percentage of weight loss (3·59 % v. 10·81 %).
Body-weight changes (%) in obese ponies from the control group (○), slow weight-loss group (●) and rapid weight-loss group (Δ) during the weight-loss period (WLP) and end-phase period (EPP) as a proportion of the value at week 5 (beginning of the WLP). Values are means, with their standard errors represented by vertical bars. During the WLP, a significant interaction between time and treatment was observed (P< 0·001). During the EPP, a group (P< 0·001) and week (P< 0·001) effect was observed.
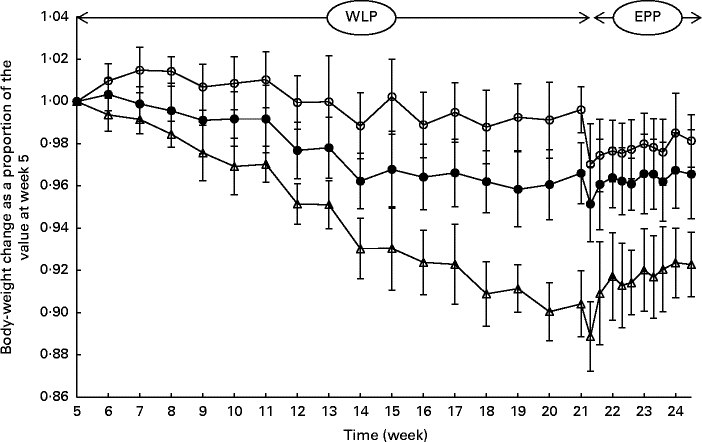
At the end of the end-phase period, the CONTROL, SLOW and RAPID groups had, respectively, regained 1·11 (sem 1·64), 1·41 (sem 1·04) and 3·40 (sem 0·94) % of their BW at the start of the end-phase period (week 21·5). During the end-phase period, a treatment effect was found between the CONTROL and RAPID groups (P< 0·001), and between the SLOW and RAPID groups (P< 0·001), meaning that the RAPID group gained significantly more weight during the end-phase period than the SLOW and CONTROL groups.
Plasma glucose and insulin concentrations
Throughout the weight-loss period, glucose concentrations (range 3·61–5·05 mmol/l; 65–91 mg/l) changed over time independently of the treatment (P< 0·001). No significant changes were found in the concentration of insulin during the weight-loss period and/or the end-phase period. Mean insulin concentrations at all time points were < 180 pmol/l ( < 30 mU/l), although at the end of the weight-loss period, two ponies had higher insulin concentrations of 453·6 pmol/l (75·6 mU/l) (CONTROL group) and 451·2 pmol/l (75·2 mU/l) (SLOW group). At the end of the end-phase period, another four ponies (CONTROL group, n 2; SLOW group, n 1; RAPID group, n 1) had insulin concentrations >30 mU/l (range 245·4–439·8 pmol/l; 40·9–73·3 mU/l).
Markers of lipid metabolism
Higher and more rapid maximum TAG concentrations were reached in the RAPID group (P= 0·001) during the first part of the weight-loss period (Fig. 2). At the end of the end-phase period, TAG concentrations decreased more rapidly in the RAPID group compared with the SLOW and CONTROL groups (P< 0·001).
Serum TAG concentrations in obese ponies from the control group (![]() ), slow weight-loss group (
), slow weight-loss group (![]() ) and rapid weight-loss group (
) and rapid weight-loss group (![]() ) during the weight-loss period (WLP) and end-phase period (EPP). Values are means, with their standard errors represented by vertical bars. During the WLP, and EPP, a significant interaction between time and treatment was observed (P= 0·001 and P< 0·001, respectively).
) during the weight-loss period (WLP) and end-phase period (EPP). Values are means, with their standard errors represented by vertical bars. During the WLP, and EPP, a significant interaction between time and treatment was observed (P= 0·001 and P< 0·001, respectively).
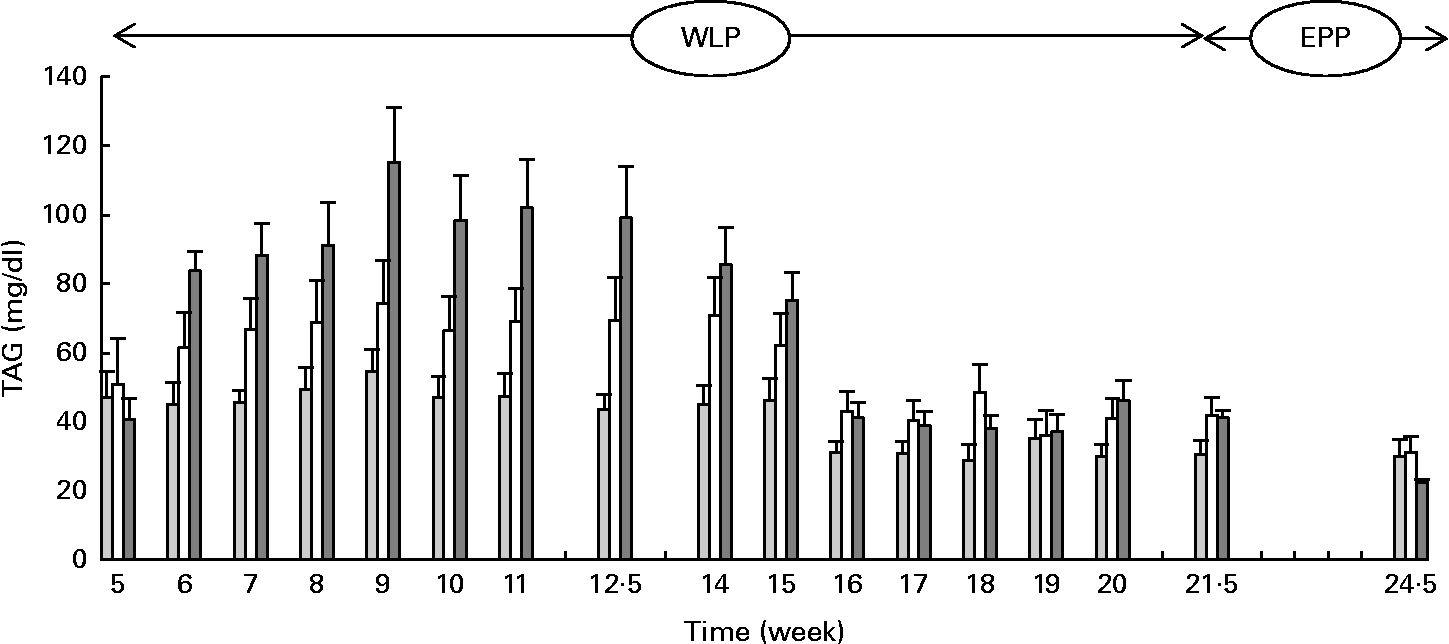
NEFA concentrations changed during the weight-loss period (P< 0·001), with higher concentrations found in the RAPID group compared with the SLOW and CONTROL groups (P= 0·021). At the end of the end-phase period, NEFA concentrations decreased in the RAPID group, whereas the concentrations increased in the CONTROL group and remained stable in the SLOW group (P= 0·014; data not shown).
Antioxidant status
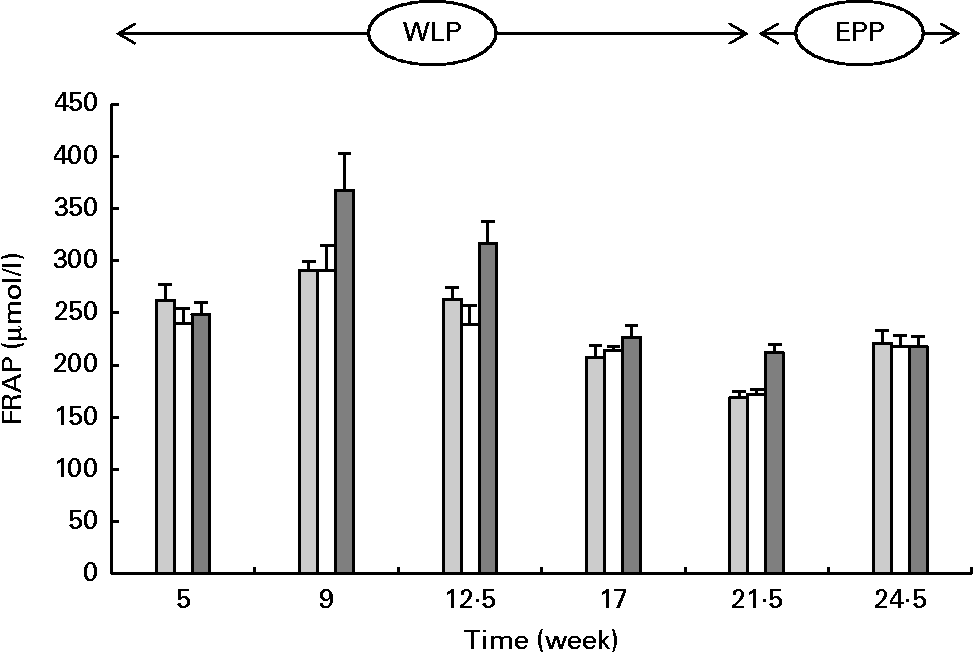
FRAP concentrations changed during the weight-loss period (P< 0·001), with the highest concentrations observed in the RAPID group (P< 0·001) (Fig. 3). When comparing the end and the beginning of the end-phase period, FRAP concentrations increased in the SLOW and CONTROL groups, but remained constant in the RAPID group (P< 0·001).
Serum ferric-reducing ability of plasma (FRAP) concentrations in obese ponies from the control group (![]() ), slow weight-loss group (
), slow weight-loss group (![]() ) and rapid weight-loss group (
) and rapid weight-loss group (![]() ) during the weight-loss period (WLP) and end-phase period (EPP). Values are means, with their standard errors represented by vertical bars. During the WLP, a significant time (P< 0·001) and treatment (P< 0·001) effect was observed. During the EPP, a significant interaction between time and treatment was observed (P< 0·001).
) during the weight-loss period (WLP) and end-phase period (EPP). Values are means, with their standard errors represented by vertical bars. During the WLP, a significant time (P< 0·001) and treatment (P< 0·001) effect was observed. During the EPP, a significant interaction between time and treatment was observed (P< 0·001).
During the weight-loss period, SOD concentrations changed (P= 0·036), with lower concentrations being observed in the RAPID group after 8 weeks of weight loss (P= 0·003). SOD concentrations increased in the three groups during the end-phase period (P= 0·003; data not shown).
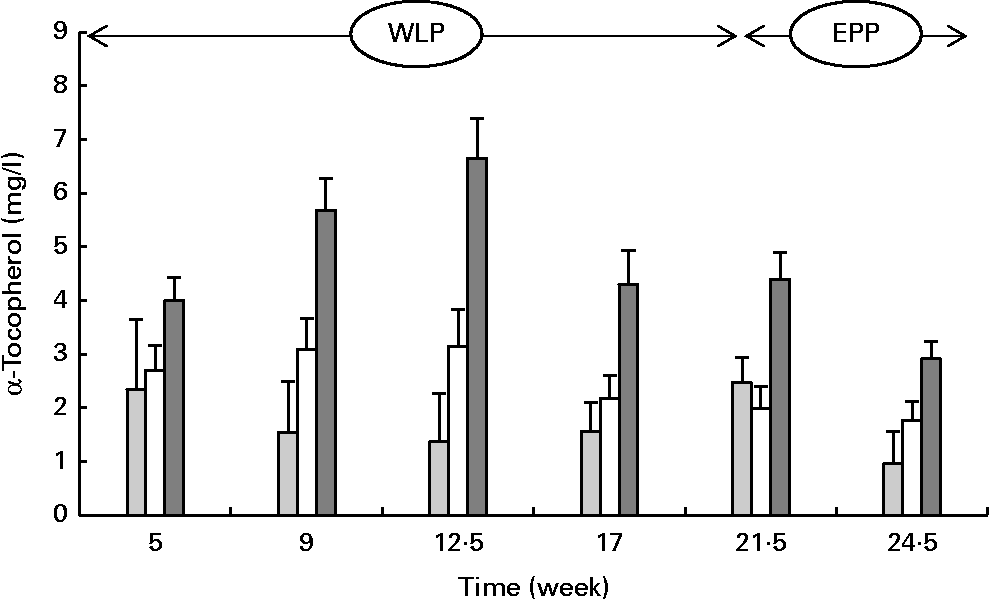
α-Tocopherol concentrations changed over time during the weight-loss period, with the concentrations increasing in the RAPID group but being more stable in the SLOW group and slightly decreasing in the CONTROL group (P= 0·004; Fig. 4) . The concentrations of α-tocopherol rapidly decreased in the CONTROL and RAPID groups during the end-phase period; however, a slight decrease in concentration was observed in the SLOW group (P< 0·001).
Serum α-tocopherol concentrations in obese ponies from the control group (![]() ), slow weight-loss group (
), slow weight-loss group (![]() ) and rapid weight-loss group (
) and rapid weight-loss group (![]() ) during the weight-loss period (WLP) and end-phase period (EPP). Values are means, with their standard errors represented by vertical bars. During the WLP and EPP, a significant interaction between time and treatment was observed (P= 0·004 and P< 0·001, respectively).
) during the weight-loss period (WLP) and end-phase period (EPP). Values are means, with their standard errors represented by vertical bars. During the WLP and EPP, a significant interaction between time and treatment was observed (P= 0·004 and P< 0·001, respectively).
Oxidant status
During the weight-loss period and the end-phase period, TBARS concentrations changed over time independently of the treatment (P< 0·001 and P= 0·042, respectively; data not shown).
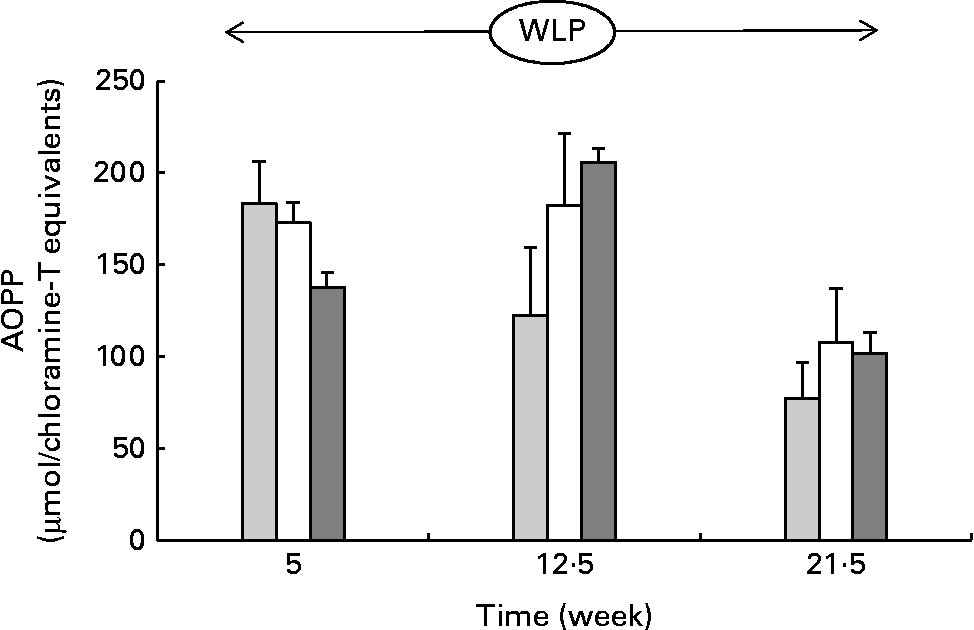
Throughout the weight-loss period, AOPP concentrations changed differently over time between the three treatment groups, with concentrations increasing in the RAPID group in the first part but remaining stable in the SLOW group and decreasing in the CONTROL group, respectively (P= 0·015; Fig. 5) .
Plasma advanced oxidation protein product (AOPP) concentrations in obese ponies from the control group (![]() ), slow weight-loss group (
), slow weight-loss group (![]() ) and rapid weight-loss group (
) and rapid weight-loss group (![]() ) during the weight-loss period. Values are means, with their standard errors represented by vertical bars. A significant interaction between time and treatment was observed (P= 0·015).
) during the weight-loss period. Values are means, with their standard errors represented by vertical bars. A significant interaction between time and treatment was observed (P= 0·015).
No significant changes were found in the concentrations of PENT and CML.
Serum leptin concentrations
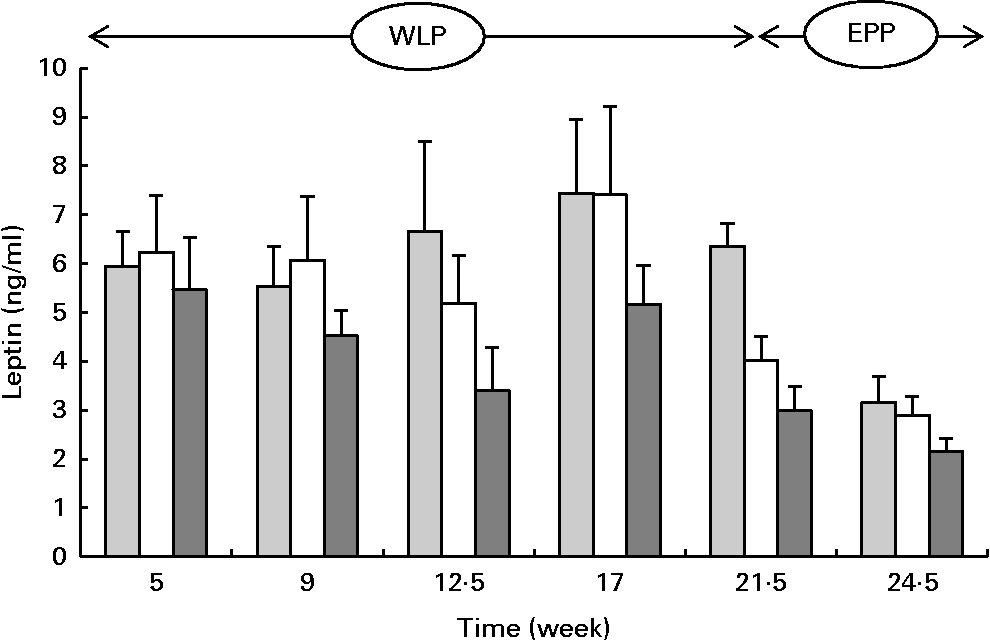
Serum leptin concentrations changed during the weight-loss period (P= 0·002) and between the treatments (P= 0·001) with the lowest concentrations being observed in the RAPID group (Fig. 6). At the end of the end-phase period, leptin concentrations decreased most rapidly in the CONTROL group compared with the RAPID and SLOW groups (P< 0·001).
Serum leptin concentrations in obese ponies from the control group (![]() ), slow weight-loss group (
), slow weight-loss group (![]() ) and rapid weight-loss group (
) and rapid weight-loss group (![]() ) during the weight-loss period (WLP) and the end-phase period (EPP). Values are means, with their standard errors represented by vertical bars. During the WLP, a significant time (P= 0·002) and treatment (P= 0·001) effect was observed. During the EPP, a significant interaction between time and treatment was observed (P< 0·001).
) during the weight-loss period (WLP) and the end-phase period (EPP). Values are means, with their standard errors represented by vertical bars. During the WLP, a significant time (P= 0·002) and treatment (P= 0·001) effect was observed. During the EPP, a significant interaction between time and treatment was observed (P< 0·001).
Discussion
To the best of our knowledge, the present study was the first to describe the effect of different levels of energy restriction on weight loss and oxidative stress in ponies/Equidae. In the present study, the higher energy restriction (RAPID) was associated with the greatest weight loss, as has also been described previously in dogs( Reference Laflamme and Kulman 11 ). A doubling of the percentage of energy restriction was associated with a tripling of the percentage of weight loss (SLOW group, 3·59 % v. RAPID group, 10·81 %). However, the highest energy-restricted group (RAPID) also showed the greatest weight gain when they received again their 100 % iMERob, a finding similar to that reported in dogs( Reference Laflamme and Kulman 11 ) and human subjects( Reference Weiss, Galuska and Kettel Khan 12 ). Increased metabolic efficiency, as has been reported in obesity-prone rats after weight loss( Reference MacLean, Higgins and Johnson 45 ), could be a possible explanation, although specific parameters (thyroid hormones, metabolic rate, individual total and resting expenditure) were not measured to confirm this in the present study. In obesity-prone rats, metabolic efficiency remained elevated and contributed to a lower energy expenditure, a greater energy imbalance, and a higher rate of weight regain early in relapse( Reference MacLean, Higgins and Johnson 45 ). MacLean et al. ( Reference MacLean, Higgins and Johnson 45 ) reported that adjustments in appetite and resting energy expenditure significantly contributed to the energy imbalance when rats were given free access to a low-fat diet.
The mean weekly weight loss in the RAPID group corresponded to 0·68 %, which is comparable to the losses described in the weight-loss trial of Dugdale et al. ( Reference Dugdale, Curtis and Cripps 8 ) who observed weekly weight losses of 0·7 % by feeding 1 % of the actual BW as DMI daily in obese pony mares. In that same study, BW decreased by 4·3 % during the 1st week of the weight-loss period, which was attributed to decreased gut fill and possibly the depletion of glycogen reserves associated with the transition from ad libitum food intake (positive energy balance) to restricted food intake (negative energy balance). This phenomenon was not observed in the present study where BW loss in the RAPID group only reached 0·87 % in the 1st week. This could possibly be attributed to the feeding strategy during the adaptation period in the present study, in which the ponies were fed at their MERob instead of ad libitum food intake followed in the trial of Dugdale et al. ( Reference Dugdale, Curtis and Cripps 8 ).
Leptin concentrations were lower at the end than at the beginning of the weight-loss period, which is in accordance with the findings reported in other weight-loss studies in ponies( Reference Van Weyenberg, Hesta and Buyse 34 , Reference Ungru, Blüher and Coenen 46 ). In the present study, refeeding the ponies to 100 % iMERob resulted in further lowering of leptin concentrations in the energy-restricted groups, which is a rather unexpected finding as higher leptin concentrations would be expected because of the higher energy intake and the subsequent satiety effect of this hormone( Reference Radin, Sharkey and Holycross 47 ). No clear explanation could be found for this finding.
When the body of the horse is in a state of negative energy balance, it changes to a more catabolic state. In an attempt to maintain normoglycaemia, there is a shift towards the use of fatty acids as the primary energy source( Reference McKenzie 10 ). Given the higher predisposition of hyperlipaemia in Shetland ponies with obesity as a fortifying factor( Reference Watson, Burns and Love 48 , Reference Hughes, Hodgson and Dart 49 ), this was obviously a potential concern. However, a previous study in Shetland geldings with even more severe energy restriction (but introduced very gradually) at 35 % of maintenance energy requirements had reported no adverse health effects( Reference Van Weyenberg, Hesta and Buyse 34 ). In the present study, significantly higher serum TAG and NEFA concentrations were found in the SLOW and RAPID groups compared with the CONTROL group, with the highest concentrations being found in the RAPID group. However, TAG concentrations never exceeded the upper limit of the normal range ( < 5000 mg/l)( Reference McKenzie 10 ), and none of the ponies showed any adverse clinical signs. During the 1st weeks of the weight-loss period, accumulation of TAG concentrations in the serum was positively associated with the extent of weight loss. After 4 weeks of energy restriction, even though weight loss was still continuing, TAG concentrations gradually returned to the baseline levels.
Together with the increase in the percentage of weight loss, and TAG and NEFA concentrations in the blood, an increase in plasma antioxidant capacity (as indicated by the concentrations of α-tocopherol and FRAP) was observed during the first 4 to 8 weeks of the study. The increase in α-tocopherol concentrations (as part of vitamin E) could also be attributed to the release of this liposoluble vitamin from the fat deposit, which is one of the major storage sites of vitamin E( Reference Ball 50 ). At the end of the weight-loss period, these concentrations returned to the baseline levels, perhaps suggesting that the stimulus for increased antioxidant demand had been resolved (decreased blood TAG and NEFA concentrations). The concentration of the pro-oxidant marker TBARS was lower at the end than at the start of the weight-loss period, indicating that, as reported in human subjects( Reference Vincent, Innes and Vincent 13 ), dietary interventions resulting in even limited weight loss may help the oxidant–antioxidant equilibrium. The parameter TBARS has been broadly used for the measurement of lipid peroxidation, as it is one of the better predictors of oxidative damage( Reference Lykkesfeldt and Svendsen 51 ). However, the use of this parameter has been criticised due to its low specificity( Reference Lykkesfeldt and Svendsen 51 ) and sensitivity( Reference McMichael 52 ). To have a good understanding of the oxidant–antioxidant status, multiple measures of oxidative damage should be evaluated( Reference Kischvink, de Moffarts and Lekeux 27 , Reference Lykkesfeldt and Svendsen 51 ). Therefore, in the present study, oxidative damage to proteins was evaluated. In humans, lipids as well as carbohydrates are important contributors to the chemical modification of proteins, leading to the formation of lipoxidation products( Reference Bengmark 53 ). The chemical modification of amino acids in proteins during lipid peroxidation results in the formation of lipoxidation products such as AOPP. The higher increase in the concentration of AOPP in the RAPID group after 8 weeks of weight loss compared with the SLOW group could therefore be attributed to the higher TAG and NEFA concentrations observed in the RAPID group, which are prone to oxidation. No significant changes were observed in the concentrations of CML and PENT, which could be due to the tight glycaemic control in ponies and the fact that TAG and NEFA concentrations were not high enough to form glycoxidation and lipoxidation markers( Reference Requena, Fu and Ahmed 54 ).
Since the diet was the main focus of the present study and not the effect of weight loss on glucose and insulin dynamics, no glucose tolerance tests were implemented. We should although acknowledge that insulin resistance and hyperinsulinaemia( Reference Paolisso and Giugliano 55 – Reference Kyselová, Žourek and Rušavý 57 ) are associated with oxidative stress and therefore could be a confounding factor. However, no significant correlations were found between plasma insulin concentrations and TBARS, AOPP, PENT, SOD, FRAP, and α-tocopherol concentrations.
In conclusion, different levels of energy restriction will influence the extent of any weight loss, although there was no apparent linear relationship between the extent of energy restriction and the percentage of weight loss. A doubling of the percentage of energy restriction was associated with a tripling of the percentage of weight loss. Following the weight-loss period, more extensive weight loss was associated with more rapid and greater weight regain when ponies were fed again at 100 % of their MERob. On the basis of the present results, it can be recommended in practice that if the obese equid is fed with a more severe energy-restricted diet in order to achieve weight loss within a reasonable time period, it is even more important that once the ideal weight of the animal is reached, monitoring should continue in order to avoid the rapid rebound effect of weight gain.
Finally, energy restriction and consequently weight loss can affect the oxidant–antioxidant balance, although significant effects were only observed in the present study with the highest level of energy restriction. However, these rather small effects are unlikely to be biologically significant, and further research into the effect of weight loss on the oxidant–antioxidant balance is warranted.
Acknowledgements
The authors gratefully acknowledge Ségolène Leveillé Nizerolle, An Cools, Kristel Rochus, Hannelore Van de Velde, Sanne Ott, Annelies De Spiegeleer, Galena Quist-Rybachuk, Christel Moons, Adronie Verbrugghe and Ruben Decaluwé for helping with the feeding practices and blood sampling of the ponies, and Sarah Van Beirs, Laura Statius, Steven Galle and Ellen Van de Maele for their excellent care of the ponies. The authors also thank Herman De Rycke, Roberta Borghi, Nicola Traverso, Daniel Vermeulen and Inge Vaessen for their assistance in the analyses.
The present study was part of the postgraduate study of L. B. and funded by the Institute for Promotion of Innovation through Science and Technology in Flanders (IWT, grant no. 101572). The study was also funded by the 2011 WALTHAM-Buckeye Equine Research Grant. Professor Pat Harris, who is affiliated with WALTHAM, was involved in the study design and drafting of the manuscript.
The authors’ contributions are as follows: L. B. was responsible for the study design, study performance, data analysis and drafting of the manuscript; M. H. and G. P. J. J., who were the supervisor and co-supervisor of L. B. respectively, contributed to the development of the study design, data analysis and drafting of the manuscript; P. A. H. contributed to the study design and drafting of the manuscript; L. D. was responsible for the data analysis and drafting of the manuscript; E. V. was responsible for the analysis of the advanced glycation end products and drafting of the manuscript; P. O. was responsible for the analysis of the advanced glycation end products; J. B. supervised the plasma analysis of SOD, TBARS, FRAP and leptin; K. V. contributed to the study performance and drafting of the manuscript.
The authors declare that there are no conflicts of interest.


