





Introduction
The critical period for weed control (CPWC) is a crucial window in the crop growing season when it is important to control weeds to prevent potential yield losses, with acceptable yield loss traditionally set at 5% (Fast et al. Reference Fast, Murdock, Farris, Willis and Murray2009; Hall et al. Reference Hall, Swanton and Anderson1992; Knezevic et al. Reference Knezevic, Evans, Blankenship, Van Acker and Lindquist2002, Reference Knezevic, Evans and Mainz2003; Norsworthy and Oliveira Reference Norsworthy and Oliveira2004; Weaver and Tan Reference Weaver and Tan1983). The CPWC is defined by the critical timing for weed removal (CTWR) and the critical weed-free period (CWFP, the end of the critical period), which are two measures of crop-weed interference. The CTWR is the maximum time the cash crop can tolerate early-season weed competition without causing a yield loss of ≥5%. The CWFP indicates the end of the period during which weeds must be controlled to prevent a ≥5% crop yield loss (Knezevic et al. Reference Knezevic, Evans and Mainz2003; Weaver and Tan Reference Weaver and Tan1983; Williams et al. Reference Williams, Ransom and Thompson2007). The CTWR is calculated using weedy plots, whereas the CWFP is calculated using weed-free plots. Understanding the CPWC is vital for growers to make decisions about timing the application of herbicides and to achieve efficient herbicide use according to the needs and demands of weed control (Hall et al. Reference Hall, Swanton and Anderson1992; Knezevic et al. Reference Knezevic, Evans and Mainz2003; Zimdahl Reference Zimdahl2007). However, according to Knezevic et al. (Reference Knezevic, Evans and Mainz2003) and Mahammadi and Amiri (Reference Mohammadi and Amiri2011), weed intervention before and after the critical period has less effect on the main crop and does not result in significant yield reduction.
It is well known that the increasing number of herbicide-resistant weeds is a significant problem, and traditional chemical-based weed control methods no longer work as well as they used to, especially as a changing climate favors the adaptation and survival of weeds, while herbicide efficacy is also decreasing (Kumar et al. Reference Kumar, Kumari, Price, Bana, Singh and Bamboriya2023). In addition to herbicide resistance, frequent applications also increases the total cost of production, and the potential for crop injury (Norsworthy et al. Reference Norsworthy, Ward, Shaw, Llewellyn, Nichols, Webster and Barrett2012) and soil and water pollution (Rashid et al. Reference Rashid, Husnain, Riazuddin, Ashraf, Ozturk and Ahmad2010), depending on the herbicide and cropping system. In seeking alternative methods of weed management, growers of row crops in the United States have increasingly adopted the planting of cover crops during the non-crop season (Wallander et al. Reference Wallander, Smith, Bowman and Claassen2021). A conservation tillage system that includes cover crops has been identified as an effective method of weed control (Kumari et al. Reference Kumari, Price, Gamble, Li and Jacobson2024a, Reference Kumari, Price, Korres, Gamble and Li2023b; Norsworthy et al. Reference Norsworthy, McClelland, Griffith, Bangarwa and Still2011; Price et al. Reference Price, Balkcom, Duzy and Kelton2012) and improves the soil’s physical, chemical, and biological properties (Blanco-Canqui et al. Reference Blanco -Canqui, Ruis, Koehler -Cole, Elmore, Francis, Shapiro and Ferguson2023; Dabney et al. Reference Dabney, Delgado and Reeves2001).
Most cereal cover crops exhibit a rapid vegetative growth rate and winter hardiness, which when managed for maximum biomass, contributes to the formation of a dense mat of residue on the soil surface at termination (Clark Reference Clark2007). This residue mat helps suppress weeds by providing a physical barrier and shading (Price et al. Reference Price, Balkcom and Arriaga2005; Teasdale and Mohler Reference Teasdale and Mohler2000).For example, when a cover crop of cereal rye was terminated late in the season (i.e., at the milk to soft dough stage), the biomass residue was greater and it persisted, and resulted in a higher carbon-to-nitrogen ratio (Balkcom et al. Reference Balkcom, Duzy, Kornecki and Price2015). In contrast, legume cover crops such as crimson clover and hairy vetch decompose relatively quickly but they can fix significant amounts of nitrogen that can be taken up by the succeeding main crop over time (Foote et al. Reference Foote, Edmisten, Wells, Jordan and Fisher2014; Parr et al. Reference Parr, Grossman, Reberg-Horton, Brinton and Crozier2011). However, the slow growth rate of legume cover crops, their sensitivity to cold and relatively quick decomposition due to their low carbon-to-nitrogen ratio do not provide persistent aboveground biomass (Mischler et al. Reference Mischler, Duiker, Curran and Wilson2010; Reberg-Horton et al. Reference Reberg-Horton, Grossman, Kornecki, Meijer, Price, Place and Webster2012).In concert with this research, conservationists and farmers are increasingly planting cover crop mixtures both to maximize biomass production and to increase nutrient availability in the soil. According to Smith et al. (Reference Smith, Reberg-Horton, Place, Meijer, Arellano and Mueller2011), aboveground biomass production and persistence of cover crop residue are mandatory factors in maximizing weed suppression. Various research studies on cover crop biomass indicate that the species composition of a mixture can influence biomass production and that one species in the mixture may dominate. Biomass is a key factor in weed suppression; therefore, choosing which cover crop species to plant is crucially important. According to Clark (Reference Clark2007), Hayden et al. (Reference Hayden, Brainard, Henshaw and Ngouajio2012), and Poffenbarger et al. (Reference Poffenbarger, Mirsky, Weil, Maul, Kramer, Spargo and Cavigelli2015), a mixture of cereal and legume cover crops resulted in greater nitrogen concentrations and biomass residue than a cover crop species grown alone in a monoculture system. The cover crop mixture for this experiment included species of cereal rye, crimson clover, and hairy vetch.
Some experiments have been conducted to determine the CPWC under various agronomic practices in the United States; however, little published research has evaluated the CPWC of cover crops and their mixtures. As more farmers plant cover crops, As cover crops become more popular, especially cereal rye and mixtures, it is beneficial to evaluate the CPWC. Therefore, because biomass can vary and indirectly affect weed suppression and the subsequent CPWC, this study aimed to compare the cover crop biomass between mixtures and solo crops. The objective of the field study was to evaluate the effect of biomass from a mixture and a cereal rye cover crop, compared with a winter fallow, on CPWC and its components, including the beginning and end of the critical period, in soybean crops.
Materials and Methods
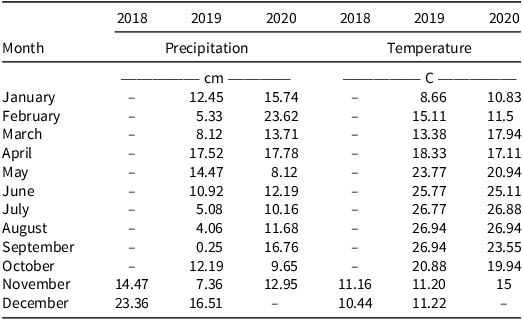
Field experiments were conducted at the E. V. Smith Research Center Field Crops Unit (32.4417°N, 85.8974°W) near Shorter, Alabama, in 2019 and 2020. Monthly precipitation and temperature averages are presented in Table 1. Soil composition at the experimental site was a sandy loam with coarse-loamy, siliceous, sub active, thermic Paleudults, with 0.8% organic matter, pH 6.2. The experimental site had been in continuous minimum tillage for the previous 20 yr. Tillage was limited to within-row subsoiling, and the soil had been highly prone to natural processes that resulted in annual root-restricting hardpans. The rye cover crop (Elbon) was seeded at a rate of 100 kg ha−1, whereas the cover crop mixture included rye (Elbon), crimson clover (Dixie), and hairy vetch (AU Merit) seeded at rates of 33 kg ha−1, 11 kg ha−1, and 22 kg ha−1, respectively. The cover crops were seeded using a no-till End Wheel Drill (Great Plains, Salina, KS) with a spacing of 19 cm on October 25, 2018, and October 16, 2019. In early March of both years, 35 kg ha−1 nitrogen as ammonium nitrate was applied to cover crop plots to enhance cover crop biomass accumulation. In the spring (before soybean planting), on May 2, 2029, and April 27, 2020, cover crop plots were rolled with a three-section straight mechanical bar roller-crimper, as described by Ashford and Reeves (Reference Ashford and Reeves2003), to terminate the cover crop and provide a homogeneous mat of biomass residue on the soil surface. Immediately following rolling, cover crops were desiccated by an application of glyphosate (1.1 kg ae ha−1, Roundup PowerHA; Bayer Crop Science, St. Louis, MO) at using a tractor-mounted sprayer equipped with 11004 XR flat-fan nozzles (Tee Jet Technologies, Glendale Heights, IL) calibrated at 280 L ha−1.
Precipitation and temperature monthly averages at the study location in Auburn, Alabama, from 2018 to 2020.

Table 1 Long description
The table presents monthly precipitation and temperature averages at a study location in Auburn, Alabama, from 2018 to 2020. It has 15 rows and 6 columns. The columns are labeled with the years 2018, 2019, 2020 for precipitation in centimeters, and 2018, 2019, 2020 for temperature in degrees Celsius. The rows are labeled with the months from January to December. Row 1: January, 12.45, 15.74, 8.66, 10.83. Row 2: February, 5.33, 23.62, 15.11, 11.5. Row 3: March, 8.12, 13.71, 13.38, 17.94. Row 4: April, 17.52, 17.78, 18.33, 17.11. Row 5: May, 14.47, 8.12, 23.77, 20.94. Row 6: June, 10.92, 12.19, 25.77, 25.11. Row 7: July, 5.08, 10.16, 26.77, 26.88. Row 8: August, 4.06, 11.68, 26.94, 26.94. Row 9: September, 0.25, 16.76, 26.94, 23.55. Row 10: October, 12.19, 9.65, 20.88, 19.94. Row 11: November, 14.47, 7.36, 11.16, 11.20. Row 12: December, 23.36, 16.51, 10.44, 11.22.
Soybean variety Pioneer 45T88E was drill-planted using a precision planter with a seeding depth 3.8 cm at 344,400 seeds ha−1 with row spacing of 76 cm on May 25, 2019, and May 18, 2020. The field experiments were conducted using a split-plot design with four replications within a randomized complete block design each year. Cereal rye, cover crop mixture, and winter fallow plots were considered as the main plot factor, while subplot treatments involved five durations of each weedy and weed-free plot (a total of 10 subplots in the experiment). The weedy and weed-free periods consisted of biweekly durations from 0 wk after planting (WAP) soybean to 8 WAP. To maintain weed-free plots, glufosinate (0.55 kg ai ha−1, Liberty 280; BASF Corporation, Research Triangle Park, NC) + S-metolachlor (1.08 kg ai ha−1, Dual II Magnum; Syngenta Crop Protection, Greensboro, NC) was applied. Herbicides were applied only once to each weed-free plot, while the remaining weed-free plots were weeded by hand.
Data Collection
Just before the cover crop was terminated via rolling, samples of the aboveground biomass were clipped from a randomly selected 0.25-m2 area in each plot. The total aboveground biomass of cover crop and fallow plots was calculated by using two quadrats per plot. Cover crop samples were dried at 60 C for 72 h, after which dry weight was recorded. In total, five different timings were used as subplots for each weedy and weed-free plot: 0 WAP, 2 WAP, 4 WAP, 6 WAP, and 8 WAP. Weed biomass samples were taken from each subplot of the weedy treatment plots after a specific duration of the weedy treatment. For example, in a 4-wk weedy check, weed biomass samples were taken after 4 wk, and then weeds were controlled until 8 wk. Moreover, weed biomass samples were collected from weed-free treatment plots once at 8 WAP. To determine yield, soybean were harvested from the center two rows of each plot using a small-plot combine harvester.
Data Analysis
The weed interference period in weedy plots represented the CTWR, and the weed-free period in weed-free plots represented the CWFP. In this experiment, an acceptable level of yield loss for both the beginning (CTWR) and end (CWFP) of the critical period was considered 5% as described by Blankenship et al. (Reference Blankenship, Stroup, Evans and Knezevic2003) and Knezevic et al. (Reference Knezevic, Evans, Blankenship, Van Acker and Lindquist2002).
Soybean yield was converted to a relative scale, expressed as a percentage of the season-long weed-free checks. ANOVA was performed to check the interaction of year, and when a significant interaction was found, CPWC was determined for each year. The nonlinear regression curves and inverse predictions of CPWC were determined using SigmaPlot software (v.13.0; Systat, San Jose, CA) and JMP Pro software (v.13; SAS Institute, Cary, NC). Equation 1 shows how relative yield was calculated:
 $${\rm{Relative}}\;{\rm{Yield}} = {{Actual\;Yield} \over {Control\;Yield\;}} \times 100\;$$
where the Control Yield was 0 wk for weedy plots and 8 wk for weed-free plots. A three-parameter logistic model was fitted to relative soybean yield to estimate the start of the CPWC, represented as CTWR, and calculated (Equation 2) from weedy plots as described by others (Knezevic et al. Reference Knezevic, Evans, Blankenship, Van Acker and Lindquist2002; Korres and Norsworthy Reference Korres and Norsworthy2015; Kumari et al. Reference Kumari, Price, Korres, Gamble and Li2023a, Reference Kumari, Price, Korres, Gamble and Li2023b; Williams et al. Reference Williams, Ransom and Thompson2007):
 $$y = {\alpha \over {1 + {e^{ - b\left( {x - {x_o}} \right)}}}}$$
The Gompertz model with three parameters was fitted to the relative soybean yield to evaluate the end of the critical period (CWFP) using Equation 3:
 $$y = \alpha {e^{{ - ^{\left( {{e^{ - b\left( {x - {x_o}} \right)}}} \right)}}}}$$
In Equations 2 and 3, y represents the relative soybean yield, x 0 represents the inflection point, b is the slope of the curve or growth rate, α is the asymptote, and x depicts the duration (i.e., WAP). Weed biomass production was also modeled as a function of CTWR (Equation 2) and CWFP (Equation 3) as a result of each cover crop treatment in 2019 and 2020. The coefficient of determination (R 2) for each regression curve was used to check the fitness of the model.
Results and Discussion
Cover Crop Biomass and Soybean Yield
In 2019 when the cover crop was terminated, the average biomass of the cover crop mixture and cereal rye was 6,764 kg ha−1 and 8,458 kg ha−1, respectively. In 2020, the average biomass of cover crop mixture and cereal rye was 10,864 kg ha−1 and 8,583 kg ha−1, respectively. In 2019, biomass production was greater in cereal rye plots than plots that were planted with the cover crop mixture, whereas in 2020, the cover crop mixture produced greater biomass than cereal rye plots. Maximum biomass production benefits are anticipated from cover crop mixtures that combine species with diverse architecture and physiological traits (Hooper et al. Reference Hooper, Chapin, Ewel, Hector, Inchausti and Lavorel2005). However, previous studies conducted in Alabama showed that cereal rye produced a numerically greater cover of biomass than cover crop mixtures. At some locations, mixtures produced more biomass, although the effect was not significant (Kumari et al. Reference Kumari, Price, Gamble, Li and Jacobson2024a, Reference Kumari, Price, Gamble, Li and Jacobson2024b). A meta-analysis examined that cover crop biomass can differ depending on the study site (Osipitan et al. Reference Osipitan, Dille, Assefa and Knezevic2018, Reference Osipitan, Dille, Assefa, Radicetti, Ayeni and Knezevic2019). In 2019, the average soybean yield after termination of a cover crop mixture or cereal rye, and a winter fallow treatment was 688 kg ha−1, 806 kg ha−1, and 708 kg ha−1. Average soybean yield in Alabama ranges from 2,700 kg ha−1 to 3,100 kg ha−1. The highest average yield attained following the cereal rye treatment is 70% less than the lower range average yield attainable in Alabama. In 2020, the average soybean yield after cover crop mixture, cereal rye, and winter fallow treatments was 1,731 kg ha−1, 1,764 kg ha−1, and 1,643 kg ha−1, respectively. Again, this yield is 34% lower than the lower range average yield attainable in Alabama. These results are likely due to the 20-yr reduced tillage history present at the experimental site that resulted in a root-limited soil structure. While the absolute yield values were lower than the state average, the determination of the CPWC and the CTWR primarily depends on the relative yield loss rather than the absolute yield itself. Therefore, the trends observed in the yield–weed interference relationship remain valid.
The whole-plot effect was nonsignificant for soybean yield following treatments with cover crop mixture, cereal rye, and winter fallow. Although numeric trends are noted, these results show that cover crops cannot overcome soil compaction limitations in sandy loam soils.
Critical Period for Weed Control
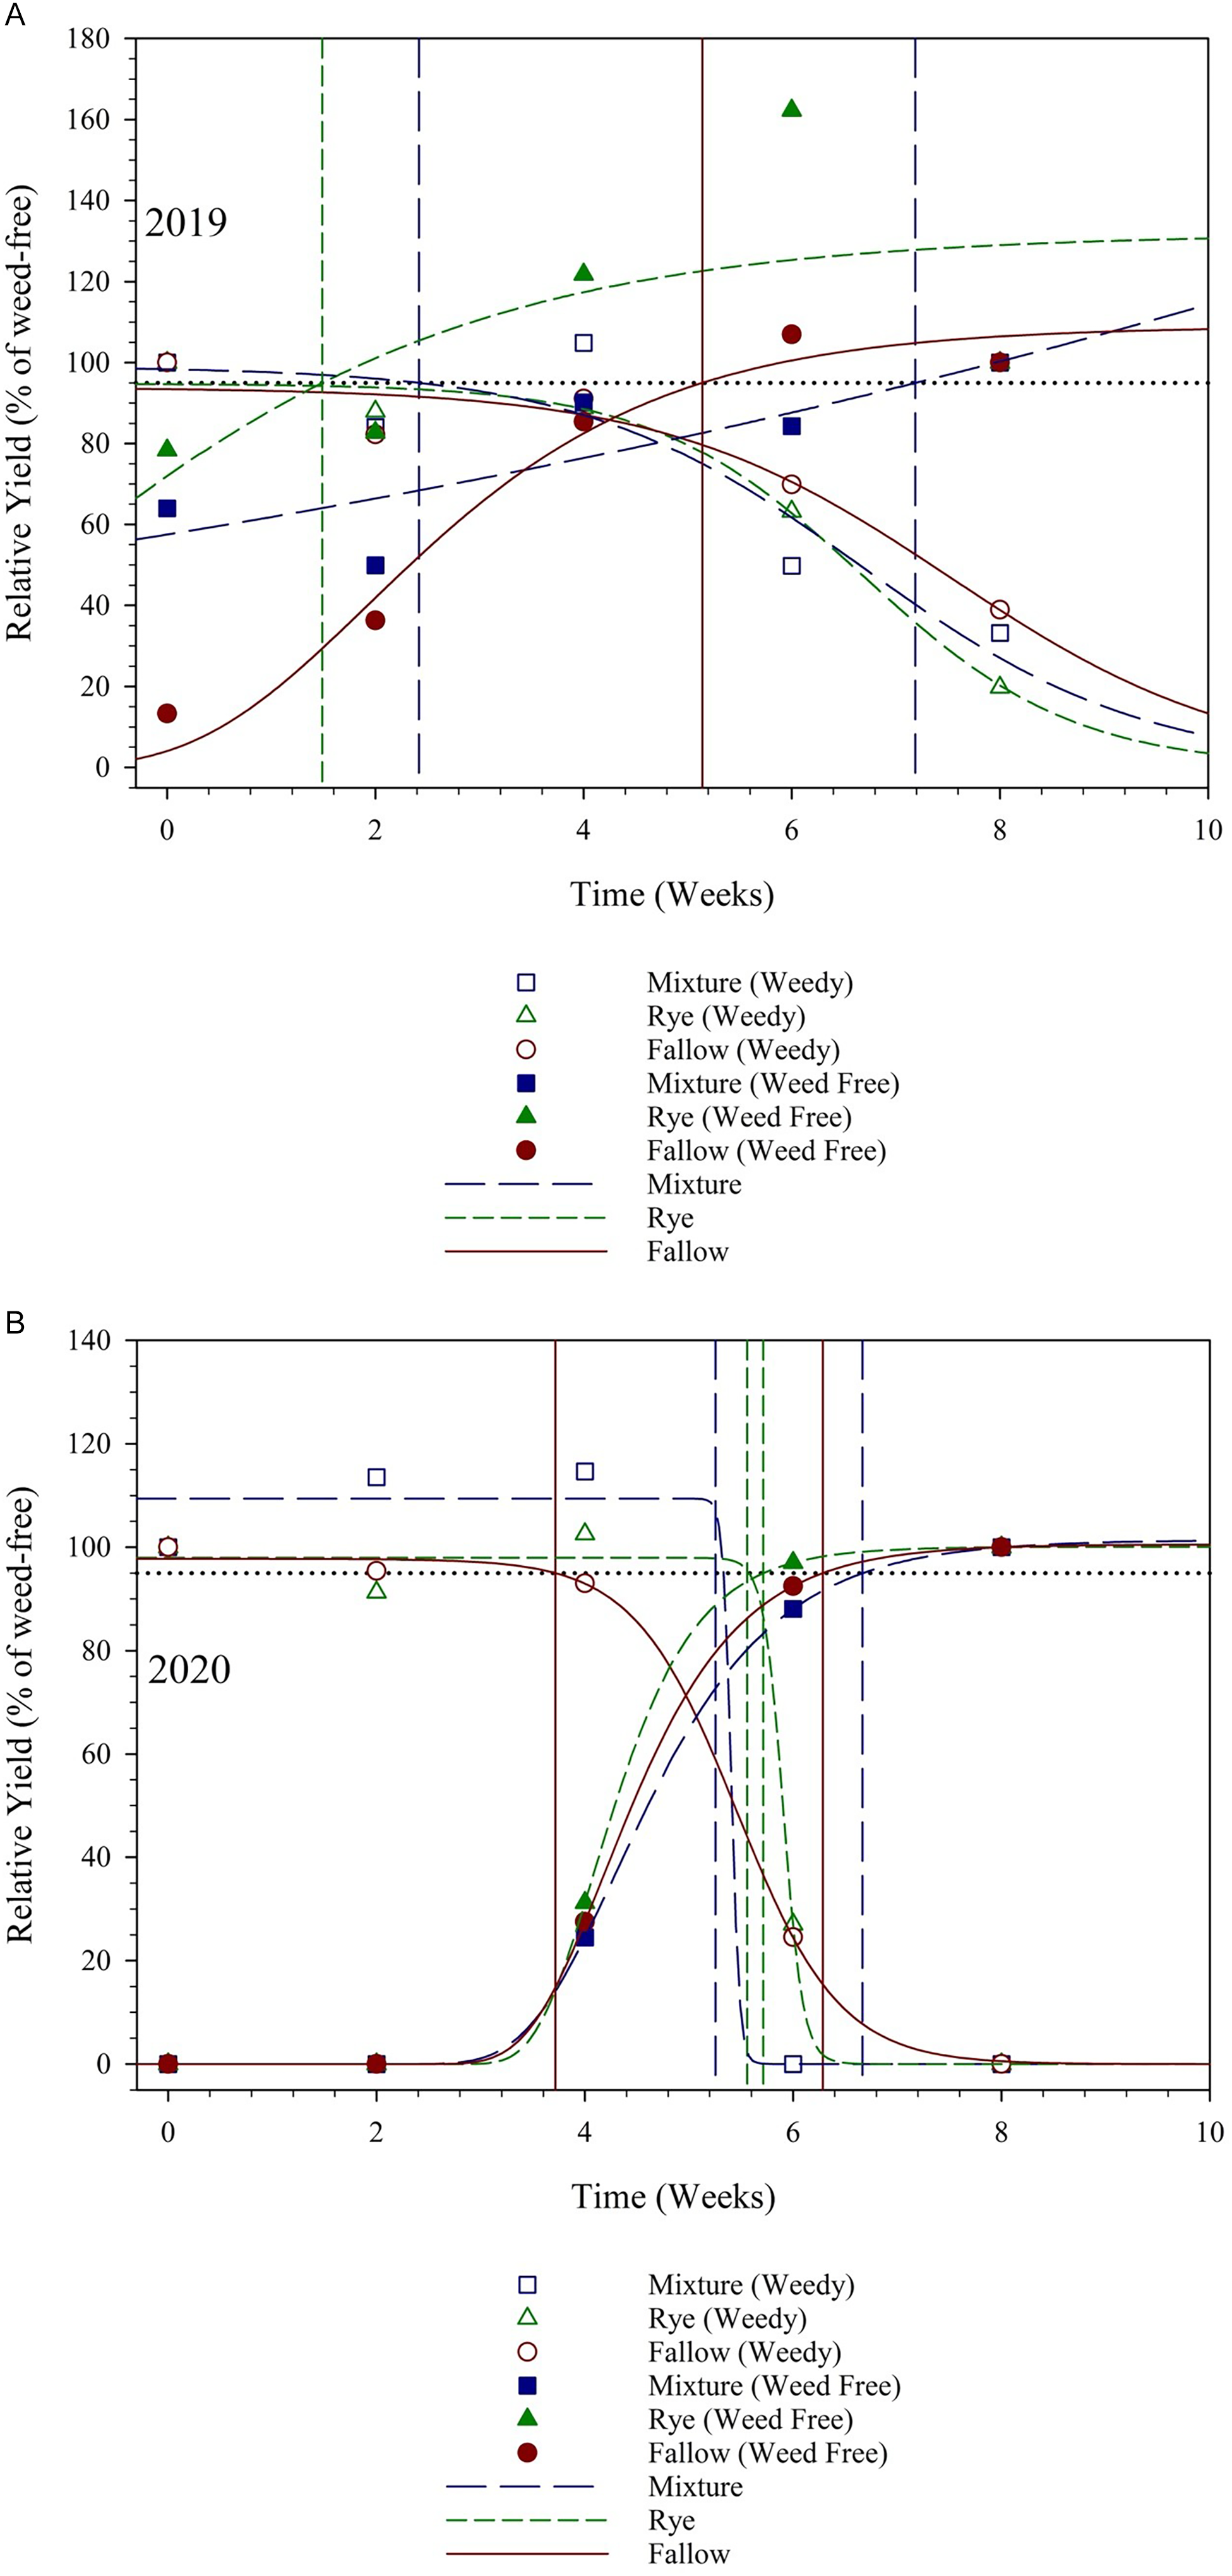
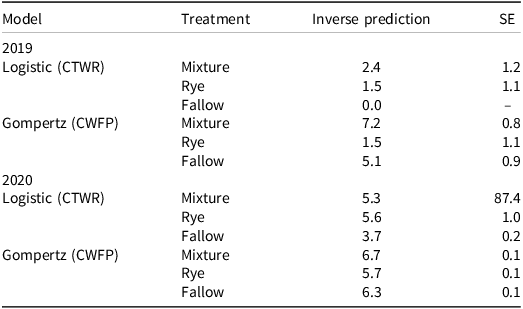
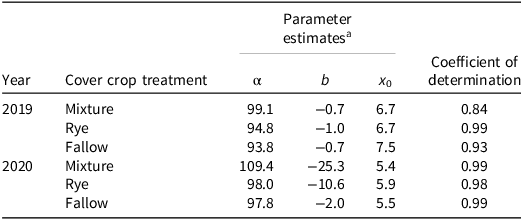
The CPWC is the period during which weeds must be managed to prevent unacceptable yield loss, but beyond this period, weeds must be controlled before they set seed to prevent herbicide resistance. In 2019, delaying weed removal until 2.4 WAP and 1.5 WAP following the cover crop mixture and cereal rye treatments, respectively, is when soybean yield loss reached the 5% threshold. More soybean yield loss occurred when weed removal was delayed after this time (Figure 1A; Tables 2 and 3). In winter fallow plots, weed pressure began just after soybean was planted, and the beginning of the critical period (CTWR) was observed at 0 WAP due to extreme weed interference during this year. The model did not predict the CTWR for the weedy curve, and the crop was unable to reach its maximum yield potential of 95% due to heavy weed infestation throughout most of the growing season. The weeds competed with the main crops for resources such as water, nutrients, sunlight, and space, making it difficult for the crop to thrive and resulting in a lower yield (Kaur et al. Reference Kaur, Kaur and Chauhan2018). The end of the critical period, or when later-emerging weeds no longer caused more than 5% soybean yield loss, was observed at 7.2 WAP, 1.5 WAP, and 5.1 WAP following cover crop mixture, cereal rye, and winter fallow treatments, respectively (Figure 1A; Tables 2 and 4). Moreover, there was only one vertical line of inverse prediction for both weedy (CTWR; starting) and weed-free plots (CWFP; end) intersected in the graph for 2019 (i.e., 1.5 WAP following cereal rye treatment) (Figure 1A; Tables 2, 3, and 4). In a similar study, Kumari et al. (Reference Kumari, Price, Korres, Gamble and Li2023a) also noted that the presence of a cereal rye cover crop postponed the CTWR followed by the immediate ending of the CWFP in comparison with a winter fallow treatment. According to Korres and Norsworthy (Reference Korres and Norsworthy2015), the existence of the cereal rye cover crop delayed the CTWR by approximately a week compared to a winter fallow treatment.
The critical period for weed control (CPWC) and its constituents (critical timing for weed control [CTWR; i.e., the weedy period] and critical weed free period [CWFP; i.e., the weed-free period]) for each treatment in 2019 (A) and 2020 (B). Point estimates for CTWR and CWFP for all treatments are described in Tables 2, 3, and 4. The black horizontal dotted line represents 95% relative yield. The vertical lines represent the start and finish of CPWC at 5% yield loss.


Table 2 Long description
A table comparing inverse prediction values for different treatments and models in 2019 and 2020. The table has four rows and three columns. The columns are labeled Model, Treatment, Inverse prediction, and SE. The rows are labeled with the years 2019 and 2020, and the models Logistic (CTWR) and Gompertz (CWFP). For 2019, the treatments are Mixture, Rye, and Fallow with inverse prediction values of 2.4, 1.5, and 0.0 respectively for Logistic (CTWR), and 7.2, 1.5, and 5.1 respectively for Gompertz (CWFP). For 2020, the treatments are Mixture, Rye, and Fallow with inverse prediction values of 5.3, 5.6, and 3.7 respectively for Logistic (CTWR), and 6.7, 5.7, and 6.3 respectively for Gompertz (CWFP). The SE values are also provided for each treatment and model.
a Abbreviations: CTWR, critical timing for weed removal; CWFP, critical weed free period; SE, standard error.
b The corresponding inverse predictions were derived using the logistic and Gompertz models to evaluate the beginning (the CTWR) and the end (the CWFP) of the critical period in 2019 and 2020.
Results of the three-parameter logistic regression model fitted to relative soybean yield to estimate the critical timing for weed removal for each treatment and to evaluate the critical period for weed control.

Table 3 Long description
A table with four rows and five columns comparing parameter estimates for different cover crop treatments across two years. The columns are labeled Year, Cover crop treatment, Parameter estimates, and Coefficient of determination. The Parameter estimates column is further divided into three sub-columns labeled alpha, b, and x0. The table presents data for the years 2019 and 2020, with cover crop treatments including Mixture, Rye, and Fallow. Each row provides specific values for alpha, b, and x0, along with the coefficient of determination for each treatment and year. Row 1: 2019, Mixture, alpha 99.1, b -0.7, x0 6.7, Coefficient of determination 0.84. Row 2: 2019, Rye, alpha 94.8, b -1.0, x0 6.7, Coefficient of determination 0.99. Row 3: 2019, Fallow, alpha 93.8, b -0.7, x0 7.5, Coefficient of determination 0.93. Row 4: 2020, Mixture, alpha 109.4, b -25.3, x0 5.4, Coefficient of determination 0.99. Row 5: 2020, Rye, alpha 98.0, b -10.6, x0 5.9, Coefficient of determination 0.98. Row 6: 2020, Fallow, alpha 97.8, b -2.0, x0 5.5, Coefficient of determination 0.99.
a Of the parameter estimates, α is the asymptote, b is the slope of the curve or growth rate, and x 0 represents the inflection point.
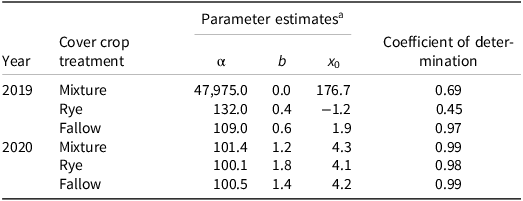
Results of the three-parameter Gompertz regression model fitted to relative soybean yield to estimate the critical weed-free period for each treatment and to evaluate the critical period for weed control.

Table 4 Long description
A table with parameter estimates for different cover crop treatments over two years. The table has four rows and five columns. The columns are labeled Year, Cover crop treatment, Parameter estimates with sub-columns alpha, b, and x0, and Coefficient of determination. The rows are labeled with the years 2019 and 2020, and the cover crop treatments Mixture, Rye, and Fallow. Row 1: 2019, Mixture, alpha: 47975.0, b: 0.0, x0: 176.7, Coefficient of determination: 0.69. Row 2: 2019, Rye, alpha: 132.0, b: 0.4, x0: -1.2, Coefficient of determination: 0.45. Row 3: 2019, Fallow, alpha: 109.0, b: 0.6, x0: 1.9, Coefficient of determination: 0.97. Row 4: 2020, Mixture, alpha: 101.4, b: 1.2, x0: 4.3, Coefficient of determination: 0.99. Row 5: 2020, Rye, alpha: 100.1, b: 1.8, x0: 4.1, Coefficient of determination: 0.98. Row 6: 2020, Fallow, alpha: 100.5, b: 1.4, x0: 4.2, Coefficient of determination: 0.99.
a Of the parameter estimates, α is the asymptote, b is the slope of the curve or growth rate, and x 0 represents the inflection point.
A difference between the CWFP (ending time) estimated from the weed-free curve and the CTWR (beginning time) estimated from the weedy curve provided the CPWC (duration).
Hence in 2019, the estimated duration of CPWC was 4.8 wk and 5.1 wk for the cover crop mixture and a winter fallow treatment, respectively. Cereal rye had only one inverse prediction that intersected for both CTWR and CWFP, hence the CPWC duration was 0 wk. (Figure 1A; Tables 2, 3, and 4). The cover crop mixture and cereal rye treatments shortened the duration of CPWC by approximately 0.3 wk and 5.0 wk, respectively, compared with the winter fallow treatment in 2019. Previous research conducted in Alabama also found that a single species of cereal rye shortened the CPWC in 2 out of 3 yr in soybean crops (Kumari et al. Reference Kumari, Price, Korres, Gamble and Li2023a, Reference Kumari, Price, Korres, Gamble and Li2023b). A previous experiment with a cotton crop found similar results indicating that a cereal rye cover crop led to a later CTWR and shortened CPWC (Price et al. Reference Price, Korres, Norsworthy and Li2018).
In 2020, the inverse predicted value of CTWR was 5.3 WAP, 5.6 WAP, and 3.7 WAP, and CWFP ended at 6.7 WAP, 5.7 WAP, and 6.3 WAP following cover crop mixture, cereal rye, and winter fallow treatments, respectively (Figure 1B; Tables 2, 3, and 4). The cover crop mixture and cereal rye delayed the CTWR by approximately 1.6 wk and 1.9 wk, respectively, compared with the winter fallow treatment (Figure 1B; Tables 2 and 3) that would help the grower by delaying herbicide applications. However, the CWFP was slightly earlier following cereal rye treatment, approximately 0.6 wk earlier than under winter fallow treatment (Figure 1B; Tables 2 and 4). Otherwise, the predicted value of the CWFP was around 6 WAP following all treatments in 2020.
As a result, the estimated duration of the CPWC was 1.4 wk, 0.1 wk, and 2.6 wk following cover crop mixture, cereal rye, and winter fallow treatments, respectively (Figure 1B; Tables 2, 3, and 4). Hence, the presence of cover crop mixture and cereal rye shortened the duration of the CPWC by approximately 1.2 wk and 2.5 wk, respectively, compared with the winter fallow treatment in 2020.
The beginning and end of the critical period was not the same in both years, but the trend of the CPWC under each treatment was similar. Halford et al. Reference Halford, Hamill, Zhang and Doucet2001 described that the observed CPWC for a crop differed from year to year and from location to location. A previous study described that the variation in crop yield and weed density had been observed when different cover crops were planted and tillage practices were different (Aulakh et al. Reference Aulakh, Price and Balkcom2011; Froud-Wiliam et al. Reference Froud-Williams, Chancellor and Drennan1983; Price et al. Reference Price, Reeves and Patterson2006, Reference Price, Balkcom, Duzy and Kelton2012), and when crop rotations and methods of weed management were also different. A simulation study by Weaver and Tan (Reference Weaver and Tan1983) illustrated that the duration of the CPWC is also dependent on soil moisture content and nutrient availability, which can influence crop-weed interactions. Additionally, the weather can influence overall yield. In this study, 2020 had a higher average rainfall than 2019, which might have contributed to a greater soybean yield in 2020.
Weed Biomass
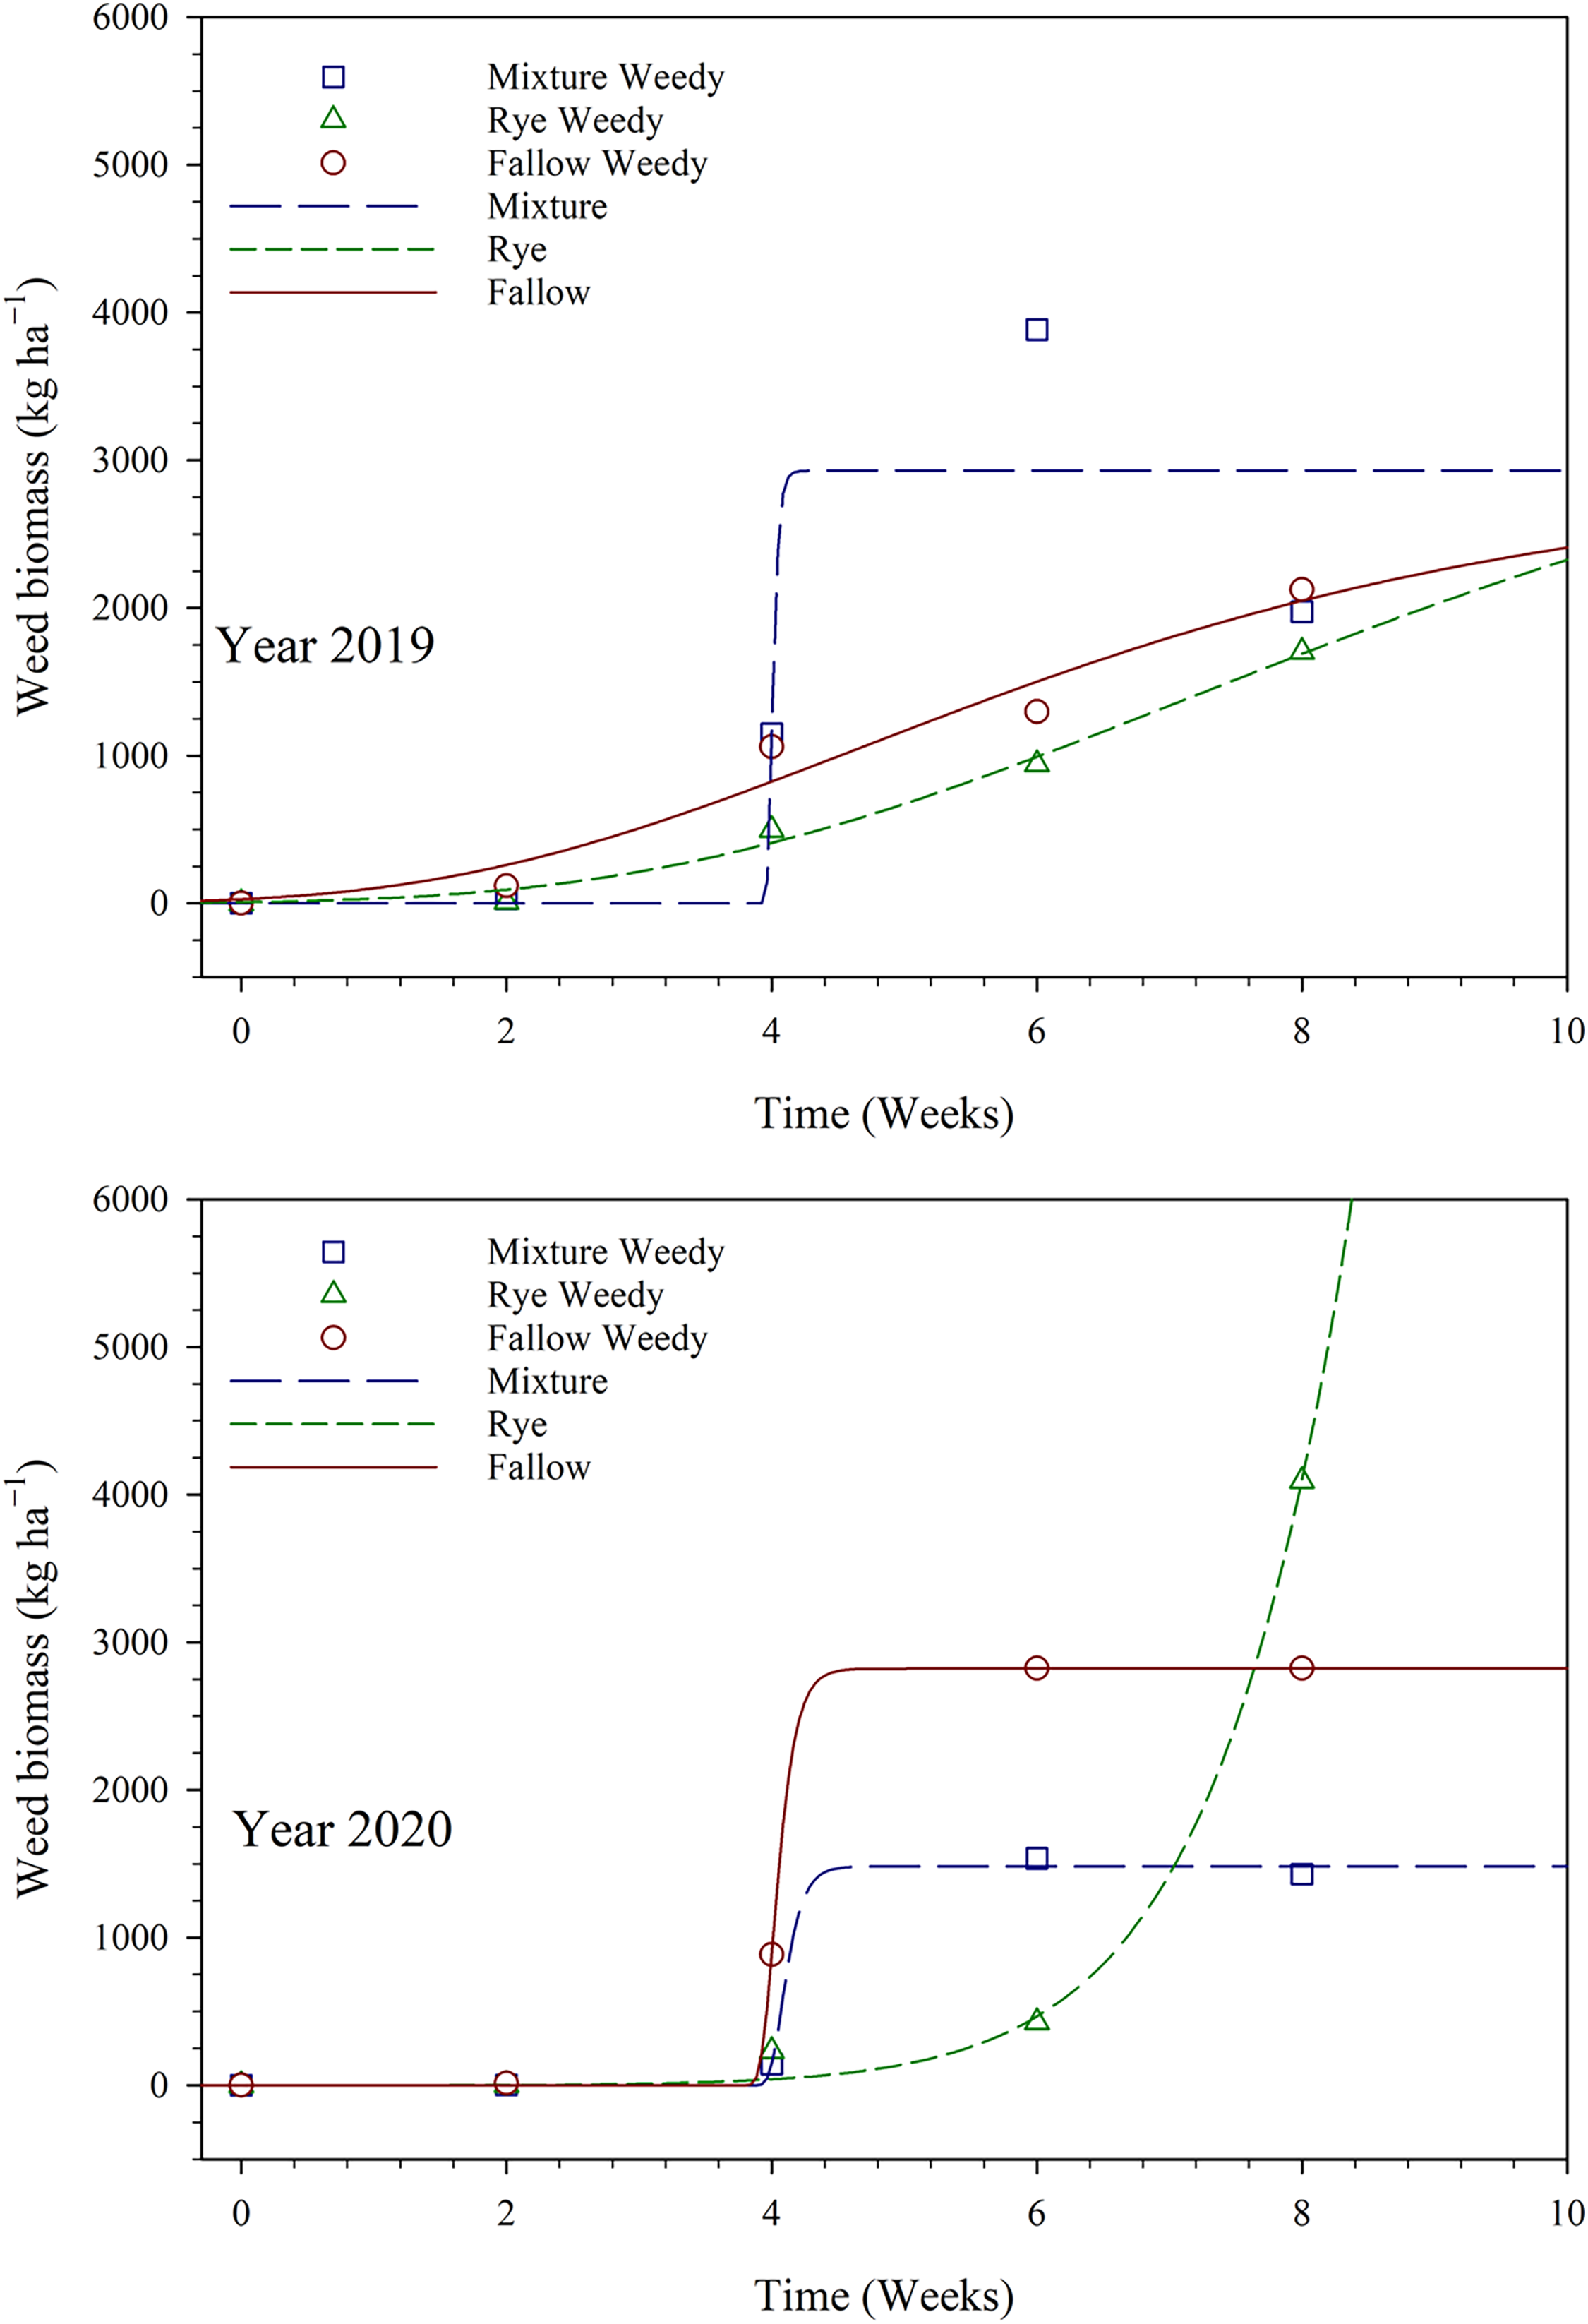
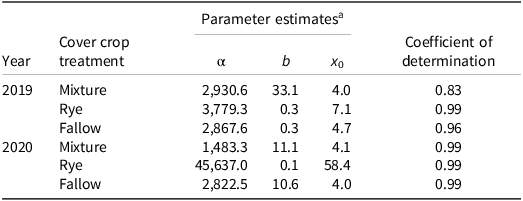
The most common weed species observed in both years were Palmer amaranth, ivyleaf morningglory, and large crabgrass. In 2019, weed removal needed to begin at 2.4 WAP, 1.5 WAP, and 0 WAP (Figure 1A; Table 2) at the weed biomass of approximately 0 to 20 kg ha−1 following cover crop mixture, cereal rye, and winter fallow treatments, respectively (Figure 2; Table 5), to prevent a yield loss greater than 5%. Moreover, weed biomass was lower in 2020 than in 2019, so weed removal was not required until 5.3 WAP, 5.6 WAP, and 3.7 WAP (Figure 1B) with approximately 1,500 kg ha−1, 400 kg ha−1, and 0 kg ha−1 in 2020 following cover mixture, cereal rye, and winter fallow treatments (Figure 2; Table 5). After this CTWR, the weed biomass started to increase significantly, which caused a yield loss greater than 5%. The weed biomass following each treatment, including cover crop mixture, cereal rye, and winter fallow, increased as the CTWR increased (Figure 2; Table 5).
Weed biomass as a function of critical timing for weed removal for each treatment. Parameters of the Gompertz model are described in Table 5.

Figure 2 Long description
Two line graphs depict weed biomass over time for different treatments in the years 2019 and 2020. Panel A: Year 2019. The line graph shows weed biomass in kilograms per hectare on the vertical axis and time in weeks on the horizontal axis. The graph includes data for Mixture Weedy, Rye Weedy, Fallow Weedy, Mixture, Rye, and Fallow treatments. The Mixture Weedy treatment shows a significant increase in weed biomass around week 4, reaching a peak and then stabilizing. The Rye Weedy treatment shows a gradual increase in weed biomass over time. The Fallow Weedy treatment shows a rapid increase in weed biomass around week 4, similar to the Mixture Weedy treatment. The Mixture, Rye, and Fallow treatments show relatively lower weed biomass throughout the period. Panel B: Year 2020. The line graph shows weed biomass in kilograms per hectare on the vertical axis and time in weeks on the horizontal axis. The graph includes data for Mixture Weedy, Rye Weedy, Fallow Weedy, Mixture, Rye, and Fallow treatments. The Mixture Weedy treatment shows a significant increase in weed biomass around week 4, reaching a peak and then stabilizing. The Rye Weedy treatment shows a gradual increase in weed biomass over time. The Fallow Weedy treatment shows a rapid increase in weed biomass around week 4, similar to the Mixture Weedy treatment. The Mixture, Rye, and Fallow treatments show relatively lower weed biomass throughout the period.
Results of the three-parameter Gompertz model used for fitting weed biomass production under various weedy periods for each treatment.

Table 5 Long description
The table presents parameter estimates for different cover crop treatments over the years 2019 and 2020. It has four rows and five columns. The columns are labeled 'Year', 'Cover crop treatment', 'α', 'b', 'x₀', and 'Coefficient of determination'. The rows are labeled with the years 2019 and 2020, and the cover crop treatments are 'Mixture', 'Rye', and 'Fallow'. The values in the columns are as follows: Row 1: 2019, Mixture, 2,930.6, 33.1, 4.0, 0.83. Row 2: 2019, Rye, 3,779.3, 0.3, 7.1, 0.99. Row 3: 2019, Fallow, 2,867.6, 0.3, 4.7, 0.96. Row 4: 2020, Mixture, 1,483.3, 11.1, 4.1, 0.99. Row 5: 2020, Rye, 45,637.0, 0.1, 58.4, 0.99. Row 6: 2020, Fallow, 2,822.5, 10.6, 4.0, 0.99. The table shows the parameter estimates for different cover crop treatments and their coefficient of determination for the years 2019 and 2020.
a Of the parameter estimates, α is the asymptote, b is the slope of the curve or growth rate, and x 0 represents the inflection point.
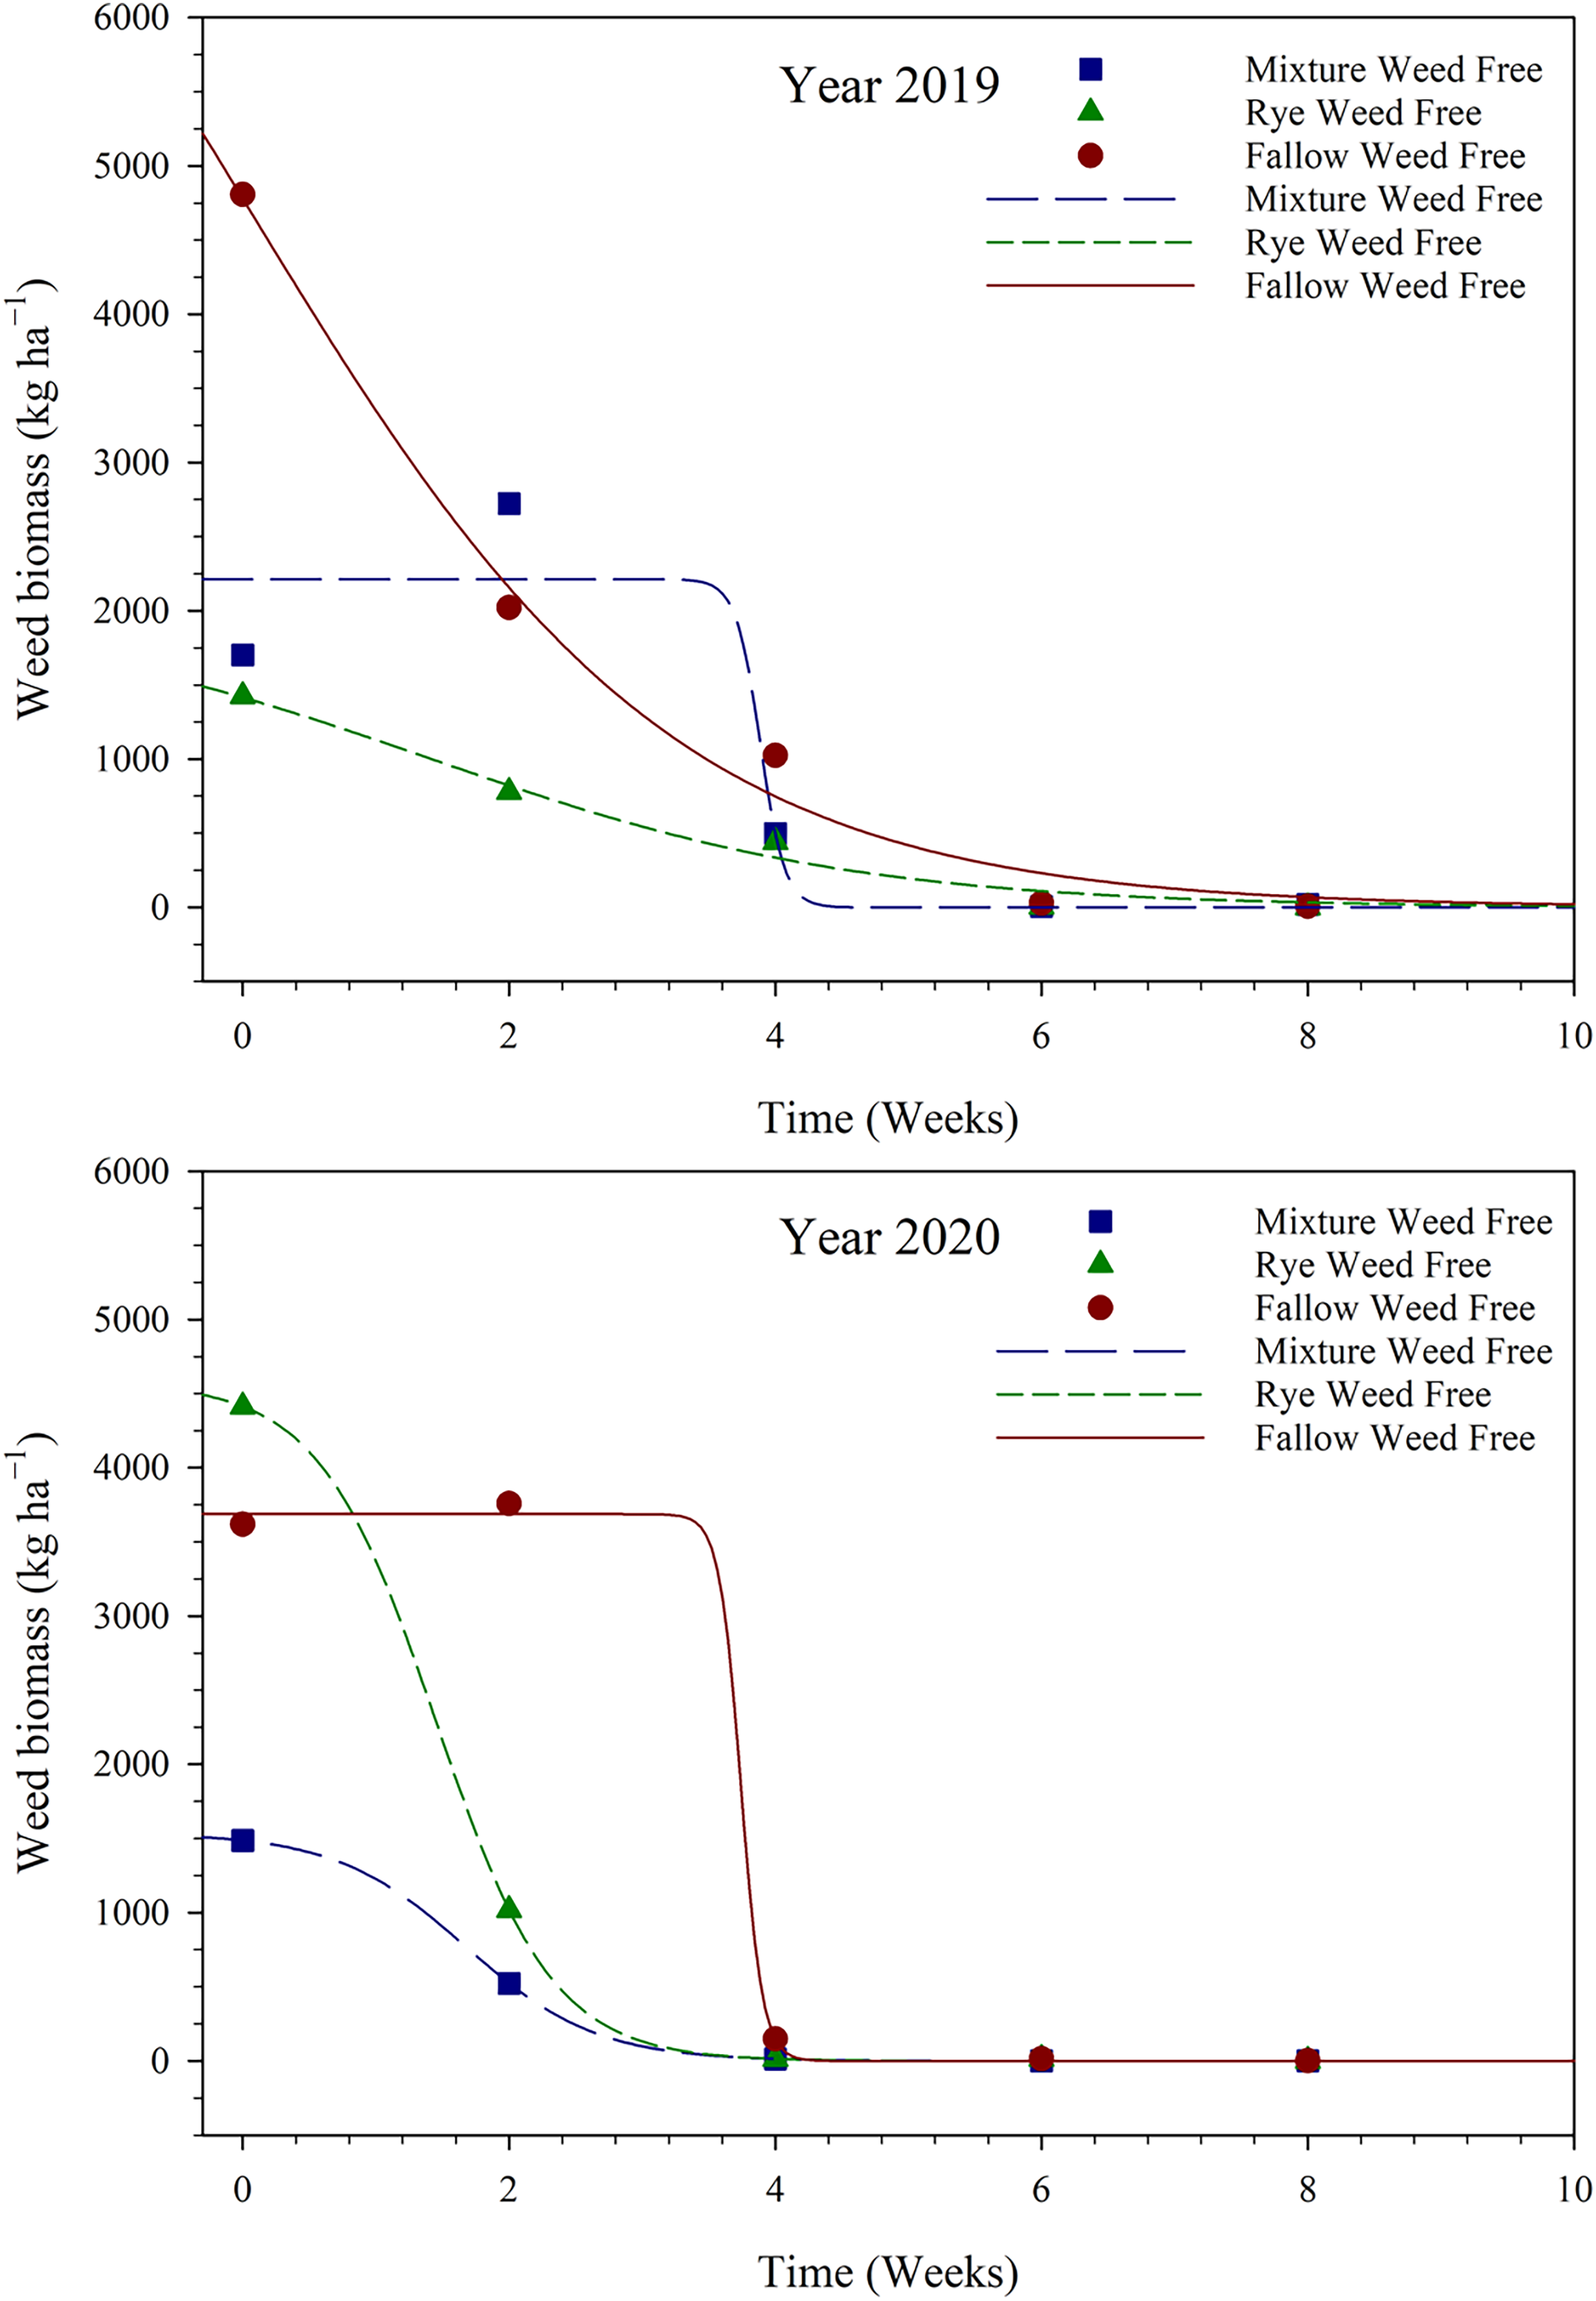
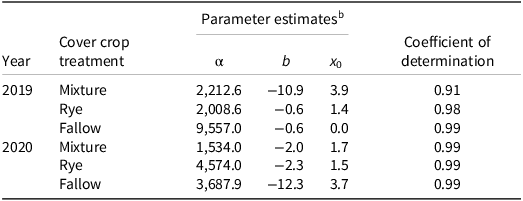
In 2019, the time up to which it was necessary to ensure plots were weed-free (the CWFP) was observed at 7.2 WAP, 1.5 WAP, and 5.1 WAP (Figure 1A; Table 2). The threshold of weed biomass was 30 kg ha−1, 1,000 kg ha−1, and 100 kg ha−1 following cover crop mixture, cereal rye, and winter fallow treatments, respectively, to prevent a yield loss greater than 5% (Figure 3; Table 6). Overall, weed biomass production was lower in 2020 than in 2019 (Figures 2 and 3). In 2020, only 0 to 10 kg ha−1 weed biomass was collected at 6.7 WAP, 5.7 WAP, and 6.3 WAP (Figure 1B; CWFP, i.e., the end) following cover crop mixture, cereal rye, and winter fallow treatments, respectively (Figure 3; Table 6).
Weed biomass as a function of the critical weed free period for each treatment. The parameters of the logistic model are described in Table 6.

Figure 3 Long description
Two line graphs depict weed biomass as a function of the critical weed-free period for different treatments over the years 2019 and 2020. Panel A: Year 2019. The line graph shows weed biomass in kilograms per hectare on the vertical axis and time in weeks on the horizontal axis. The graph includes three treatments: Mixture Weed Free, Rye Weed Free, and Fallow Weed Free, each represented by different symbols and line styles. The Mixture Weed Free treatment is represented by blue squares and a dashed line, the Rye Weed Free treatment by green triangles and a dashed line, and the Fallow Weed Free treatment by red circles and a solid line. The weed biomass decreases over time for all treatments, with the Fallow Weed Free treatment showing the steepest decline. Panel B: Year 2020. The line graph shows weed biomass in kilograms per hectare on the vertical axis and time in weeks on the horizontal axis. The graph includes the same three treatments as in Panel A, represented by the same symbols and line styles. The weed biomass again decreases over time for all treatments, with the Fallow Weed Free treatment showing the steepest decline.
Results of the three-parameter logistic model used for fitting weed biomass production under various weed-free periods for each treatment. a

Table 6 Long description
The table presents parameter estimates for different cover crop treatments over the years 2019 and 2020. It has four rows and five columns. The columns are labeled 'Year', 'Cover crop treatment', 'α', 'b', 'x₀', and 'Coefficient of determination'. The rows are labeled with the years 2019 and 2020, and the cover crop treatments are 'Mixture', 'Rye', and 'Fallow'. The values in the columns are as follows: Row 1: 2019, Mixture, 2,212.6, -10.9, 3.9, 0.91. Row 2: 2019, Rye, 2,008.6, -0.6, 1.4, 0.98. Row 3: 2019, Fallow, 9,557.0, -0.6, 0.0, 0.99. Row 4: 2020, Mixture, 1,534.0, -2.0, 1.7, 0.99. Row 5: 2020, Rye, 4,574.0, -2.3, 1.5, 0.99. Row 6: 2020, Fallow, 3,687.9, -12.3, 3.7, 0.99. The table shows the parameter estimates for different cover crop treatments and their coefficient of determination for the years 2019 and 2020.
a The weed biomass values were all measured at 8 wk after planting to reflect the amount of biomass grown with different weed-free periods.
b Of the parameter estimates, α is the asymptote, b is the slope of the curve or growth rate, and x 0 represents the inflection point.
The presence of cover crops suppressed the weed biomass production almost throughout the season for both CTWR and CWFP components of the CPWC in both years (Figures 2 and 3). However, the variation in weed biomass that triggered the CPWC differed between the two years. Previous literature demonstrated that the extent of crop yield reduction caused by weeds varies and is influenced by multiple factors, including weed species and biomass, weed density, timing of weed emergence relative to crop emergence, weed distribution, soil type, soil moisture, pH, and soil fertility levels (Fahad et al. Reference Fahad, Hussain, Chauhan, Saud, Wu, Hassan and Huang2015; Tursun et al. Reference Tursun, Datta, Budak, Kantarci and Knezevic2016; Zimdahl Reference Zimdahl2007). Also, weed biomass production was found to be lower following after treatments with a cover crop mixture and cereal rye alone compared with winter fallow at both the starting and ending periods for weed removal (Figures 2 and 3). In both years, the presence of cover crops compared with winter fallow treatments delayed the CTWR; less weed biomass was found in plots where cover crops had been planted. For example, previous research reported that cover crops cause delays in the emergence and establishment of weed seedlings due to their allelopathic effects, which negatively affects weed seed germination (Haramoto and Gallandt Reference Haramoto and Gallandt2004). Also, by forming a dense mat of cover crop mulch on the ground, winter cover crops act as a significant physical barrier that prevents germination (Price et al. Reference Price, Balkcom and Arriaga2005; Teasdale and Mohler Reference Teasdale and Mohler2000). Similar research conducted in the southeastern United States also suggested that cover crops are significantly more effective at suppressing weeds than winter fallow in conservation tillage systems for soybean (Kumari et al. Reference Kumari, Price, Korres, Gamble and Li2023a, Reference Kumari, Price, Gamble, Li and Jacobson2024a). Cover crops are especially effective in the southeastern United States because of the favorable weather, soil conditions, and cropping systems that enhance their benefits. Cover crop practices in the Southeast differ from those in other parts of the United States in terms of planting and termination timing, and in their intended purposes. Furthermore, cover crop biomass in cereal rye treatments was more than in mixture plots in 2019, resulting in less weed biomass in the cereal rye plots. In 2020, however, the cover crop mixture had higher biomass on average than cereal rye plots, leading to reduced weed biomass. Cover crop biomass is a key factor influencing weed suppression, and greater biomass provides more effective weed control (Kumari et al. Reference Kumari, Price, Li, Gamble and Jacobson2025).
Practical Implications
In 2019, a cover crop of cereal rye had the shortest CPWC duration, which was only 1.5 WAP, and winter fallow had the longest (5.1 wk) CPWC period. In addition, the cover crop mixture treatment had a CPWC duration of 4.8 wk. A similar trend was observed in 2020: the cereal rye treatment had the shortest CPWC duration (0.1 wk), while winter fallow had the longest duration (2.6 wk), as the cover crop biomass suppressed weeds and reduced the overall weed biomass. At the same time, the cover crop mixture treatment had a CPWC of 1.4 wk in 2020.
The findings from this study may be valuable for producers in designing a cost-effective strategy for herbicide application and for developing an integrated weed management system using cover crops. Integrating cover crops into soybean production can reduce troublesome weed interference through their weed-suppressive ability, thereby reducing reliance on herbicides and tillage practices. At our experimental site soybean yield was not affected in traditionally low-yield plots. Our results illustrate that cover crops shortened the CPWC compared with winter fallow; hence, the use of postemergence herbicides could appropriately control later-emerging weeds in cover crop treatments (Van Acker et al. Reference Van Acker, Swanton and Weise1993) in a management strategy that includes residual herbicides. Furthermore, a previous study by Kumari et al. (Reference Kumari, Price, Korres, Gamble and Li2023b) demonstrated better weed control in cover crop plots that also received herbicides. Hence, estimating the CPWC provides the most suitable timing for herbicide application and other weed control practices in soybean production.
Acknowledgments
We thank the staff members at the E. V. Smith Research and Extension Center for their assistance with field experiments.
Funding
This research received no specific grant from any funding agency, commercial or not-for-profit sectors.
Competing Interests
The authors declare they have no competing interests.

 Open access

