



‘As a dimension of poverty, seasonality is as glaringly obvious as it is still grossly neglected. Attempts to embed its recognition in professional mindsets, policy and practice have still a long way to go.’
Robert Chambers ( Reference Chambers 1 )
Seasonality in food consumption patterns in developing countries attracted considerable research attention in the 1990s and early 2000s. Nutritionists and other researchers documented substantial intra-annual fluctuations in children’s and adults’ anthropometric measures( Reference Ferro-Luzzi, Morris and Taffesse 2 – Reference Panter-Brick 6 ). Economists found how various welfare indicators, such as consumption, incomes and prices, moved together with the agricultural seasons in many developing countries( Reference Dercon and Krishnan 7 – Reference Sahn and Delgado 10 ). This body of research greatly improved our understanding of the seasonal stress that rural households in low-income countries face( Reference Sahn 11 ). It also provided methodological insights into administering household surveys in developing country settings( Reference Deaton and Grosh 12 ). After these contributions were made, seasonality generally has received less research attention and has been largely neglected in policy arenas( Reference Devereux, Sabates-Wheeler and Longhurst 13 ). Kaminski et al. ( Reference Kaminski, Christiaensen and Gilbert 14 ) conjectured that this is partly due to the (mis)perception that local food markets are now well integrated in much of the developing world.
An emerging body of literature emphasizes the role of diet quality on various health and nutrition outcomes. Diet quality is typically measured through dietary diversity scores that count the number of food groups consumed in the previous 24 h to past 7 d( Reference Arimond and Ruel 15 – Reference Moursi, Arimond and Dewey 17 ). Low diversity in diets is found to be associated with increased risk of chronic undernutrition among children( Reference Arimond and Ruel 15 , Reference Mallard, Houghton and Filteau 18 ), Fe deficiency among children and adult women( Reference Tatala, Svanberg and Mduma 19 , Reference Bhargava, Bouis and Scrimshaw 20 ) and mortality from cancer and CVD( Reference Kant, Schatzkin and Ziegler 21 ). Dietary diversity is also considered a good indicator of food security( Reference Hoddinott and Yohannes 22 , Reference Ruel 23 ). The importance of diet quality is now well acknowledged in the nutrition community( 24 , 25 ).
Despite this growing emphasis on diet quality in developing countries, limited evidence exists on how diet quality changes with the agricultural seasons. Most of the existing evidence comes from Burkina Faso. Savy et al. ( Reference Savy, Martin-Prével and Traissac 26 ) studied seasonality and dietary diversity in rural Burkina Faso using data from a sample of 550 women. Using a 9-point dietary diversity indicator, the authors found that an average woman in the sample consumed food from 3·4 food groups at the beginning of the lean season and from 3·8 food groups at the end of the lean season. This 10·5 % increase in the average dietary diversity score during the lean season was attributed to changes in diets away from meat, poultry and fish to legumes, vegetables and milk. Becquey et al. ( Reference Becquey, Delpeuch and Konaté 27 ) studied changes in households’ diets in the city of Ouagadougou during the lean and post-harvest seasons. Analysing data from a representative sample of 1056 urban households, they found that households consumed a diet that was less rich in terms of energy and micronutrients during the lean season compared with the post-harvest season. Arsenault et al. ( Reference Arsenault, Nikiema and Allemand 28 ) found similar evidence from rural Burkina Faso through an analysis of seasonal changes in nutrient intakes of 480 young children and their mothers. Elsewhere, Hassan et al. ( Reference Hassan, Huda and Ahmad 29 ) showed how food intakes tracked seasonal food availability in Bangladesh, while Bates et al. ( Reference Bates, Prentice and Paul 30 ) found that seasonality is an important determinant of micronutrient status among pregnant and lactating women in rural Gambia.
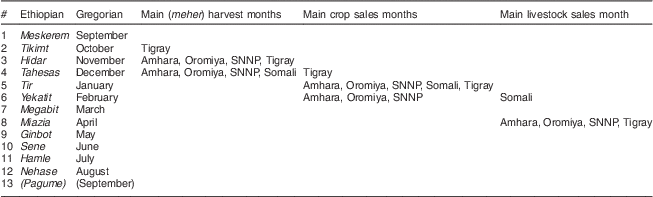
About 80 % of the 85 million Ethiopians reside in rural areas and more than 80 % of the employed people engage in agricultural activities( 31 , 32 ). Ethiopian farmers rely largely on rain-fed agriculture and therefore agricultural production in the country takes place in seasonal cycles. The main agricultural areas of the country have two rainy seasons. The small rainy season (belg) typically occurs between March and May and the main rainy season (meher) takes place between June and October. Meher is the most important season for agricultural production with more than 90 % of the total crop production in the country taking place during this season( Reference Taffesse, Dorosh and Gemessa 33 ). Table 1 shows how the timing of the main harvesting season (following the meher rains) varies across the main regions, but occurs broadly between October and December. The bulk of crop sales by farm households occur in the months of December, January and February. Livestock sales are more evenly scattered across the year. However, April – typically the month just after the main Orthodox fasting season (see below) – records the largest sales.
Ethiopian and Gregorian calendars, and main harvest and sales months by the main regions
SNNP, Southern Nations, Nationalities, and Peoples’ Region.
Harvest and sales times are based on own calculations from the Ethiopian Rural Socioeconomic Survey–2012( 53 ) and the Feed the Future Survey 2013( Reference Bachewe, Berhane and Hirvonen 54 ).
The Ethiopian calendar months typically begin during the first half of the Gregorian calendar month. Exact one-to-one mapping is therefore not possible. The Ethiopian calendar consists of thirteen months. The last month (Pagume) is only 5 d (6 d in leap years) and is therefore ignored in the analysis.
In addition to weather cycles, religion plays a central role in shaping diets during a calendar year. This is particularly the case for the Orthodox Christians who comprise 44 % of the Ethiopian population( 31 ). The Orthodox Church year has a number of fasting periods. Lent is the longest fasting period spanning 55 d and usually taking place between February and April. During this period, devout Orthodox Christians follow a vegan diet by refraining from consuming meat or other animal products (e.g. milk, butter). Other shorter fasting periods occur in December–January (40 d) and August (16 d). For Muslims – who comprise 34 % of the population( 31 ) – Ramadan is the main fasting period and its timing varies across years. During Ramadan, Muslims abstain from eating and drinking between sunrise and sunset. The consumption of animal products is not restricted during Ramadan.
It is important to take these religious fasting events into account when analysing seasonality in the Ethiopian context. For example, when analysing the role of seasonality on diets in the following section, we expect that dietary diversity is lower during Lent. While only the followers of the Orthodox religion fast during Lent, the availability of animal products is limited during this period, especially in urban areas where many butcher shops close their businesses due to lack of demand. As Ramadan affects only the timing of meals, rather than restricting the content of the meals, it should not have a similar effect on dietary diversity. If anything, we expect that diets are more diverse during Ramadan, since the evening meals to break the fast generally consist of a wider variety of foods than is normally consumed( Reference Trepanowski and Bloomer 34 ). However, we are not aware of studies that directly assess this question. The evidence on the impact of Ramadan on energy intake is inconclusive( Reference Trepanowski and Bloomer 34 ).
The present paper revisits seasonality by assessing how the quantity and quality of diets vary across agricultural seasons in rural and urban Ethiopia. Using unique nationally representative household-level data for each month over one calendar year, we document seasonal fluctuations in household diets in terms of both the quantity of energy consumed and the number of different food groups from which households consumed food.
Methods
The primary data source used for the analysis described here is the Household Consumption and Expenditure Survey (HCES)( 35 ). While not originally designed for nutrition analysis, the HCES data have been found to provide consistent information about various nutrition measures when compared with surveys based on 24 h recall( Reference Fiedler 36 ). The Ethiopian HCES data are collected by the Ethiopian Central Statistical Agency and serve as the official source for poverty statistics in Ethiopia( 37 ). The latest HCES was conducted from 8 July 2010 to 7 July 2011. A novel feature of this round of the survey is that nationally representative data were collected in each month over one calendar year. Field teams of enumerators interviewed about 2300 households in each calendar month. A total of 27 835 households were interviewed in the 12-month period. The survey covered all eleven regions of the country and included 864 rural and 1104 urban enumeration areas. The HCES did not cover the pastoralist communities in Afar (three zones) and Somali (six zones). The sampling began by stratifying the country into rural and urban areas. After that, the enumeration areas were selected using the probability-proportional-to-size approach where more populated units have a higher probability of being selected into the sample. The final household sample was then formed of households that were randomly selected from these enumeration areas. We use sampling weights, which are based on selection probabilities and provided by the Central Statistical Agency, to compute representative estimates for rural and urban areas of the country. In order to minimize recall error on consumption, each survey household was visited at least twice within one week. The HCES recorded dates using the Ethiopian calendar, which is different from the Gregorian calendar used in most Western countries. We map these Ethiopian calendar months onto the Gregorian calendar months (Table 1) and use the latter throughout the paper.
Household diets were assessed through an extensive consumption–expenditure module that considered 275 food items. The survey recorded the household’s food consumption over the past 7 d. Since each household was visited at least twice, the actual recall period in the consumption module was 3 to 4 d. This alleviates concerns of recall bias in our energy intake and dietary diversity estimates.
We use daily per capita energy intake as our measure of diet quantity. For each food item, the survey recorded the quantity consumed which was then transformed into kilograms. Finally, the energy consumption measure was computed using the energy conversion factors reported in the Ethiopian food composition table( 38 ). The food composition table provides estimates for the number of kilocalories per 100 g for each food type.
The quality of diets is assessed using the household dietary diversity score (HDDS). Following Swindale and Bilinsky( Reference Swindale and Bilinsky 39 ), we categorized each of the 275 food items included in the questionnaire into twelve food groups: (i) cereals; (ii) roots and tubers; (iii) vegetables; (iv) fruits; (v) meat, poultry and offal; (vi) eggs; (vii) fish and seafood; (viii) pulses, legumes and nuts; (ix) milk and milk products; (x) oil and fats; (xi) sugar and honey; and (xii) miscellaneous foods. After this, the HDDS was computed by summing up the food groups from which the household consumed food items. A household that consumed an item from each food group receives the maximum score of 12. In contrast, a household that consumed only cereals and pulses over the 7 d period, for example, obtains an HDDS of 2. The HDDS is constructed so that a higher dietary diversity score implies that the household consumes a diet that has more diversity in terms of foods consumed and, by extension, in terms of macro- and micronutrients.
The HCES did not collect information about the household’s involvement in fasting activities in the past 7 d. We therefore settle for matching the dates of the main fasting periods with the HCES data. We return to this limitation of our study in the Discussion section. In the survey period, Lent started on 28 February (21 Yekatit) and ended on 16 April (8 Miazia). Ramadan started on 1 August (25 Hamle) and ended on 29 August (23 Nehase).
Results
Figure 1 plots the mean per capita daily energy intake for each month. In line with the findings of Berhane et al. ( Reference Berhane, McBride and Hirfrot 40 ) and the Central Statistical Agency( 35 ), rural households are seen to enjoy better diets in terms of energy consumed. The mean daily energy consumption for rural households was 10 226 kJ (2444 kcal) per capita, whereas urban households consumed, on average, 9569 kJ (2287 kcal) per capita. This difference in average energy consumption likely reflects higher average energy requirements in rural areas partly due to the demands of more physical labour( Reference Popkin 41 ). More expensive sources of energy in urban areas may also play a role in these different energy consumption patterns (I Worku, M Dereje, G Berhane, B Minten and AS Taffesse, unpublished results).
Seasonal patterns in mean daily per capita energy intake, by rural/urban setting, among 27 835 households from eleven regions of Ethiopia; Household Consumption and Expenditure Survey, 2010/11( 35 ). The vertical axis measures daily per capita energy consumption of households in kilocalories (1 kcal=4·184 kJ). The solid line gives the mean for each calendar month and the grey area represents the 95 % confidence interval
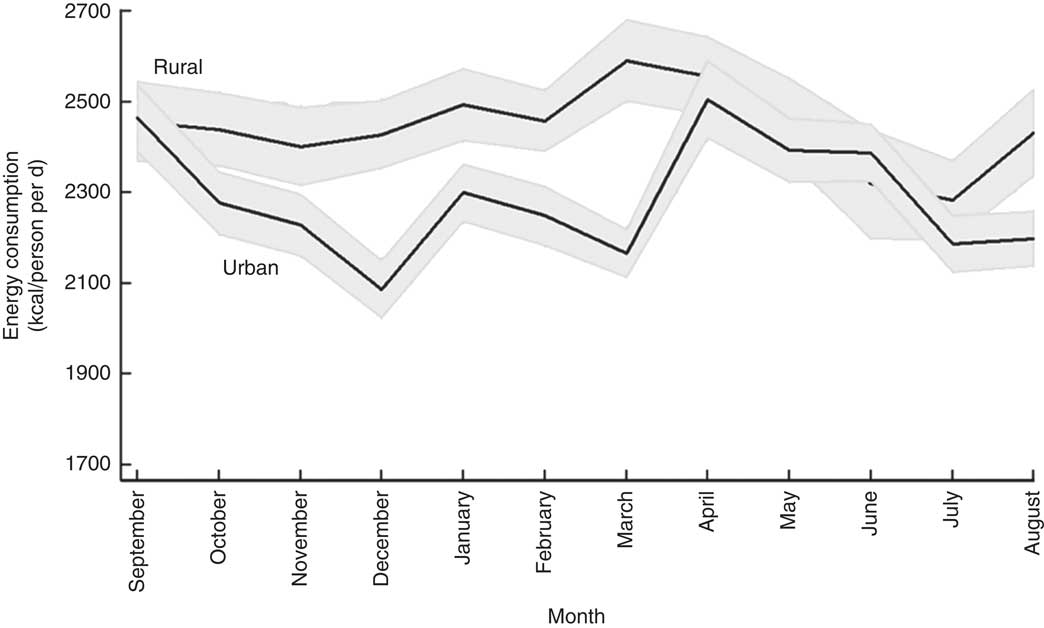
Looking at the seasonal patterns reveals that rural households maintained a similar level of energy consumption throughout the year, except during the lean season (June–July) when energy intake dropped sharply. Compared with February (10 288 kJ (2459 kcal)), energy intake was about 6–7 % lower in June (9703 kJ (2319 kcal); P<0·05) and July (9552 kJ (2283 kcal); P<0·001). Average energy intake for the urban sample showed more volatility and seemed to be more affected by the Orthodox fasting events. During the two main fasting periods, December (8732 kJ (2087 kcal)) and March (9063 kJ (2166 kcal)), energy consumption in urban areas fell sharply but rose quickly once the fasting period was over. Similarly to rural households, energy consumption among urban households was low during the lean season (June: 9150 kJ (2187 kcal)). Fasting was not associated with a similar reduction in energy consumption in rural areas, possibly because animal-source foods contributed little to overall energy intake (see Fig. 3).
Figure 2 shows how the number of food groups from which food is consumed varied across the calendar year. Here we see that urban households consumed a more diverse diet than their rural counterparts. The mean number of food groups from which food was consumed by urban households was 7·7 across the twelve months, while the corresponding figure for rural households was 6·4 out of the maximum of twelve food groups. For both rural and urban households, the two fasting months, December (rural: 6·19; urban: 7·53) and March (rural: 6·36; urban: 7·35), were associated with a drop in the dietary diversity score. HDDS for rural households was highest in February (6·73) and lowest in June (5·98; P<0·001) but interestingly was at post-harvest levels in July (6·57). Urban households’ HDDS was somewhat less affected by the scarcity of food in the lean season: HDDS was highest in July (8·10) when HDDS was 5·2 % above the monthly mean value (P<0·001).
Seasonal patterns in mean household dietary diversity score (HDDS), by rural/urban setting, among 27 835 households from eleven regions of Ethiopia; Household Consumption and Expenditure Survey, 2010/11( 35 ). The vertical axis measures the number of food groups consumed by households. The solid line gives the mean for each calendar month and the grey area represents the 95 % confidence interval
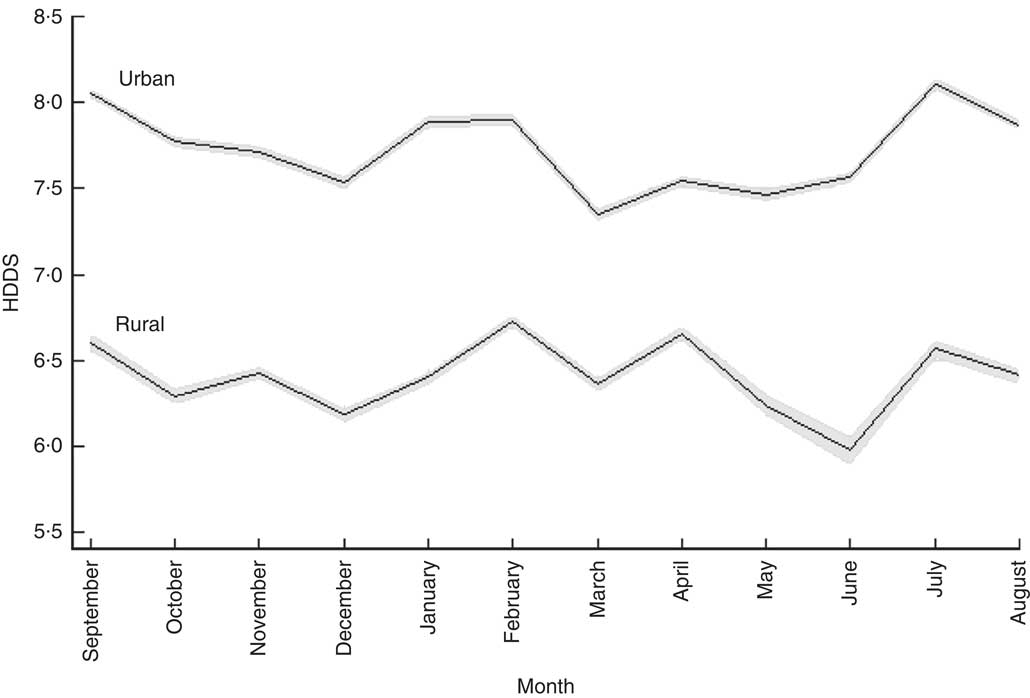
Figure 3 provides the percentage share of average energy intake from non-cereal sources for each month. Cereals (the omitted food category in Fig. 3) were the main source of energy for both rural and urban households. On average, about 60 % of the energy consumed by households came from cereals, with little difference between urban and rural households. However, there was considerable seasonal variation in the energy sources in rural areas, less so in urban areas. In the post-harvest period, March and April, 44 % of energy consumed by rural households originated from non-cereal sources. In the lean season, cereals became more important. The share of energy coming from non-cereals dropped below 40 % in the lean season, with only 30 % of energy coming from non-cereal sources in June.
Percentage share of daily per capita energy intake from non-cereal sources by month, by (a) rural and (b) urban setting, among 27 835 households from eleven regions of Ethiopia; Household Consumption and Expenditure Survey, 2010/11(
35
). The vertical axis measures the percentage of daily per capita energy in each month coming from different food groups:  , other sources;
  , roots and tubers;
  , pulses, legumes and nuts;
  , fruits and vegetables;
  , animal-source foods. The number at the top of each bar gives the percentage of energy coming from non-cereal foods. Cereal foods constitute the omitted category; the percentage of energy coming from cereals each month can be obtained by subtracting the number at the top of the bar from 100. The ‘other sources’ category includes oils and fats, sugar and honey, and miscellaneous items
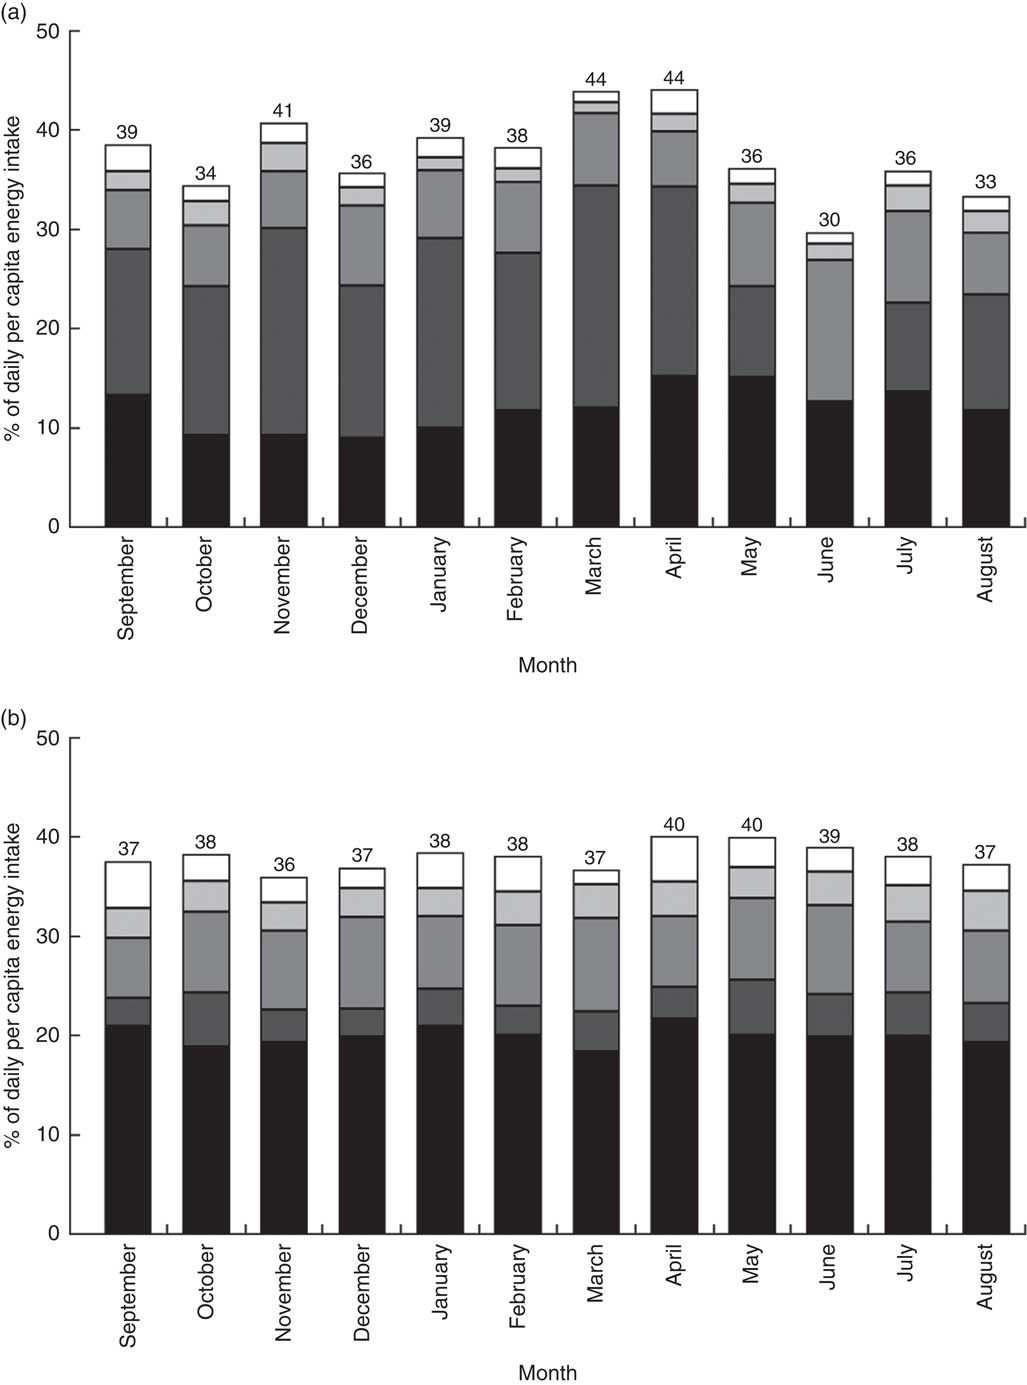
Roots and tubers were the second most important source for energy for rural households. Throughout the year, about 15 to 20 % of energy came from this food group. However, the consumption of roots and tubers plummeted dramatically in the lean season. The share of energy consumed coming from roots and tubers dropped to 9 % in May and then to 0·2 % in June, while recovering back to 9 % in July. For urban households, roots and tubers constituted a less important source of energy, with only 4 % of energy coming from this source, on average.
Pulses, legumes and nuts contributed about 8 % to the overall energy intake in both areas. The share increased to 14 % in June – the month in which rural households stopped consuming roots and tubers. Animal-source foods (meat, poultry, fish, and milk and milk products) contributed little to the overall energy intake, 1·7 % for rural households and 3·0 % for urban households, on average. As expected, the shares fell in December (rural: 1·5 %; urban: 2·0 %) and March (rural: 1·1 %; urban: 1·5 %), the main Orthodox fasting months. Fruits and vegetables were another unimportant source of energy (rural: 1·9 %; urban: 3·3 %). The ‘other sources’ category includes oils and fats, sugar and honey, and miscellaneous items. Oils and fats were a particularly important source of energy for the urban households with 10·5 % of energy coming from this source, on average (rural: 3·1 %).
Discussion
Our national-level estimates confirm the results from previous studies: Ethiopian diets are characterized by low energy intakes and are monotonous in terms of dietary diversity( Reference Headey 42 , Reference Hirvonen and Hoddinott 43 ). Low energy intakes and dietary diversity are likely to have serious nutritional implications. For example, recent literature shows how dietary diversity is positively correlated with micronutrient intake and density( Reference Daniels, Adair and Popkin 44 – Reference Steyn, Nel and Nantel 46 ) and negatively with stunting rates, even after controlling for various socio-economic factors( Reference Arimond and Ruel 15 ). While child stunting and underweight rates have been falling rapidly in Ethiopia over the past decade( Reference Headey 42 ) they remain high by regional and international standards. Together with investments in sanitation (D Headey, unpublished results), improving diet quantity and quality are likely to be important in ensuring that these positive trends continue in the future.
The seasonal analysis of diets reveals that rural households consume extremely monotonous diets in June consisting mainly of cereals and pulses, legumes and nuts. Of note is that these food items can be stored for several months after the harvest. In July and August, roots and tubers feature more dominantly in the diet again, possibly due the fact that these foods require a shorter growing time and therefore become available earlier than, for example, most cereals. However, overall energy intake remains low during these months, implying that the content of the household food basket becomes more diversified during this period, while the quantities consumed decrease.
An interesting finding of the present study is that the composition of the diet varies across the seasons. As a result, the dietary diversity score is relatively high at the height of the lean season – a period characterized by lowest energy intake in rural areas. Previous literature has considered dietary diversity as a good indicator of food security( Reference Hoddinott and Yohannes 22 , Reference Swindale and Bilinsky 39 ). This decoupling of the diet quantity and diversity measures observed in the lean season suggests that the seasonal validity of this indicator cannot be taken for granted. Indeed, at least in Ethiopia and other similar contexts, researchers should, as a matter of routine, measure food security through different indicators, not only through the dietary diversity score.
The present study has limitations. First, the HCES data permit us to assess diets only at the household level. The consequences of seasonality can be greater if specific groups such as children, girls or women are more affected by it. Therefore, one area of further research would be to explore intra-household dietary diversity across seasons. Second, we find suggestive evidence that urban diets are more affected by religious fasting events than by seasonality. However, lack of detailed information about fasting activities undertaken by the households does not allow us to explore this further. Therefore, the role of religious fasting on diets should be assessed in the future with more detailed data on this matter. Third, while dietary diversity is considered to be a good indicator for micro- and macronutrient intakes( Reference Moursi, Arimond and Dewey 17 , Reference Kennedy, Pedro and Seghieri 45 , Reference Steyn, Nel and Nantel 46 ), it would be important to directly assess seasonal changes in protein, Fe and vitamin intakes. Fourth, access to markets could be an important mitigating factor in reducing the role of seasonality on diets. Our results for the urban sample allude to this but more rigorous evidence is needed. Emerging literature highlights the role of market access for better diets( Reference Hirvonen and Hoddinott 43 , Reference Minten and Stifel 47 , Reference Hoddinott, Headey and Dereje 48 ) but so far little evidence exists on how market access interacts with seasonality.
Finally, the study findings contribute to the growing literature that attempts to understand the role of agriculture in improving food and nutrition security in low-income countries. However, the evidence of the effectiveness of agricultural interventions on nutrition outcomes remains sparse( Reference Ruel and Alderman 49 – Reference Berti, Krasevec and FitzGerald 51 ). Limited attention to seasonality in this research programme may well be one reason for this. Indeed, while agricultural investments typically focus on the main agricultural season, a large body of literature suggests that seasonal hunger is a major contributor to malnutrition in low-income countries( Reference Vaitla, Devereux and Swan 52 ). Therefore, agricultural investments that improve access to foods in the lean season may be more effective in addressing food and nutrition security than those that only target the harvest season. Further research is needed to confirm the validity of these ideas.
Acknowledgements
Acknowledgements: The authors thank Derek Headey and Helina Tilahun for useful comments. Financial support: Funding for this work was received through the Feed-the-Future project funded by the US Agency for International Development. The funder had no role in the design, analysis or writing of this article. Conflict of interest: The authors do not report any conflicts of interest. Authorship: K.H. and I.W.H. conducted the literature search. I.W.H. prepared the data. K.H. analysed the data. K.H. and A.S.T. wrote the manuscript. All authors approved the final version of the paper. Ethics of human subject participation: The study was conducted using secondary data collected by the Central Statistical Agency of Ethiopia. The data set had no personal identifiers.



