


1. Introduction
Discontinuous shear-thickening (DST) dense suspensions of non-Brownian particles are characterised by a rapid increase in viscosity, attributed to a transition from a frictionless state to a frictional state facilitated by a shear stress sufficient to overcome the characteristic stress scale $\sigma ^\ast$
, inherent to the particular nature of the suspension particles and solvent (Seto et al. Reference Seto, Mari, Morris and Denn2013; Mari et al. Reference Mari, Seto, Morris and Denn2014; Wyart & Cates Reference Wyart and Cates2014; Comtet et al. Reference Comtet, Chatté, Niguès, Bocquet, Siria and Colin2017). The distinguishing feature of DST as opposed to continuous shear-thickening is the presence of a negative gradient of the flow curve (
$\sigma ^\ast$
, inherent to the particular nature of the suspension particles and solvent (Seto et al. Reference Seto, Mari, Morris and Denn2013; Mari et al. Reference Mari, Seto, Morris and Denn2014; Wyart & Cates Reference Wyart and Cates2014; Comtet et al. Reference Comtet, Chatté, Niguès, Bocquet, Siria and Colin2017). The distinguishing feature of DST as opposed to continuous shear-thickening is the presence of a negative gradient of the flow curve ( ${\rm d}\dot {\gamma }/{\rm d}\sigma \lt 0$
), due to the increase in viscosity spanning multiple orders of magnitude (Han, James & Jaeger Reference Han, James and Jaeger2019). Recently, the stability properties of DST materials have been a subject of extensive research (Sedes, Singh & Morris Reference Sedes, Singh and Morris2020), partly because of their potential for understanding the role of internal microstructure in flows applicable to rheometric conditions and large-scale free-surface flows.
${\rm d}\dot {\gamma }/{\rm d}\sigma \lt 0$
), due to the increase in viscosity spanning multiple orders of magnitude (Han, James & Jaeger Reference Han, James and Jaeger2019). Recently, the stability properties of DST materials have been a subject of extensive research (Sedes, Singh & Morris Reference Sedes, Singh and Morris2020), partly because of their potential for understanding the role of internal microstructure in flows applicable to rheometric conditions and large-scale free-surface flows.
Instabilities in rheometric flows are of particular interest due to their role in the difficulties associated with the characterisation of DST materials (Han et al. Reference Han, James and Jaeger2019) under typical simple shear conditions. In stress-controlled conditions, DST fluids exhibit aperiodic or almost periodic oscillations in the measured shear rate and normal stress (Hermes et al. Reference Hermes, Guy, Poon, Poy, Cates and Wyart2016) – a phenomenon often referred to as ‘rheochaos’. The onset of the instability occurs at a critical stress and grows in strength up to a point, after which further increases in stress reduce the amplitude.
A plausible explanation for the observed temporal instability is the existence of an accompanying spatial instability. Dense frictional suspensions are understood to form contact force networks (Seto et al. Reference Seto, Mari, Morris and Denn2013; Sedes et al. Reference Sedes, Makse, Chakraborty and Morris2022), facilitating stress transmission. As such, it is reasonable to expect that large-magnitude temporal fluctuations in normal stress are associated with formation, destruction and rearrangement of the internal microstructure. Based on the multivariate nature of the flow curve, DST materials could be expected to undergo formation of bands along the vorticity direction (Olmsted Reference Olmsted2008); however, the existence of stable vorticity bands can be ruled out on the basis of particle pressure balance at the band interface (Hermes et al. Reference Hermes, Guy, Poon, Poy, Cates and Wyart2016). In fact, instead of stable vorticity bands, transient vorticity banding has been reported (Herle, Fischer & Windhab Reference Herle, Fischer and Windhab2005).
A further connection between spatial and temporal instabilities comes from recent literature utilising direct online measurements of the internal fluid state. Force and pressure sensors have been used to detect localised regions of high and low normal pressure travelling in the direction of flow (Nagahiro & Nakanishi Reference Nagahiro and Nakanishi2016). Ultrasonic echography has yielded direct imaging of bands propagating in the vorticity direction during temporal oscillations (Saint-Michel, Gibaud & Manneville Reference Saint-Michel, Gibaud and Manneville2018). Perhaps the most illuminating direct imaging comes from recent work (Rathee et al. Reference Rathee, Blair and Urbach2017, Reference Rathee, Blair and Urbach2020, Reference Rathee, Miller, Blair and Urbach2022; Hu et al. Reference Hu, Zhao, Zhao, Qiao and Xu2024) using boundary stress microscopy (BSM), in which the stress exerted on the bottom plate in a parallel plate set-up can be imaged in real time along with the movement of individual particles via particle image velocimetry. Boundary stress microscopy imaging revealed regions of localised high stress (a peak magnitude of an order larger than the bulk) in simple and oscillatory shear. Tracking these solid-like phases (SLPs) over time allowed for inference of the existence of SLPs at the upper and lower plate boundaries moving with the velocity close to their proximate solid boundaries.
Continuum modelling of DST fluids ubiquitously begins with the definition of the characteristic S-shaped flow curve, primarily through the Wyart–Cates (WC) model (Wyart & Cates Reference Wyart and Cates2014), with some exceptions (Nakanishi, Nagahiro & Mitarai Reference Nakanishi, Nagahiro and Mitarai2012; Bossis et al. Reference Bossis, Boustingorry, Grasselli, Meunier, Morini, Zubarev and Volkova2017). The WC model is a phenomenological approach, with solid microscopic evidence (Sedes et al. Reference Sedes, Makse, Chakraborty and Morris2022), that proposes that particles are held apart by a characteristic repulsive force $F_0$
which sets the characteristic stress scale
$F_0$
which sets the characteristic stress scale $\sigma ^\ast$
. Below the characteristic stress scale, the particles are held apart in a low-viscosity, frictionless state. When a stress is applied above the onset stress, the particles enter frictional contact and rapidly increase the viscosity. The key parameter in the WC model,
$\sigma ^\ast$
. Below the characteristic stress scale, the particles are held apart in a low-viscosity, frictionless state. When a stress is applied above the onset stress, the particles enter frictional contact and rapidly increase the viscosity. The key parameter in the WC model, $f\!(\sigma )$
, represents the fraction of particles in a frictional contact at a given stress. Most works on continuum modelling use this scalar parameter (Nagahiro & Nakanishi Reference Nagahiro and Nakanishi2016; Chacko et al. Reference Chacko, Mari, Cates and Fielding2018; Baumgarten & Kamrin Reference Baumgarten and Kamrin2019; Darbois Texier et al. Reference Texier, Lhuissier, Forterre and Metzger2020), along with a microstructural evolution equation, which seeks to describe the dynamics of the frictionless-to-frictional transition. Typically, the rate of evolution is a rate-dependent approach of
$f\!(\sigma )$
, represents the fraction of particles in a frictional contact at a given stress. Most works on continuum modelling use this scalar parameter (Nagahiro & Nakanishi Reference Nagahiro and Nakanishi2016; Chacko et al. Reference Chacko, Mari, Cates and Fielding2018; Baumgarten & Kamrin Reference Baumgarten and Kamrin2019; Darbois Texier et al. Reference Texier, Lhuissier, Forterre and Metzger2020), along with a microstructural evolution equation, which seeks to describe the dynamics of the frictionless-to-frictional transition. Typically, the rate of evolution is a rate-dependent approach of $f$
towards the WC-prescribed steady-state value
$f$
towards the WC-prescribed steady-state value $\hat {f}\!(\sigma )$
at a given stress.
$\hat {f}\!(\sigma )$
at a given stress.
One potential mechanism of temporal instabilities identified in the literature comes from competition between the time scales of system inertia ( $t_{{i}}$
) and microstructure formation (
$t_{{i}}$
) and microstructure formation ( $t_{{\!f}}$
) (Richards et al. Reference Richards, Royer, Liebchen, Guy and Poon2019). Stability analysis of the coupled dynamics of a stress-controlled plate and the commonly used local form of the microstructure evolution equation reveal that such a system can undergo a Hopf bifurcation. When the rate of formation is much higher than the rate of boundary deceleration (
$t_{{\!f}}$
) (Richards et al. Reference Richards, Royer, Liebchen, Guy and Poon2019). Stability analysis of the coupled dynamics of a stress-controlled plate and the commonly used local form of the microstructure evolution equation reveal that such a system can undergo a Hopf bifurcation. When the rate of formation is much higher than the rate of boundary deceleration ( $t_{{i}} \gg t_{{f}}$
), an overshoot in the shear rate will induce rapid shear thickening, which in turn will further increase the material stress since the plate cannot decelerate sufficiently quickly, resulting in a feedback loop. In addition to the required ratio of time scales, negative gradients of the flow curve are also necessary, indicating that this mechanism is unique to DST materials. The primary limitation in the analysis associated with this mechanism is the inherent assumption of homogeneous space, which clearly does not account for the spatial pattern formation observed in real systems. Furthermore, because of the two-dimensional aspect of the system in phase space, only periodic oscillatory solutions are possible, which limits the applicability to a narrow region in which periodicity is observed in experiments.
$t_{{i}} \gg t_{{f}}$
), an overshoot in the shear rate will induce rapid shear thickening, which in turn will further increase the material stress since the plate cannot decelerate sufficiently quickly, resulting in a feedback loop. In addition to the required ratio of time scales, negative gradients of the flow curve are also necessary, indicating that this mechanism is unique to DST materials. The primary limitation in the analysis associated with this mechanism is the inherent assumption of homogeneous space, which clearly does not account for the spatial pattern formation observed in real systems. Furthermore, because of the two-dimensional aspect of the system in phase space, only periodic oscillatory solutions are possible, which limits the applicability to a narrow region in which periodicity is observed in experiments.
Alternatively, coupling of the simple evolution of the scalar microstructure with the dynamic migration of particles through the suspension balance model (Chacko et al. Reference Chacko, Mari, Cates and Fielding2018) has been shown to produce transient vorticity banding, uniquely for DST conditions. The observed pattern formation was shown to be in good agreement with direct particle simulations; however, the continuum modelling was limited to a gradient–vorticity space, with assumption of spatial homogeneity in both flow and gradient directions.
In this work, we present a systematic study of the possible interactions between the microstructural, inertial and stress-diffusive time scales, by framing pattern formation in the context of a competition between local and non-local contributions to the microstructure evolution, in the presence of DST rheology. In § 2, we outline the continuum model and numerical implementation. In § 3.1, we consider the case of dominant non-locality for the purpose of validation of our smoothed particle hydrodynamics (SPH) model against a temporal instability mechanism proposed in the literature. In § 3.2 we demonstrate the stress-splitting instability inherent in the topology of DST flow curves. Finally, in § 3.3 we consider regimes of mixed non-locality where spatial pattern formation is possible and present an alternative mode of temporal instability, driven by variations in microstructural spatial patterns within the geometry.
2. Method
2.1. Discontinuous shear-thickening: continuum scalar model
The governing equations, written in the Lagrangian frame, are
 \begin{gather} \frac {{\rm d}\rho }{{\rm d}t}=-\rho \nabla \cdot \boldsymbol{v}, \end{gather}
 \begin{align} \frac {{\rm d}\boldsymbol{v}}{{\rm d}t}&=\frac {1}{\rho }\nabla \cdot \boldsymbol{\sigma }+\boldsymbol{F},\end{align}
 \begin{align} \boldsymbol{\sigma }&=-p\boldsymbol{I}+ \eta \big(\nabla \boldsymbol{v}+\nabla \boldsymbol{v}^{\mathsf{T}}\big),\end{align}
where ${\rm d}/{\rm d}t \equiv (\partial /\partial t) + \boldsymbol{v}\cdot \nabla$
is the material derivative,
${\rm d}/{\rm d}t \equiv (\partial /\partial t) + \boldsymbol{v}\cdot \nabla$
is the material derivative, $\rho (\boldsymbol{x},t)$
is the density field,
$\rho (\boldsymbol{x},t)$
is the density field, $\boldsymbol{v}(\boldsymbol{x},t)$
is the velocity field,
$\boldsymbol{v}(\boldsymbol{x},t)$
is the velocity field, $\boldsymbol{\sigma }(\boldsymbol{x},t)$
is the stress field,
$\boldsymbol{\sigma }(\boldsymbol{x},t)$
is the stress field, $p$
is the pressure and
$p$
is the pressure and $\boldsymbol{F}$
is a body force acting on the fluid.
$\boldsymbol{F}$
is a body force acting on the fluid.
The viscosity of the suspension is defined by the Maron–Pierce relation (Maron & Pierce Reference Maron and Pierce1956):
 \begin{equation} \eta (\phi ,\phi ^{\textit{J}},t) = \eta _{{s}} \left (1-\frac {\phi }{\phi ^{\textit{J}} } \right )^{-2}, \end{equation}
where $\eta (\phi ,\phi ^{\textit{J}},t)$
and
$\eta (\phi ,\phi ^{\textit{J}},t)$
and $\eta _{{s}}$
are, respectively, the suspension and constant solvent viscosities. The divergence volume fraction,
$\eta _{{s}}$
are, respectively, the suspension and constant solvent viscosities. The divergence volume fraction, $\phi ^{\textit{J}}$
, is used to introduce shear-thickening by interpolating its value between the frictionless state (
$\phi ^{\textit{J}}$
, is used to introduce shear-thickening by interpolating its value between the frictionless state ( $\phi ^0$
) and the frictional state (
$\phi ^0$
) and the frictional state ( $\phi ^{\textit{m}}$
):
$\phi ^{\textit{m}}$
):
 \begin{equation} \phi ^{\textit{J}} (f\!(\boldsymbol{x},t))=\phi ^{\textit{m}} f\!(\boldsymbol{x},t)+\phi ^0 \{ 1-f\!(\boldsymbol{x},t) \}. \end{equation}
Here, the interpolating state parameter, $f\!(\boldsymbol{x},t)$
, is interpreted as the fraction of particles in frictional contact at a given position in space, as defined in the WC model. The dynamics of the state parameter is defined via the microstructure evolution equation:
$f\!(\boldsymbol{x},t)$
, is interpreted as the fraction of particles in frictional contact at a given position in space, as defined in the WC model. The dynamics of the state parameter is defined via the microstructure evolution equation:
 \begin{align} \frac {{\rm d}\!f (\boldsymbol{x},t)}{{\rm d}t} &=k_{{f}} \dot {\gamma } (\hat {f}\!(\boldsymbol{x},t) -f\!(\boldsymbol{x},t))+\alpha \nabla ^2 f\!(\boldsymbol{x},t),\end{align}
 \begin{align} &\hat {f}\!(\boldsymbol{x},t) = \exp \left( -\left [\frac {\sigma ^{\ast }}{\sigma (\boldsymbol{x},t)}\right ]^2 \right ),\end{align}
which consists of a local term modelling the approach of the system towards a stress-prescribed WC steady state, $\hat {f}\!(\boldsymbol{x},t)$
, and a non-local term modelling stress-diffusive components of microstructure formation in space. The local contributions are tuned with a microstructural rate constant,
$\hat {f}\!(\boldsymbol{x},t)$
, and a non-local term modelling stress-diffusive components of microstructure formation in space. The local contributions are tuned with a microstructural rate constant, $k_{{f}}$
, whereas the non-local dynamics is set by the microstructure diffusivity parameter,
$k_{{f}}$
, whereas the non-local dynamics is set by the microstructure diffusivity parameter, $\alpha$
. The fluid stress is calculated as
$\alpha$
. The fluid stress is calculated as $\sigma =\eta \dot {\gamma }$
, where
$\sigma =\eta \dot {\gamma }$
, where $\dot {\gamma }(\boldsymbol{x},t) =\sqrt {\dot {\boldsymbol{\gamma }}:\dot {\boldsymbol{\gamma }}/2}$
is the local shear rate calculated as the second invariant of the strain rate tensor
$\dot {\gamma }(\boldsymbol{x},t) =\sqrt {\dot {\boldsymbol{\gamma }}:\dot {\boldsymbol{\gamma }}/2}$
is the local shear rate calculated as the second invariant of the strain rate tensor $\dot {\boldsymbol{\gamma }}(\boldsymbol{x},t) = (\nabla \boldsymbol{v}+\nabla \boldsymbol{v}^{\mathsf{T}} )/2$
.
$\dot {\boldsymbol{\gamma }}(\boldsymbol{x},t) = (\nabla \boldsymbol{v}+\nabla \boldsymbol{v}^{\mathsf{T}} )/2$
.
The local term in (2.6) is identical to the microstructure evolution equation employed by Nakanishi et al. (Reference Nakanishi, Nagahiro and Mitarai2012). This form has been used since Richards et al. (Reference Richards, Royer, Liebchen, Guy and Poon2019), with some authors introducing additional features such as a rate-independent loss term (Chacko et al. Reference Chacko, Mari, Cates and Fielding2018; Baumgarten & Kamrin Reference Baumgarten and Kamrin2019). We opt to keep the local dynamics in its simplest form and instead introduce a non-local term in microstructural dynamics. The inclusion of this term is meant to represent the spatial diffusion of microstructure. In a sense, it is similar to the role played by the particle migration dynamics in the work of Chacko et al. (Reference Chacko, Mari, Cates and Fielding2018), as both equations will result in diffusion of high-stress regions, since both $f$
and
$f$
and $\phi$
are positively correlated with stress, even though our implementation does not allow for particle migration and might result in different pattern details.
$\phi$
are positively correlated with stress, even though our implementation does not allow for particle migration and might result in different pattern details.
2.2. Simulation set-up
We simulate simple shear in stress-controlled mode by setting the velocity on the upper wall ( $v_{{w}}$
) and evolving it over time:
$v_{{w}}$
) and evolving it over time:
 \begin{equation} \frac {{\rm d}v_{{w}}}{{\rm d}t}=k_{{p}} (\sigma _{{E}}-\sigma ), \end{equation}
where $\sigma _{{E}}$
is the target stress set-point,
$\sigma _{{E}}$
is the target stress set-point, $\sigma$
is the shear stress measure at the upper wall and
$\sigma$
is the shear stress measure at the upper wall and $k_{{p}}$
is a tuning parameter in the control scheme, reflecting the influence of inertia (i.e. it is inversely proportional to the density of the wall). This implantation corresponds to typical operation of a combined motor–transducer rheometer in stress-controlled mode, where the constant stress applied to the geometry (
$k_{{p}}$
is a tuning parameter in the control scheme, reflecting the influence of inertia (i.e. it is inversely proportional to the density of the wall). This implantation corresponds to typical operation of a combined motor–transducer rheometer in stress-controlled mode, where the constant stress applied to the geometry ( $\sigma _{{E}}$
) is produced by a constant torque from the motor. This stress is balanced by the variable shear stress acting on the geometry due to the fluid (
$\sigma _{{E}}$
) is produced by a constant torque from the motor. This stress is balanced by the variable shear stress acting on the geometry due to the fluid ( $\sigma$
). Any stress imbalances result in changes in geometry velocity, mediated by the system (or instrument) inertia (
$\sigma$
). Any stress imbalances result in changes in geometry velocity, mediated by the system (or instrument) inertia ( $k_{{p}}$
). A small value for
$k_{{p}}$
). A small value for $k_{{p}}$
corresponds to slow adjustment of velocity in response to rheological changes (high system inertia). A large value for
$k_{{p}}$
corresponds to slow adjustment of velocity in response to rheological changes (high system inertia). A large value for $k_{{p}}$
corresponds to fast adjustment (low system inertia).
$k_{{p}}$
corresponds to fast adjustment (low system inertia).
2.3. Numerical implementation
The method of solution in all cases (unless otherwise specified) is weakly compressible SPH (Gingold & Monaghan Reference Gingold and Monaghan1977; Lucy Reference Lucy1977), which has already been used to successfully model complex microstructural fluids (Vázquez-Quesada et al. Reference Vázquez-Quesada, Ellero and Español2009, Vázquez-Quesada et al. Reference Vázquez-Quesada, Español, Tanner and Ellero2019; Rossi et al. Reference Rossi, Garcia de Beristain, Vazquez-Quesada, López-Aguilar and Ellero2022). In all simulations, unless otherwise noted, we use the WC parameters $\phi =0.54$
,
$\phi =0.54$
, $\phi ^{\textit{J}}=0.693$
and
$\phi ^{\textit{J}}=0.693$
and $\phi _{{m}}=0.562$
, resulting in a well-defined ‘S’-shaped flow curve (Angerman et al. Reference Angerman, Kumar, Seto, Sandnes and Ellero2024). In § 3.1 and § 3.2, we simulate a square box with a gap height of
$\phi _{{m}}=0.562$
, resulting in a well-defined ‘S’-shaped flow curve (Angerman et al. Reference Angerman, Kumar, Seto, Sandnes and Ellero2024). In § 3.1 and § 3.2, we simulate a square box with a gap height of $h={0.01}\,\textrm {m}$
, while in § 3.3 we use a wide box
$h={0.01}\,\textrm {m}$
, while in § 3.3 we use a wide box $l = 3 h$
with the same gap height to fully capture the resulting spatial pattern. In all simulations, the numerical resolution is kept constant at
$l = 3 h$
with the same gap height to fully capture the resulting spatial pattern. In all simulations, the numerical resolution is kept constant at $\Delta x=h/50$
. Each simulation consists of a planar flow–gradient simple shear, with periodic boundary conditions along the flow direction, and no-slip conditions are enforced at the upper and lower solid boundaries (Angerman et al. Reference Angerman, Kumar, Seto, Sandnes and Ellero2024). The flow and gradient directions were chosen on the basis of the experimental observations of Rathee, Blair & Urbach (Reference Rathee, Blair and Urbach2020), where regions of localised stress are reported to exist on the upper and lower geometry boundaries, and their relative motion in the flow direction appears to coincide with stress and shear rate fluctuations. To capture such phenomenology, gradient and flow directions are required. At the same time, we exclude the vorticity direction because, while one might expect vorticity banding to occur in DST fluids (Olmsted Reference Olmsted2008), vorticity bands are unlikely to exist in a stable arrangement (Hermes et al. Reference Hermes, Guy, Poon, Poy, Cates and Wyart2016). Furthermore, the experiments of Rathee et al. (Reference Rathee, Miller, Blair and Urbach2022) note vorticity direction effects (such as particle migrations), but these are minor relative to the flow and gradient effects, with no clear vorticity banding.
$\Delta x=h/50$
. Each simulation consists of a planar flow–gradient simple shear, with periodic boundary conditions along the flow direction, and no-slip conditions are enforced at the upper and lower solid boundaries (Angerman et al. Reference Angerman, Kumar, Seto, Sandnes and Ellero2024). The flow and gradient directions were chosen on the basis of the experimental observations of Rathee, Blair & Urbach (Reference Rathee, Blair and Urbach2020), where regions of localised stress are reported to exist on the upper and lower geometry boundaries, and their relative motion in the flow direction appears to coincide with stress and shear rate fluctuations. To capture such phenomenology, gradient and flow directions are required. At the same time, we exclude the vorticity direction because, while one might expect vorticity banding to occur in DST fluids (Olmsted Reference Olmsted2008), vorticity bands are unlikely to exist in a stable arrangement (Hermes et al. Reference Hermes, Guy, Poon, Poy, Cates and Wyart2016). Furthermore, the experiments of Rathee et al. (Reference Rathee, Miller, Blair and Urbach2022) note vorticity direction effects (such as particle migrations), but these are minor relative to the flow and gradient effects, with no clear vorticity banding.
The microstructural field, $f\!(\boldsymbol{x})$
, and the shear rate,
$f\!(\boldsymbol{x})$
, and the shear rate, $\dot {\gamma }$
, are initialised, in most cases, from a steady state of the WC flow curve corresponding to the stress set-point, with
$\dot {\gamma }$
, are initialised, in most cases, from a steady state of the WC flow curve corresponding to the stress set-point, with $f\!(\boldsymbol{x})$
uniform, with a small perturbation in the shear rate (
$f\!(\boldsymbol{x})$
uniform, with a small perturbation in the shear rate ( $\delta \dot {\gamma }\approx \pm 1.0 \times 10^{-4}\,\textrm {s}^{-1}$
) and the microstructural field (
$\delta \dot {\gamma }\approx \pm 1.0 \times 10^{-4}\,\textrm {s}^{-1}$
) and the microstructural field ( $\delta f \approx 1 \times 10^{-4}$
).
$\delta f \approx 1 \times 10^{-4}$
).
2.4. Dimensional analysis
The dynamics of our model is captured by three characteristic time scales:
 \begin{gather} t_{{i}}= \frac {h}{k_{{p}}\eta _{{s}}}, \quad t_{{f}} = \frac {\eta _{{s}}}{k_{{f}} \sigma ^\ast }, \quad t_{{d}}=\frac {h^2}{\alpha }, \end{gather}
where $t_{{i}}$
is the system-inertia time scale,
$t_{{i}}$
is the system-inertia time scale, $t_{{f}}$
represents the local microstructure evolution time scale and
$t_{{f}}$
represents the local microstructure evolution time scale and $t_{{d}}$
is the microstructure diffusive (or non-local) time scale. It is important to distinguish the system-inertial time scale
$t_{{d}}$
is the microstructure diffusive (or non-local) time scale. It is important to distinguish the system-inertial time scale $t_{{i}}$
, which arises as a consequence of the non-zero upper-plate mass and the internal rheometer construction, from the fluid inertia. We proceed by defining the dimensionless parameters
$t_{{i}}$
, which arises as a consequence of the non-zero upper-plate mass and the internal rheometer construction, from the fluid inertia. We proceed by defining the dimensionless parameters
 \begin{gather} \varSigma =\frac {\sigma }{\sigma ^\ast }, \qquad \dot {\varGamma }=\frac {\dot {\gamma }\eta _{{s}}}{\sigma ^\ast }, \qquad \epsilon =\frac {t_{{f}}}{t_{{i}}}, \qquad \omega =\frac {t_{{d}}}{t_{{i}}}, \qquad \eta _{{r}} =\frac {\eta }{\eta _{{s}}}, \end{gather}
where $\varSigma$
is the dimensionless stress,
$\varSigma$
is the dimensionless stress, $\dot {\varGamma }$
is the dimensionless shear rate and
$\dot {\varGamma }$
is the dimensionless shear rate and $\epsilon$
and
$\epsilon$
and $\omega$
are local and non-local microstructural time scales, respectively, normalised with the (instrument) inertial time scale. To classify relative magnitudes of local and non-local contributions to the evolution of microstructure, we define a characteristic stress-diffusive length scale,
$\omega$
are local and non-local microstructural time scales, respectively, normalised with the (instrument) inertial time scale. To classify relative magnitudes of local and non-local contributions to the evolution of microstructure, we define a characteristic stress-diffusive length scale,
 \begin{equation} l_{{c}}=\sqrt {\frac {\alpha }{k_{{f}} \dot {\gamma }}}, \end{equation}
which determines the spatial scale of potential pattern formation.
The corresponding non-dimensional forms of the microstructural evolution equation (2.6) and the stress control equation (2.8) are given by
 \begin{align} \frac {{\rm d}f (\boldsymbol{\tilde {x}},t)}{{\rm d}\tilde {\tau }}&=\frac {\dot {\varGamma }}{\epsilon } \big (\hat {f}\!(\boldsymbol{\tilde {x}},t) -f\!(\boldsymbol{\tilde {x}},t)\big )+\frac {1}{\omega }\nabla ^2f\!(\boldsymbol{\tilde {x}},t),\end{align}
 \begin{align} &\quad\qquad\frac {{\rm d}\dot {\varGamma }}{{\rm d}\tilde {\tau }}=\varSigma _{{E}}-\varSigma ,\end{align}
where $\tilde {\boldsymbol{x}}=\boldsymbol{x}/L$
and
$\tilde {\boldsymbol{x}}=\boldsymbol{x}/L$
and $\tilde {\tau }=t/t_{{i}}$
.
$\tilde {\tau }=t/t_{{i}}$
.
(a) A typical trajectory (black line) of an unstable solution exhibits periodic cycling between entirely frictionless and frictional domains. The trajectory is based on the spatially averaged stress and shear rate, and is plotted over a WC model flow curve where blue and red segments indicate frictionless and frictional branches, respectively. The region of negative flow curve gradient is indicated in grey. The inset shows simulation frames of typical microstructural states $f$
during the minima (A) and maxima (B) of stress along the trajectory, where (A) is uniformly frictionless (blue) and (B) is uniformly frictional (red). (b) Comparison of limit cycle size
$f$
during the minima (A) and maxima (B) of stress along the trajectory, where (A) is uniformly frictionless (blue) and (B) is uniformly frictional (red). (b) Comparison of limit cycle size $\Delta \dot {\varGamma }$
as a function of
$\Delta \dot {\varGamma }$
as a function of $\varSigma _{{E}}$
along the range of the flow curve shows an increase in peak and broadening of the bifurcation points with increasing gap height. Stability diagrams
$\varSigma _{{E}}$
along the range of the flow curve shows an increase in peak and broadening of the bifurcation points with increasing gap height. Stability diagrams $\Delta \dot {\varGamma } (\mu )$
for (c)
$\Delta \dot {\varGamma } (\mu )$
for (c) $h={0.01}\,\textrm {m}$
and (d)
$h={0.01}\,\textrm {m}$
and (d) $h= {0.02}\,\textrm {m}$
. Blue lines indicate solutions obtained by direct numerical integration (DNI) and red points are measurements from SPH simulations.
$h= {0.02}\,\textrm {m}$
. Blue lines indicate solutions obtained by direct numerical integration (DNI) and red points are measurements from SPH simulations.

3. Numerical results
3.1. Dominant non-locality
In this section, we consider the extreme case of dominant non-locality by allowing the characteristic length scale to span the entire domain height ( $l_{{c}} \approx h$
). Under such conditions, we can expect an entirely homogeneous state, and due to the vanishing gradients of
$l_{{c}} \approx h$
). Under such conditions, we can expect an entirely homogeneous state, and due to the vanishing gradients of $f\!(\boldsymbol{x})$
, we can simplify the dynamic model equations by neglecting the effects of the stress-diffusive term (last term in (2.12)) on the stability of the dynamics. Doing so simplifies the equations to a system directly equivalent to that studied by Richards et al. (Reference Richards, Royer, Liebchen, Guy and Poon2019), allowing a comparison with their stability analysis. Following their analysis, the stability criterion for the mechanism based on the competition of the system-inertia time scale
$f\!(\boldsymbol{x})$
, we can simplify the dynamic model equations by neglecting the effects of the stress-diffusive term (last term in (2.12)) on the stability of the dynamics. Doing so simplifies the equations to a system directly equivalent to that studied by Richards et al. (Reference Richards, Royer, Liebchen, Guy and Poon2019), allowing a comparison with their stability analysis. Following their analysis, the stability criterion for the mechanism based on the competition of the system-inertia time scale $(t_{{i}})$
and the microstructural formation time scale
$(t_{{i}})$
and the microstructural formation time scale $(t_{{f}})$
can be written as
$(t_{{f}})$
can be written as
 \begin{equation} \epsilon \lt -\dot {\varGamma }\frac {{\rm d}\dot {\varGamma }}{{\rm d}\varSigma _{{E}}}, \end{equation}
which, if satisfied, indicates unstable dynamics and the existence of periodic solutions. The condition can be rewritten into a more convenient formulation with the overall stability parameter
 \begin{equation} \mu =-\left (\epsilon + \dot {\varGamma }\frac {{\rm d}\dot {\varGamma }}{{\rm d}\varSigma _{{E}}} \right ). \end{equation}
The system has all bifurcation points at $\mu =\mu _{{c}}=0$
, with stable solutions for
$\mu =\mu _{{c}}=0$
, with stable solutions for $\mu \lt 0$
and periodic solutions for
$\mu \lt 0$
and periodic solutions for $\mu \gt 0$
. The stable solutions consist of an inward spiral towards the exact solution on the WC model, resulting in a steady state where the system lies exactly on the flow curve for any stress applied, regardless of the presence of DST (Angerman et al. Reference Angerman, Kumar, Seto, Sandnes and Ellero2024). The bifurcation occurs when the response of the stress control mechanism is no longer fast enough to deal with the overshoots in the shear rate, leading to an increasing shear rate at the point of a large DST viscosity jump, which further increases the stress and thus drives the particles into an even more frictional state, initiating a positive feedback cycle of increasing viscosity and stress. Eventually, the direction of stress control will invert, initiating a similar feedback loop in the opposite direction, and completing the limit cycle as shown in figure 1(a). To evaluate the capability of the SPH model to handle instabilities, we varied
$\mu \gt 0$
. The stable solutions consist of an inward spiral towards the exact solution on the WC model, resulting in a steady state where the system lies exactly on the flow curve for any stress applied, regardless of the presence of DST (Angerman et al. Reference Angerman, Kumar, Seto, Sandnes and Ellero2024). The bifurcation occurs when the response of the stress control mechanism is no longer fast enough to deal with the overshoots in the shear rate, leading to an increasing shear rate at the point of a large DST viscosity jump, which further increases the stress and thus drives the particles into an even more frictional state, initiating a positive feedback cycle of increasing viscosity and stress. Eventually, the direction of stress control will invert, initiating a similar feedback loop in the opposite direction, and completing the limit cycle as shown in figure 1(a). To evaluate the capability of the SPH model to handle instabilities, we varied $k_{{p}}$
(see table 1) to obtain unstable solutions and measured the amplitude of the apparent oscillations (figure 1
b) in spatially averaged dimensionless shear rate,
$k_{{p}}$
(see table 1) to obtain unstable solutions and measured the amplitude of the apparent oscillations (figure 1
b) in spatially averaged dimensionless shear rate, $\Delta \dot {\varGamma }$
, in both our SPH results and the results obtained via alternative direct numerical integration of the ordinary differential equations ((2.12) and (2.13)). Direct integration was carried out with the ODE45 Matlab algorithm with a relative tolerance of
$\Delta \dot {\varGamma }$
, in both our SPH results and the results obtained via alternative direct numerical integration of the ordinary differential equations ((2.12) and (2.13)). Direct integration was carried out with the ODE45 Matlab algorithm with a relative tolerance of $1 \times 10^{-10}$
and smoothed with the Savitzky–Golay algorithm with a window size of five subsequent points (fewer than 0.5 % of points) to correct the random numerical errors introduced by the solver. Comparison between SPH simulations and the direct integration of the dynamics equations (2.12) and (2.13) shows clear congruence between the two. The plots of the shear rate amplitude measured in SPH for both gap heights (figure 1
b–d) show clear bifurcation in line with the predicted bifurcation condition, marked by a sudden increase in amplitude at
$1 \times 10^{-10}$
and smoothed with the Savitzky–Golay algorithm with a window size of five subsequent points (fewer than 0.5 % of points) to correct the random numerical errors introduced by the solver. Comparison between SPH simulations and the direct integration of the dynamics equations (2.12) and (2.13) shows clear congruence between the two. The plots of the shear rate amplitude measured in SPH for both gap heights (figure 1
b–d) show clear bifurcation in line with the predicted bifurcation condition, marked by a sudden increase in amplitude at $\mu =0$
. Furthermore, the SPH model is capable of accurate predictions of exact limit cycle sizes (figure 1
b) along the shear rate dimension for a range of imposed stress values (
$\mu =0$
. Furthermore, the SPH model is capable of accurate predictions of exact limit cycle sizes (figure 1
b) along the shear rate dimension for a range of imposed stress values ( $\varSigma _{{E}}$
) spanning the entire frictionless-to-frictional transition of the flow curve. This agreement is illustrated in figure 1(b) for two different geometry gap heights.
$\varSigma _{{E}}$
) spanning the entire frictionless-to-frictional transition of the flow curve. This agreement is illustrated in figure 1(b) for two different geometry gap heights.
Dominant non-locality parameters.

3.2. Vanishing non-locality
Having validated our implementation in the regime of homogeneous state, we can now consider instabilities with spatial heterogeneity. Here we consider the limit of vanishing non-locality. Strictly, we set $l_{{c}}=0$
and thus exclude non-locality entirely (see table 2), but we can expect the following analysis to hold for sufficiently low values
$l_{{c}}=0$
and thus exclude non-locality entirely (see table 2), but we can expect the following analysis to hold for sufficiently low values $l_{{c}} \lt \Delta x$
, as any patterns with characteristic length below the resolution scale will not be resolved. In this and the following sections, we consider the regime of
$l_{{c}} \lt \Delta x$
, as any patterns with characteristic length below the resolution scale will not be resolved. In this and the following sections, we consider the regime of $\mu \lt 0$
to investigate primarily spatial effects while excluding the temporal instability discussed in the previous section.
$\mu \lt 0$
to investigate primarily spatial effects while excluding the temporal instability discussed in the previous section.
Vanishing non-locality parameters.

(a) The field visualisation of $f$
in steady state under shear rate exhibits non-differentiable microstructure (and stress) fields. (b) Individual SPH particles plotted on top of the theoretical WC curve. The particles split onto the two stable segments. Green diamond indicates initialisation state.
$f$
in steady state under shear rate exhibits non-differentiable microstructure (and stress) fields. (b) Individual SPH particles plotted on top of the theoretical WC curve. The particles split onto the two stable segments. Green diamond indicates initialisation state.

We start by considering two points in $\dot {\varGamma }$
–
$\dot {\varGamma }$
– $\varSigma$
phase space with coordinates
$\varSigma$
phase space with coordinates $A(\dot {\varGamma }^\ast ,\varSigma ^\ast )$
and
$A(\dot {\varGamma }^\ast ,\varSigma ^\ast )$
and $B(\dot {\varGamma }^\ast +\delta \dot {\Gamma },\varSigma ^\ast )$
, respectively, where point
$B(\dot {\varGamma }^\ast +\delta \dot {\Gamma },\varSigma ^\ast )$
, respectively, where point $A$
lies exactly on the flow curve predicted by the WC model for a given input stress set-point (indicated by the superscript
$A$
lies exactly on the flow curve predicted by the WC model for a given input stress set-point (indicated by the superscript $\varSigma ^\ast$
) and the point
$\varSigma ^\ast$
) and the point $B$
receives a small positive perturbation in shear rate. Since the perturbation is horizontal, point
$B$
receives a small positive perturbation in shear rate. Since the perturbation is horizontal, point $B$
preserves the stress such that
$B$
preserves the stress such that
 \begin{equation} \varSigma _A=\varSigma _B, \end{equation}
which can be rewritten as
 \begin{equation} \eta _{{r,A}}\dot {\varGamma }^\ast =\eta _{{r,B}}(\dot {\varGamma }^\ast +\delta \dot {\varGamma }). \end{equation}
This implies that the viscosity at $B$
must be less than the viscosity at
$B$
must be less than the viscosity at $A$
, from which we can infer that
$A$
, from which we can infer that
 \begin{equation} \hat {f}-f_B\gt 0 \end{equation}
for any point $B$
to the right of the flow curve. Here
$B$
to the right of the flow curve. Here $\hat {f}$
is the steady-state WC value at a given stress
$\hat {f}$
is the steady-state WC value at a given stress $\varSigma$
, and
$\varSigma$
, and $f^\ast$
indicates the steady-state value corresponding to the applied stress
$f^\ast$
indicates the steady-state value corresponding to the applied stress $\varSigma _{{E}}$
. Notice that this is part of the local term in the microstructure evolution equation (2.6); hence, we can deduce that for any point to the right of the flow curve, the vector fields of the microstructure evolution must point directly upward in phase space, as the evolution of
$\varSigma _{{E}}$
. Notice that this is part of the local term in the microstructure evolution equation (2.6); hence, we can deduce that for any point to the right of the flow curve, the vector fields of the microstructure evolution must point directly upward in phase space, as the evolution of $f$
is positively correlated with the evolution of stress. By the same argument, we can also show that the vector fields to the left of the flow curve must always point downwards. For flow curves with monotonic positive gradient (
$f$
is positively correlated with the evolution of stress. By the same argument, we can also show that the vector fields to the left of the flow curve must always point downwards. For flow curves with monotonic positive gradient ( $ {\rm d}\dot {\varGamma }/{\rm d}\varSigma \gt 0)$
, the resulting vector fields will always return any perturbed points to the flow curve. However, whenever negative gradients of the flow curve are present (
$ {\rm d}\dot {\varGamma }/{\rm d}\varSigma \gt 0)$
, the resulting vector fields will always return any perturbed points to the flow curve. However, whenever negative gradients of the flow curve are present ( ${\rm d}\dot {\varGamma }/{\rm d}\varSigma \lt 0$
), the vector field acting on the point will move it away from the flow curve. On the basis of this analysis, we can expect a spatial instability unique to the DST regime, where individual SPH particles receiving random numerical perturbations will ‘split’ along the stress axis.
${\rm d}\dot {\varGamma }/{\rm d}\varSigma \lt 0$
), the vector field acting on the point will move it away from the flow curve. On the basis of this analysis, we can expect a spatial instability unique to the DST regime, where individual SPH particles receiving random numerical perturbations will ‘split’ along the stress axis.
To confirm this behaviour, we performed rate-controlled simulations, in which the shear rate was maintained by a constant upper wall velocity. All particles were initialised with the same state in the unstable region with small perturbations. The resulting field of $f$
(figure 2
a) becomes discontinuous at the resolution level, with a lack of correlation in space between frictional and frictionless particles. In the
$f$
(figure 2
a) becomes discontinuous at the resolution level, with a lack of correlation in space between frictional and frictionless particles. In the $\dot {\varGamma }$
–
$\dot {\varGamma }$
– $\varSigma$
space, individual particles (figure 2
b) are attracted to the stable Newtonian branches of the flow curve, where the vector fields act as a restoring force. The number of particles that split ‘upwards’ and ‘downwards’ is approximately equal because of the randomness in the numerical noise that initially places particles arbitrarily on either side of the WC flow curve.
$\varSigma$
space, individual particles (figure 2
b) are attracted to the stable Newtonian branches of the flow curve, where the vector fields act as a restoring force. The number of particles that split ‘upwards’ and ‘downwards’ is approximately equal because of the randomness in the numerical noise that initially places particles arbitrarily on either side of the WC flow curve.
Note that while so far we have considered $l_c=0$
, the result of discontinuous stress fields is present in all simulations with sufficiently small (but non-zero) value of
$l_c=0$
, the result of discontinuous stress fields is present in all simulations with sufficiently small (but non-zero) value of $l_c$
.
$l_c$
.
(a) Transient in average stress induced by the splitting of SPH particles for $k_{{f}}=1$
. (b) Plot of the rate of stress equilibration against the prefactor
$k_{{f}}=1$
. (b) Plot of the rate of stress equilibration against the prefactor $k_{{f}}\dot {\gamma }$
of local contributions to the microstructure evolution.
$k_{{f}}\dot {\gamma }$
of local contributions to the microstructure evolution.

The dynamics of the stress-splitting instability was probed by varying $k_{{f}}$
in (2.6). The typical transient response during the instability (figure 3
a) consists of a significant increase in the average stress within the domain, the lower stress plateau indicating the homogeneous initial state and the upper stress corresponding to the entirely split state. The increase in stress is a result of an even-number split in SPH particles along an asymmetric flow curve, with a much higher jump upward towards the frictional branch than the downward jump to the frictionless branch. In this case, the dynamics of stress evolution can be used as a proxy for the dynamics of the instability. For each value of
$k_{{f}}$
in (2.6). The typical transient response during the instability (figure 3
a) consists of a significant increase in the average stress within the domain, the lower stress plateau indicating the homogeneous initial state and the upper stress corresponding to the entirely split state. The increase in stress is a result of an even-number split in SPH particles along an asymmetric flow curve, with a much higher jump upward towards the frictional branch than the downward jump to the frictionless branch. In this case, the dynamics of stress evolution can be used as a proxy for the dynamics of the instability. For each value of $k_{{f}}$
, we define and measure a splitting equilibration time,
$k_{{f}}$
, we define and measure a splitting equilibration time, $t_{{s}}$
, which corresponds to the time required to attain 95 % of the upper stress value. The plot of inverse equilibration time (or the rate of equilibration) against the prefactor of the local term in the evolution (figure 3
b) reveals a direct relation between the dynamics of stress splitting and the dynamics of the local microstructure evolution, in line with the argument above based on (3.5).
$t_{{s}}$
, which corresponds to the time required to attain 95 % of the upper stress value. The plot of inverse equilibration time (or the rate of equilibration) against the prefactor of the local term in the evolution (figure 3
b) reveals a direct relation between the dynamics of stress splitting and the dynamics of the local microstructure evolution, in line with the argument above based on (3.5).
3.3. Moderate non-locality
We can expect the extent of inhomogeneity in the microstructural fields to be governed by the balance of local and non-local dynamics captured by the characteristic length scale $l_c=\sqrt {\alpha / k_{{f}}\dot {\gamma }}$
. When
$l_c=\sqrt {\alpha / k_{{f}}\dot {\gamma }}$
. When $l_c$
is small, microstructural fields are strongly inhomogeneous (and discontinuous) due to the dominant stress-splitting effects. When
$l_c$
is small, microstructural fields are strongly inhomogeneous (and discontinuous) due to the dominant stress-splitting effects. When $l_c$
is is large, diffusion dynamics dominates resulting in entirely homogeneous fields. It is noteworthy that the definition of
$l_c$
is is large, diffusion dynamics dominates resulting in entirely homogeneous fields. It is noteworthy that the definition of $l_c$
includes
$l_c$
includes $\dot {\gamma }$
which can vary in time (and space), which implies possible variations of microstructural field ‘smoothness’ in time. It is plausible that some intermediate region exists when the characteristic length falls below the domain size, but above the resolution, to produce inhomogeneous but continuous spatial flow fields. To explore the parameter space we carry out stress-controlled simulations for a range of values of
$\dot {\gamma }$
which can vary in time (and space), which implies possible variations of microstructural field ‘smoothness’ in time. It is plausible that some intermediate region exists when the characteristic length falls below the domain size, but above the resolution, to produce inhomogeneous but continuous spatial flow fields. To explore the parameter space we carry out stress-controlled simulations for a range of values of $\alpha$
(see table 3), at a constant stress set-point
$\alpha$
(see table 3), at a constant stress set-point $ ( \varSigma _{{E}} = 1.25 )$
. At the extremes of the range, previously discussed scenarios associated with vanishing and dominant non-locality were present. However, for intermediate values of
$ ( \varSigma _{{E}} = 1.25 )$
. At the extremes of the range, previously discussed scenarios associated with vanishing and dominant non-locality were present. However, for intermediate values of $l_c$
new patterns arise, characterised by significant spatial inhomogeneity combined with smooth, continuous microstructural gradients.
$l_c$
new patterns arise, characterised by significant spatial inhomogeneity combined with smooth, continuous microstructural gradients.
Moderate non-locality parameters.

Simulation time series showing SLPs (red) at the top and bottom wall connected by a thin band. (a,d,g) Viscosity fields. (b,e,h) Local and (c,f,i) non-local contributions to microstructure formation as per (2.6). The snapshots capture the process of a typical oscillation: just before constriction (a), during constriction (b) and after constriction (c). Simulation parameters: $l_{{c}} = 0.0316h$
and
$l_{{c}} = 0.0316h$
and $\varSigma _{{E}}=1.25$
.
$\varSigma _{{E}}=1.25$
.

The typical fields associated with this regime are visualised in figure 4, including fields of viscosity (figure 4
a,d,g), local (figure 4
b,e,h) and non-local (figure 4
c,f,i) contributions to the rate of microstructure formation. The fields shown correspond to a simulation with typical characteristic length $l_c=0.0316h$
, and for a stable parameter configuration for the boundary-driven instability (
$l_c=0.0316h$
, and for a stable parameter configuration for the boundary-driven instability ( $\mu = -1.96 \times 10^{-2}$
). With the addition of moderate non-locality, the stress splitting acts as a seeding instability, which after an induction period results in microstructure organised in clumps of high viscosity (or SLPs) material attached to the wall boundaries. Both clumps travel in the direction of the flow with velocities approximately equal to the flow near their respective boundaries, resulting in a periodic scenario in which the upper SLP passes over the lower SLP, due to the periodic boundary in the flow direction, where the period of the passing is in part determined by the geometry length. Figure 4(a) shows a situation where two previously formed SLPs on the upper and lower plate are approaching each other as the upper plate moves from left to right. The two SLPs are connected by a long band of high-viscosity (frictional state) material which formed in the previous cycle, the last time the SLPs passed each other. During the approach (figure 4
a), SLPs begin forming a constriction thereby deforming the flow fields between them. This produces a region of elevated high shear in the constriction space (compressive direction) where the local term in the microstructure evolution equation (figure 4
b) pushes
$\mu = -1.96 \times 10^{-2}$
). With the addition of moderate non-locality, the stress splitting acts as a seeding instability, which after an induction period results in microstructure organised in clumps of high viscosity (or SLPs) material attached to the wall boundaries. Both clumps travel in the direction of the flow with velocities approximately equal to the flow near their respective boundaries, resulting in a periodic scenario in which the upper SLP passes over the lower SLP, due to the periodic boundary in the flow direction, where the period of the passing is in part determined by the geometry length. Figure 4(a) shows a situation where two previously formed SLPs on the upper and lower plate are approaching each other as the upper plate moves from left to right. The two SLPs are connected by a long band of high-viscosity (frictional state) material which formed in the previous cycle, the last time the SLPs passed each other. During the approach (figure 4
a), SLPs begin forming a constriction thereby deforming the flow fields between them. This produces a region of elevated high shear in the constriction space (compressive direction) where the local term in the microstructure evolution equation (figure 4
b) pushes $f$
towards the frictional branch, beginning the formation of a new high-viscosity connecting band as can be seen clearly in figure 4(d). Once the SLPs have passed each other and the constriction is resolved (figure 4
g), the newly formed connecting band continues to increase in viscosity, while the previous old band is stretched thin allowing for diffusion to overcome the microstructure-building contributions localised within the band, and the band dissipates.
$f$
towards the frictional branch, beginning the formation of a new high-viscosity connecting band as can be seen clearly in figure 4(d). Once the SLPs have passed each other and the constriction is resolved (figure 4
g), the newly formed connecting band continues to increase in viscosity, while the previous old band is stretched thin allowing for diffusion to overcome the microstructure-building contributions localised within the band, and the band dissipates.
During each pass, the average shear rate and stress oscillate (figure 5
a,b) as a result of flow-field deformation, and formation and dissipation of the connecting high-viscosity band. During each cycle, the shear rate between the snapshots shown in figure 4(a,d,g) decreases, before again increasing. Looking at the initial field of local contributions to the microstructure formation (figure 4
b), we observe that the formation of the connecting band begins during the approach (compressive direction) and is driven by the local elements of the model. During the cycle, the viscous band appears in a subsequent time step, where the formation rate is not at its maximum (figure 4
e), due to the delayed nature of microstructure formation. In general, as the shear rate decreases, the local contributions to the microstructure evolution decrease in magnitude (figure 4
b,e,h), while the non-local effects are enhanced (figure 4
c,f,i). This behaviour is in accordance with the definition of $l_c$
, where the extent of splitting is mediated by the shear rate due to the varying balance of local and non-local forces.
$l_c$
, where the extent of splitting is mediated by the shear rate due to the varying balance of local and non-local forces.
The present view of spatial patterns is broadly consistent with that proposed by Rathee et al. (Reference Rathee, Miller, Blair and Urbach2022) on the basis of BSM, wherein they infer the existence of high-stress SLPs at wall boundaries. Their SLP formation can occur on both boundaries (Rathee, Blair & Urbach Reference Rathee, Blair and Urbach2017) or a single boundary, whereas in our simulations, with the particular parameter values described here, two SLPs – one on each wall – are always formed. Our model also does not display the rich dynamics of pattern formation in the wake of the SLP interaction (Rathee et al. Reference Rathee, Blair and Urbach2020). Regardless, our simulations capture the broad picture of the spatial pattern and demonstrate a mode of temporal instabilities induced by the formation and evolution of a distinct spatial arrangement of the microstructure. Our result can also be viewed in congruence with the work of Nakanishi et al. (Reference Nakanishi, Nagahiro and Mitarai2012), where similar geometry-spanning bands of microstructure were reported, and a mode of inhomogeneous oscillatory flow was presented.
Typical average shear (a) and stress (b) measured during oscillations driven by relative motions of SLPs, including an induction period of 100 s. (c) Spatial profiles of the upper SLP at varying strengths of non-locality. (d) Scaling of the SLP width on the strength of non-locality.

The spatial pattern was further characterised by measuring the stress distribution along a line going through the SLP a small distance away from, and parallel to, the upper wall ( $5 \times 10^{-4}\,\textrm {m}$
). As the non-locality (
$5 \times 10^{-4}\,\textrm {m}$
). As the non-locality ( $\alpha$
) is increased at constant local parameters, the SLPs become broader, while the peak stress inside the SLP decreases (figure 5
c). Measured stress profiles were fitted to a normal distribution, measuring their standard deviation,
$\alpha$
) is increased at constant local parameters, the SLPs become broader, while the peak stress inside the SLP decreases (figure 5
c). Measured stress profiles were fitted to a normal distribution, measuring their standard deviation, $A$
, as a proxy measurement for the characteristic length. The resulting fit (figure 5
d) confirms SLPs grow in width with the square root of the diffusion coefficient,
$A$
, as a proxy measurement for the characteristic length. The resulting fit (figure 5
d) confirms SLPs grow in width with the square root of the diffusion coefficient, $\sqrt {\alpha }$
, or in other words, linearly with the characteristic length scale (2.11).
$\sqrt {\alpha }$
, or in other words, linearly with the characteristic length scale (2.11).
3.4. Viscosity ratio
A major difference between the present results and the experimental work on a stress-controlled system lies in the permanence of the SLPs. During BSM measurements in a shear-rate-controlled system, the SLPs are persistent in time (Rathee et al. Reference Rathee, Blair and Urbach2020, Reference Rathee, Miller, Blair and Urbach2022), but in a stress-controlled mode the SLPs are observed to dissipate during the oscillatory behaviour of the system. The proposed mechanism for this relies on the large stress fluctuations measured via BSM, which act through the stress-control scheme to sharply reduce the shear rate below the critical value, $\dot {\gamma }_c$
, allowing SLPs to erode. The dissipation of SLPs will cause the total stress acting on the plate to diminish and the shear rate to increase, starting a new oscillatory cycle.
$\dot {\gamma }_c$
, allowing SLPs to erode. The dissipation of SLPs will cause the total stress acting on the plate to diminish and the shear rate to increase, starting a new oscillatory cycle.
Our model should have all the components required to capture this proposed phenomenology. In figure 3(a) we demonstrated that the stress-splitting instability will act to increase the total average stress in the domain. A similar effect is expected to occur in the spatial pattern-forming regime: the appearance of SLPs is accompanied by a large increase in the average stress acting on the upper plate. The stress control will react to formation of SLPs by decreasing the shear rate, with the extent of shear rate reduction being proportional to the additional stress produced by the formation of the SLP. In accordance with the definition of $l_c$
, the decrease in shear rate will favour the non-local elements of the model, pushing the fields towards a homogeneous state and eroding the SLPs. The dissipation of SLPs will then in turn reduce total stress, potentially below the target stress set-point, resulting in an increase in shear rate. Increasing shear rate will drive the characteristic length scale from the homogeneous regime to a continuous spatial pattern regime initiating a new cycle.
$l_c$
, the decrease in shear rate will favour the non-local elements of the model, pushing the fields towards a homogeneous state and eroding the SLPs. The dissipation of SLPs will then in turn reduce total stress, potentially below the target stress set-point, resulting in an increase in shear rate. Increasing shear rate will drive the characteristic length scale from the homogeneous regime to a continuous spatial pattern regime initiating a new cycle.
This phenomenology is not observed in figure 4 likely due to the small amplitude of the oscillation in the shear rate, where a single cycle does not span a range of characteristic length scale wide enough to capture both the SLP-forming and homogeneous regimes. The underlying issue is the choice to artificially restrict the viscosity ratio in the rheology with the chosen parameters. In a real system, the viscosity ratio ( $H=\eta (f=1)/\eta (f=0)$
) defined as the ratio of the completely frictional state and the frictionless state is observed to span up to three orders of magnitude. In the simulations so far, we have chosen to limit the viscosity ratio to a moderate value (
$H=\eta (f=1)/\eta (f=0)$
) defined as the ratio of the completely frictional state and the frictionless state is observed to span up to three orders of magnitude. In the simulations so far, we have chosen to limit the viscosity ratio to a moderate value ( $H=31.77$
) for numerical purposes. Extending this parameter to a more realistic value should result in higher ‘excess’ stress production as a result of SLP formation, and a higher range of shear rates during oscillations.
$H=31.77$
) for numerical purposes. Extending this parameter to a more realistic value should result in higher ‘excess’ stress production as a result of SLP formation, and a higher range of shear rates during oscillations.
To test this, we carried out simulations with a modified flow curve shape (see table 4 for details). Due to the change in the rheology we also adjusted relevant dynamic parameters to maintain equivalent time scales. For a choice of input stress set-point of $\varSigma _{{E}}=10$
, we obtain nearly equivalent characteristic length scale (
$\varSigma _{{E}}=10$
, we obtain nearly equivalent characteristic length scale ( $l_c=0.0316h$
) to that of the simulations in figure 4, and we can exclude the inertia-driven instability by setting
$l_c=0.0316h$
) to that of the simulations in figure 4, and we can exclude the inertia-driven instability by setting $\mu = -8.87 \times 10^{-3}$
. The main differences in the new rheology are a significantly increased viscosity ratio (
$\mu = -8.87 \times 10^{-3}$
. The main differences in the new rheology are a significantly increased viscosity ratio ( $H=583.51$
) and a reduced diffusive time scale (
$H=583.51$
) and a reduced diffusive time scale ( $\omega =0.79$
).
$\omega =0.79$
).
High-viscosity-ratio parameters.

Normalised stress (black) and shear rate (red) signals with the modified rheology for (a,c,e) $k_{{p}}=1$
and (b,d,f)
$k_{{p}}=1$
and (b,d,f) $k_{{p}}=0.01$
. Solutions for three different stress set-point values are shown for both cases: (a,b)
$k_{{p}}=0.01$
. Solutions for three different stress set-point values are shown for both cases: (a,b) $\varSigma _{{E}}=3$
, (c,d)
$\varSigma _{{E}}=3$
, (c,d) $\varSigma _{{E}}=10$
and (e,f)
$\varSigma _{{E}}=10$
and (e,f) $\varSigma _{{E}}=20$
.
$\varSigma _{{E}}=20$
.

The results of this high-viscosity-ratio (high- $H$
) simulation (figure 6) are in stark contrast to those of the previous low-
$H$
) simulation (figure 6) are in stark contrast to those of the previous low- $H$
simulations. Both shear rate and stress oscillate in an aperiodic high-frequency mode, with a significantly increased amplitude of both signals. Despite the chaotic nature of the signals, a clear trend can be observed in which an increase in the shear rate induces a sharp increase in stress, followed by a sudden drop in the shear rate. Similarly, the fields no longer display persistent, well-defined SLPs attached to the boundaries (as seen for the low-
$H$
simulations. Both shear rate and stress oscillate in an aperiodic high-frequency mode, with a significantly increased amplitude of both signals. Despite the chaotic nature of the signals, a clear trend can be observed in which an increase in the shear rate induces a sharp increase in stress, followed by a sudden drop in the shear rate. Similarly, the fields no longer display persistent, well-defined SLPs attached to the boundaries (as seen for the low- $H$
case in figure 4), but rather the microstructural patterns consist of geometry-spanning structures, which nucleate and dissipate accordingly with oscillations in shear and stress. The highly aperiodic nature of the oscillations in this case is a result of rapid increases in the shear rate during the SLP dissipation phase. As the plate accelerates, a thin layer of high shear rate forms near the upper wall resulting in a microstructure nucleation and propagation in pulses from the top to the bottom of the geometry. Comparing these results with the experimental dynamics in Rathee et al. (Reference Rathee, Blair and Urbach2020), it is clear that the simulated dynamics do not display a clean distinction between pattern-forming and homogeneous regimes such as observed experimentally. To more closely reproduce the experimental observations, we increase the inertia of the system by setting
$H$
case in figure 4), but rather the microstructural patterns consist of geometry-spanning structures, which nucleate and dissipate accordingly with oscillations in shear and stress. The highly aperiodic nature of the oscillations in this case is a result of rapid increases in the shear rate during the SLP dissipation phase. As the plate accelerates, a thin layer of high shear rate forms near the upper wall resulting in a microstructure nucleation and propagation in pulses from the top to the bottom of the geometry. Comparing these results with the experimental dynamics in Rathee et al. (Reference Rathee, Blair and Urbach2020), it is clear that the simulated dynamics do not display a clean distinction between pattern-forming and homogeneous regimes such as observed experimentally. To more closely reproduce the experimental observations, we increase the inertia of the system by setting $k_{{p}}=0.01$
. Increasing the inertial time scale by two orders of magnitude should ensure ample time for microstructure dissipation. Note that now
$k_{{p}}=0.01$
. Increasing the inertial time scale by two orders of magnitude should ensure ample time for microstructure dissipation. Note that now $\mu \gt 0$
and we admit the possibility of a boundary-driven instability as in § 3.1.
$\mu \gt 0$
and we admit the possibility of a boundary-driven instability as in § 3.1.
Figure 6 shows a comparison between low system inertia (figure 6
a,c,e) and high inertia (figure 6
b,d,f) stress and shear rate oscillations for three set-point stresses. In both high- and low-inertia cases, the signal retains significant aperiodic features and a comparable range of shear rate oscillations, but the pattern of increasing shear rate inducing a stress spike becomes even clearer for high inertia (figure 6
b,d,f). Due to the slow action of the stress control scheme, the microstructure is allowed to form more extensive SLPs resulting in significantly higher and sharper increases in stress. In the same vein, oscillations in shear rate proceed by qualitatively regular (but quantitatively aperiodic) slow increases in shear, followed by sharp decreases in shear rate due to massive spikes in stress. This result shows remarkable congruence with the oscillatory patterns reported for a stress-controlled system (Rathee et al. Reference Rathee, Blair and Urbach2020), where the oscillations were accompanied by the formation and disappearance of high-stress events acting on the lower plate. Microstructural fields now feature clear separation between regimes, with the existence of spatial patterns confined to short periods of time associated with spikes in stress; periods of increasing shear rate (and low stress) are associated with entirely homogeneous fields of microstructure. Typical fields of viscosity during a microstructure nucleation and dissipation cycle are shown in figure 7 for a simple shear in a wide geometry with $l=15h$
. No clear structures isolated to the boundaries can be observed. The microstructure spans the entire width of the gap with no clear alignment with either the extensional or compressive axes. Further simulations with an extended geometry (
$l=15h$
. No clear structures isolated to the boundaries can be observed. The microstructure spans the entire width of the gap with no clear alignment with either the extensional or compressive axes. Further simulations with an extended geometry ( $l=15h$
) were carried out to test the robustness of this phenomenology, with similar patterns being observed, i.e. the observed patterns of microstructure displayed in figure 7 are independent of system width size. Further simulations with double resolution (
$l=15h$
) were carried out to test the robustness of this phenomenology, with similar patterns being observed, i.e. the observed patterns of microstructure displayed in figure 7 are independent of system width size. Further simulations with double resolution ( $N=100$
) for
$N=100$
) for $l=3h$
yielded close agreement with the results obtained at
$l=3h$
yielded close agreement with the results obtained at $N=50$
.
$N=50$
.
Visualisation of the viscosity field for a modified high-viscosity-ratio rheology with high system inertia ( $k_{{p}}=0.01$
). Three subsequent time steps of nucleation (a,b) and dissipation (c) of high-viscosity structures.
$k_{{p}}=0.01$
). Three subsequent time steps of nucleation (a,b) and dissipation (c) of high-viscosity structures.

3.5. Fluid inertia
In figure 6, we present simulations for the depth-averaged Reynolds number $0.015\lt Re\lt 8.1$
, with the range corresponding to the span of the oscillations. In cases of high system inertia
$0.015\lt Re\lt 8.1$
, with the range corresponding to the span of the oscillations. In cases of high system inertia $(k_{{p}}=0.01)$
, slow dynamics of wall velocity dominates resulting in clear linear velocity profiles throughout the oscillations, with no noticeable effects of fluid inertia. However, in the case of low system inertia
$(k_{{p}}=0.01)$
, slow dynamics of wall velocity dominates resulting in clear linear velocity profiles throughout the oscillations, with no noticeable effects of fluid inertia. However, in the case of low system inertia $(k_{{p}}=1)$
, the effects of fluid inertia become apparent with the high-stress regions initiating near the upper wall and propagating in short bursts, accompanied with consistently nonlinear velocity profiles. To investigate the influence of fluid inertia on our results, we repeated both low- and high-system-inertia simulations in the range
$(k_{{p}}=1)$
, the effects of fluid inertia become apparent with the high-stress regions initiating near the upper wall and propagating in short bursts, accompanied with consistently nonlinear velocity profiles. To investigate the influence of fluid inertia on our results, we repeated both low- and high-system-inertia simulations in the range $0.0002\lt Re\lt 0.13$
(see table 5). In the case of high system inertia, reductions in fluid inertia yielded little difference, with qualitatively identical phenomenology. On the other hand, the oscillations in the low-system-inertia case differ significantly. Microstructure no longer propagates in bursts; rather, semi-stable bands are formed. These bands propagate in the flow direction and occasionally interact with each other or the domain boundaries to undergo rearrangement. This results in signals where the microstructure rearrangements drive aperiodic fluctuations in stress and shear rate. The resulting signals have significantly lower relative amplitude of the oscillations (note that
$0.0002\lt Re\lt 0.13$
(see table 5). In the case of high system inertia, reductions in fluid inertia yielded little difference, with qualitatively identical phenomenology. On the other hand, the oscillations in the low-system-inertia case differ significantly. Microstructure no longer propagates in bursts; rather, semi-stable bands are formed. These bands propagate in the flow direction and occasionally interact with each other or the domain boundaries to undergo rearrangement. This results in signals where the microstructure rearrangements drive aperiodic fluctuations in stress and shear rate. The resulting signals have significantly lower relative amplitude of the oscillations (note that $\mu \lt 0$
for both high and low fluid inertia).
$\mu \lt 0$
for both high and low fluid inertia).
Low-fluid-inertia parameters.

Varying the stress set-point ( $\varSigma _{{E}}$
) revealed a significant positive correlation between applied stress and the frequency of oscillations (figure 6
b,d,f), a feature reported in experimental work (Rathee et al. Reference Rathee, Blair and Urbach2020) – with no substantial alterations to the oscillation pattern in the case of high inertia, but clear progression from near-periodic (figure 6
a) to strongly chaotic (figure 6
c) back to near-periodic solutions (figure 6
e) in the case of low inertia.
$\varSigma _{{E}}$
) revealed a significant positive correlation between applied stress and the frequency of oscillations (figure 6
b,d,f), a feature reported in experimental work (Rathee et al. Reference Rathee, Blair and Urbach2020) – with no substantial alterations to the oscillation pattern in the case of high inertia, but clear progression from near-periodic (figure 6
a) to strongly chaotic (figure 6
c) back to near-periodic solutions (figure 6
e) in the case of low inertia.
4. Conclusion
We have presented the application of an SPH scalar DST continuum model to the problem of instabilities in simple shear. We checked the accuracy of the model using a previously reported (instrument) inertia instability mechanism and found excellent agreement with the relevant stability properties. Validation of our model at the extreme of dominant locality compared with the model of Richards et al. (Reference Richards, Royer, Liebchen, Guy and Poon2019) resulted in accurate predictions of both bifurcation points and limit cycle sizes in simulations, across a range of stress set-points that span the entire flow curve, for two different gap-height geometries.
To overcome shortcomings of an entirely homogeneous view of the instability, we considered a spatial instability in the form of stress splitting. We demonstrated that such an instability is unique for the DST regime and documented its origin in local contributions to the commonly used microstructural evolution equation. Although stress splitting reliably produced inhomogeneous flow fields in the region of negative flow-curve gradients, it also yielded non-differentiable stress and microstructure fields. Inclusion of non-locality allowed the formation of continuous spatial patterns in microstructure. The form of non-locality in the present work was based on the formulation proposed by Kamrin & Henann (Reference Kamrin and Henann2015), but the analysis is expected to be general enough to anticipate alternative inclusions of non-locality. For example, particle migration as per suspension balance models should fulfil a similar stress-diffusive role, with the added benefit of producing compaction fronts. With intermediate non-locality in the model, the obtained fields of microstructure showed the formation of high-viscosity phases – or SLPs – near the solid geometry boundaries, connected by a band material in a highly frictional state. The simulated DST rheology in this case was characterised by a relatively low viscosity contrast which severely limited the range of the amplitude of the shear rate oscillations. This produced long-lived SLPs, more akin to the experimentally observed SLPs for shear-rate-controlled systems (Rathee et al. Reference Rathee, Blair and Urbach2020).
Simulations with high viscosity contrast (similar to realistic DST fluids) were able to capture the oscillatory phenomenology observed in the BSM measurements of Rathee et al. (Reference Rathee, Blair and Urbach2020), along with commonly reported aperiodic solutions (Hermes et al. Reference Hermes, Guy, Poon, Poy, Cates and Wyart2016). Here, aperiodicity was found to be driven by the nucleation and dissipation of the microstructural patterns within the geometry, which were broadly similar but different in detail in each cycle. The role of inertia was probed, and while it did not appear to have a determinitive role in the presence of instabilities in the range of parameters used in this work, it had a significant influence on the oscillatory patterns. It is noteworthy that this suggests that measurements of identical materials should have significantly different patterns based on the parameters such as the inertia of the geometry used or the rheometer itself. Across the range of input stresses in the entire multivariate region of the flow curve, high-inertia simulations maintained their near-periodic (but still strictly aperiodic) oscillation patterns with significant increases in frequency as stress increased. In the case of low inertia, high-stress events increase in frequency, but now the oscillatory pattern transitions from near-periodic to chaotic and back to near-periodic oscillations with increasing stress.
The primary limitation of our implementation is the lack of vorticity direction. Much of the instabilities in DST have an aspect along the vorticity direction, both in experiments (Herle et al. Reference Herle, Fischer and Windhab2005; Rathee et al. Reference Rathee, Miller, Blair and Urbach2022) and in simulations (Chacko et al. Reference Chacko, Mari, Cates and Fielding2018). The inclusion of both gradient and vorticity instabilities is likely a key next step in future work towards a complete picture of rheochaos. In addition, the transition away from scalar microstructure representation towards tensorial microstructure orientation implementations could pose a significant advantage, allowing for distinguishing compressive and extensional shear effects in formation and destruction of the microstructure (Gillissen et al. Reference Gillissen, Ness, Peterson, Wilson and Cates2019).
As a last remark, it should be noted that the microscopic DEM-based method with explicit solvent model and resolved hydrodynamics at a particle level (Orsi et al. Reference Orsi, Lobry, Lemaire and Peters2024) would allow us to describe the problem of heterogeneous flows. However, in order to reach the macroscopic scales of flow instabilities (due to scale separation), a prohibitively large number of degrees of freedom would be needed for these direct numerical simulations. In the present approach , we are proposing a continuum-based microstructural model allowing one to reach a larger scale and address the possibility of rheochaos.
Dimensionless shear rate (red) and stress (black) for (a,c) $\varSigma _{{E}}=1.40$
and (b,d)
$\varSigma _{{E}}=1.40$
and (b,d) $\varSigma _{{E}}=2.55$
;
$\varSigma _{{E}}=2.55$
; $k_{{p}}=0.01$
.
$k_{{p}}=0.01$
.

Dimensionless shear rate (red) and stress (black) for (a,c) $\varSigma _{{E}}=1.40$
and (b,d)
$\varSigma _{{E}}=1.40$
and (b,d) $\varSigma _{{E}}=2.55$
;
$\varSigma _{{E}}=2.55$
; $k_{{p}}=1$
.
$k_{{p}}=1$
.

Funding
P.A. and B.S. acknowledge funding from the Engineering and Physical Sciences Research Council (EP/S034587/1). This research is partially supported by the Basque Government through the BERC 2022–2025 programme and by the Spanish State Research Agency through BCAM Severo Ochoa excellence accreditation CEX2021-0011 42-S/MICIN/AEI/10.13039/501100011033 and through the project PID2020-117080RB-C55 (‘Microscopic foundations of softmatter experiments: computational nano-hydrodynamics’ and acronym ‘Compu-Nano-Hydro’). R.S. acknowledges funding from the National Natural Science Foundation of China (12174390, 12150610463) and Wenzhou Institute, University of Chinese Academy of Sciences (WIUCASQD2020002).
Declaration of interests
The authors report no conflict of interest.
Data availability statement
The data and the simulation code that support the findings of this study are available from the corresponding author upon reasonable request.
Appendix A. Fluid inertia
To investigate effects of fluid inertia we alter the flow curve by reducing $\phi ^0:10\rightarrow 0.90$
and
$\phi ^0:10\rightarrow 0.90$
and $\phi ^{m}:0.562\rightarrow 0.55$
, effectively increasing both frictionless and frictional viscosities. This results in a reduction of
$\phi ^{m}:0.562\rightarrow 0.55$
, effectively increasing both frictionless and frictional viscosities. This results in a reduction of $H: 583\rightarrow 483$
, to facilitate higher computational cost while remaining in large-viscosity-contrast parameter space. Finally, the value of the diffusion coefficient
$H: 583\rightarrow 483$
, to facilitate higher computational cost while remaining in large-viscosity-contrast parameter space. Finally, the value of the diffusion coefficient $\alpha : 2 \times 10^{-7} \rightarrow 10^{-8}$
is reduced to compensate for reduction in shear rate and maintain a similar balance of local and non-local effects. The resulting range of
$\alpha : 2 \times 10^{-7} \rightarrow 10^{-8}$
is reduced to compensate for reduction in shear rate and maintain a similar balance of local and non-local effects. The resulting range of $Re$
here is
$Re$
here is $2 \times 10^{-4} \lt Re \lt 0.13$
.
$2 \times 10^{-4} \lt Re \lt 0.13$
.
The results for high system inertia $(k_{{p}}=0.01)$
are presented in figure 8. For both applied stresses, oscillations retain the pattern of high shear rate inducing formation of spatially heterogeneous microstructure, which in turn facilitates spikes in stress and deceleration of the upper plate. The main difference consists of ‘softer’ deceleration phase and less pronounced (but still present) aperiodicity of the signals. For low system inertia
$(k_{{p}}=0.01)$
are presented in figure 8. For both applied stresses, oscillations retain the pattern of high shear rate inducing formation of spatially heterogeneous microstructure, which in turn facilitates spikes in stress and deceleration of the upper plate. The main difference consists of ‘softer’ deceleration phase and less pronounced (but still present) aperiodicity of the signals. For low system inertia $(k_{{p}}=1)$
in figure 9 significant differences due to reduced inertia include vastly reduced relative amplitude of oscillations. Interestingly, apparent oscillations retain their aperiodic ‘noisy’ appearance.
$(k_{{p}}=1)$
in figure 9 significant differences due to reduced inertia include vastly reduced relative amplitude of oscillations. Interestingly, apparent oscillations retain their aperiodic ‘noisy’ appearance.
The values of $\phi$
,
$\phi$
, $\phi ^m$
and
$\phi ^m$
and $\phi ^0$
were chosen according to the values obtained by Baumgarten & Kamrin (Reference Baumgarten and Kamrin2019) by fitting the WC model to the data available in the literature for various experimental samples. The solvent parameters were matched with water, with increases in viscosity in some cases being comparable to using water–glycerol mixtures. The dynamic properties of microstructural formation, diffusion and system inertia for experimental system are less readily available. Theses parameters were the subject of this study, with the resulting flow fields being compared with the experimental measurements across a range of the dynamic parameter space.
$\phi ^0$
were chosen according to the values obtained by Baumgarten & Kamrin (Reference Baumgarten and Kamrin2019) by fitting the WC model to the data available in the literature for various experimental samples. The solvent parameters were matched with water, with increases in viscosity in some cases being comparable to using water–glycerol mixtures. The dynamic properties of microstructural formation, diffusion and system inertia for experimental system are less readily available. Theses parameters were the subject of this study, with the resulting flow fields being compared with the experimental measurements across a range of the dynamic parameter space.


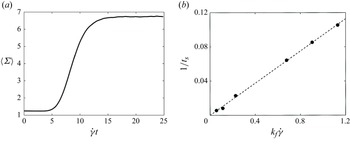


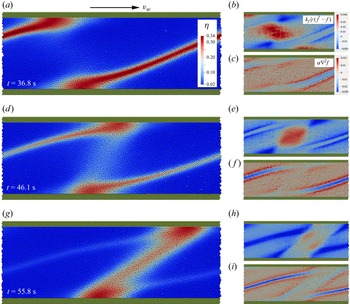


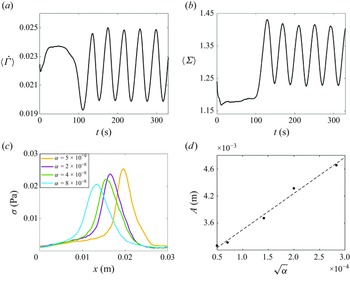


 Open access