


The global burden of disease attributable to overweight and obesity continues to rise, and in Australia, it has recently overtaken tobacco use as the leading risk factor for morbidity and mortality(1). Excess weight also imposes a significant financial burden on both the Australian healthcare system and broader society, with an estimated annual cost of approximately A$39 billion(2). The ubiquitous marketing of unhealthy foods (high in salt, added sugar and/or saturated fat) across various media platforms impacts dietary choices, and there is credible evidence of it being causally linked to consumption(Reference Norman, Kelly and Boyland3). The WHO has highlighted that unhealthy food marketing is a threat to public health and recommends governments implement comprehensive restrictions(4).
Out of home (OOH) advertising consists of various formats including roadside billboards, public transport assets and other public spaces such as sports stadiums and shopping centres. This form of advertising continues to expand in Australia as an effective form of marketing to large and unrestricted audiences, with approximately 93 % of Australians living in and around state capital cities being exposed to outdoor media assets daily(5).
Australian audits have shown that there is a high prevalence of unhealthy foods being advertised on OOH assets(Reference Trapp, Hooper and Thornton6), and many of these assets are government owned (e.g. trains, buses and roadside billboards). Given the negative impact of unhealthy food advertising on health and the incongruence between unhealthy food advertising on government assets and government imperatives and strategies to improve public health, the public health community in Australia has called for the removal of unhealthy food advertising on government-owned assets(7,8) .
A recent scoping review identified nine jurisdictions that have implemented policies to restrict unhealthy food advertising on publicly owned assets(Reference Chung, Zorbas and Riesenberg9). However, there is limited evaluation of these policies to demonstrate their effectiveness on population dietary behaviours. The exception is the Transport for London (TfL) policy, which imposed restrictions on unhealthy food advertising on TfL assets in 2019. A controlled interrupted time series analysis of the TfL policy showed that it was associated with relative reductions in take-home purchases of unhealthy foods(Reference Yau, Berger and Law10).
In addition to the evidence of policy effectiveness, Australian governments require evidence on the value for money of policies prior to them being considered for implementation(Reference Ananthapavan, Moodie and Milat11). Consideration of the costs and benefits of a proposed policy can inform the efficient allocation of scarce societal resources. An economic modelling study of the TfL policy showed that OOH unhealthy food and drink advertising restrictions were likely to result in significant health gains, healthcare cost savings and have a positive equity impact given the socio-economic patterning of obesity prevalence(Reference Thomas, Breeze and Cummins12). However, this study did not investigate the cost of policy implementation or its impact on industry. As a result, the overall costs and benefits of the policy from a societal perspective remain unknown(Reference Thomas, Breeze and Cummins12).
In 2021, the Western Australian (WA) Government made an election commitment to form a working group to investigate the feasibility of a policy to remove unhealthy food advertising from State-owned assets(13); however, the policy is yet to be implemented(14). The aim of this study was to inform policy implementation by undertaking cost–benefit analyses using a societal perspective to assess the potential value for money of a policy to restrict unhealthy food and drink advertisements on WA State-owned public transport assets.
Methods
The proposed policy
The proposed intervention involves developing and implementing a state government policy to remove all unhealthy food and drink advertising from WA State government-owned public transport assets. These include assets owned by the Public Transport Authority (PTA), comprising buses, trains and train stations; and those owned by Main Roads WA, including billboards that are visible from state roads and bridges. Public transport media assets that would be excluded from this policy include bus shelters and roadside seats, which are owned by local governments, and sports stadiums, which have complex ownership and governance agreements for advertising rights.
The policy defines unhealthy food using the Council of Australian Governments guidelines on foods and drinks that are not recommended for promotion to reduce children’s exposure to unhealthy foods(Reference Watson, Khor and Hughes15). The Council of Australian Governments food category-based guideline is aligned with the Australian Dietary Guidelines, easy to implement and able to better identify unhealthy food products compared with other nutrient profiling models(Reference Watson, Khor and Hughes15). To ensure comprehensiveness, the modelled policy also restricts master brand advertising associated with unhealthy food and drink. Master brand advertising promotes the company’s brand name and aims to build recognition and trust in the company and therefore can influence consumer preferences and purchase intent, even when specific unhealthy products are not advertised(Reference Kenton16,Reference Boyland, Davies and Wilton17) .
Overview of the economic evaluation
Cost–benefit analysis is a type of economic evaluation where the costs and benefits of proposed government actions are monetised to assess whether the benefit to society justifies the expenditure of limited resources. Although not commonly used for health sector economic evaluations, it is the preferred economic analysis to inform WA government decision-making by the Treasury and Transport Departments(18). The incremental costs and benefits of the policy were estimated from a societal perspective using a status quo (no policy) comparator. Consistent with several government guidance documents, the time horizon for the analysis was 30 years (with different time horizons tested in sensitivity analyses (Scenario 1–2)) and a discount rate of 7 %(Reference Ananthapavan, Moodie and Milat11) was applied to both costs and benefits and reported for the 2019 reference year. Costs were adjusted to 2019 values using the consumer price index(19). The results of the analyses were presented as net present value and benefit cost ratios (BCR). A positive net present value indicates that the intervention generates net societal benefits with its magnitude reflecting the size of net benefits. A BCR greater than 1 demonstrates that benefits outweigh costs with higher values indicating greater return on investment. $NPV\; = \;\sum\limits_{t = 0}^T {{{\Delta {B_t} - \Delta {C_t}} \over {{{\left( {1 + r} \right)}^r}}}}$ $BCR\; = \;\sum\limits_{t = 0}^T {{{\Delta {B_t}} \over {{{\left( {1 + r} \right)}^r}}}} \Big/{{\Delta {C_t}} \over {{{\left( {1 + r} \right)}^r}}}$
where $\Delta {B_t}$
= Intervention net monetary benefits in year t. All impacts of the intervention were included on the ‘benefits’ side of the equation
$\Delta {B_t}$
= Intervention net monetary benefits in year t. All impacts of the intervention were included on the ‘benefits’ side of the equation $\Delta {C_t}$
= Intervention net costs in year t
$\Delta {C_t}$
= Intervention net costs in year t
r = Real social discount rate (7 % in primary analysis)
T = Number of years in the analysis period (30 years for the primary analysis)
Policy impact on population weight and body mass index
The policy was modelled to impact the population of Greater Perth (the capital city of Western Australia), who are most likely to be exposed to advertising on public transport assets(5). The intervention logic pathway is shown in Figure 1. The effectiveness of the policy was based on the evaluation of the TfL policy by Yau et al. (Reference Yau, Berger and Law10) The controlled interrupted time series analysis of 1970 households (in London (intervention) and North of England (control)) used panel data to estimate the energy and nutrients from unhealthy food and drink products in average weekly household grocery purchases in the post-intervention period (44 weeks) compared with a counterfactual constructed from the control and pre-intervention (36 weeks) purchasing data(Reference Yau, Berger and Law10). The study found that there was a relative change of −6·7 % (95 % CI: −10·1, −3·2) in weekly household energy purchased from foods high in fat, salt and sugar in the intervention group compared with the control group post policy implementation.
Intervention logic pathway.

Effectiveness adjustments
The overall change in unhealthy food purchasing from the TfL analysis was adjusted to reflect the key differences in the TfL and the proposed WA policy and exposure to OOH advertising in London compared to Perth:
-
i) The TfL policy covers more transport assets compared with the proposed WA policy. The TfL policy applies to 90 % of bus shelters within the Greater London Authority administrative area,(20) whereas the WA policy does not apply to any bus shelters in Perth. However, the proposed intervention is more comprehensive than TfL as there are no exemptions and restricts all master branding, whereas the TfL policy allows master branding alongside healthy products. Given that these policy provisions have positive and negative effects on the impact of the policy on unhealthy food advertising exposure and therefore consumption, for the primary analysis, it was assumed that no adjustments to the TfL effect size were required. In sensitivity analyses (Scenario 3), a further 18 % reduction in the effectiveness of the TfL policy was applied to account for the assumed reduced coverage of public transport assets for WA compared with the TfL policy. This was calculated based on the assumption that one-fifth of media assets in WA are bus shelters (others being buses, roadside billboards, trains, train stations and bridges), and exposure to OOH advertising is equivalent across these assets.
-
ii) Although high quality and comparable evidence on OOH advertising exposure across the two contexts (Perth and London) is lacking, the limited evidence from industry reports state that 98 % of the UK population are exposed to OOH advertisements each week(21), while the corresponding value for Australians is 78 %(22), which increases to 93 % of the population living in Australian state capital cities (including Perth) being exposed daily(5). For the primary analysis, we assumed a 20 % reduction in effectiveness from the TfL analysis but also tested the assumption of no difference in effectiveness between the two policies in sensitivity analyses (Scenario 4).
The adjustments made to the effect size in the primary and sensitivity analyses were discussed with the project advisory group, which consisted of food policy academic experts, representatives from public health NGOs and policymakers. Table 1 shows key parameter values used in the primary analysis. Table 2 shows the various sensitivity analyses undertaken including scenarios where the effect size estimate was varied.
Key parameters used in the primary cost–benefit analysis

A$, Australian dollars in 2019 values; ABS, Australian Bureau of Statistics; CBA, cost-benefit analysis; FTE, full time equivalent; HALY, Health-adjusted life years; M, millions; OOH, out of home; PTA, Public Transport Authority; UI, uncertainty interval; VSLY, value of a statistical life year; WA, Western Australia.
* COAG (Council of Australian Governments) Health Council, 2018. National interim guide to reduce children’s exposure to unhealthy food and drink promotion – 2018 (Guideline). Available at: https://www.health.gov.au/resources/publications/national-interim-guide-to-reduce-childrens-exposure-to-unhealthy-food-and-drink-promotion-2018?language=en
Description of scenario analyses

A$, Australian dollars in 2019 values; CBA, cost-benefit analysis; HALY, Health-adjusted life years; OOH, out of home; PTA, Public Transport Authority; TfL, Transport for London; UI, uncertainty intervals; UK, United Kingdom; VSLY, value of a statistical life year; WA, Western Australia.
Change in consumption of unhealthy food and drink, energy intake and health outcomes
To estimate the impact of the policy on daily kilojoule (kJ) intake, the adjusted effect size was applied to unhealthy food consumption in the Perth population aged > 2 years. Foods classified as unhealthy in the TfL analysis(Reference Yau, Berger and Law10) were matched to food categories using the Council of Australian Governments guidelines. The consumption of these foods in the Perth population by 5-year age and sex groups was extracted from the Australian Health Survey 2011–2012(23) and the National Health Survey 2017–2018(24). The energy content of these food products was estimated using the Australian Food, Supplement and Nutrient Database (AUSNUT) 2011–2013(25).
In the primary analysis, the adjusted effect size from Yau et al. (Reference Yau, Berger and Law10) was applied to the consumption of all unhealthy food and drink products as categorised by the Council of Australian Governments guidelines, including fast food consumption. Yau et al. (Reference Yau, Berger and Law10) undertook additional analyses to assess spillover effects of the intervention on the purchasing of healthy products and found no significant changes in mean energy in the intervention group compared with the comparator. Therefore, substitution to more healthy foods was not included in this analysis. The Yau et al. (Reference Yau, Berger and Law10) analysis also disaggregated the impact on purchasing by food category. They found that the change in energy of purchased food was significant for all unhealthy foods combined and the individual food categories of: (i) chocolate and confectionery and (ii) puddings and biscuits. In sensitivity analyses, the statistically significant effect sizes were applied to the relevant food categories (Scenario 5).
The change in daily kJ consumption was converted to changes in body weight using validated equations for children(Reference Hall, Butte and Swinburn26) and adults and assumed to occur at the end of year 1(Reference Hall, Sacks and Chandramohan27). A previously developed and validated proportional, multi-state lifetable Markov cohort model (ACE-Obesity Policy model)(Reference Ananthapavan, Sacks and Brown28–Reference Ananthapavan, Nguyen and Bowe30), adapted for the 2019 Perth population,(Reference Ananthapavan, Tran and Morley31) was used to estimate the impact of the changes in weight on body mass index (BMI) and the consequent impact on the epidemiology of nine obesity-related diseases (type 2 diabetes, hypertensive heart disease, ischaemic heart disease, stroke, osteoarthritis (hip and knee) and kidney, colorectal, endometrial and breast cancers). The long-term health outcomes were quantified as health-adjusted life years. Using cost data from the Australian Institute of Health and Welfare(32), changes in healthcare costs resulting from changes in the incidence and prevalence of obesity-related diseases were also estimated.
For the cost–benefit analysis, the incremental health-adjusted life years gained from the impact of the policy were monetised using the value of a statistical life year (VSLY, A$213 000) as recommended by the Australian Government Office of Impact Analysis(33). A more contemporary estimate of the VSLY (A$314 772 in 2019 values)(Reference Ananthapavan, Moodie and Milat34) was used in sensitivity analyses (Scenario 6).
Cost of policy development and implementation
Using a societal perspective, cost to government included: policy development, policy monitoring and the impact of lost advertising revenue. Loss in profits was used as a proxy for loss of producer surplus for the OOH advertising industry. Loss of profits to unhealthy food and drink manufacturers from reduced sales was not included in the analysis, which is consistent with other cost–benefit analyses undertaken for government decision-making where it was assumed that a reduction in sales of unhealthy products will be redistributed to other unaffected products with minimal overall impact on economic output and the economy(35). All wage rates were inclusive of 14 % salary oncosts(Reference Brown, Ananthapavan and Veerman36) and 17·5 % annual leave loading(37).
Cost to government
The time required to develop the policy was informed by discussions with WA Government policymakers with experience in developing a policy to restrict OOH alcohol advertising. The primary analysis assumed that policy adoption would not require legislation. Sensitivity analyses (Scenario 7) tested the impact of including the cost of legislation ($1 306 180 in 2019 values)(Reference Lal, Mantilla-Herrera and Veerman38) on the results.
Policy monitoring costs were estimated from economic evaluations of national television advertising restrictions(Reference Brown, Ananthapavan and Veerman36). These costs were halved for the current analysis given that a state-based policy would require less compliance monitoring compared to a nationwide policy. It was assumed that monitoring would require one full-time compliance officer.
Informed by parliamentary records(39), potential advertising revenue loss to the WA government (from lower value contracts with advertising companies) was estimated from annual advertising income from food and drink advertising on PTA assets adjusted for the proportion of this advertising for unhealthy products (55 %)(Reference Trapp, Hooper and Thornton6). In the absence of data, the revenue loss for Main Roads WA was estimated based on industry reports indicating that 58 % of OOH advertising is on billboards(40). The TfL experience showed no impact on advertising revenue after policy implementation, this is tested in Scenario 8(Reference Thomas, Breeze and Cummins12). The primary analysis used a conservative assumption that there was no replacement of the unhealthy food advertising and the loss in revenue was maintained over a 30-year time horizon. A less conservative assumption related to advertising replacement by products not impacted by the advertising restrictions was tested in Scenario 9.
A 10-year licensing agreement with PTA and APN (an outdoor advertising company) was signed in 2019(Reference Rauso41). Due to the lack of available data on contract details, the cost of early advertising contract termination was not included in the primary analysis. Scenario 10 models the impact of phasing in the intervention after 10 years when the licensing agreement expires.
Cost to industry
To estimate the potential revenue impact on the advertising industry, APN annual revenue from transport advertising across Australia(40) was adjusted by: (i) advertising concentration in WA (7 %)(Reference Allday42) and (ii) proportion of all advertisements that are for unhealthy food and drink (21 %)(Reference Trapp, Hooper and Thornton6). The profit margin for APN Outdoor group (13 %) was applied to the revenue to estimate potential profit losses if there were no advertising replacement (no impact on profits is tested in Scenario 8)(43).
Uncertainty analyses
Monte Carlo simulation using an Excel add-in software (Ersatz version 1.35) as undertaken to incorporate parameter uncertainty into all modelled outputs, which are reported with 95 % uncertainty intervals (UI). Drawing parameter input values defined by probability distributions (Table 1), 2000 iterations of the model were run. When there was minimal data on parameter distributions, the mean value was varied by ± 25 % using a Pert distribution(Reference Barendregt44).
Uncertainty related to the assumptions used in the primary analysis was tested using univariate and multivariate scenario analyses. Various analyses were undertaken to evaluate the impact of changing individual variables or multiple varibles at once on the cost-effectiveness results. The scenarios examined included changes to the time horizon, costs and effectiveness and are described in Table 2.
See online supplementary material, Supplemental File 1 for the completed Consolidated Health Economic Evaluation Reporting Standards 2022 (CHEERS 2022) checklist for this economic evaluation.
Results
Primary analysis
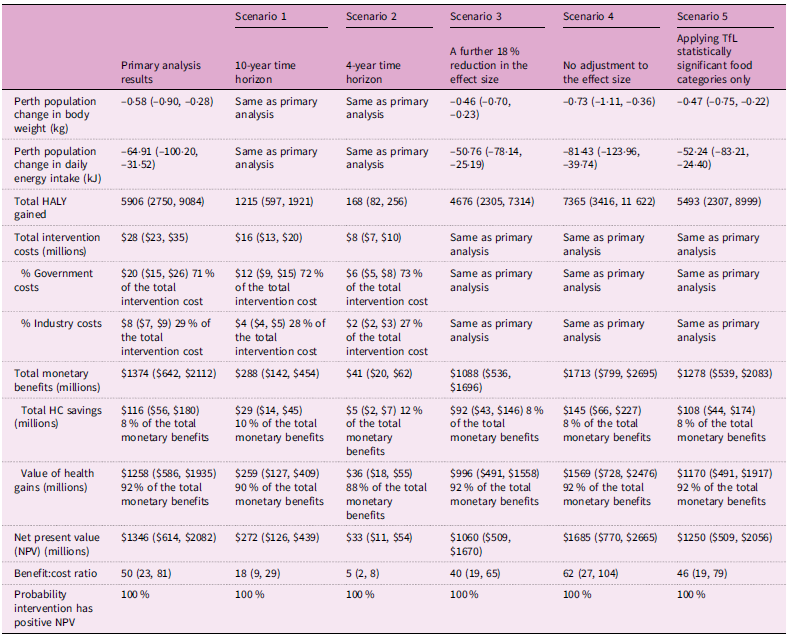
Over a 30-year time horizon, a policy to restrict unhealthy food and drink advertisements on WA transport assets was estimated to result in change in weight of –0·58 kg (95 % UI: –0·90, –0·28) for the Greater Perth population. This translated to 5906 health-adjusted life years gained (95 % UI: 2750, 9084). The overall cost of intervention implementation was A$28 million (M) (95 % UI: $23, $35), with the majority (71 %) being borne by the WA Government. The majority (92 %) of benefits accrued from monetised health gains. However, intervention costs were offset by healthcare cost savings of A$116M (95 % UI: $56, $180), and therefore, even without the monetised health gains, the intervention would be considered dominant – producing health gains and net cost savings. The results demonstrated that the proposed policy is likely to result in substantial net societal benefits (Table 3; BCR: 50 (95 % UI: 23, 81); net present value: A$1346M (95 % UI: $614, $2082)).
CBA results of primary analysis and scenarios 1 to 5 (mean, 95 % uncertainty interval (UI))

CBA, Cost–benefit analysis; HALY, Health-adjusted life year; HC, Healthcare; kg, Kilogram; kJ, Kilojoule; UI, Uncertainty intervals.
Sensitivity analyses
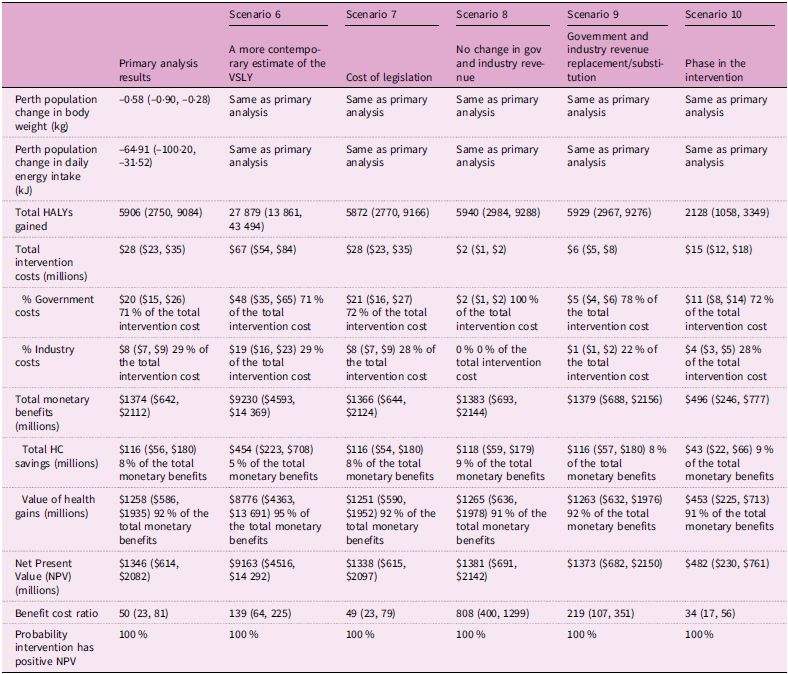
Sensitivity analyses results are presented in Table 3 and 4. For the scenarios where the effectiveness parameters were changed, Scenario 10 (phasing in the intervention after 10 years to align with the end of current outdoor advertising contracts) produced the least favourable results (BCR 34 (95 % UI: 17, 56)). Applying the effectiveness of the TfL policy with no adjustments (Scenario 4) produced the most favourable results (BCR: 62 (95 % UI: 27, 104)).
Across all scenarios, assuming no change in advertising revenue to both advertisers and Government based on the TfL experience (Scenario 8) produced overall the most favourable outcomes (BCR: 808 (95 % UI: 400, 1299)). Using a very short time horizon of 4 years (Scenario 2) produced the least favourable results (BCR: 5 (95 % UI: 2, 8)).
Discussion
This analysis found that a policy to restrict unhealthy food and drink advertising on WA state-owned public transport assets potentially represents excellent value for money. The policy is predicted to produce net benefits of almost A$1·4 billion over a 30-year period and produce A$50 in benefits for each dollar spent. The results of the sensitivity analyses demonstrated that under all tested scenarios, the policy was likely to produce net societal benefits.
These results are consistent with an evaluation of the TfL policy that used the same effectiveness measures (from Yau et al. 2022(Reference Yau, Berger and Law10)) as the current analysis. It demonstrated that the TfL policy would result in substantial health gains and healthcare cost savings for the London population(Reference Thomas, Breeze and Cummins12). Although the London population is five times greater than the Perth population, the TfL evaluation predicted 3·8 times the health benefits compared with the current analysis. This could be explained by the current analysis modelling different and more diseases to estimate the long-term health impact of the policy. There are limited studies that report the cost-effectiveness of obesity prevention policies for the WA setting. A recent evaluation of a WA mass media campaign to encourage adults to achieve a healthy weight was reported to represent very good value for money(Reference Ananthapavan, Tran and Morley31). This study adds to the evidence base of cost-effective actions that state governments can take to support healthy population diets.
A key concern of transport department policymakers may be the potential for reduced advertising revenue from lower-value advertising contracts with outdoor advertisers resulting from the policy. However, the experience from TfL was that there was no impact on TfL advertising revenue resulting from their advertising restrictions policy(Reference Thomas, Breeze and Cummins12), demonstrating the feasibility of replacement advertising on OOH assets. A study that evaluated industry responses to the TfL policy found that the strongest opposition to the TfL policy came from the advertising industry, claiming large revenue impacts(Reference Lauber, Hunt and Gilmore45). This analysis shows that if there was no replacement of the unhealthy food advertisements, the potential profit loss to advertisers would be approximately A$8M over a 30-year period, with the more likely scenario of no impact on advertising industry profits. However, the cost of waiting for the 10-year OOH advertising contract to lapse was estimated to result in substantially less societal benefits.
A recent obesity prevention priority-setting study found that thirteen out of the sixteen interventions evaluated required multi-sectoral collaboration for effective implementation(Reference Ananthapavan, Sacks and Brown28). This analysis showed that the majority of intervention costs (A$20M) were likely to be borne by the transport department; however, the healthcare cost savings (A$116M) were accrued by state and federal departments of health. This highlights the need for structural changes to department financing to incentivise cross-sectoral collaboration in order to effectively implement public health policies that produce net societal benefits(Reference Ananthapavan, Sacks and Moodie46).
There are several strengths of this analysis including the use of a validated economic model that has been used to evaluate several obesity prevention interventions for the Australian setting(Reference Ananthapavan, Sacks and Brown28). Another strength is the extensive involvement of an expert advisory group of policymakers and public health experts who confirmed the plausibility and policy relevance of the assumptions used and the scenarios tested. A key limitation was the inability to incorporate quantified productivity impacts of the policy (resulting from reduced chronic illness), which would have increased the societal benefits of the modelled policy. In addition, there were several key data gaps. Advertising exposure data was ascertained from industry reports that did not robustly report the data collection and analysis methods. Dietary survey data for the Perth population used in the modelling were dated, requiring the assumption that unhealthy food consumption patterns have remained relatively consistent over the past 10 years. Based on the evidence from Yau et al., (Reference Yau, Berger and Law10) dietary substitution of food and drink products that were subject to advertising restrictions to products that were not restricted was not modelled. If substitution exists, the impact of the policy on overall energy consumption is likely overestimated. Conversely, the health impacts of this policy may be underestimated in this analysis as the modelling exclusively used reductions in BMI to estimate the health gains associated with the policy. However, reduced consumption of unhealthy foods will also deliver health gains through reduced consumption of sugar, salt and saturated fat, which are all risk factors for chronic disease independent of BMI(Reference Afshin, Sur and Fay47). In addition, an important impact that is not included in the modelling is how advertising restrictions may shape perceptions of healthier eating patterns, potentially shifting social norms in ways that produce more substantial and lasting effects over time(Reference Correa, Fierro and Reyes48). There were also several assumptions that were required to estimate the impact of this policy in the WA context including reliance of one study (Yau et al. 2022)(Reference Yau, Berger and Law10) that assessed the effectiveness of the TfL policy on unhealthy food purchasing by Londoners. Additional evaluations of outdoor unhealthy food and drink advertising restriction policies are required to strengthen the evidence base of the effectiveness of outdoor advertising restrictions and bridge current evidence gaps to inform future public health policy design including understanding i) substitution consumption of other products and overall impact on dietary intake and ii) response to the restrictions from unhealthy food and drink manufacturers and the advertising industry, including displacement of unhealthy food and drink advertising to unrestricted platforms and increasing master brand advertising alongside healthier products (which is currently permitted in the TfL policy).
Comprehensive advertising bans across all media are likely required to effectively reduce exposure to unhealthy food and drink advertising. The Australian Preventive Health Strategy 2021–2030(49) and the National Obesity Strategy 2022–2032(7) highlight the need to reduce exposure to unhealthy food and drink marketing. Recent progress has been made with the Australian Government Department of Health, Disability and Ageing undertaking a feasibility study on options to reduce unhealthy food marketing(50). Whilst the federal government progresses these initiatives, Australian state governments can take a leading role by implementing this potentially highly cost-effective policy. Although the results of this analysis may not be directly transferable to other Australian states and territories due to differences in ownership and management of transport media assets and population characteristics, it provides evidence to support the development of a policy relevant to the context of different Australian jurisdictions. On 4 January 2025, another Australian State government (Government of South Australia) announced a new policy to restrict unhealthy food and drink advertising on buses and trains(51). The South Australian governments should undertake a robust evaluation of its policy to add to the evidence of the effectiveness and cost-effectiveness of restricting outdoor unhealthy food and drink advertising. This may provide the necessary evidence for other Australian States and Territories to adopt a similar policy. National Government leadership may be required to ensure a consistent approach is adopted across the country.
Conclusion
This study is the first full economic evaluation of a proposed policy to restrict unhealthy food and drink advertising on publicly owned outdoor assets. It demonstrates that such a policy is likely to represent excellent value-for-money and results in substantial societal benefits. This is a key strategy that Australian State governments can implement to protect their population from the harmful effects of unhealthy food and drink marketing.
CBA results of primary analysis and scenarios 6 to 10 (mean, 95 % uncertainty interval (UI))

CBA, Cost–benefit analysis; HALY, Health-adjusted life year; HC, Healthcare; kg, Kilogram; kJ, Kilojoule; NPV, Net present value; UI, Uncertainty Interval.
Supplementary material
For supplementary material accompanying this paper visit https://doi.org/10.1017/S1368980026102249
Acknowledgement
The authors would like to acknowledge the project advisory team for providing expertise in policy implementation in the Western Australian context and the necessary assumptions for modelling.
Authorship
All authors have made important and substantial contributions to the article, and all authors meet authorship guidelines. J.A., M.R.A., E.G., A.S.: conception and design, data acquisition and analysis. J.A. and M.R.A.: drafted article. All authors: data interpretation and critically revised the article.
Financial support
This study was commissioned by Cancer Council Western Australia. J.A. reports financial support was provided by Cancer Council Western Australia. M.R.A. reports financial support was provided by Cancer Council Western Australia. E.G. and A.S. are employees of Cancer Council Western Australia. All other authors declare that they have no known competing financial interests or personal relationships that could have appeared to influence the work reported in this paper. J.A. is funded by a Deakin University Postgraduate fellowship and a National Health and Medical Research Council (NHMRC) Emerging Leader Fellowship (GNT2033338). K.B. is funded by an Australian National Heart Foundation Fellowship (106716). G.S. is funded by a NHMRC Emerging Leadership Fellowship (GNT2008535).
Competing interests
There are no conflicts of interest.


 Open access