

AIMS, Introduction and Rationale
The aims of this paper are firstly to calculate transient hydraulics and sediment transport within a subaerial high-magnitude outburst flood. This paper will specifically focus on a bedrock-channelled jökulhlaup. The importance of accounting for downstream attenuation of peak discharge and of including sediment transport and bed mobility or flow-bed interactions will be emphasized. Neither of these properties has previously been addressed in jökulhlaup flow propagation models. Secondly, this paper will examine the association of modelled hydraulics with landforms and sediments produced by that jökulhlaup, as it is these landforms and sediments that have previously been used to infer flow conditions.
Subaerial high-magnitude outburst floods are a sudden release of water and sediment with discharges that are several orders of magnitude greater than perennial flows (Reference Costa, Baker, Kochel and PattonCosta, 1988; Reference Costa and SchusterCosta and Schuster, 1988; Reference Clague and EvansClague and Evans, 2000). Two common types of subaerial high-magnitude flood are jökulhlaups and lahars. The former are outburst floods associated with a glacial source, and the latter are outburst floods that specifically comprise volcaniclastic sediment. With coincidence of glaciers and volcanoes, jökulhlaups and lahars become indistinct from each other, since both comprise glacially derived meltwater and volcaniclastic sediment. However, on the basis of sediment concentration, the term jökulhlaup typically becomes reserved for fluid flows and the term lahar for mass slurry flows or granular flows. This terminology rather simplifies these high-magnitude flood phenomena, as sediment concentrations are highly transient within a single event. For example, jökulhlaups have been noted to become progressively more fluidal as initially voluminous sediment supply is exhausted (e.g. Reference MarcusMarcus, 1989; Reference MaizelsMaizels, 1993; Reference Russell, Marren, Jones, Tucker and HartRussell and Marren, 1999; Reference Carrivick, Russell, Tweed and TwiggCarrivick and others, 2004b) and some jökulhlaups involve sediment volumes much greater than the transporting water volume (Reference Lliboutry, Arnao, Pautre and SchneiderLliboutry and others, 1977; Reference HaeberliHaeberli, 1983). Initially fluid lahars can become bulked by rapid sediment entrainment (Reference Cronin, Hodgson, Neall, Palmer and LecointreCronin and others, 1997; Reference Scott, Macías, Naranjo, Rodriguez and McGeehinScott and others, 2001; Reference Lavigne and ThouretLavigne and Thouret, 2003).
Jökulhlaups and lahars are far too sudden, powerful, remote and short-lived for direct measurements of flow characteristics. Consequently, jökulhlaup landforms and sediments have been described, interpreted and classified, thereby developing qualitative conceptual models of jökulhlaup flow dynamics, flow rheology and the control of jökulhlaup magnitude and frequency on proglacial geomorphology and sedimentology (Reference Maizels and RussellMaizels and Russell, 1992; Reference MaizelsMaizels, 1993; Reference MaizelsMaizels, 1997; Reference Rushmer, Russell, Tweed, Knudsen and MarrenRushmer and others, 2002; Reference MarrenMarren, 2005; Reference RushmerRushmer, 2006; Reference RussellRussell and others, 2006). Landforms and sediments of lahars have tended to focus upon site-specific determinations of flood run-out extent, flow volumes and sedimentological inferences of rheology (e.g. Reference Lavigne and ThouretLavigne and Thouret, 2003; Reference Capra, Poblete and AlvaradoCapra and others, 2004; Reference Manville and WhiteManville and White, 2004). Lahar reconstructions from landforms and sediments have primarily been motivated to produce frontal advance timings (e.g. Reference Fagents and BalogaFagents and Baloga, 2005), and magnitude-frequency regimes (e.g. Reference Bursik and ReidBursik and Reid, 2004; Reference Jakob, Bovis and OdenJakob and others, 2005) for hazard planning.
Study Site
Hydraulic reconstructions are made of the largest jökulhlaup to have originated from Kverkfjöll during the Holocene (Reference CarrivickCarrivick, 2005). Kverkfjöll is a glaciated stratovolcano on the northern margin of Vatnajökull (Jöhannesson and Saemundsson, 1989) (Fig. 1). This study site is chosen because Kverkfjallarani (Fig. 1), the northern and proglacial area of the Kverkfjöll Volcanic System (KVS), contains comprehensive field evidence of a high-magnitude jökulhlaup (Reference Carrivick, Russell and TweedCarrivick and others, 2004a, Reference Carrivick, Russell, Tweed and Twiggb; Reference Carrivick and TwiggCarrivick, 2005). Additionally, a high-resolution Digital Elevation Model (DEM) – a 10m horizontal grid with sub-metre vertical accuracy – of Kverkfjallarani exists (Reference Carrivick and TwiggCarrivick and Twigg, 2005), essential for input to hydrodynamic models for the purpose of geomorphological analyses.
Kverkfjöll is located on the northern margin of Vatnajökull, Iceland. Kverkfjallarani is the northern and proglacial area of the Kverkfjöll Volcanic System (KVS).
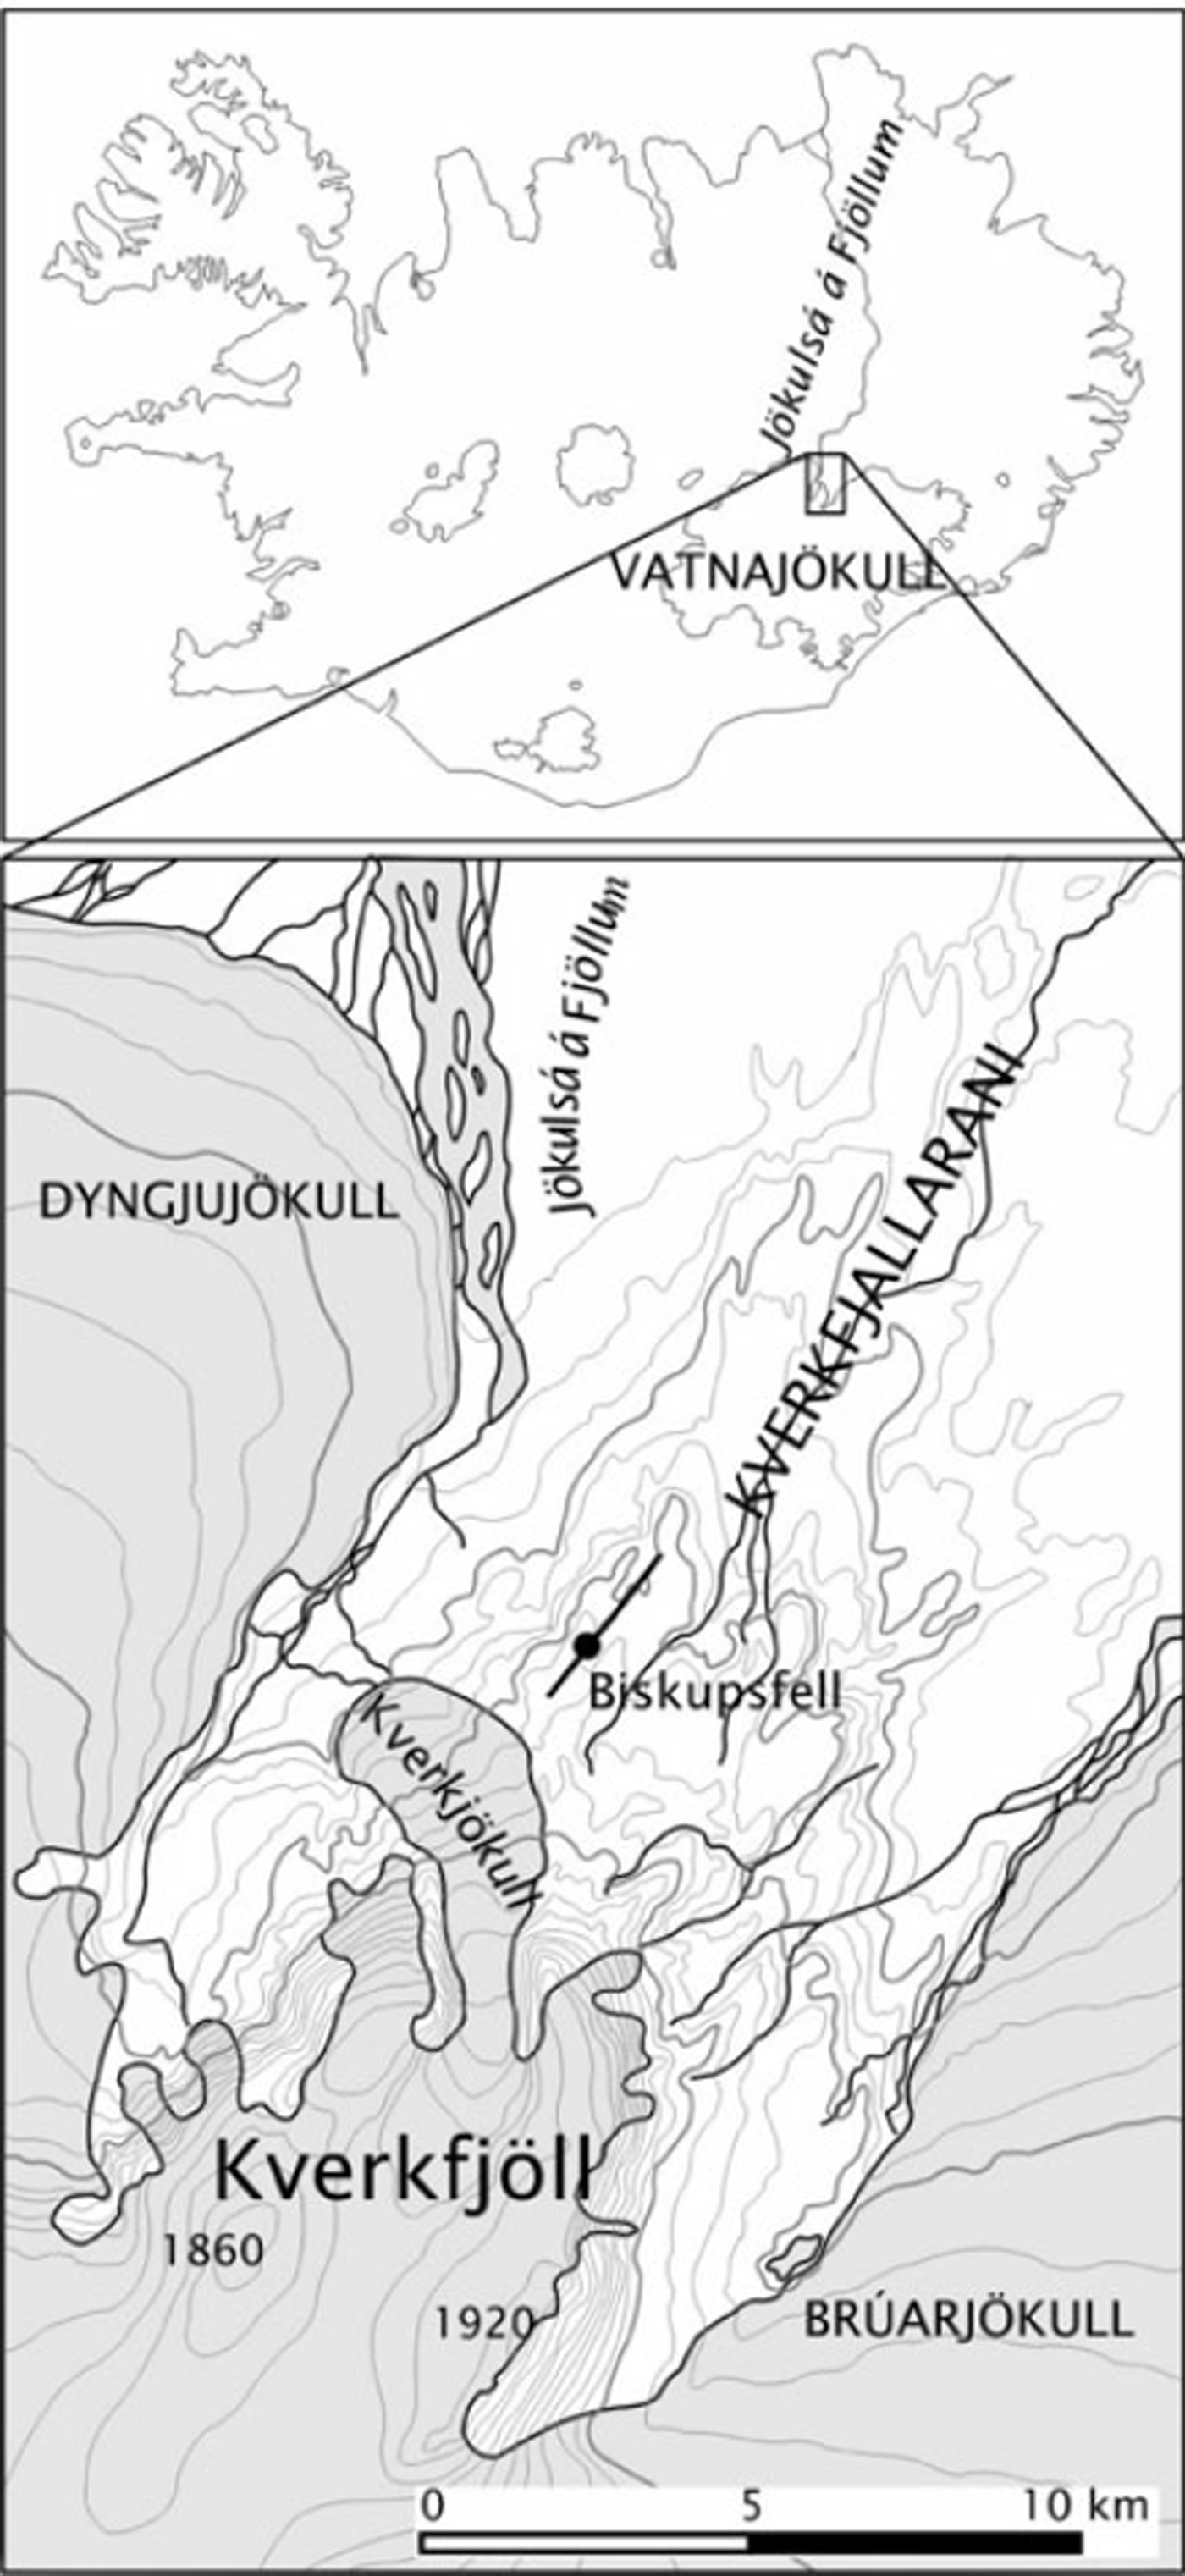
Kverkfjallarani is bounded to the east by the margin of Brúarjökull and the Kreppa river and to the west by Dyngjujökull and the Jökulsá á Fjöllum river (Fig. 1). Kverkfjallarani is dominated by a series of parallel volcanic pillow hyaloclastite ridges, each typically 100m high and several kilometres long (Reference HannessonHannesson, 1953; Reference Jóhannesson and SæmundssonJóhannesson and Sæmundsson, 1989). Holocene jökulhlaups through Kverkfjallarani were bound by these ridges (Reference Carrivick, Russell and TweedCarrivick and others, 2004a). Each ridge marks a fissure that erupted beneath the Weichselian ice sheet (Reference KarhunenKarhunen, 1988; Reference Höskuldsson, Sparks and CarrollHöskuldsson and others, 2006), is heavily weathered and typically supports pillow lava bricks in scree slopes at angles of 30–40˚ (Reference HannessonHannesson, 1953) and up to 458 (Reference BecketBeckett, 1934). Pillow lava bricks result from weathering along radial fractures and are a major sediment source to Kverkfjallarani jökulhlaups (Reference Carrivick, Russell, Tweed and TwiggCarrivick and others, 2004b). Kverkfjallarani also contains extensive subaerial lava flows and crater rows. Lava flows are basaltic and fill valley floors between ridges (Reference BecketBeckett, 1934; Reference KarhunenKarhunen, 1988). Both lava flows and crater rows, which are up to 8 km long (Reference KarhunenKarhunen, 1988), indicate that eruptions have occurred within Kverkfjallarani during the Holocene, mostly (but not exclusively) from the Biskupsfell fissure. Subaerial lava flows are a source of massive 1–2m blocks to Kverkfjallarani jökulhlaups (Reference Carrivick, Russell, Tweed and TwiggCarrivick and others, 2004b).
Method
Quantitative models of jökulhlaups and other large floods utilize engineering fluid dynamics programs. The most widely used of these are the one-dimensional Hydraulic Engineering Centre HEC-2 and its successor HEC-RAS, particularly the latter as it has a graphical user interface and is GIS-based. With increases in computational power, two-dimensional depth-averaged numerical models have been used to reconstruct both unconfined Iceland jökulhlaup flows (Reference Eskilsson, Árnason and RosbjergEskilsson and others, 2002) and confined Missoula flows (Reference Denlinger, O’Connell, Ely, O’Connor and HouseDenlinger and O’Connell, 2003). These models use a source hydrograph to initiate the cellular routing of floodwater over a DEM. Two-dimensional modelling therefore offers greater resolution for studies of transient hydrodynamics and rapid landscape change due to high-magnitude outburst floods such as jökulhlaups. Hydraulic calculations independent of landforms preserved within flood routeways can be completed, allowing both spatial and temporal variations of hydraulics to be considered. Reference Carrivick and RushmerCarrivick and Rushmer (2006) provide a succinct review of both qualitative and quantitative palaeohydraulic methods.
Quantitative lahar modelling has been much more limited than for jökulhlaups, as physical equations of debris flows and sediment-laden flows rely on scaled flume experiments and particle debris flow theory (e.g. Reference MajorMajor, 2000; Reference Denlinger and IversonDenlinger and Iverson, 2001; Reference Iverson and DenlingerIverson and Denlinger, 2001; Reference Iverson and VallanceIverson and Vallance, 2001). Consequently, quantitative lahar modelling has been primarily interested in runout extent (e.g. Reference Canuti, Casagli, Catani and FalorniCanuti and others, 2002; Reference Stevens, Manville and HerronStevens and others, 2003). Reference Iverson, Schilling and VallanceIverson and others (1998) used scaling and statistical analyses of 27 lahar paths at 9 volcanoes to predict inundated valley sections and areas as functions of the lahar volume.
The model used in this paper is Delft3D, from WI Delft-Hydraulics (http://www.wldelft.nl/soft/d3d/intro/). Delft3D is a graphically interfaced hydrodynamic model that routes a user-specified hydrograph over an orthogonal grid (Fig. 2). Grid nodes specify bathymetric depth points and surface attributes such as roughness and sediment character. The orthogonal grid is defined by manually describing splines, which then become converted to a grid that is then refined in the x and y directions to a desired resolution (Fig. 2). An orthogonal grid therefore permits areas of interest to be modelled at high spatial resolution (1 m) and other areas to be modelled coarsely (10–100m grid node spacing). Bathymetric depth points were processed from the DEM of Reference Carrivick and TwiggCarrivick and Twigg (2005) and surface attributes were obtained from extensive field measurements (Reference Carrivick and TwiggCarrivick, 2005). Delft3D is used because it is numerically stable for conditions of unsteady flows (including steep terrain), kinematic waves, wetting and drying and because it couples sediment transport with hydrodynamics. The full St-Venant hydrodynamic equations, as used by the model, are described by Reference Sleigh and GoodwillSleigh and Goodwill (2000). Bed load transport is modelled using the equations of Reference Meyer-Peter and MüllerMeyer-Peter and Müller (1948) and suspended transport according to Reference Van RijnVan Rijn (1984). Sediment transport is modelled for clasts up to 200 mm diameter, which is an order of magnitude greater than for which the Reference Meyer-Peter and MüllerMeyer-Peter and Müller (1948) equations were derived. Clasts greater than 200mm and of up to 2000mm diameter as observed in the field (Reference Carrivick, Russell and TweedCarrivick and others, 2004a, Reference Carrivick, Russell, Tweed and Twiggb) are therefore not modelled. The hydrograph used in this study (Fig. 2) is fully explained by Reference Carrivick and TwiggCarrivick (2005) and is reconstructed from field evidence of water surface elevations that, through slope-area calculations, suggest a peak discharge of ∽100 000 m3 s–1. The magnitude of this peak discharge implies a water volume in excess of the volume of a Kverkfjöll caldera, if conduit expansion by melting is assumed using the Reference Clague and MathewsClague–Matthews (1973) relationship (Reference CarrivickCarrivick, 2005, Reference Carrivick and Rushmer2006). However, this peak discharge estimate can be accounted for if a volcanic trigger is invoked (Reference Carrivick and TwiggCarrivick, 2005, Reference Carrivick and Rushmer2006). The jökulhlaup reconstructed in this paper is therefore assumed to have a ‘rapid rise to peak’ shape. For model runs in this paper, sediment was not input to the system but was specified to be preexisting with a uniform depth of 20m split into size fractions (Fig. 2). Sediment depths and size fractions are as recorded by Reference Carrivick, Russell and TweedCarrivick and others (2004a, Reference Carrivick, Russell, Tweed and Twiggb).
Diagram of model input, illustrating bathymetric depth derived from a Digital Elevation Model (DEM) and computational orthogonal grid with a shape specified by user-defined splines. Flood input hydrograph and typical sediment fractions are also given. Sediment can be input with the hydrograph and pre-exist along the channel. Area of field evidence is after Reference Carrivick, Russell and TweedCarrivick and others (2004a).
The model calculates incremental grids or ‘maps’ of flow depth, flow velocity and the net gain/loss of sediment within each grid cell. It is noted for clarification that the Delft3D model is a coupled hydraulic sediment transport model and computes mass changes in pre-existing sediment per grid cell. Feedbacks between sediment entrainment and flow hydraulics are therefore accounted for, although bed elevation change at each grid node was not computed in these model runs. Furthermore, the grid geometry does not change. It should also be noted that bathymetry, or bed elevation, is derived from post-flood topographic surveys. Specific points of interest are recorded at observation stations (Fig. 2) where hydraulic and sediment parameters are written to file. Furthermore, all results presented in this paper are from a single layer grid. They are therefore two-dimensional or depth-averaged models runs.
Mapping and interpretation of jökulhlaup impacts and hence of flow routeways through Kverkfjallarani was initially made from 1: 30 000 aerial photographs. Extensive fieldwork was undertaken during the summers of 2000–2002 and comprised topographic surveys of palaeochannel (valley) cross-sections and field mapping of subaerial lava flows and jökulhlaup landforms. Remotely sensed and field data therefore characterized geomorphology, identified jökulhlaup routeways and interpreted characteristics of those jökulhlaups from this evidence. A set of criteria was developed to distinguish landforms that are the product of bedrock-channelled jökulhlaups from landforms that are the products of other processes (Reference Carrivick, Russell and TweedCarrivick and others, 2004a).
In order to analyze geomorphic work or flow hydraulics associated with different landforms, 53 separate landforms and different sedimentary surfaces within Kverkfjallarani jökulhlaup routeways (Fig. 3) were mapped into a GIS. Between 5 and 10 examples of each landform type were identified and analyzed (Fig. 3). Hydraulic maps were output from the model at regular time stages after flood initiation and also for maximum, minimum and mean hydraulics per grid cell. These hydraulic maps were also imported into the GIS and hence hydraulics described for each landform group.
Field-mapped landforms attributed to high-magnitude outburst floods in Kverkfjallarani.

Results
Geomorphological and sedimentological evidence of jökulhlaups from Kverkfjöll has been described in detail by Reference Carrivick, Russell and TweedCarrivick and others (2004a, Reference Carrivick, Russell, Tweed and Twiggb respectively) and peak flow hydraulics have been reconstructed by means of palaeocompetence and slope-area reconstructions (Reference Carrivick and TwiggCarrivick, 2005, Reference Carrivick and Rushmer2006). Hydrodynamic reconstructions in this paper will therefore emphasize spatial and temporal variations in hydraulics and sediment transport.
Spatial and temporal variation in jökulhlaup hydraulics and sediment transport
The 25 km long Hraundalur valley became inundated within ∽3 hours (Fig. 4). Mean frontal velocity was ∽2.3ms–1, although this varied with a much slower frontal velocity upslope of the major channel construction. Since channel geometry is fixed, water stage is a proxy for discharge, and this attenuated very rapidly downstream (Fig. 5). It is interesting to note that the rate of rise to peak stage is generally consistent between sites and coincident with the timing of peak discharge (Fig. 2), but that the magnitude of peak stage and subsequent stage recession rates vary considerably (Fig. 5). Peak stage magnitude generally decreases and peak stage duration generally increases with distance downstream. However, a few exceptions occur where hydraulic ponding causes a prolonged peak stage and in zones of narrow channel width where the hydrograph becomes very flashy (Fig. 5).
Schematic illustration of the time to inundation by glacial outburst floods (jökulhlaups) from Kverkfjöll of the Kverkfjallarani bedrock landscape. The main northeast-trending valley is Hraundalur. Floods routing northwest were of a lower discharge and of slower frontal velocity than the Hraundalur example.

Spatial and temporal variation in relative water depth (m) of a 100 000m3 s–1 jökulhlaup routing along Hraundalur, Kverkfjallarani. Note prolonged peak stage in areas of hydraulic ponding, and general downstream attenuation. This model run considers 100% water flow. x scale is time (hours) since flood initiation. Note y scale (m) varies between graphs.

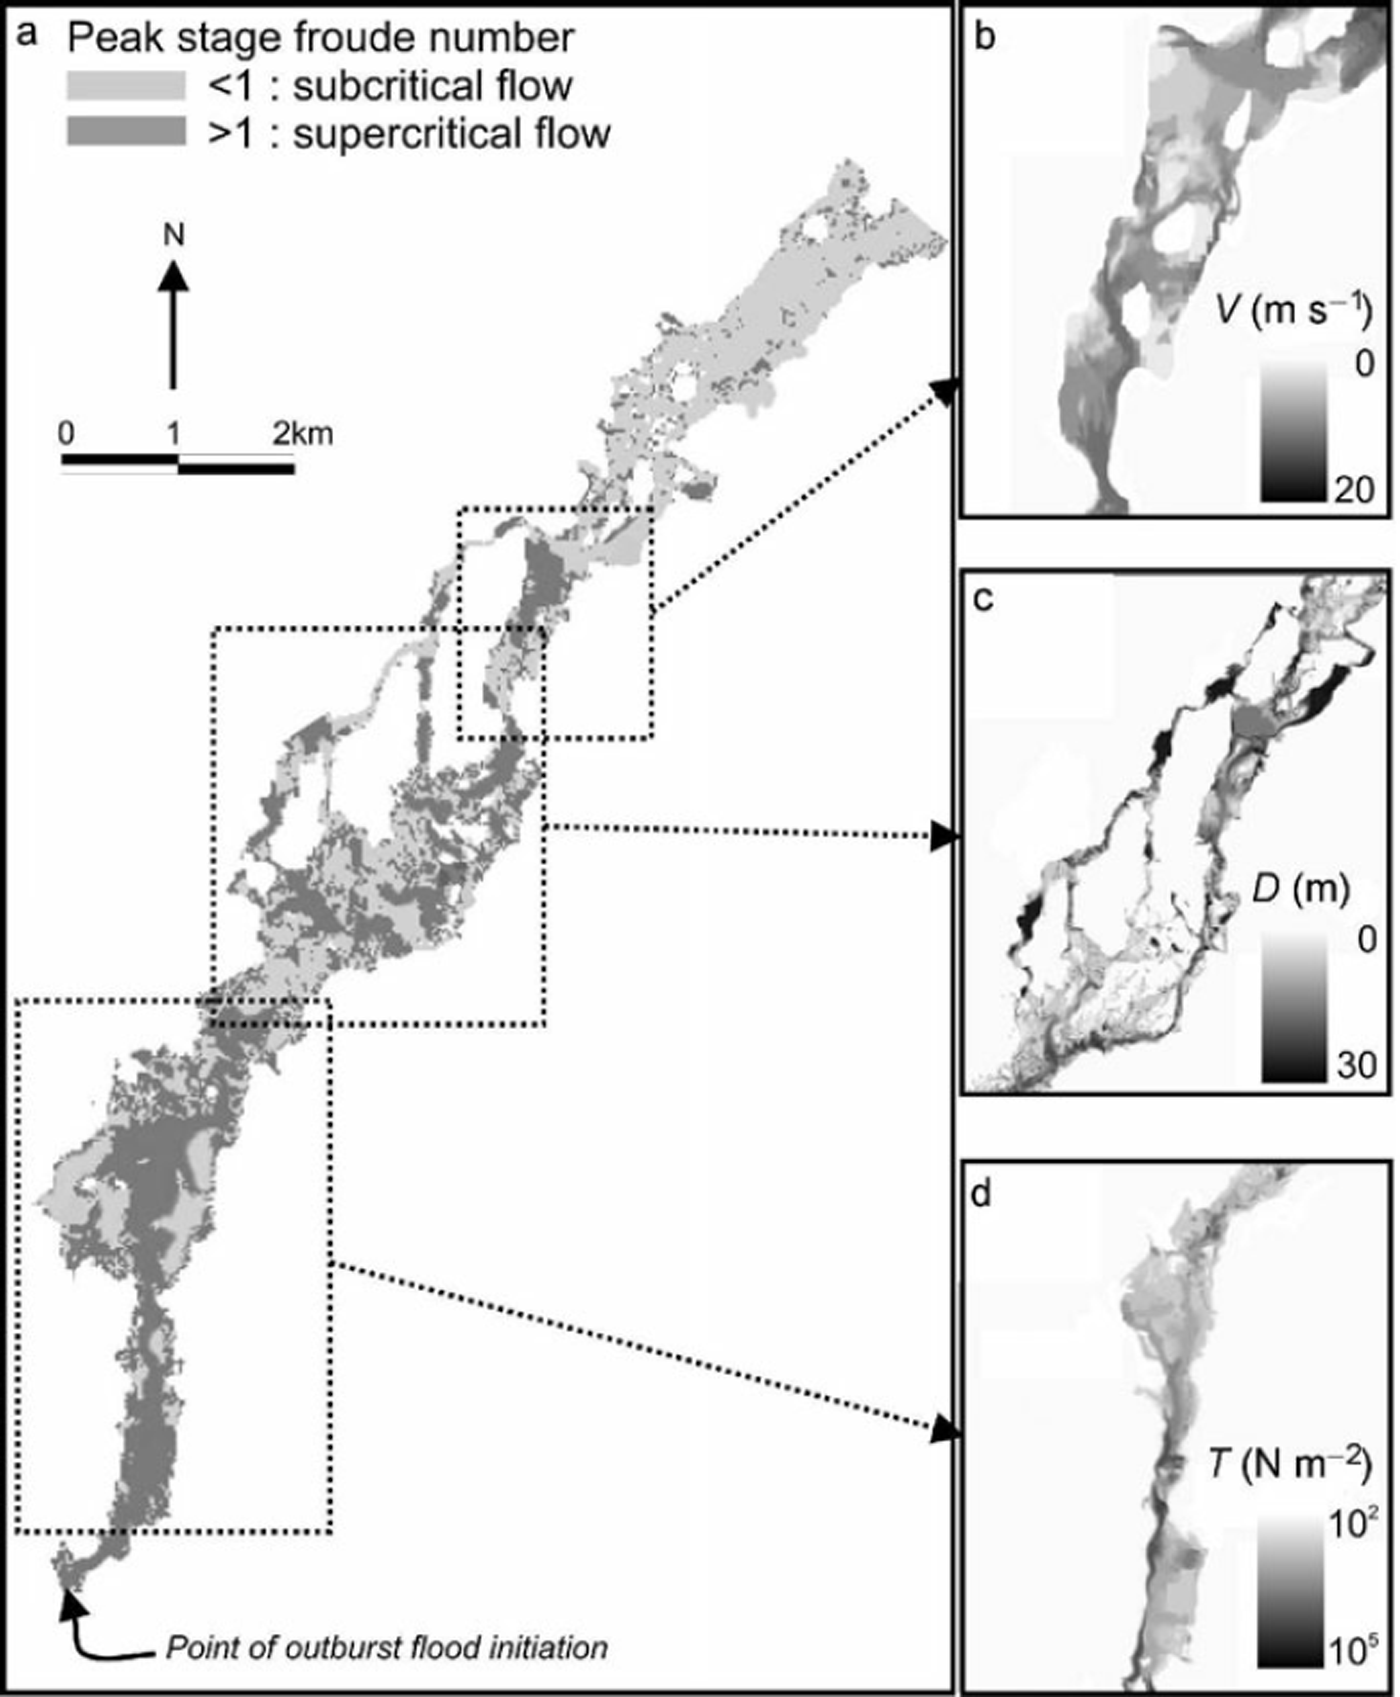
At peak stage (after 2 hours), supercritical flow predominated in proximal reaches, was intermittent in medial reaches, and generally absent from distal reaches (Fig. 6a). On the rising stage, after 1.5 hours, a number of high-magnitude flow phenomena can be described. These include: mid-valley islands causing flow acceleration and a meandering thalweg (Fig. 6b); temporary hydraulic ponding where flow spills over low divides between mid-channel islands and where valley constrictions dramatically reduce channel widths (Fig. 6c); and very steep water surface gradients between flow depths upstream of a severe construction that are up to an order of magnitude greater than flow depths immediately downstream (Fig. 6c). Inundation of tributary valleys and other backwater sites therefore largely depends on flow depth. The rapidly varied nature of flow conditions is further illustrated by the contrast between over-bank and backwater flow shear stress (Fig. 6d).
Examples of 2D hydrodynamic model output and GIS-based calculations of (a) flow regime at peak stage after 2 hours, (b) flow velocity after 1 hr 30 min, (c) flow depth at peak stage and (d) shear stress after 1 hour. Note that diagrams do not necessarily pertain to the same model run, nor to the same hydrograph stage.
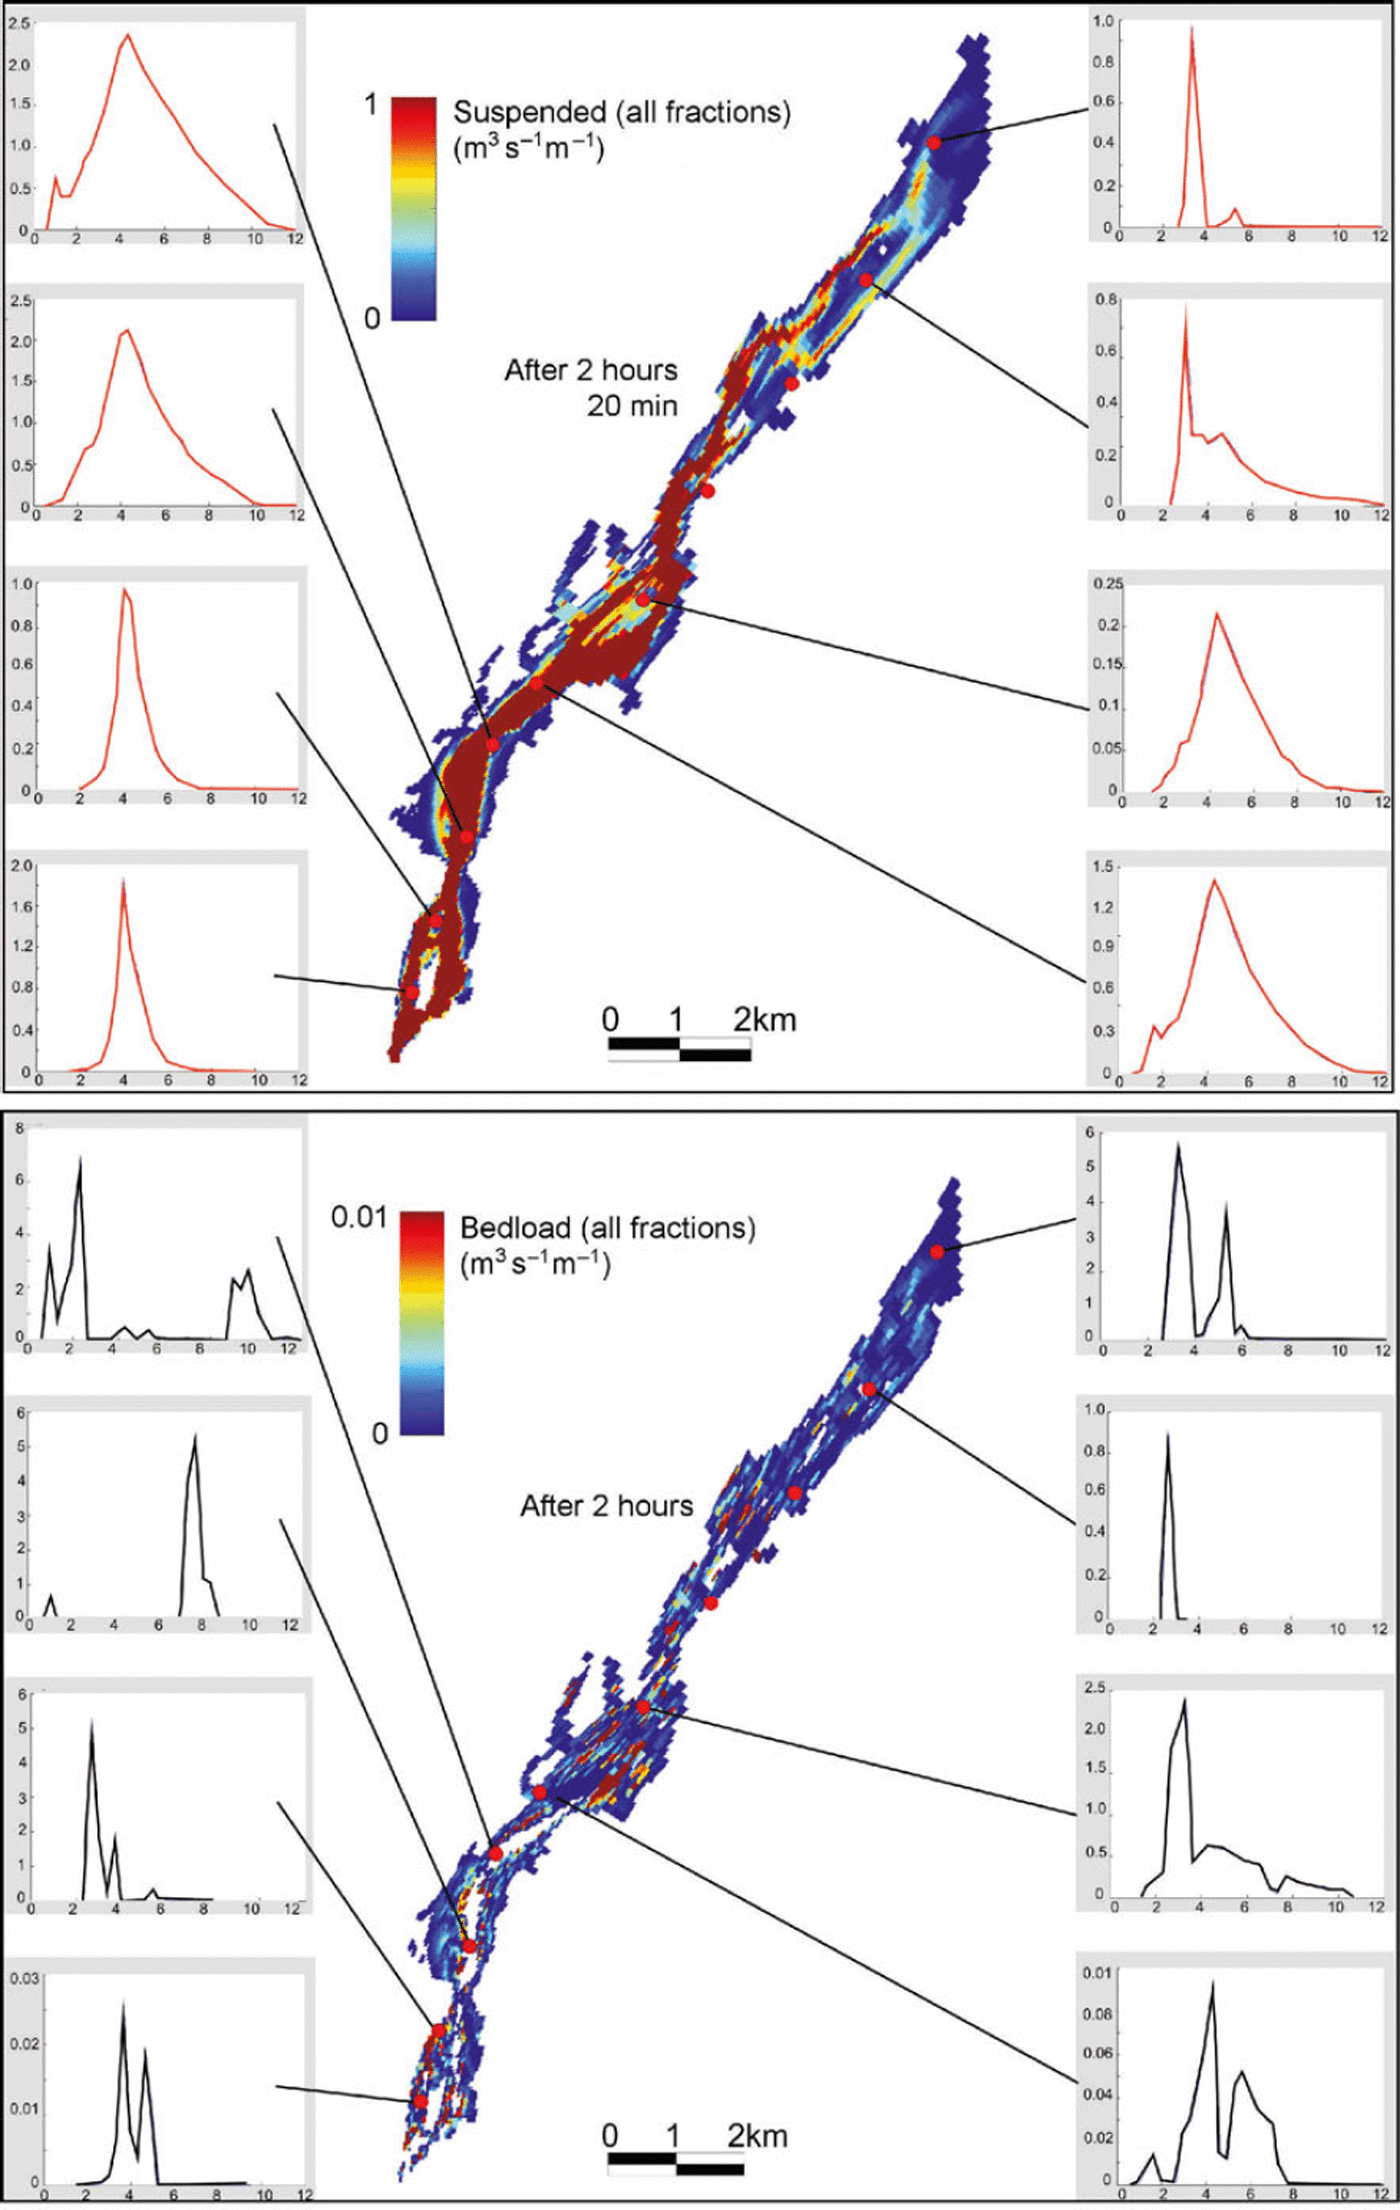
Sediment transport comprised suspended load and bed load, and is discriminated by the calibre of material entrained at a given shear stress. Suspended load, which in the Hraundalur jökulhlaup comprised volcaniclastic scoria, spatter, pumice, tuff fragments and pillow lava blocks (Reference Carrivick, Russell, Tweed and TwiggCarrivick and others, 2004b), persists over the duration of the flood hydrograph within both relatively deep and shallow flows (Fig. 7). While suspended load transport was sustained in the upper reaches of Hraundalur, it became discontinuous in the lower reaches due to a dissipation of flow energy. In contrast, bed load transport was highly variable in space and time and occurred only in the relatively deep main channel (Fig. 7). Additionally, bed load transport featured pulses and become rapidly exhausted after peak discharge. Net sediment gain and loss per grid cell was modelled as a mass change and infers erosion or deposition. Note that bed elevation change was not modelled. Mass changes in sediment were predominantly negative, i.e. erosional, except for within hydraulically ponded zones and marginal embayments (Fig. 8). Some mid-channel deposition occurred immediately downstream of islands (Fig. 8).
Spatial and temporal variation in suspended load and bed load. The total of all sediment fractions is presented only. Note that suspended load persists in phase with the water hydrograph, but bed load is extremely transient and exhibits pulses. x scale is time (hours) since flood initiation. Note y scale (m) varies between graphs.
Net gain and loss of pre-existing sediment, i.e. erosion and deposition, after 1, 3 and 5 hours. Each grid cell initially contained a total mass of 8000 kg of sediment of uniform depth.

Association of modelled hydraulics with field-mapped landforms and sediments
Ranges of hydraulic parameters can be defined for each landform type, in a manner similar to that presented by Reference O’ConnorO’Connor (1993) and Reference Benito and O’ConnorBenito and O’Connor (2003) for the Bonneville and Missoula megafloods, for example. Figure 9 clearly show that erosional landforms are associated with much higher flow depths, flow velocities, shear stresses and stream powers than depositional landforms. These ranges define both maximum and minimum thresholds of hydraulic parameters within which landform types are located. It is clear that there is no unique range of hydraulics associated with particular landform type, i.e. many of the ranges overlap (Fig. 9). Indeed, depositional and erosional ranges also overlap. This is because of the transient nature of hydraulic parameters, particularly due to turbulence and the development of spatially discordant supercritical flow.
Conceptual diagram illustrating a quantitative hierarchy of landforms based on a range of hydraulic conditions associated with each landform type. Landforms are arranged from those associated with deeper, faster and more powerful flows to those associated with shallower, slower and less energetic flows. The hierarchy is thus gorges, scoured bedrock, cataracts, valley-fill deposits, bars and terraces, and slackwaters. Data points and ranges are displayed for maximum values recorded in that landform area.
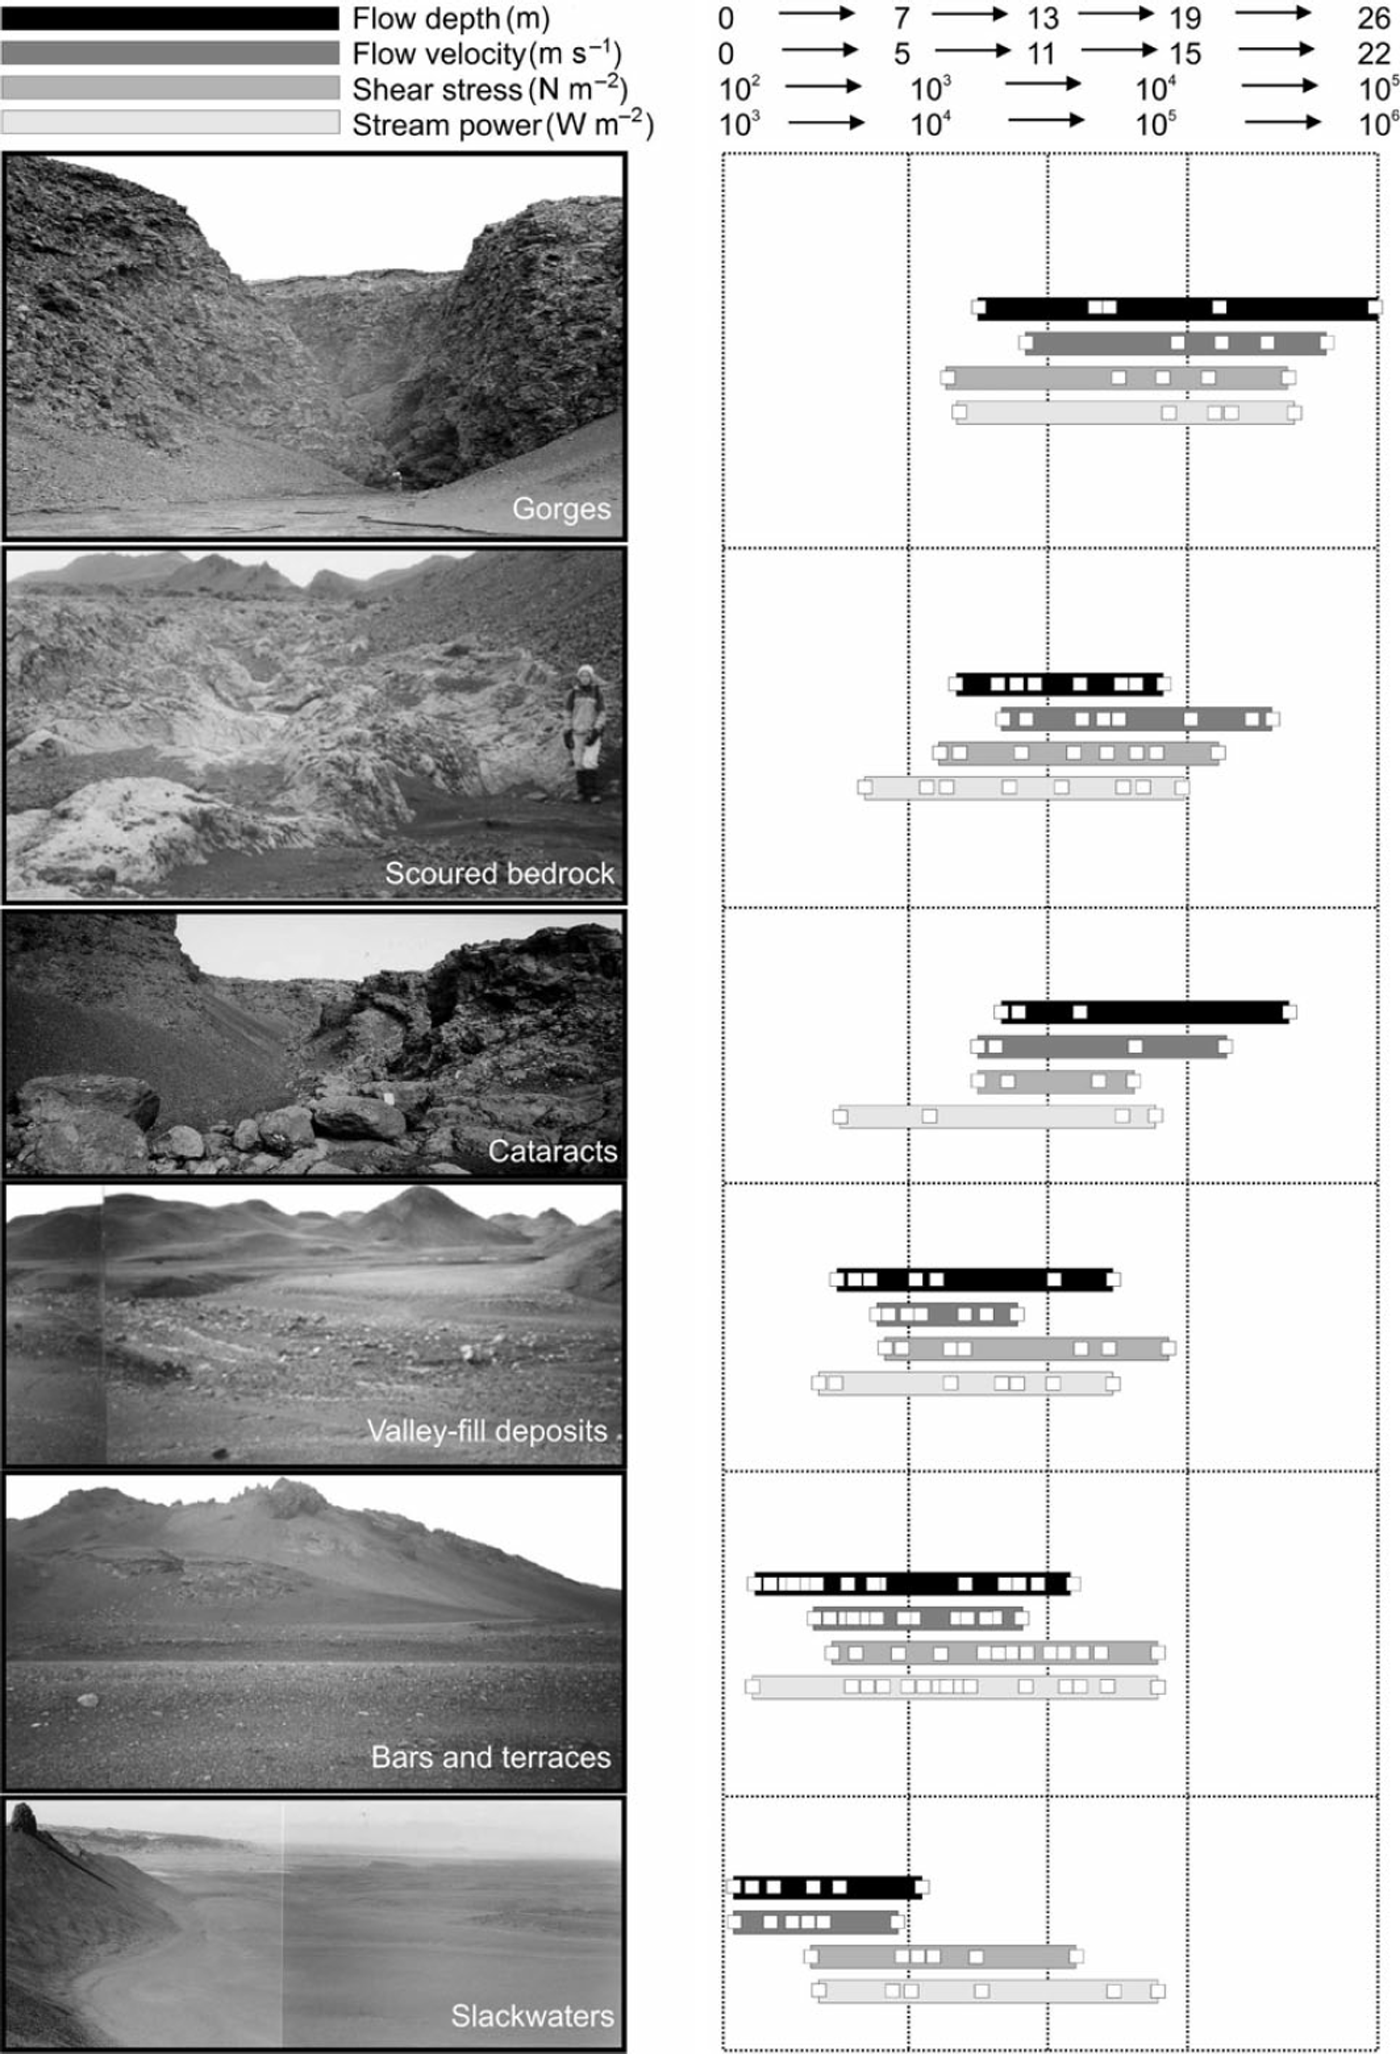
Landform group hydraulics allows a quantitative hierarchy of landforms to be proposed. This hierarchy is ordered from landforms situated in zones of deep, fast and high-energy flow to landforms situated in shallow, slow and low-energy flow. Gorges are at the top of this hierarchy and are characterized by mean shear stresses and stream powers of 100–3400Nm–2 and 3500–20 000 Wm–2 respectively (Fig. 9). Scoured bedrock surfaces extend over a far greater spatial area than gorges, which of course are linear features, but exhibit rather more stable flows as illustrated by smaller ranges and lower standard deviations of depths, velocities, shear stresses and stream powers (Fig. 9). Stream powers associated with scoured bedrock surfaces are 300– 18 500Wm–2, and thus approach maximum values associated with gorges. Cataracts occur where hydraulic conditions are similar though less varied in comparison to scoured bedrock surfaces. This is because cataracts are localized down-cuts into bedrock, and therefore flow will always be accelerating through these zones. Consequently, flow depths within cataract zones range from just 4.0–7.5m over cataracts in comparison to 3–11.3m on scoured bedrock (Fig. 9). A further factor to explain the range of flow depths associated with scoured bedrock zones is that some probably experience hydraulic ponding. Spillways, which are not show in Figure 9, are similar to cataracts but overtop topographic divides. Flow depths and velocities have low variance within spillway zones, with mean values varying from 5 mand 10 ms–1, respectively. Shear stresses and stream powers associated with spillways are low, with mean values of 200–500Nm–2 and 310–830Wm–2 respectively. Channel reaches with valley-fill deposits are associated with a range of flow depths that are similar to those of scoured bedrock zones. This is again attributed to the fact that valley-fill surfaces occur within the main channel and are therefore subjected to main flow hydraulics, which include both rising and falling stages of a flood hydrograph. However, in contrast to scoured bedrock reaches, valley-fill zones are located in reaches of shallow gradient. They have flow velocities of 6–11ms–1, which are much less and of a tighter range than the flow velocities of 7–16ms–1 of scoured bedrock zones
(Fig. 9). Shear stresses of valley fill zones are low, with mean values ranging from 140–450Nm–2. The importance of whether reach-scale flow is accelerating or decelerating, as determined primarily by gradient in the absence of topographic widening or narrowing, is therefore again highlighted. Slackwater deposits are characterized by maximum flow depths < 8m and maximum flow velocities of < 4ms–1 (Fig. 9). However, mean flow depths and mean flow velocities in slackwater areas are < 2m and < 2ms–1 respectively. Thus, calculations of flow depths and flow velocities between different slackwater zones have a low standard deviation (1.25 and 0.5 respectively), illustrating relatively similar flow conditions at all locations. Mean shear stresses and mean stream powers within slackwater locations are less than 100 Nm–2 and 4000Wm–2 respectively, although some values recorded are at least an order of magnitude greater (Fig. 9). Nonetheless, shear stress and stream powers within individual slackwater zones have a low range, implying spatially homogenous flow conditions at a particular site. Slackwater zones therefore have lowest flow depths, lowest flow velocities and lowest shear stresses and stream powers of any landform class (Fig. 9). Slackwater zones thus fall at the bottom of the proposed hierarchy.
Interpretation and Discussion
This section will proceed through the same themes as above, i.e. firstly examining the spatial and temporal variation in hydraulics and sediment transport, and secondly discussing the association of modelled hydraulics with landforms and sediments.
Spatial and temporal variation in jökulhlaup hydraulics and sediment transport
The large difference between frontal flow velocity (Fig. 4) and main body velocity is attributed to the relative decrease of form roughness with increasing discharge and hence greater flow depths. Main body velocity became faster and at peak stage, highly varied, as characterized by frequent hydraulic jumps between subcritical and supercritical flow regimes (Fig. 6a). The transition between the two regimes would have been a zone of turbulence, high-pressure and potential for high-magnitude fluvial phenomena such as cavitation and plucking (Reference Whipple and HancockWhipple and others, 2000). These zones have been attributed to the production of, for example, cataracts, gorges and bedrock steps (e.g. Reference Carrivick, Russell and TweedCarrivick and others, 2004a; Reference Carrivick and TwiggCarrivick, 2005), but precise mechanisms and hydraulic parameters of bedrock erosion remain unquantified. Supercritical flow predominates in narrow, steep channels and subcritical flow in wide, shallow reaches (Fig. 6a). However, supercritical flow also persists at some channel margins and around islands (Fig. 6a). Supercritical flow zones at channel margins in Kverkfjallarani correspond to a gap between valley floor lava flows and valley walls (Reference Carrivick, Russell and TweedCarrivick and others, 2004a), and in all cases reflect localized flow acceleration.
Peak discharge through Kverkfjallarani apparently attenuated very rapidly, due to high channel roughness where Manning’s n ∽ 0:05–0.1m1/3 (Reference Carrivick, Russell, Tweed and TwiggCarrivick and others, 2004b). High roughness is a result of flow depths of the order of the height of form elements, in this case 1–2 m. Longitudinal energy losses were also caused by recirculation of water in backwater areas. Some of these backwaters are marginal to the main channel, for example, within tributary valley mouths (Fig. 6b), but others are caused by temporary hydraulic ponding upslope of topographic constrictions between mid-valley islands. Mid-valley islands thus caused flow acceleration, which would exacerbate streamlining processes and lateral variations in erosional capability.
Main channel flows remain relatively stable, despite rising stage, because backwaters accommodate water mass and thus help dissipate flow energy and to attenuate main channel discharge. Backwaters can also develop a surging flow, as flow laps over-bank in successive waves (Fig. 6d). Waves may also be produced from upstream ponding, as continued discharge periodically causes overtopping of shallow topography. Temporary hydraulic ponding in Kverkfjallarani could have been responsible for the deposition of valley-fill sediments (Reference Carrivick, Russell and TweedCarrivick and others, 2004a, Reference Carrivick, Russell, Tweed and Twiggb) and for longitudinal transitions between erosional and depositional zones (Carrivick, 2005). If ponding leaves palaeostage indicators (PSIs), flood reconstructions using PSIs could erroneously calculate flood hydraulics by assuming that those PSIs relate to channel flow. For example, boulder run-ups are common along Hraundalur (Reference Carrivick, Russell, Tweed and TwiggCarrivick and others, 2004b).
Suspended load comprised highly friable volcaniclastic material (Reference Carrivick, Russell and TweedCarrivick and others, 2004a, Reference Carrivick, Russell, Tweed and Twiggb), which is a feature shared by dilute lahars. This material is of relatively low density and therefore, for given clast sizes, becomes much more readily entrained than non-volcaniclastic material. Flows may thus approach hyperconcentrated rheology (∽20% sediment by volume), and suspended load transport persists over the entire hydrograph (Fig. 7). In contrast, bed load comprises 1–2m basalt boulders plucked from subaerial lava, and hyaloclastite conglomerates (Carrivick and others, 2004b). Bed load therefore ensues only after a critical entrainment threshold has been reached, but also only where a suitable supply of sediment exists. Modelled bed load appears discontinuous, in pulses and is exhausted (Fig. 7) due to transient hydraulic conditions, as described above, but also because sediment was supply-limited, both in terms of volume and calibre.
Sedimentary character therefore exerts a strong control on the hydraulics of bedrock jökulhlaups, with feedbacks between sediment entrainment, flow density, flow hydraulics, particularly bed shear stress and thus capacity for erosion. The largest Hraundalur jökulhlaup was predominantly erosional (Fig. 8). Disparate deposition occurs marginally, in association with embayment and tributary mouths, laterally as bars and terraces and within the main channel in association with topographic islands and zones of hydraulically ponded water (Fig. 8). It is suggested that deposition could occur within a channel if flow velocity is decreasing, even if absolute velocity at a point within that channel section is sufficient for transport. Therefore it is rather important for landscape change to know if flow is accelerating or decelerating through a given reach, rather than just to calculate point measurements of flow velocity. It is an important output of this paper that the modelled net gains and losses of sediment (Fig. 8) closely resemble field-mapped erosional and depositional landforms (Fig. 3), demonstrating the ability of this model to simulate rapid landscape change due to high-magnitude outburst floods.
Kverkfjöll jökulhlaups produce landforms and sediments analogous to those ascribed to the Missoula, Bonneville and Altai megafloods (Reference Carrivick, Russell and TweedCarrivick and others, 2004a, Reference Carrivick, Russell, Tweed and Twiggb, Reference Carrivick and Twigg2005). A comparison of the Hraundalur jökulhlaup hydraulics with those of the Missoula, Bonneville and Altai megafloods is given by Reference Carrivick and RushmerCarrivick (2006) and therefore is not repeated here. Rather, this paper will compare modelled Hraundalur jökulhlaup hydraulics with mapped landforms and sediments in Hraundalur, Kverkfjallarani.
Association of modelled hydraulics with field-mapped landforms and sediments
Figure 9 illustrates that a wide range of flow conditions are experienced in areas of erosional landforms, specifically gorges, scoured bedrock and cataracts. This is suggested as erosional landforms are situated within a main channel and become inundated throughout the whole duration of an outburst flood. Therefore, both high and low stage flows inundate main channel and erosional zones, giving a far greater variability in all hydraulic parameters than depositional zones, specifically valley-fill areas, bars and terraces and slackwaters (Fig. 9). In contrast, areas marginal to a main channel such as bedrock alcoves and tributary valley mouths only become inundated at high stage and with relatively low flow depths. Flow velocities are also lower in marginal areas, being well aside from the thalweg. More complex analysis of hydraulic output is required to ascribe hydrograph stage to landform generation, but some indication can be given by the maximum values recorded for each landform type. Maximum values are 1–2 orders of magnitude greater for erosional landforms than depositional landforms (Fig. 9).
By describing a hierarchy of landforms, it is suggested that a landform evolution persists due to high-magnitude outburst floods with increasing flow erosion, and thus with increasing flow energy. The exact magnitude of this flow energy is dependant upon routeway geology. In Kverkfjallarani, landform evolution due to high-magnitude outburst floods is dominated by erosion (Fig. 8), i.e. with incision and relief exaggeration, the ultimate expression of which is gorges (Fig. 9). However, all of the eroded material must end up somewhere, and the apparent disproportionate areas of deposition imply that the majority of sediment is simply flushed out of the system, beyond the mouth of Hraundalur. This has important implications for sediment delivery during periods of deglaciation (when glacier instability and meltwater production are heightened, and volcanic activity is stimulated by rapid ice-unloading) to the north-central area of Iceland, and indeed to the north coast of Iceland.
Summary and Conclusions
This paper illustrates the advantages and new knowledge gained from coupled modelling of hydraulics and sediment transport in high-magnitude (fluid-flow) floods with high sediment content, such as jökulhlaups and dilute lahars. The example given demonstrates that a bedrock channelled subaerial jökulhlaup can be characterized by a highly varied flow regime. Jökulhlaup flow routing was dramatically controlled by topography, which caused channel avulsions and flow splitting around islands. Islands also caused hydraulic ponding as discharge rose more rapidly than could be transmitted downstream. Locally high and sustained peak water surface elevations are therefore observed. Topographic irregularity was partly responsible for downstream attenuation of peak discharge through high transmission losses as marginal flow inundated and backed up tributary valley mouths and recirculated within large embayments. Energy losses are also accounted for through sediment transport, which produced a largely erosional channel system. Model results suggest that suspended load transport occurred directly in phase with the discharge hydrograph, but that bed load transport was transient in space and time. Bed load transport was limited to the main channel, close to the thalweg and rapidly became limited by supply. Field observations not presented in this paper suggest that sediment to jökulhlaups from Kverkfjöll was also calibre limited (Reference Carrivick, Russell, Tweed and TwiggCarrivick and others, 2004b). It can be concluded that due to the distinct topographic, geological (sediment supply) control, these flow characteristics are typical of outburst floods that are volcanically triggered, route through steep volcanic terrain and contain high concentrations of volcaniclastic sediment.
Comparison of modelled hydrodynamics and field-observed landforms permits a hierarchy of landforms produced by high-magnitude outburst floods to be proposed. These range from those associated with highest energy zones (erosional gorges, scoured bedrock, cataracts and spillways) to depositional and lowest energy zones (valley-fills, bars and slackwater deposits). The thresholds above which bedrock fluvial erosion can occur in Kverkfjallarani are ∽3m flow depth, ∽7ms–1 flow velocity, ∽1×10²Nm–2 shear stress and 3 ×10²Wm–2 stream power. Fluvial deposition can occur in Kverkfjallarani below the thresholds of ∽8m flow depth, 11 ms–1 flow velocity, 5×10²Nm–2 shear stress and 3 ×10³Wm–2 stream power. These conditions are likely to be determined in part by the highly brecciated and fissile nature of pillow lava, which thus becomes dislodged and transported relatively easily. Pillow lava therefore readily becomes incised to form deep gorges. In contrast, subaerial lava comprising massive basalt with large (>1 m) spacing of vertical joints, is preferentially plucked to form steps and headcuts or cataracts as well as areally extensive scoured bedrock surface.
Finally, the model presented in this paper produced a distributed net change in sediment mass that closely resembled field-mapped zones of erosion and deposition. The method therefore has a clear capability to simulate rapid landscape change due to a high-magnitude outburst flood.
Acknowledgements
The Icelandic Research Council and the Nature Conservation Agency gave permission to undertake research in Iceland. Grants from the BGRG, IAS and QRA are acknowledged. WI Delft Hydraulics granted two years use of the SOBEK model for academic research. D. Twigg of Loughborough University produced the DEM. The Earthwatch Institute funded fieldwork during the summers of 2001– 2003. Thank you to all of the 2001–2003 Earthwatch Team IV volunteers and to O. Lowe, H. Deeming and L. Rushmer for invaluable and excellent field assistance. Sira, Loftur, Edda and Elisabet made us very welcome at Sigurdarskali. A. Russell and F. Tweed are thanked for their continued advice. Reviews by V. Baker and J. O’Connor substantially improved this paper.


