


INTRODUCTION
The last major reorganization of terrestrial ecosystems in California occurred during the last glacial termination (Glover et al., Reference Glover, George, Heusser and MacDonald2021), a period of large and often rapid climate oscillations (Denton et al., Reference Denton, Anderson, Toggweiler, Edwards, Schaefer and Putnam2010; Clark et al., Reference Clark, Shakun, Baker, Bartlein, Brewer, Brook and Carlson2012). A succession of abrupt climate-change events during deglaciation have been well-documented in the Northern Hemisphere: Henrich Stadial 1, the Bølling and Allerød interstadials, and the Younger Dryas, all of which significantly overprinted long-term, orbitally paced warming with excursions of 1–2°C over decades to centuries (Denton et al., Reference Denton, Anderson, Toggweiler, Edwards, Schaefer and Putnam2010). Paleoecological studies from eastern North America, where there is a robust network of multiproxy, high-resolution paleoecological studies, have applied a conceptual framework for interpretating feedback among fire, vegetation, and megafauna using well-resolved records of charcoal, pollen, and coprophilous fungal spores (e.g., Shuman et al., Reference Shuman, Newby and Donnelly2009; Gill et al., Reference Gill, Williams, Jackson, Lininger and Robinson2009, Reference Gill, Williams, Jackson, Donnelly and Schellinger2012; Oswald et al., Reference Oswald, Foster, Shuman, Doughty, Faison, Hall, Hansen, Lindbladh, Marroquin and Truebe2018). Those studies have demonstrated that rapid climate and environmental changes of the last deglaciation produced profound, long-term effects on vegetation composition and structure, fire regimes, and megafauna populations.
Fewer studies have examined the ecological feedbacks among fire, vegetation, and megafauna using microfossils from the sedimentary record during deglaciation in the western USA (e.g., Davis and Shafer, Reference Davis and Shafer2006). The western US has a complex history of environmental change as gradually reducing moisture shrank the massive pluvial lakes of the Great Basin, giving rise to the semiarid modern landscape (Grayson, Reference Grayson2011). Paleoclimate evidence, largely from speleothem and pluvial lake-shoreline reconstructions, has shown that terrestrial environments were intimately connected to Pacific and North Atlantic Ocean conditions during glacial terminations (Oster et al., Reference Oster, Montañez, Sharp and Cooper2009, Reference Oster, Montañez, Santare, Sharp, Wong and Cooper2015; Lyle et al., Reference Lyle, Heusser, Ravelo, Andreasen, Olivarez Lyle and Diffenbaugh2010; Lachniet et al., Reference Lachniet, Denniston, Asmerom and Polyak2014; Hudson et al., Reference Hudson, Hatchett, Quade, Boyle, Bassett, Ali and De los Santos2019), implying that terrestrial ecosystems would have experienced major environmental swings during deglaciation. Yet, a persistent problem in late Quaternary paleoecology of the western USA has been the muted or uncertain response of vegetation and fire regimes to deglacial climate-change events (e.g., Younger Dryas, MacDonald et al., Reference MacDonald, Moser, Bloom, Porinchu, Potito, Wolfe, Edwards, Petel, Orme and Orme2008).
However, the longer-term assembly of the terrestrial ecosystems of the central Sierra Nevada (Cole, Reference Cole1983; Davis et al., Reference Davis, Anderson, Fall, O'Rourke and Thompson1985; Anderson, Reference Anderson1990a; Smith and Anderson, Reference Smith and Anderson1992; Anderson and Smith, Reference Anderson and Smith1994; Koehler and Anderson, Reference Koehler and Anderson1994) and western Great Basin (Batchelder, Reference Batchelder1970; Jennings and Elliott-Fisk, Reference Jennings and Elliott-Fisk1993; Nowak et al., Reference Nowak, Nowak, Tausch and Wigand1994; Woolfenden, Reference Woolfenden2003; Mensing, Reference Mensing2001; Mensing et al., Reference Mensing, Smith, Burkle Norman and Allan2008; Brugger and Rhode, Reference Brugger and Rhode2020) since the late Pleistocene are documented by a rich history of Quaternary subfossil pollen and macrofossil studies from lakes, wetlands, and middens. This work has shown that much of the Sierra Nevada and Great Basin was covered in a subalpine community of Artemisia-, Pinus-, Abies-, and Juniperus-dominated woodlands that transitioned during the Holocene to more altitudinally stratified montane forests, chaparral/woodlands, and open lowland steppes. The interglacial transition initiated biogeographic shifts in the distribution of plants over 100s of kilometers, including iconic, keystone species such as Pinus monophylla (single-leaf pinyon pine; Cole et al., Reference Cole, Fisher, Ironside, Mead and Koehler2013), Juniperus scopulorum (Rocky Mountain juniper; Woolfenden, Reference Woolfenden2003), and Sequoiadendron giganteum (giant sequoia; Cole, Reference Cole1983).
Despite the extensive paleoecological work conducted in the Sierra Nevada and the Great Basin, very few pollen studies have had the sampling resolution necessary to detect more rapid events (<250 years per sample, after Anderson et al., Reference Anderson, Wahl and Bhattacharya2022). Instead, most ecological interpretations in the region have centered on responses to gradual, orbitally forced climate change (e.g., Davis et al., Reference Davis, Anderson, Fall, O'Rourke and Thompson1985; Anderson, Reference Anderson1990a; Anderson and Smith, Reference Anderson and Smith1994), rather than more rapid and nonlinear events (e.g., Heusser et al., Reference Heusser, Kirby and Nichols2015; Glover et al., Reference Glover, Chaney, Kirby, Patterson and MacDonald2020; Zimmerman and Wahl, Reference Zimmerman and Wahl2020). More recent investigations (Mensing, Reference Mensing2001; MacDonald et al., Reference MacDonald, Moser, Bloom, Porinchu, Potito, Wolfe, Edwards, Petel, Orme and Orme2008; Oster et al., Reference Oster, Montañez, Sharp and Cooper2009; Reference Oster, Montañez, Santare, Sharp, Wong and Cooper2015; Heusser et al., Reference Heusser, Kirby and Nichols2015; Ali, Reference Ali2018) have shown hydroclimatic sensitivity to rapid change, but the ecological response remains poorly understood, particularly east of the Sierra Crest (Anderson et al., Reference Anderson, Wahl and Bhattacharya2022; Fig. 1).
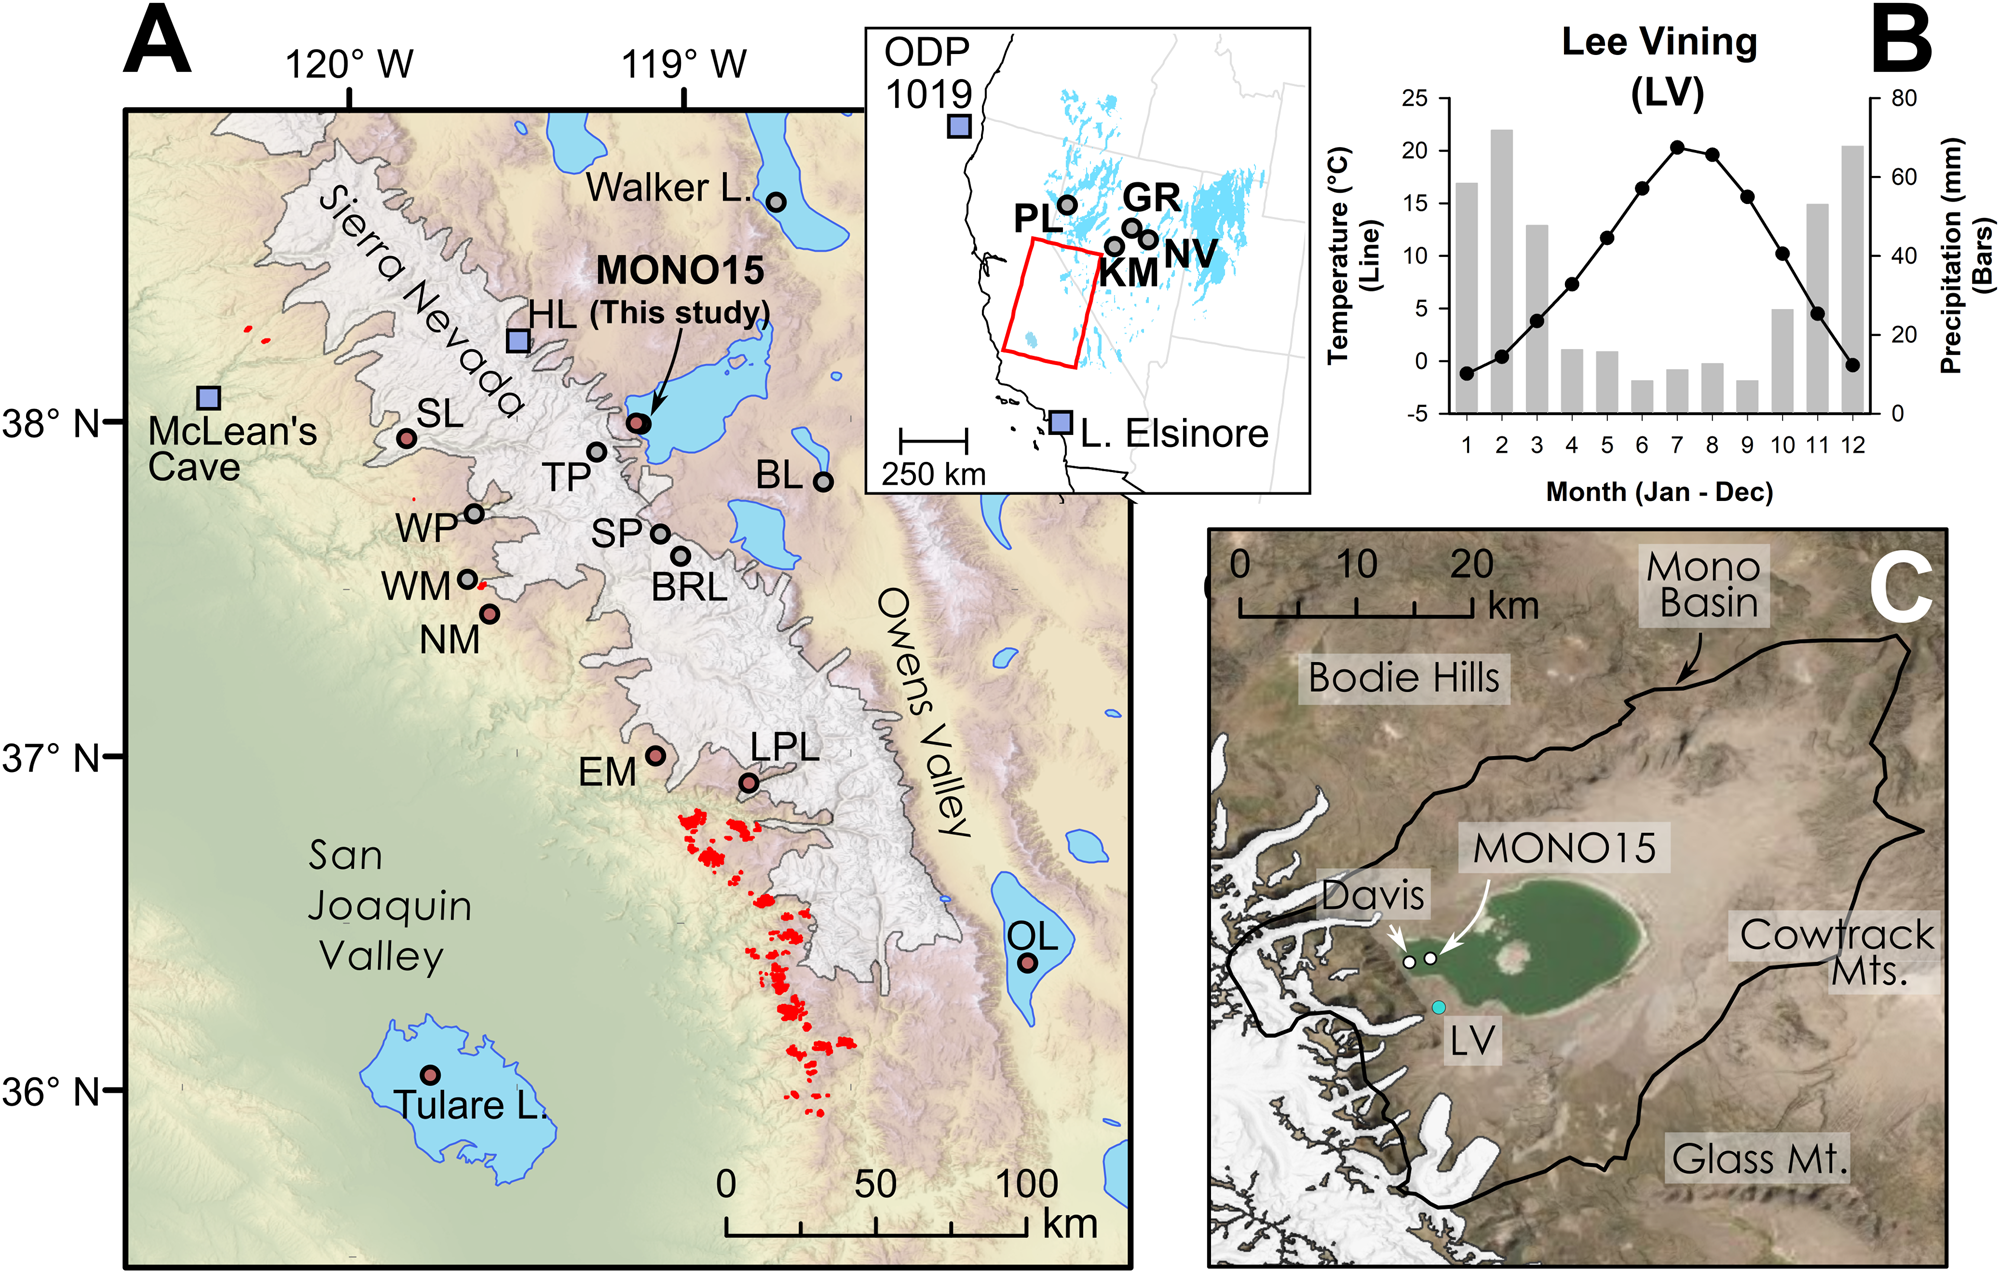
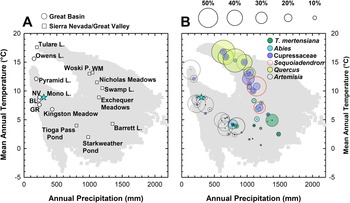
(A) Regional map showing location of late Pleistocene lakes, glaciers, and prior studies. Circles show location of pollen or other paleoecological study sites and squares show locations of paleoclimate proxies mentioned in the text. Modern Sequoiadendron groves are shown in red, and red circles indicate site locations with late Pleistocene Sequoiadendron pollen. Inset shows location of study region (red rectangle) and ODP Site 1019 (Barron et al., Reference Barron, Heusser, Herbert and Lyle2003; Praetorius et al., Reference Praetorius, Condron, Mix, Walczak, McKay and Du2020), Lake Elsinore (Kirby et al., Reference Kirby, Feakins, Bonuso, Fantozzi and Hiner2013; Feakins et al., Reference Feakins, Wu, Ponton and Tierney2019), and Great Basin core-based pollen studies. (B) Data for climate normals (1981–2010) of seasonal records of precipitation (bars) and temperature (line) from Lee Vining, California (https://www.ncdc.noaa.gov/cdo-web/ accessed 4/25/20). (C) Modern Mono Lake and surroundings with coring locations of MONO15 (this study) and Davis (Reference Davis1999a). Image from Google Earth. White shading the greatest extent of Tioga glaciers in A and C from Gillespie and Clark (Reference Gillespie, Clark, Ehlers, Gibbard and Hughes2011) and Wahrhaftig et al. (Reference Wahrhaftig, Stock, McCracken, Sasnett and Cyr2019), respectively. BL—Black Lake, BRL—Barrett Lake, EM—Exchequer Meadows, GR—Gund Ranch, HL—Hidden Lake, KM—Kingston Meadow, LPL—Lilypad Lake, NM—Nicholas Meadows, NV—Newark Valley Pond, OL—Owens Lake, PL—Pyramid Lake, SP—Starkweather Pond, SL—Swamp Lake, TP—Tioga Pass Pond, WM—Wawona Meadow, WP—Woski Pond.
The wooded landscape of the Pleistocene Great Basin and Sierra Nevada also supported at least 19 genera of now-extinct mammals until the terminal Pleistocene, with horses, camels, and mastodons being the most common (Grayson, Reference Grayson2006). One paleoecological study (Davis and Shafer, Reference Davis and Shafer2006) employed coprophilous fungal spores as a proxy for megafauna activity within depositional basins from around the western US and showed that Pleistocene landscapes typically supported populations of the Rancholabrean Pleistocene megafauna until after 12,900 cal yr BP (calibrated years before present, AD 1950). Another study by Mack and Thompson (Reference Mack and Thompson1982) suggested that the Great Basin supported Pleistocene megafauna in relatively low populations densities. Yet, more recent work has modeled dense populations of at least some megafauna (e.g., Bison spp.; Wendt et al., Reference Wendt, McWethy, Widga and Shuman2022) that were also sensitive to the abrupt warming of the Bølling Interstade and the onset of the Holocene. The causes of the megafauna extinction in the western US continued to be debated, but vegetation change has been invoked as a major driver of extinction (Grayson, Reference Grayson2016).
To understand the history of semiarid terrestrial ecosystems and their response to major environmental change, we present a new record of vegetation, fire, and megafauna presence surrounding Mono Lake from ca. 16,000–9,000 cal yr BP using pollen, microcharcoal, and spores of the coprophilous fungus Sporormiella. Mono Lake provides an ideal study site to examine how terrestrial ecosystems were shaped by climate change because it sits at the ecotone of the Great Basin floristic province and the central Sierra Nevada (Fig. 1). Mono Lake also has well-dated paleohydrologic reconstructions from sediment cores and relict shorelines, allowing us to understand coupled ecosystem and hydroclimate interactions over this key interval (Ali, Reference Ali2018; Ali et al., Reference Ali, Lin, Hemming, Cox, Ruprecht, Zimmerman, Stine and Wang2022). The pollen results show a gradual decline in woodlands around Mono Lake, punctuated by rapid infilling or opening of woodlands during periods of rapid change during the late Pleistocene. The rapid changes in canopy openness and increases in wildfire appear to have had the greatest effect on megafauna activity in the basin because Sporormiella abundances decline at periods of enhanced vegetation turnover and microcharcoal peaks.
Study setting
Mono Lake is a large, closed-basin lake at the western edge of the Great Basin and the eastern flank of the Sierra Nevada, California, at 1945 m above sea level (m asl; Fig. 1). Diversion of major inflowing rivers associated with the Los Angeles aqueduct system reduced water-level elevation and created hypersaline conditions in Mono Lake beginning in the mid-twentieth century (Jellison and Melack, Reference Jellison and Melack1993). Mono Basin is surrounded by highlands, with the Sierra Nevada mountains to the west, the Bodie Hills to the north, the Granite and Cowtrack mountains to the east, and the Mono-Inyo Craters and Glass Mountain to the south. Mean annual precipitation near the western shore is ~400 mm yr-1 and decreases toward the eastern part of the basin. The majority of precipitation is snowfall from November–March, and the lake is primarily fed by short creeks transporting snowmelt from the eastern Sierra Nevada (Fig. 1B). The Kootzaduka'a people (“eaters of the brine fly”), hunter-gatherers of the Northern Paiute language group, have lived in Mono Basin since at least the early Late Holocene (Brady, Reference Brady2011). Regional archaeological evidence suggests low human populations surrounding Mono Lake and Bodie Hills during the Early Holocene as compared to other Great Basin lakes, but they increased during the Middle to Late Holocene (Halford, Reference Halford1998; Brady, Reference Brady2011). Modern megafauna in or nearby to the Mono Basin include Odocoileus hemionus (mule deer), Ovis canadensis sierrae (Sierra Nevada bighorn sheep), Equus ferus caballus (feral horses), and Puma concolor (mountain lions).
Modern vegetation communities within the Mono Basin form along altitudinal zones, soil types, and precipitation gradients (Winkler, Reference Winkler1977; Constantine, Reference Constantine1993). Alkali Sink steppe dominated by Sarcobatus vermiculatus (greasewood; Amaranthaceae), Atriplex spp. (saltbush; Amaranthaceae), Chrysothamnus nauseosus (rubber rabbitbrush; Asteraceae), and Distichlis spicata (saltgrass; Poaceae) surrounds the lake. Littoral Cyperaceae-dominated marshes occur in flat-lying areas and near deltas. At slightly higher elevations on less saline soils, steppe of Artemisia tridentata (big sage; Asteraceae), Purshia tridentata (bitterbrush; Rosaceae), Ephedra viridis (Mormon tea; Ephedraceae), and Eriogonum spp. (buckwheat; Polygonaceae) occur below 2000 m asl. Several stand-replacing fires have occurred in the steppe around the south shore of Mono Lake over the last 30 years, leaving barren or grass-dominated patches. Riparian zones dominated by Salix exigua (coyote willow; Salicaceae), Populus trichocarpa (black cottonwood; Salicaceae), and Populus tremuloides (quaking aspen; Salicaceae) occur in the eastern creeks draining the Sierra Nevada (Constantine, Reference Constantine1993).
On the flank of the Sierra Nevada and Bodie Hills, woodlands of Pinus monophylla (single-leaf pinyon pine; Pinaceae) and to a lesser extent Juniperus osteosperma (Utah juniper; Cupressaceae) are interspersed with shrubs of Cercocarpus ledifolius (mountain mahogany; Rosaceae), Artemisia, Eriogonum spp., Ceanothus sp. (Rhamnaceae), and Ephedra (Constantine, Reference Constantine1993), while a pure stand of J. osteosperma is found on sandy dunes of the western Mono Basin. Substantial portions of the eastern pinyon–juniper woodlands were also burned by the Marina fire in 2016, completely killing the stands. Forests of fire-adapted Pinus jeffreyi (Jeffrey pine; Pinaceae) with Purshia tridentata understories occur around Mono Craters and Glass Mountain (Anderson and Davis, Reference Anderson and Davis1988; Millar et al., Reference Millar, King, Westfall, Alden and Delany2006). Within the eastern Sierra Nevada, pinyon–juniper woodlands and Jeffrey pine dominate from ~2000 m to 2300 m. Montane forests characterized by Pinus contorta subsp. murrayana (Sierra lodgepole pine; Pinaceae), Abies magnifica, and Abies concolor (red fir and white fir, respectively; Pinaceae) extend from 2300 to 2500 m. Subalpine forests characterized by Tsuga mertensiana (mountain hemlock; Pinaceae) occur up to 3000 m (Anderson and Davis, Reference Anderson and Davis1988; Barbour et al., Reference Barbour, Keeler-Wolf and Schoenherr2007). Although not found within the Mono Basin, Quercus vacciniifolia and Q. chrysolepis (huckleberry oak and canyon live oak, respectively; Fagaceae) are found on dry hillslopes in the eastern Sierra Nevada (Anderson and Davis, Reference Anderson and Davis1988) and Corylus cornuta var. californica (California hazelnut) is a shrub characteristic of Sierran montane forests (Anderson and Davis, Reference Anderson and Davis1988; Barbour et al., Reference Barbour, Keeler-Wolf and Schoenherr2007). Small, distinct groves of Sequoiadendron (giant sequoia; Pinaceae) grow in the western Sierra Nevada interspersed within Sierra montane forests (Hartesveldt et al., Reference Hartesveldt, Harvey, Shellhammer and Stecker1975).
Anderson and Davis (Reference Anderson and Davis1988) first analyzed modern pollen samples along a transect across the central Sierra Nevada stretching from Yosemite to nearby Mono Lake. Their work recognized distinct pollen zones along altitude, reflecting changes in vegetation due to the strong climate gradients of the Sierra Nevada (Fig. 2) despite an overall low pollen taxonomic diversity and an overrepresentation of Pinus pollen. The cool and wet Sierran montane and subalpine zones are dominated by Pinus, Abies, Tsuga mertensiana pollen on both sides of the Sierra Crest (Anderson and Davis, Reference Anderson and Davis1988; Barbour et al., Reference Barbour, Keeler-Wolf and Schoenherr2007). On the drier eastern flank, Pinus and Artemisia pollen are most common. Within the Great Basin, there is an acute lack of modern pollen samples (Minckley et al., Reference Minckley, Bartlein, Whitlock, Shuman, Williams and Davis2008), but existing modern pollen work (Solomon and Silkworth, Reference Solomon and Silkworth1986; Anderson and Davis, Reference Anderson and Davis1988; Woolfenden, Reference Woolfenden2003) showed large differences in Cupressaceae abundance, probably reflecting the strong spatial heterogeneity of Juniperus woodlands in Mono Basin (Constantine, Reference Constantine1993) and throughout the Great Basin (Romme et al., Reference Romme, Allen, Bailey, Baker, Bestelmeyer, Brown and Eisenhart2009).
Graphs showing relationship between modern precipitation and mean annual temperature in the central Sierra Nevada and Great Basin. Gray squares show 30-yr climate normals (1991–2020) at 800 m2 resolution (PRISM Climate Group, 2014). (A) “Climate-space” location of regional paleoecological studies mentioned in the text (Table 1). Blue star denotes climate-space of the western embayment of Mono Lake (this study). (B) Plot shown in (A) with superimposed bubble plots showing percent abundance of indicator pollen taxa (Artemisia, Quercus, Cupressaceae, Sequoiadendron-type, Abies, and Tsuga mertensiana) from surface sediment samples (Batchelder, Reference Batchelder1970; Anderson and Davis, Reference Anderson and Davis1988; Anderson, Reference Anderson1990a; Whitmore et al., Reference Whitmore, Gajewski, Sawada, Williams, Shuman, Bartlein and Minckley2005). Pinus pollen abundances are not shown for legibility but are typically above 75% of the terrestrial pollen sum between 1000 mm and 1500 mm annual precipitation. NV—Newark Valley Pond, BL—Black Lake, GR—Gund Ranch, WM—Wawona Meadow.

Mono Basin has well-preserved sedimentary and geomorphological records of the late Quaternary that were first investigated by Russell (Reference Russell1889) and later by Putnam (Reference Putnam1950), Lajoie (Reference Lajoie1968), Stine (Reference Stine1990), Benson et al. (Reference Benson, Lund, Burdett, Kashgarian, Rose, Smoot and Schwartz1998), Davis (Reference Davis1999a), and Zimmerman et al. (Reference Zimmerman, Hemming, Hemming, Tomascak and Pearl2011a, Reference Zimmerman, Pearl, Hemming, Tamulonis, Hemming and Searleb). More recently, Ali (Reference Ali2018) and Ali et al. (Reference Ali, Lin, Hemming, Cox, Ruprecht, Zimmerman, Stine and Wang2022) refined and re-dated paleoshorelines using uranium-series dating, and created a well-dated late Quaternary hydrograph for Mono Lake. The Pleistocene Lake in the Mono Basin, named Lake Russell in honor of Israel Russell, covered nearly the entire Mono Valley at its deglacial-aged highstand (Lajoie, Reference Lajoie1968; Ali, Reference Ali2018; Fig. 1). For simplicity, we refer to the lake in the Mono Basin as Mono Lake regardless of time or size. During the last deglacial period, Mono Lake waxed and waned considerably in depth and spatial extent as it was influenced by major climate-change events during the glacial termination before regressing to approximately its pre-diversion size during the Early Holocene (Ali, Reference Ali2018).
Paleoecological studies in the Mono Basin have been more limited. Davis (Reference Davis1999a) presented a core-based pollen record collected from the littoral zone of the western embayment (Fig. 1C). His record, which spanned from 13,000 cal yr BP to present, showed the greatest turnover in pollen taxa during the terminal Pleistocene, when Cupressaceae and Sequoiadendron-type pollen declined and were replaced by modern vegetation assemblages.
MATERIALS AND METHODS
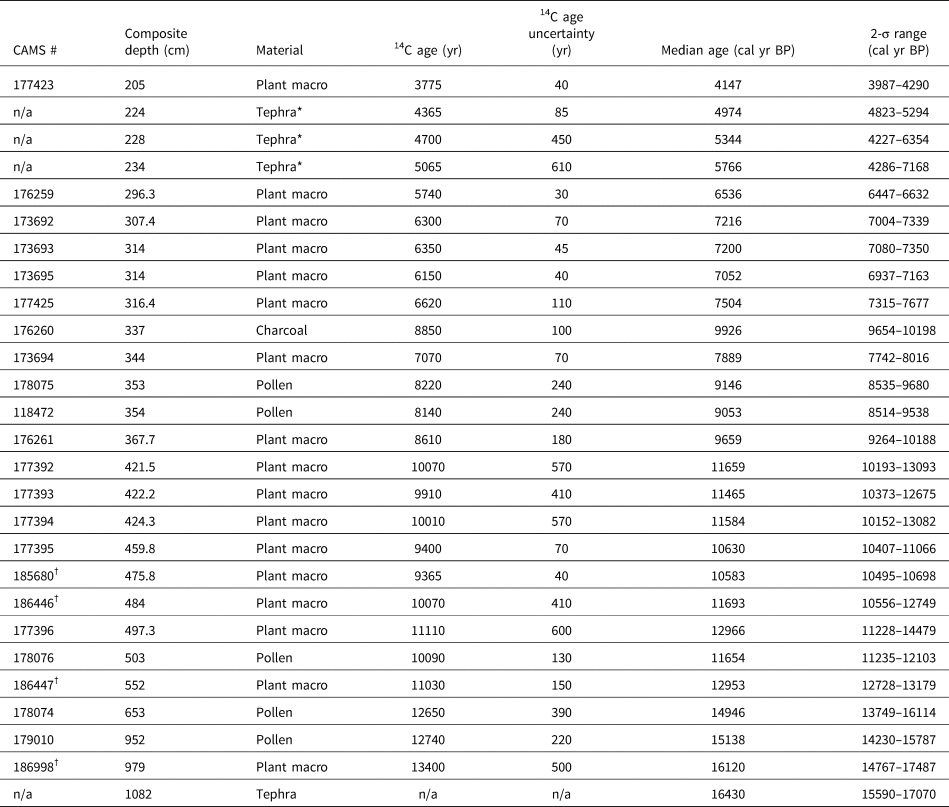
The sediment core UWI-MONO15-1C/D (hereafter MONO15) was extracted in 2015 from the western embayment of Mono Lake (37.994°N, 119.125°W; 1945 m asl; Fig. 1C) in 18-m water depth (Hodelka et al., Reference Hodelka, McGlue, Zimmerman, Ali and Tunno2020). Here, we present an age-depth model based on 23 accelerator mass-spectrometry radiocarbon dates, measured from plant macrofossils, charcoal, pollen purified by flow cytometry, and four tephra correlations (Hodelka et al., Reference Hodelka, McGlue, Zimmerman, Ali and Tunno2020; Tunno et al., Reference Tunno, Zimmerman, Brown and Hassel2021; Zimmerman et al., Reference Zimmerman, Hemming, Starratt, Starratt and Rosen2021; Table 1). Our Bacon age-depth model has been updated from the previous MONO15 age model presented by Hodelka et al. (Reference Hodelka, McGlue, Zimmerman, Ali and Tunno2020) by including four new radiocarbon dates conducted for this study (Table 1). The radiocarbon ages and tephra age constraints were used as input for the R package Bacon version 2.5.7 software program that uses the IntCal20 calibration curve to convert radiocarbon ages to calibrated ages before present (AD 1950). Periods of instantaneous sedimentation caused by sediment slumps and turbidite deposits as interpreted by Hodelka et al (Reference Hodelka, McGlue, Zimmerman, Ali and Tunno2020) based on visual lithologic description of the MONO15 core, were also used as input (Fig. 3). Based on these stratigraphic and chronologic constraints, the Bacon package constructed a Bayesian age-depth model (Blaauw and Christen, Reference Blaauw and Christen2011; R Core Team, 2022) which is very similar (<500 years difference) to the original Hodelka et al. (Reference Hodelka, McGlue, Zimmerman, Ali and Tunno2020) model.
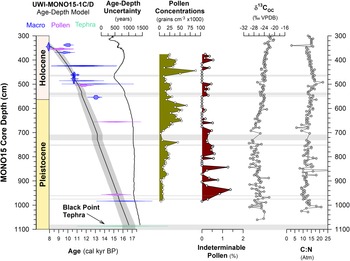
Bacon age-depth model updated from Hodelka et al. (Reference Hodelka, McGlue, Zimmerman, Ali and Tunno2020), with pollen concentrations (this study), percentage of indeterminable pollen grains (this study), δ13COC (Hodelka et al., Reference Hodelka, McGlue, Zimmerman, Ali and Tunno2020; VPDB—Vienna PeeDee Belemnite), and C:N values (Hodelka et al., Reference Hodelka, McGlue, Zimmerman, Ali and Tunno2020) of UWI-MONO15 sediments from 300–1100 cm composite core depth. Age-control points for the Bacon age-depth model are shown as mirrored probability density functions of the 2-σ calibrated age-range for each date. Probability density functions show dates from terrestrial plant macrofossils (macro; blue), purified pollen extracts (pollen; purple), and tephra correlations (tephra; teal). The black solid line shows the mean age from the Bacon age model with gray shading showing 95% confidence intervals. Horizontal light gray bars show slumps of instantaneous sediment deposition added to the age-depth model based on core observations of tephra and turbidites (after Hodelka et al., Reference Hodelka, McGlue, Zimmerman, Ali and Tunno2020).

Radiocarbon (14C) data (n = 23) and other (n = 4) control points used in the age-depth model for core UWI-MONO15-1C/D. †New radiocarbon dates not presented by Hodelka et al. (Reference Hodelka, McGlue, Zimmerman, Ali and Tunno2020). *Dates from tephra from BINGO-MONO10-4A core were acquired via 14C AMS dating and discussed in Hodelka et al. (Reference Hodelka, McGlue, Zimmerman, Ali and Tunno2020) and Zimmerman et al. (Reference Zimmerman, Hemming, Starratt, Starratt and Rosen2021).
A total of 58 sediment aliquots 1-cm thick and 1–2 ml in volume were subsampled for palynological analysis from the MONO15 core, including 57 samples from 376 cm to 984 cm composite-core depth, and one core-top surface sediment pollen sample. Sediment subsamples were acidified with 10% HCl. and one tablet of exotic Lycopodium spores was added to each sample. Clay minerals were dispersed by soaking samples in 1% sodium hexametaphosphate solution and agitating for 24 hours. An enzymatic solution was used to clean organic matter from palynomorph grains following the procedures of O'Keefe and Wymer (Reference O'Keefe and Wymer2017), modified from Schols et al. (Reference Schols, Es, D'Hondt, Merckx, Smets and Huysmans2004). Palynomorphs were extracted from mineral sediments via density separation using the heavy liquid lithium heteropolytungstate (LST) at 2.0 specific gravity. Residues were then stained with safranin, and stored in glycerin at the Penn State Pollen Lab.
A minimum of 300 terrestrial pollen grains were counted for each sample, including at least 100 non-Pinus terrestrial pollen grains. Palynomorph identification was made using published keys and papers (McAndrews et al., Reference McAndrews, Berti and Norris1973; Davis, Reference Davis1999a, Reference Davisb; Kapp et al., Reference Kapp, Davis and King2000) and a reference slide collection at the Penn State Pollen Lab. Sequoiadendron-type pollen was differentiated from Cupressaceae grains by the presence of a papilla (after Davis, Reference Davis1999a; Supplemental Figure S3). Pollen percentages were determined by dividing by the sum of all terrestrial pollen types. The percentages of Sporormiella fungal spores, Cyperaceae, and other aquatic pollen types were calculated against a sum of all terrestrial pollen. Palynomorph concentrations (grains/cm3) and influx rates (grains/cm2/yr) were calculated for each taxon after Faegri et al. (Reference Faegri, Kaland and Krzywinski1989). Microcharcoal particles (<250 μm size fraction) were counted on the same sample slides during pollen identification. Concentrations and accumulation rates of microcharcoal were calculated using the same method as pollen grains.
Pollen zones were defined using stratigraphically constrained incremental sum of squares cluster analysis (CONISS; Grimm, Reference Grimm1987) using the R package vegan version 2.5.7 (Oksanen et al., Reference Oksanen, Blanchet, Friendly, Kindt, Legendre, McGlinn and Minchin2019; Supplemental Figure 4). To highlight ecological gradients, we used detrended correspondence analysis (DCA) using the R package vegan (Oksanen et al., Reference Oksanen, Blanchet, Friendly, Kindt, Legendre, McGlinn and Minchin2019). The analysis was performed on Wisconsin double standardization percentage data on all non-singleton pollen taxa (Supplemental Table 2S). A DCA score was obtained for the surface-sediment pollen sample by passively projecting it using the vegan package onto the ordination generated using the subfossil data. Regional core-top pollen abundances used to create Figure 7 were obtained from the Neotoma Paleoecological Database (Williams et al., Reference Williams, Grimm, Blois, Charles, Davis, Goring and Graham2018) and original published sources (Table 2). Lake surface areas presented in Table 1 were estimated with Google Earth or synthesized from the source publication.
Modern pollen samples from the central Sierra Nevada and Great Basin used to construct Figure 7. P is Pinus, C is Cupressaceae, and A is Artemisia. *Indicates surface areas estimated from Google Earth; other surface areas given in original reference.

RESULTS
Core lithology and chronology
The lithology of the MONO15 core was previously described by Hodelka et al. (Reference Hodelka, McGlue, Zimmerman, Ali and Tunno2020). Briefly, the core consists of well-preserved lacustrine muds interbedded with occasional tephras and sand layers. Late Pleistocene units contain inclusions of pebbles that penetrate bedding, and were interpreted as dropstones (Hodelka et al., Reference Hodelka, McGlue, Zimmerman, Ali and Tunno2020). Sediments that span the terminal Pleistocene to Holocene transition show a shift from finely laminated silts with high organic-matter content to laminated muds with occasional thinly bedded turbidites, likely reflecting the Early Holocene regression from a Younger Dryas highstand (Ali, Reference Ali2018). Holocene sediments contain finely laminated calcareous muds with less siliciclastic detritus, indicative of a low-energy depositional environment in a shallower lake (Hodelka et al., Reference Hodelka, McGlue, Zimmerman, Ali and Tunno2020).
Fourteen radiocarbon ages cover the interval of pollen sampling from 15,700–9,100 cal yr BP (984–376 cm core depth; Fig. 3). There was paucity of terrestrial plant macrofossils between 952 cm and 653 cm depth, leading to a gap of 3 m and 2,700 years in the age control points. However, the basal age of the MONO15 core is well-constrained by an altered basaltic tephra inferred to derive from a late eruption of the Black Point volcano (17,000–14,600 cal yr BP; Bailey, Reference Bailey2004) and two radiocarbon dates at 979 cm and 952 cm composite depth, respectively. Modeled age-depth uncertainties averaged ± 500 years in the Pleistocene, while more plant macrofossils were available for generating dates from the terminal Pleistocene and early Holocene, increasing the precision during the Early Holocene to an average of ± 350 years. The average temporal resolution between pollen samples is 100 ± 40 years/sample for the Pleistocene, and 145 ± 60 years/sample for the Early Holocene. Overall sedimentation rates indicate each 1-cm-thick pollen aliquot integrated 10 ± 0.4 years of time during the Pleistocene and 14 ± 4 years during the Early Holocene.
Palynological record and statistical analysis
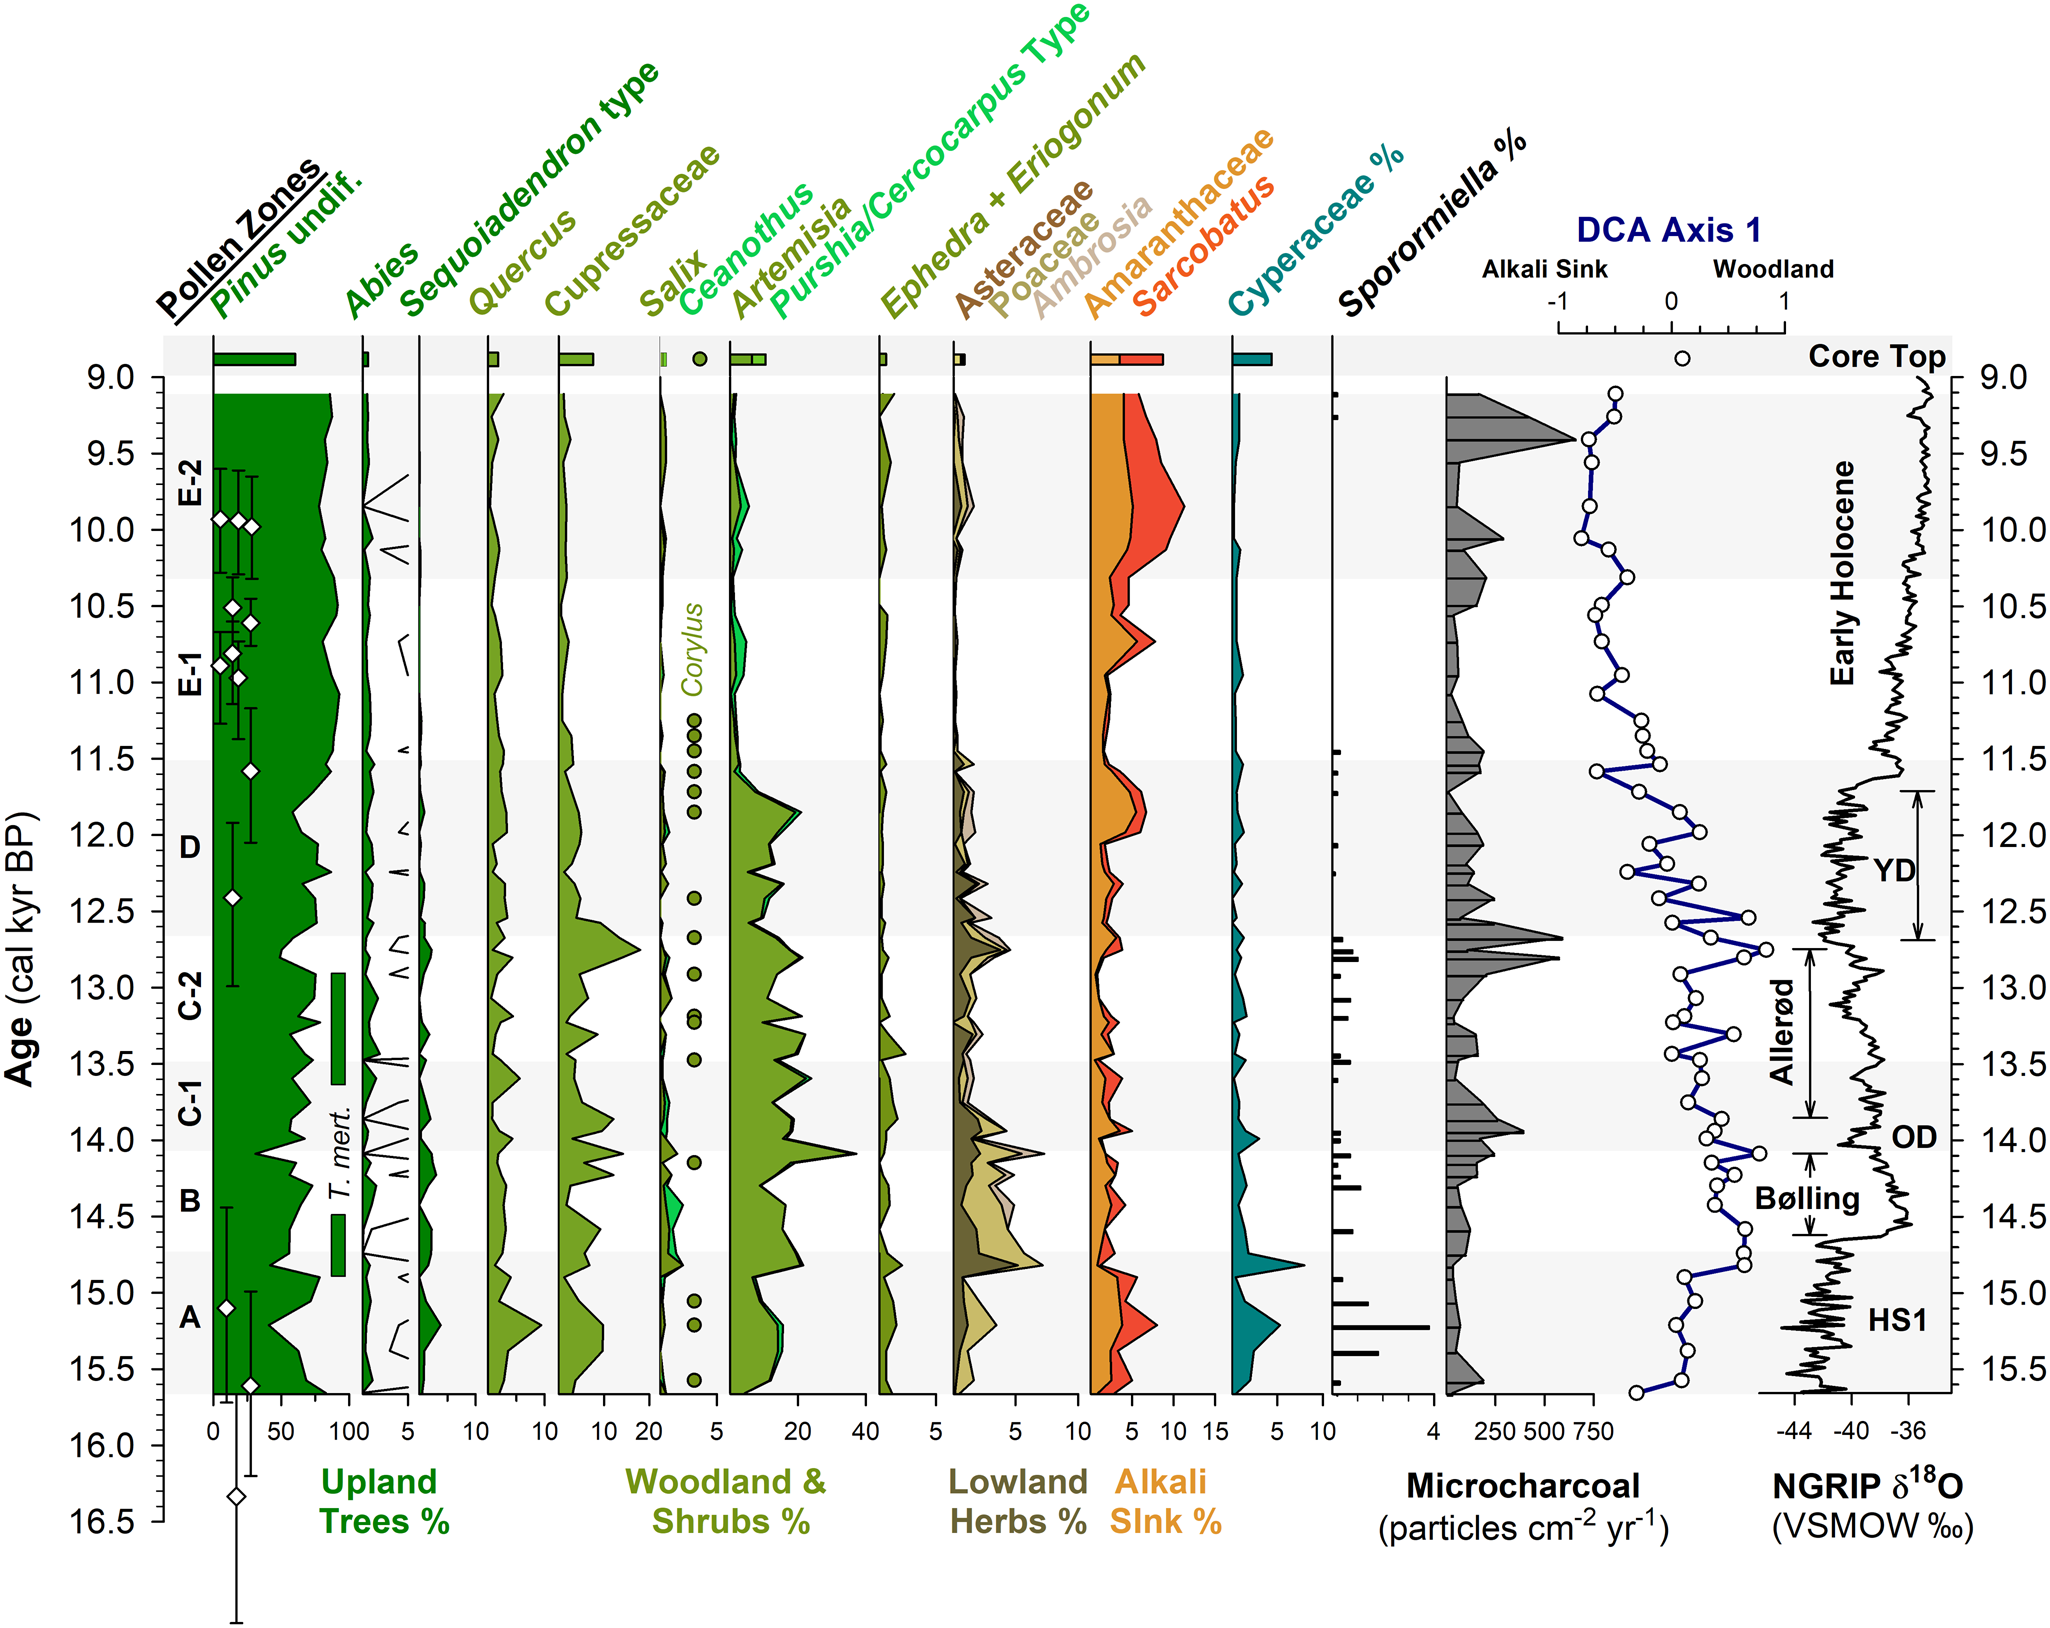
The pollen record from the MONO15 core is divided into seven pollen zones: A (984–888 cm), B (888–822 cm), C1 (822–756 cm), C2 (756–652 cm), D (652–528 cm), E1 (528–456 cm), and E2 (456–376 cm) (Supplemental Figure 1). The Bacon age-depth model we present below was used to assign the zone ages in Figure 3 and Supplemental Figure 2. Pollen concentrations averaged 13,700 ± 8,800 grains/cm3 from 15,700–12,900 cal yr BP, increased to 43,600 ± 12,400 grains/cm3 from 12,900–12,000 cal yr BP, and then fell to an average of 28,000 ± 18,000 grains/cm3 from 11,700–9,100 cal yr BP (Fig. 3). Pollen grains that were not determinable were most common from 15,600–14,300 cal yr BP with a maximum of 1.4% of the pollen sum. Variance along DCA axis 1 was 0.1821, and 0.1266 along DCA axis 2. DCA axis 1 displays a strong gradient from pollen types characteristic of juniper-sage woodlands (Cupressaceae and Artemisia) to pollen types associated with arid Alkali Sink steppe (e.g., Amaranthaceae and Sarcobatus). Arboreal pollen types associated with Sierran montane and subalpine forests (Pinus, Tsuga mertensiana, and Abies) plot about the origin. When plotted as a time series, DCA axis-1 scores indicate large compositional turnover in pollen taxa (ter Braak, Reference ter Braak1985) highlighting periods of high landscape instability, while overall long-term trends show ecological gradients from woodland to steppe (Fig. 4).
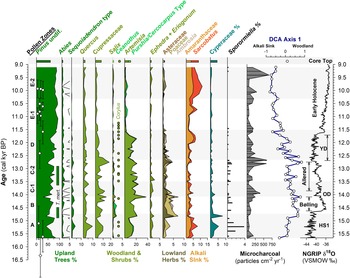
Summary MONO15 pollen diagram compared to DCA axis-1 scores (Supplemental Figure 4) and the Greenland NGRIP δ18O record (Rasmussen et al., Reference Rasmussen, Andersen, Svensson, Steffensen, Vinther, Clausen and Siggaard-Andersen2006). Pollen zones were denoted based on CONISS analysis (Supplemental Figure 1). Dark green bars represent the presence (~1%) of Tsuga mertensiana (T. mert) pollen and dots indicate the presence of Corylus pollen. White diamonds show MONO15 radiocarbon dates with 2-sigma uncertainties (updated from Hodelka et al., Reference Hodelka, McGlue, Zimmerman, Ali and Tunno2020; Fig. 3). Black-lined abundance curves are exaggerated by 10%. HS1—Heinrich Stadial 1, OD—Older Dryas, YD—Younger Dryas.
Pollen Zone A (15,700 cal yr BP to 14,700 cal yr BP) was dominated by Pinus pollen (~40–80%), with high Artemisia, Cupressaceae, and Quercus pollen all between 10–15%. Sequoiadendron-type pollen and Sporormiella fungal spores both peaked at ~4% of the terrestrial pollen sum, the highest of the entire record from the core. Cyperaceae pollen abundance in Zone A was also the highest of the record (~5%). Alkali Sink pollen taxa (Amaranthaceae and Sarcobatus) were relatively high (~5%), while lowland herb pollen (Poaceae, Asteraceae, and Ambrosia) had a combined abundance of <4%. Microcharcoal influx was low, with values averaging 65 particles/cm2/yr. DCA axis-1 scores for samples from this zone generally plot near the origin, influenced by high Cyperaceae and Quercus.
In Pollen Zone B (14,700 cal yr BP to 14,000 cal yr BP), Artemisia, Salix, Ceanothus, lowland herb pollen, and microcharcoal influxes all abruptly increased between two pollen samples 8 cm apart at ca. 14,800 cal yr BP (Fig. 4). The age-depth model indicates these two samples are 100 ± 40 yr apart. Coevally, Amaranthaceae and Sarcobatus pollen abundances dropped to ~3%, and Sporormiella abundance fell to ≤1%. Tsuga mertensiana pollen become consistently present at ~1% abundance. Quercus, Sequoiadendron-type, and Abies pollen remained relatively unchanged throughout the interval. At 14,100 cal yr BP, pollen from lowland herbs increased to 7% and Artemisia peaked at 37%, the highest of the core record. Cupressaceae pollen increased to 14%, and microcharcoal influx increased to 240 particles/cm2/yr at the end of the zone.
Zone C (14,000 cal yr BP to 12,700 cal yr BP) was divided into two subzones: C1 (14,000–13,400 cal yr BP) and C2 (13,400–12,700 cal yr BP). The age model had low precision in this interval because there were no age control points (Fig. 4). Early in Zone C1, microcharcoal peaked to ~390 pieces particles/cm2/yr and lowland herb pollen fell to 2%. Ceanothus and Salix pollen abundance dropped to <1%. Cupressaceae pollen abundance declined from 9% to 4% at the end of Zone C1. Sporormiella spores were not consistently present in Zone C1 and did not exceed 0.5% of the pollen sum. In Zone C2, Eriogonum and Ephedra pollen fell to <1%. Both Tsuga mertensiana pollen and Sporormiella spores became consistently present in the record again at ≤1% abundance, and Corylus pollen was present. Cupressaceae pollen rose throughout Zone C2 from ~2% to 18%. Similarly, lowland herb pollen peaked to 4% at 12,750 cal yr BP. Microcharcoal influx increased to ~500 particles/cm2/yr during the same interval.
Pollen Zone D (12,700 cal yr BP to 11,500 cal yr BP) was marked by a decline in Cupressaceae pollen from 18% to 5% between 12,700 cal yr BP and 12,500 cal yr BP, and declined thereafter to 3% at 11,500 cal yr BP. Sequoiadendron-type pollen abundances also declined throughout the zone from 1.5% at 12,500 cal yr BP to 0.5% at 11,500 cal yr BP. Similarly, lowland herb abundances fell from ~5% at 12,700 cal yr BP to <2% at 11,500 cal yr BP. Sporormiella occurrences fell at the boundary of Zone C2 and D at 12,650 cal yr BP, and occurrences thereafter were sporadic and only reached ~0.2% of the terrestrial pollen sum. Amaranthaceae and Sarcobatus pollen rose to 6% between 12,000 cal yr BP and 11,700 cal yr BP, while Artemisia pollen fell from 20% to ≤ 2% between 11,850 cal yr BP to 11,500 cal yr BP. Microcharcoal fell from 590 particles/cm2/yr at 11,700 cal yr BP to 170 particles/cm2/yr at 11,500 cal yr BP. DCA axis-1 scores were highly variable, but gradually decreased from 0.67 to -0.66 throughout the zone.
Pollen Zone E (11,500 cal yr BP to 9,100 cal yr BP) was divided into two subzones: E1 (11,500–10,300 cal yr BP) and E2 (10,300–9,100 cal yr BP). In Zone E1, Pinus pollen rose to 93% and remained consistently above 80% throughout Zone E1. Amaranthaceae and Sarcobatus pollen abundances averaged 3%, while Cupressaceae, Artemisia, and lowland herbs all remained below 2%. In Zone E1, the last appearance of Sporormiella occurred at 11,450 (11,900–11,050 cal yr BP) cal yr BP and did not reappear until 9,200 cal yr BP. In Zone E2, Amaranthaceae and Sarcobatus pollen abundance rose from 6% to 11% from 10,300 cal yr BP to 9,800 cal yr BP. Similarly, Artemisia, Cupressaceae, and lowland herb pollen all rose slightly to <5%. The last appearance of Sequoiadendron-type occurred at 9,600 (9,970–9,160 cal yr BP) cal yr BP. The average microcharcoal influx rose to 240 particles/cm2/yr and peaked to 660 particles/cm2/yr at 9,400 cal yr BP. Sporormiella was present in two samples in Zone E2. Compared to Zone E2, the MONO15 core-top pollen sample shows Pinus, Cupressaceae, Artemisia, and a DCA axis-1 score more similar to the Pleistocene, but abundances of Abies, Purshia-Cercocarpus type, and Alkali Sink pollen comparable to the Early Holocene. Sequoiadendron-type, Tsuga mertensiana, and Sporormiella are absent from the surface sediment sample.
DISCUSSION
Chronology and lake-level influence on pollen interpretations
Developing reliable chronologies for proxies from arid, closed-basin lakes such as Mono Lake is a challenging problem for Quaternary studies (Zimmerman et al., Reference Zimmerman, Brown, Hassel and Heck2019). The carbon cycle within the lake produces significant reservoir effects (Peng and Broecker, Reference Peng and Broecker1980), and precludes the possibility of reliably radiocarbon dating bulk sediments (Zimmerman et al., Reference Zimmerman, Brown, Hassel and Heck2019. Moreover, the MONO15 core is located ~1 km from the modern western shoreline, making terrestrial plant macrofossils rare, particularly during the late Pleistocene highstands (Hodelka et al., Reference Hodelka, McGlue, Zimmerman, Ali and Tunno2020). We have attempted to compensate for the paucity of terrestrial macrofossils by using flow cytometry to concentrate and purify pollen extracts for radiocarbon dating (Zimmerman et al., Reference Zimmerman, Brown, Hassel and Heck2019; Tunno et al., Reference Tunno, Zimmerman, Brown and Hassel2021; Fig. 3). Moreover, lithologic changes have been carefully observed, and apparent deposition of turbidites and tephra have been incorporated into the age-depth model (Hodelka et al., Reference Hodelka, McGlue, Zimmerman, Ali and Tunno2020; Fig. 3). While the MONO15 age model returns relatively high uncertainties, the overall sedimentation rate during the deglacial period is well-constrained by three basal ages, and shows that the overall sampling interval of the pollen record is between ca. 100 to 200 years per pollen sample, which is high-resolution enough to characterize the response of rapid events during the late Pleistocene (Anderson et al., Reference Anderson, Wahl and Bhattacharya2022).
Another challenge for interpretating fossil pollen assemblages from the large pluvial lakes of the Great Basin are the large pollen source areas, which potentially complicate ecological and climate interpretations. For example, as the lakes changed in depth and spatial extent during the last deglaciation (e.g., Ibarra et al., Reference Ibarra, Egger, Weaver, Harris and Maher2014; Rehis et al., Reference Reheis, Adams, Oviatt and Bacon2014), lower elevations were alternately inundated or exposed. This could have affected pollen assemblages by changing the relative proportion of lowland to highland pollen influx to the core site. In the Mono Basin, the expansive, flat-lying lowlands rapidly became exposed as the shoreline fell from late glacial to modern levels, potentially complicating ecological interpretations (Fig. 5).
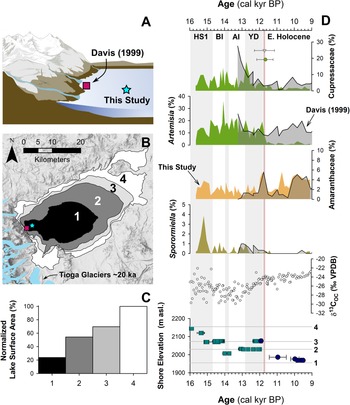
Relationship between lake level and pollen assemblages: (A) cartoon of the eastern Sierra Front and Mono Lake showing the coring locations of Davis (1999) and MONO15 (this study) during the late Pleistocene (after Hodelka et al., Reference Hodelka, McGlue, Zimmerman, Ali and Tunno2020); (B) lake-surface extent at major terraces (numbered 1–5); (C) percent changes in surface area normalized to the Pleistocene highstand at ca. 16,000 cal yr BP for each major terrace; (D) comparison of Cupressaceae, Artemisia, Amaranthaceae, and Sporormiella palynomorph abundances and temporal patterns between the MONO15 and Davis (1999; gray shading) cores compared to MONO15 δ13COC (Hodelka et al., Reference Hodelka, McGlue, Zimmerman, Ali and Tunno2020), and lake level during the deglacial period (Ali, Reference Ali2018). Teal squares show U-Series dates and blue circles show radiocarbon dates (Ali, Reference Ali2018). The numbered elevation lines on the Mono Lake hydrograph in panel D correspond to lake extent and surface area of panels B and C, respectively. Both the littoral and offshore pollen records show good agreement in relative palynomorph abundances and temporal patterns except for Artemisia pollen at the onset of the Holocene at ca. 11,700 cal yr BP, which is coeval to the largest drop in lake level. Modeled age uncertainties of the Pleistocene–Holocene boundary (light pink line) are shown for both the Davis core (grey triangle) and the MONO15 core (green circle); m asl–m above sea level. HS1—Heinrich Stadial 1, BI—Bølling Interstade, AI—Allerød Interstade, YD—Younger Dryas.
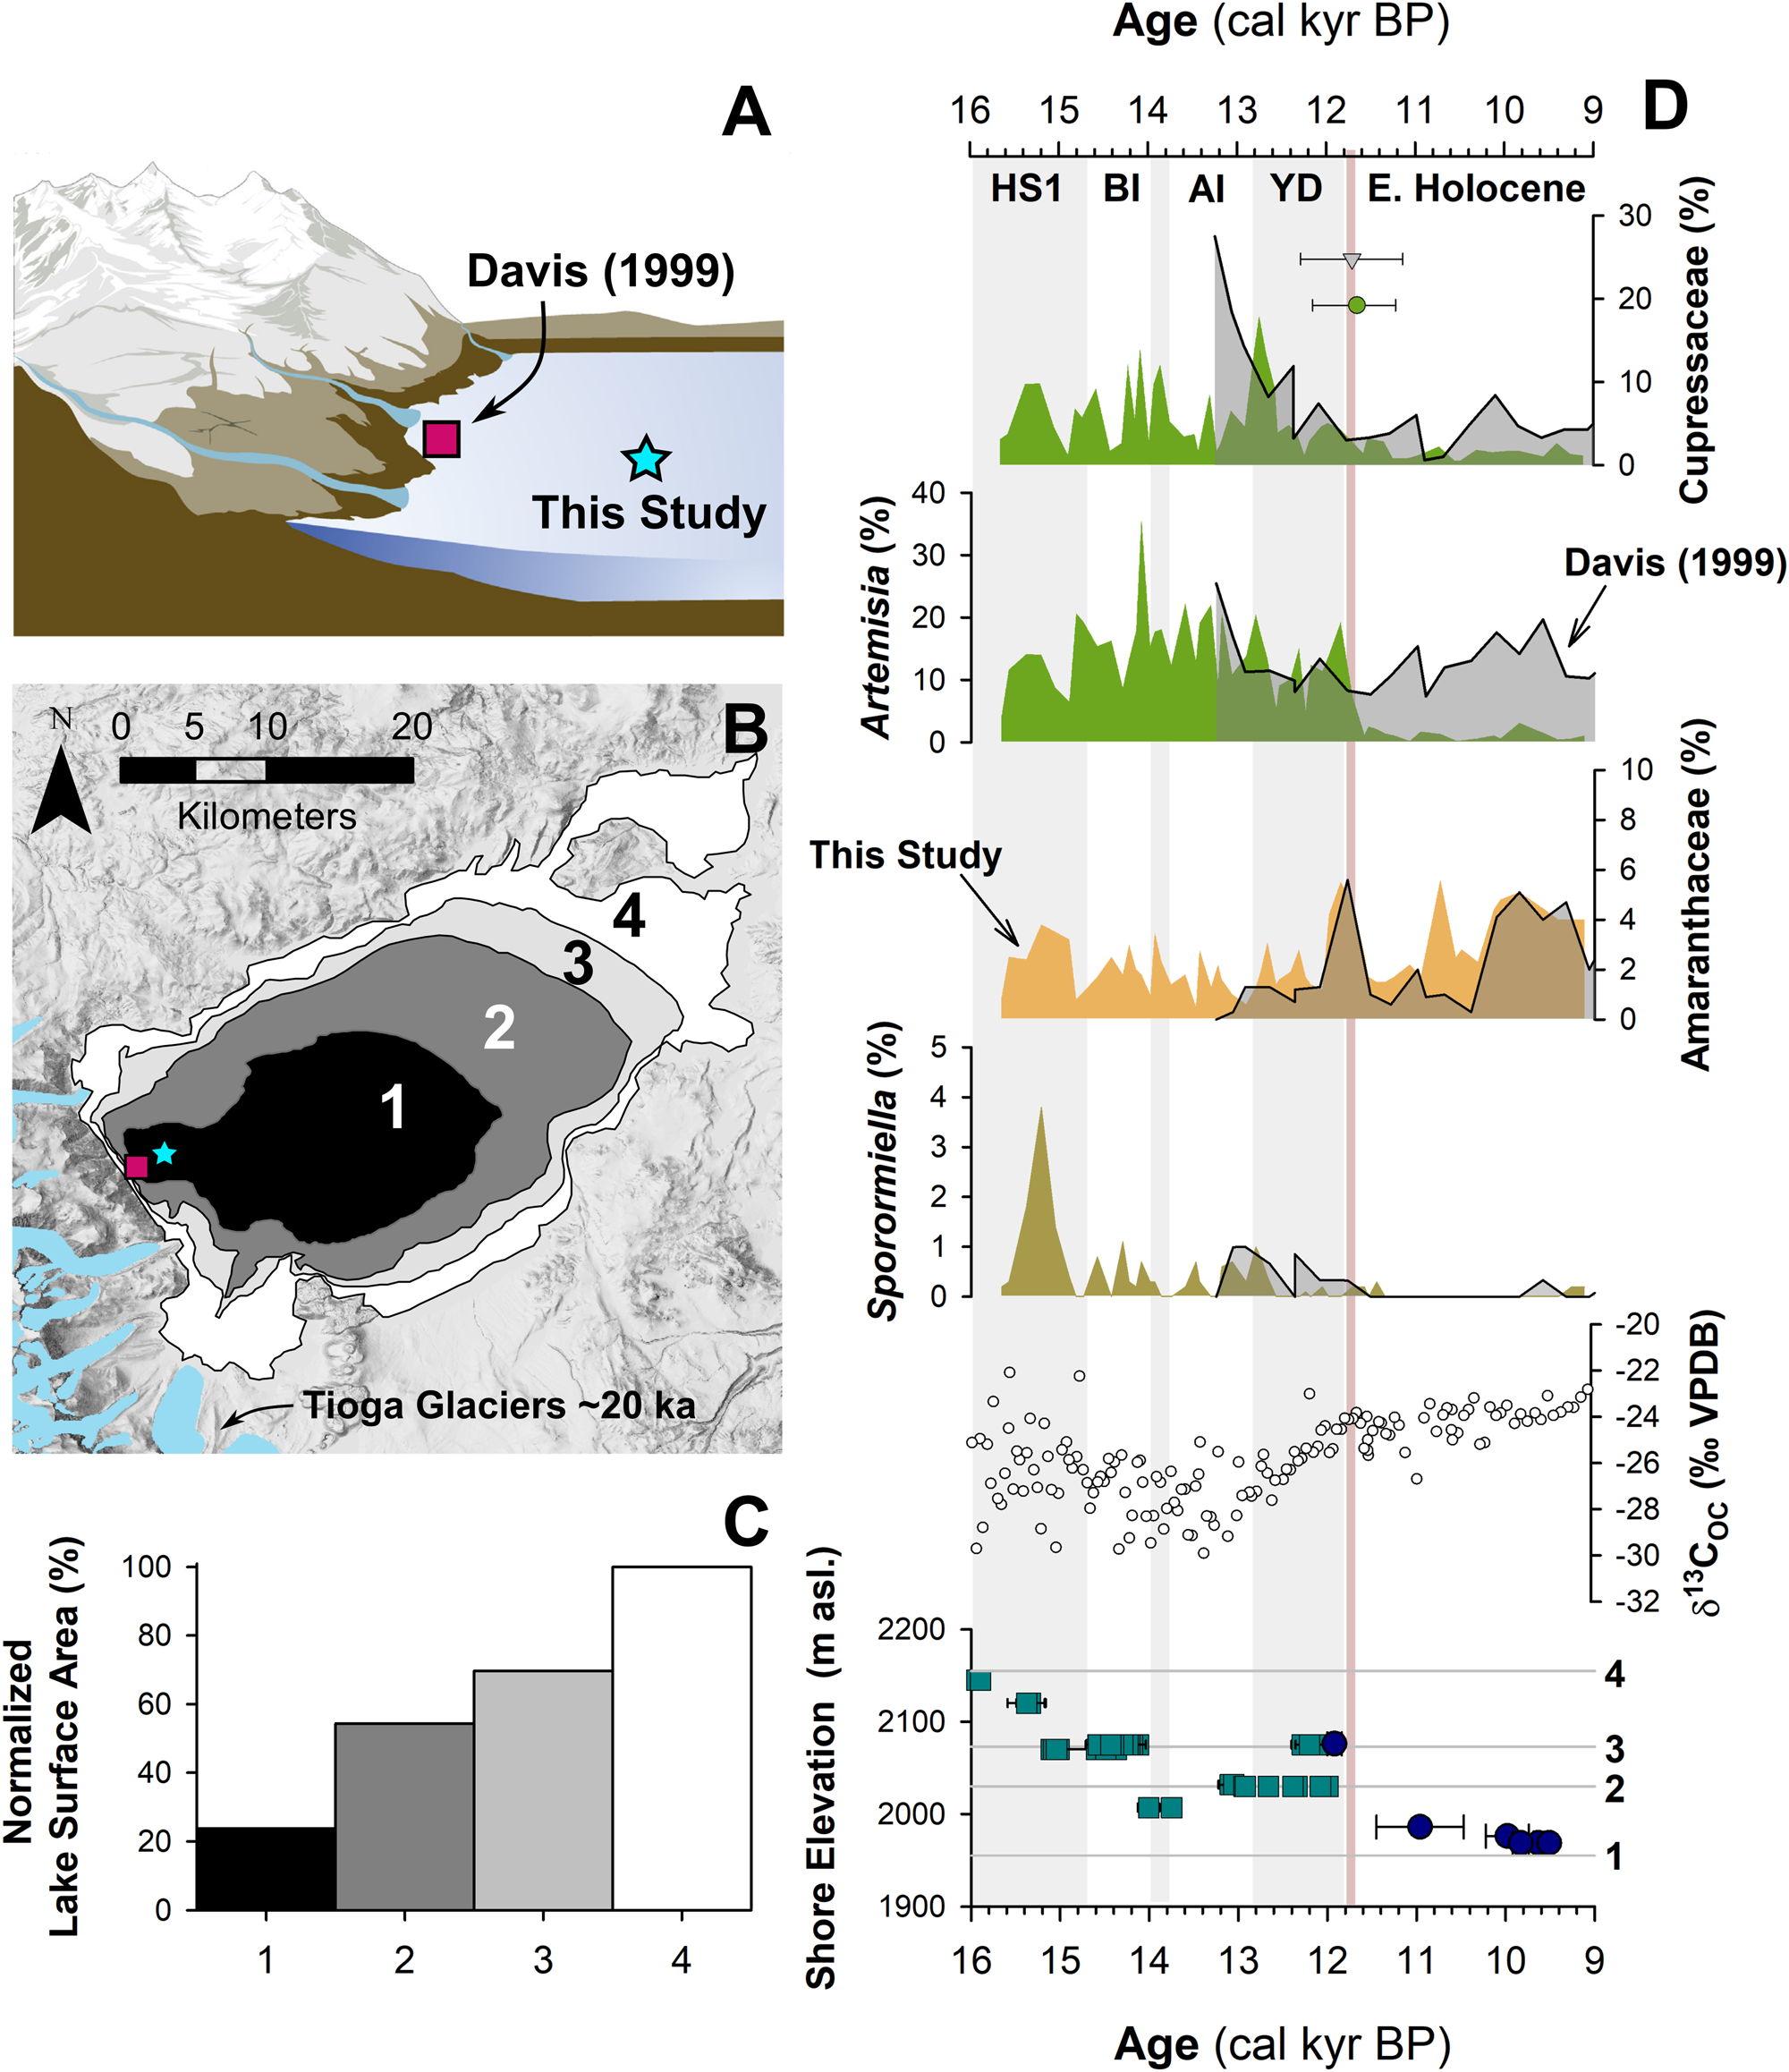
To examine the effects of lake-level dynamics on the vegetation signal, we compare our MONO15 deep-water pollen record to the littoral pollen record of Davis (Reference Davis1999a) and the paleoshoreline elevation through the last deglaciation (Ali, Reference Ali2018). The core studied by Davis (Reference Davis1999a) was taken in less than 3 m water depth on the delta of Post Office Creek. Given the position of the core on a delta in front of steep drainages of the Sierran flank, we expect that the fossil pollen assemblage of that core had a smaller overall source area, biased to the hillslopes and the creek upslope of the delta. In contrast, the MONO15 core was collected from the local depositional center of Mono Lake within the western embayment, and likely integrates a greater source area from the surrounding lowlands and highlands to the north and south. Three pollen types (Cupressaceae, Artemisia, and Amaranthaceae) and Sporormiella spores from both cores and the MONO15 δ13COC profile (Hodelka et al., Reference Hodelka, McGlue, Zimmerman, Ali and Tunno2020) illustrated lake-level effects on lowland vegetation (Fig. 5D).
The only substantial regression of Mono Lake indicated by both pollen records is the Early Holocene regression, when nearly 50% of the basin became subaerially exposed compared to the late Pleistocene highstand (after Ali, Reference Ali2018; Fig. 5). Both pollen records show a gradual decline in Cupressaceae pollen from 13,000 cal yr BP to 11,000 cal yr BP at this transition. Given the different pollen source areas for each sediment core, the same pattern in both records likely indicates a basin-wide reduction in Cupressaceae independent of lake level. The corresponding rise in Amaranthaceae pollen in both pollen spectra records the regional expansion of Amaranthaceae and other halophyte vegetation onto newly exposed lowlands. Moreover, the δ13CTOC profile records an increase from −28‰ to −24‰ across the Younger Dryas–Holocene transition, also likely capturing an expansion of C4 Atriplex spp. (Amaranthaceae; Fig. 5).
However, the temporal pattern of Artemisia pollen in both cores differs substantially, implying differing source areas of Artemisia pollen. In the MONO15 record, there is a dramatic, ca. 300-year-long decrease (250–370 yr, 95% confidence interval) in Artemisia pollen to near zero percent that began at 11,850 cal yr BP. The littoral record shows no such decline. The disconnect between the two core records suggests that the decline in Artemisia pollen abundances in the MONO15 core was driven by the lake-level regression because it would have increased the distance between Artemisia steppe and the lake shore and increased the area for other lowland plant colonization (i.e., Amaranthaceae). In the littoral core, constant high Artemisia abundances likely resulted from continued proximity of the core site to the steep flanks of the Sierra Nevada, where Artemisia from higher elevations still grew despite the substantial lake regression. Therefore, the decrease in Artemisia in MONO15 does not indicate a major, basin-wide extirpation of Artemisia (Fig. 5). The rapid decline in Artemisia in the MONO15 pollen record following the rapid lake regression at the Younger Dryas termination indicates a shift in the pollen source area of the deep-water MONO15 core in the earliest Holocene.
However, the late Pleistocene MONO15 pollen record appears less strongly influenced by lake-level dynamics than the early Holocene. Although the overlap of the two pollen records ends early in the Younger Dryas, the deglacial-age lake was consistently higher than its Holocene average (Ali, Reference Ali2018), and the morphology of the basin dictates that the changes in the proportions of low- and high-elevation shorelands were small compared to the post-Younger Dryas recession (Fig. 5). Similarly, the δ13CTOC and the C:N record indicate far less influence from terrestrial vegetation (Hodelka et al., Reference Hodelka, McGlue, Zimmerman, Ali and Tunno2020). Thus, it is more likely that changes in the MONO15 pollen were more strongly influenced by direct changes in climate or ecological interactions than by autogenic effects of lake-level fluctuations until the end of the Pleistocene.
Terrestrial ecosystem development around Mono Lake
Community composition
The MONO15 pollen assemblage records a mixed vegetation community of Sierran (e.g., Abies, Corylus, Tsuga mertensiana, and Sequoiadendron-type), Great Basin (e.g., Ephedra and Sarcobatus), and cosmopolitan (e.g., Artemisia, Ambrosia, Poaceae) taxa around Mono Lake during the last deglaciation. The dominance of Pinus, Artemisia, and Cupressaceae pollen in the MONO15 core suggests that extensive woodlands surrounded the lake during the late Pleistocene. However, establishing the species composition of the Pleistocene woodlands around Mono Lake is difficult due to the low taxonomic resolution of both Pinus and Cupressaceae pollen. Pinus pollen identified in the MONO15 record was dominantly P. subg Pinus (diploxylon) type, suggesting the Sierran taxa Pinus jeffreyi and P. contorta var. murrayana (Anderson and Davis, Reference Anderson and Davis1988). Less common occurrences of Pinus subg. strobus (haploxylon) type could include P. flexis, P. albicaulis, or P. monticola (Hansen and Cushing, Reference Hansen and Cushing1973; Anderson and Davis, Reference Anderson and Davis1988). Macrofossil evidence shows all of the Pinus species mentioned above were present in the eastern Sierra Nevada since at least the Early Holocene (Anderson, Reference Anderson1990a, Reference Anderson1996). It is unlikely Pinus monophyla was a source of haploxylon pollen to Mono Lake because macrofossil evidence suggests that this species was confined further south, and first appeared on Bodie Hills around the Middle Holocene (Nowak et al., Reference Nowak, Nowak, Tausch and Wigand1994; Halford, Reference Halford1998; Cole et al., Reference Cole, Fisher, Ironside, Mead and Koehler2013).
Cupressaceae pollen taxonomy is also difficult to infer (Bouchal and Denk, Reference Bouchal and Denk2020) because multiple species of Juniperus as well as Calocedrus decurrens are present in the Sierra Nevada/Mono Lake region. On the Volcanic Tablelands 60 km south of Mono Lake, Juniperus osteosperma has been present since at least ca. 20,000 cal yr BP at 1,300 m asl (Jennings and Elliot-Fisk, Reference Jennings and Elliott-Fisk1993). Both Juniperus osteosperma and J. occidentalis macrofossils are found in late Pleistocene middens from around Winnemucca Lake (Lake Lahontan basin; Thompson et al., Reference Thompson, Benson and Hattori1986; Nowak et al., Reference Nowak, Nowak, Tausch and Wigand1994), 230 km north of Mono Lake. To our knowledge, there are no late Pleistocene macrofossil studies that have been conducted closer to Mono Lake, which makes it difficult to further clarify the origin of Cupressaceae pollen. However, both juniper species are found in Mono Basin today at different elevations along with the smaller shrub Juniperus communis. It is possible that both juniper trees co-occurred around Mono Lake similar to the Lahontan Basin (Thompson et al., Reference Thompson, Benson and Hattori1986).
The curious case of giant sequoia
The presence of Sequoiadendron-type pollen at Mono Lake during the late Pleistocene is an intriguing biogeographic enigma (Davis, Reference Davis1999a; this study). During the Miocene to early Pliocene, Sequoiadendron was common throughout much of the Great Basin (Axelrod, Reference Axelrod1986), but at present, Sequoiadendron is confined to only ~70 small groves in the western Sierra Nevada between 1400 m and 2200 m elevation (Hartesveldt et al., Reference Hartesveldt, Harvey, Shellhammer and Stecker1975). These groves are fragmented into two distinct zones. The southern zone, from 35°N to 36.5°N, contains most individuals in larger groves, while the northern zone contains just a few isolated and small groves up to 39°N (Hartesveldt et al., Reference Hartesveldt, Harvey, Shellhammer and Stecker1975; Fig. 1). Mono Lake sits over the Sierra Crest east of the northern Sequoiadendron zone and ~70 km from the nearest modern Sequoiadendron grove. Despite the isolated geographic distribution, Davis (Reference Davis1999a) surprisingly reported Sequoiadendron-type pollen from Mono Lake during the latest Pleistocene at values of ≤20% of the terrestrial pollen sum, similar values to those from modern groves (Anderson, Reference Anderson1990b). In our deep-water MONO15 record, Sequoiadendron-type pollen was also consistently present, but at ≤5% abundance. The consistent presence of Sequoiadendron-type pollen across the Sierra Crest near the very fragmented and isolated northern end of its modern range hints at major biogeographic reorganizations of this iconic species.
Here, we present and discuss two plausible hypotheses to explain the presence of Sequoiadendron-type pollen: (1) the pollen was locally produced within ~10s of kilometers of Mono Lake, or (2) the pollen was produced by expanded populations of Sequoiadendron in the western Sierra Nevada and transported 70–100s of kilometers across the Sierra Crest. Evidence in favor of a local population includes a limited number of studies that have shown Sequoiadendron pollen is only locally dispersed within ~1–10 km of the individual trees. Anderson (Reference Anderson1990b) examined the modern pollen rain surrounding two Sequoiadendron groves, and showed limited pollen dispersal within a kilometer of the grove boundaries. More recently, a genetic study by DeSilva and Dodd (Reference DeSilva and Dodd2020) has echoed the pollen rain findings of Anderson (Reference Anderson1990b), and indicated that the genetic connectivity (i.e., pollen dispersal) between Sequoiadendron trees is limited to 6–11 km, depending on the size of the groves. The high abundance of Sequoiadendron-type pollen at Mono Lake and poor pollen dispersal of Sequoiadendron as shown by Anderson (Reference Anderson1990b) led Davis (Reference Davis1999a) to suggest the possibility that Pleistocene refugial populations of Sequoiadendron existed in the eastern Sierra Nevada until the warm and drier Early Holocene. These modern analog studies, although limited, would suggest the high abundances of Sequoiadendron-type pollen within Mono Lake were produced by nearby Sequoiadendron trees.
However, other pollen records from near Mono Lake (e.g., Black Lake, Barrett Lake, Tioga Pass Pond; Fig. 1) do not record Sequoiadendron-type pollen during the terminal Pleistocene (Batchelder, Reference Batchelder1970; Anderson, Reference Anderson1990a). The only other Pleistocene occurrence of Sequoiadendron-type pollen in the eastern Sierra Nevada is at Owens Lake, where Woolfenden (Reference Woolfenden2003) reported sporadic Sequoiadendron-type pollen over the last 180,000 years, including during the last deglaciation. The sporadic occurrences in the Owens Lake record are more likely to be the result of long-distance transport because nearby middens clearly show that Great Basin-like vegetation assemblages of Juniperus spp. and Pinus monophylla dominated the valley floor (Koehler and Anderson, Reference Koehler and Anderson1994). Yet, at the higher elevation and more-northward Mono Lake, conditions for Sequoiadendron may have been more tolerable. During the Pleistocene, the major limiting factor for potential Sequoiadendron populations at Mono Lake was likely minimum temperatures because this determines the modern upper-elevation limit of modern Sequoiadendron groves (Hartesvedlt et al., Reference Hartesveldt, Harvey, Shellhammer and Stecker1975). The modern groves have mean annual temperatures between 7–12°C, close to those of the Mono Basin at present (Fig. 2), while chironomid temperature reconstructions from Hidden Lake, 50 km north and 300 m higher than Mono Lake, show a 3°C temperature decrease during the last deglaciation (Potito et al., Reference Potito, Porinchu, MacDonald and Moser2006), still potentially within the tolerance of Sequoiadendron. Given that the eastern Sierra Nevada has far steeper and, consequently, smaller zonal stratification along elevation than the gently sloping western Sierra, any potential Sequoiadendron individuals would have been confined to small refugia.
The alternative hypothesis is that Sequoiadendron pollen was transported at least ~100 km across the Sierra Crest during the late Pleistocene, facilitated by expanded populations, stronger westerly or southwesterly winds, and a more open landscape during the late Pleistocene. Pollen and macrofossil records from King's Canyon, Nicholas Meadows, and Exchequer Meadows show that Sequoiadendron had an expanded distribution during the late Pleistocene in the western Sierra Nevada (Cole, Reference Cole1983; Davis and Moratto, Reference Davis and Moratto1988; Koehler and Anderson, Reference Koehler and Anderson1994), potentially down to the Sierran foothills where pollen was transported to Tulare Lake in the San Joaquin Valley (Davis, Reference Davis1999b). Furthermore, Sequoiadendron pollen is small (20–30 μm) and could theoretically be transported longer distances than modern observations suggest if environmental conditions were favorable. For example, if southwesterly winds were common, just to the south of Mono Lake, the San Joaquin ridge of the Sierra Crest is lower than much of the surrounding divide and could allow for long-distance transport of pollen across the glaciated Sierra Nevada.
Other pollen types, particularly bisaccate gymnosperm pollen such as that from Pinus and other prolific pollen producers like Quercus, must have been transported across the divide as well under such conditions. However, the DCA ordination shows Pinus and Quercus pollen plot opposite Sequoiadendron about the origin, suggesting the taxa have inversely related abundances (Supplemental Figure 4). This is reflected in the biostratigraphy because Pinus is less common during the Pleistocene (x̄ = 65%) than the Holocene (x̄ = 86%), while pollen types almost certainly reflecting local vegetation are proportionally higher during the Pleistocene (e.g., Artemisia and Sarcobatus; Figs. 4, 5). Similarly, Quercus has relatively constant abundances in the MONO15 core, suggesting a constant influx of long-distance-transported pollen, while Sequoiadendron-type pollen abundance gradually declines until extirpation from the record at ca. 9,500 cal yr BP.
Without additional evidence, particularly from plant macrofossils, we cannot draw a definitive conclusion. In either scenario, the consistent presence of Sequoiadendron-type pollen in the MONO15 record for over 6,000 years during deglaciation has important implications for the biogeographic history of the species because few pollen records are available from nearby disjointed, northern groves (Fig. 1). The extirpation of Sequoiadendron-type pollen at Tulare Lake between 10,000 and 9,000 cal yr BP (Davis, Reference Davis1999b; Fig. 1A) is remarkably similar in timing to the Mono Lake records (Davis, Reference Davis1999a; this study), and suggests a major contraction in the distribution of Sequoiadendron associated with the Holocene transition. Future work on characterizing a fundamental climate niche for Sequoiadendron and a better understanding of its pollen and seed dispersal could also help clarify this enigma. Given that Sequoiadendron grove boundaries have remained largely static or even contracted since their discovery by Euro-Americans in the 1850s (Stephenson, Reference Stephenson and Aune1994), it may be that Late Holocene environmental conditions already exceeded Sequoiadendron's preferred climate niche well before the onset of the Anthropocene warming.
Ecosystem development during deglaciation
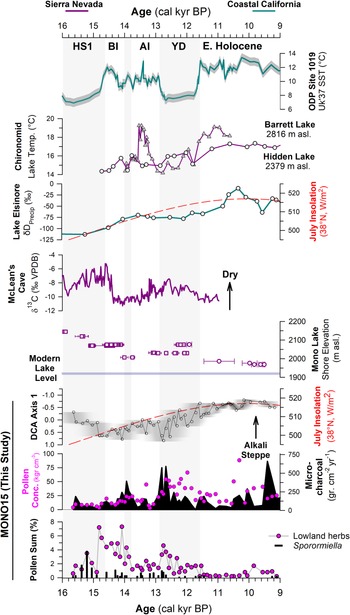
The MONO15 pollen record demonstrates distinct sensitivities of vegetation to both rapid and orbitally paced climate change (Figs. 4, 6). Prior studies have shown clear connections between hydroclimate change in the central Sierra Nevada and Pacific Ocean conditions (Benson et al., Reference Benson, Linsley, Smoot, Mensing, Lund, Stine and Sarna-Wojcicki2003; Potito et al., Reference Potito, Porinchu, MacDonald and Moser2006; Street et al., Reference Street, Anderson and Paytan2012). However, in the central Sierra Nevada, vegetation responses to the rapid hydroclimate changes of the last deglaciation have remained unclear or muted (Mensing, Reference Mensing2001; MacDonald et al., Reference MacDonald, Moser, Bloom, Porinchu, Potito, Wolfe, Edwards, Petel, Orme and Orme2008). At Mono Lake, DCA axis-1 scores, when plotted as a time series, capture a gradual decline of wooded lowland communities dominated by Pinus and Cupressaceae, and replacement by more arid Amaranthaceae- and Sarcobatus-dominated steppe. This pattern was likely a response to increased summer temperatures and the gradual northward migration of winter storm tracks across coastal California following the retreat of the Laurentide and Cordilleran Ice Sheets (Kirby et al., Reference Kirby, Feakins, Bonuso, Fantozzi and Hiner2013; Feakins et al., Reference Feakins, Wu, Ponton and Tierney2019; Fig. 6).
Comparison of regional hydroclimate proxies and the MONO15 record. Records from the Sierra Nevada are purple and pink, and marine and coastal records are teal. From top to bottom: sea-surface temperature (SST) record from ODP site 1019 (Barron et al., Reference Barron, Heusser, Herbert and Lyle2003; Praetorius et al., Reference Praetorius, Condron, Mix, Walczak, McKay and Du2020); chironomid temperature records from Barrett Lake, California (MacDonald et al., Reference MacDonald, Moser, Bloom, Porinchu, Potito, Wolfe, Edwards, Petel, Orme and Orme2008) and Hidden Lake, California (Potito et al., Reference Potito, Porinchu, MacDonald and Moser2006); leaf-wax δD record from Lake Elsinore, California, indicating gradual northward migration of winter storms (Kirby et al., Reference Kirby, Feakins, Bonuso, Fantozzi and Hiner2013; Feakins et al., Reference Feakins, Wu, Ponton and Tierney2019); speleothem δ13C record of moisture from McLean's Cave, California (Oster et al., Reference Oster, Montañez, Santare, Sharp, Wong and Cooper2015); Mono Lake hydrograph during deglaciation (Ali, Reference Ali2018) with squares (U-series) and circles (radiocarbon). Results from the MONO15 core, DCA axis-1 time series with the age-model uncertainty of the core superimposed (grey shading); microcharcoal influx (black shading) and pollen concentrations (pink dots); lowland herb pollen (Asteraceae, Poaceae, and Ambrosia pollen) and Sporormiella abundance. Gray bars indicate cold periods from the NGRIP δ18O record (Rasmussen et al., Reference Rasmussen, Andersen, Svensson, Steffensen, Vinther, Clausen and Siggaard-Andersen2006). HS1—Heinrich stadial 1, BI—Bølling interstadial, AI—Allerød interstadial, YD—Younger Dryas stade.

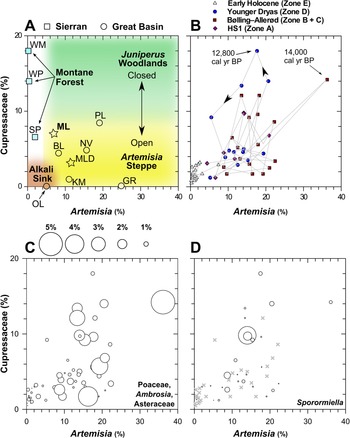
The relationship between Artemisia and Cupressaceae pollen at Mono Lake and regional sites in the Great Basin and Sierra Nevada. (A) Conceptual diagram for interpretating the relative dominance and canopy dynamics of Juniperus woodlands and Artemisia Steppe defined by regional lake and wetland core-top pollen abundances. Stars indicate the modern pollen spectrum at Mono Lake (ML, this study; MLD, Davis, Reference Davis1999a). (B) MONO15 pollen data showing inferred Juniperus and Artemisia canopy dynamics through the last deglaciation, HS1—Heinrich stadial 1. (C) MONO15 herbaceous pollen taxa (Poaceae, Ambrosia, and Asteraceae) of each sample plotted as bubble sizes, reflecting understory plants. (D) MONO15 Sporormiella abundances plotted as bubble size; x symbols show pollen samples with no Sporormiella. At Mono Lake, Cupressaceae pollen increased after major increases in microcharcoal during the onset of stadial events such as the Younger Dryas (ca. 12,800 cal yr BP) and Older Dryas (ca. 14,000 cal yr BP). BL—Black Lake, GR—Gund Ranch, KM—Kingston Meadow, NV—Newark Valley Pond, OL—Owens Lake, PL—Pyramid Lake, SP—Starkweather Pond, WM—Wawona Meadow, WP— Woski Pond.

The basal ca. 1,000 years of the pollen record (15,600 cal yr BP to 14,700 cal yr BP) show low pollen and microcharcoal concentrations, which suggests vegetated areas within Mono Basin were likely reduced because of recently deglaciated canyons (Rood et al., Reference Rood, Burbank and Finkel2011) and lowlands inundated by a highstand of Mono Lake at ca. 16,000 cal yr BP (Ali, Reference Ali2018). Unglaciated highlands around Mono Lake were likely dominated by alpine and subalpine communities, consistent with Great Basin plant macrofossil data showing subalpine vegetation assemblages from 1,800 m asl to 2,200 m asl. (Thompson, Reference Thompson, Betancourt, Van Devender and Martin1990). Elevated Amaranthaceae, Sarcobatus, and Cyperaceae pollen suggests a patchwork of Alkaline Sink steppe and marshes developed within the basin as the lake gradually regressed from the highstand until ca. 14,000 cal yr BP (Ali, Reference Ali2018; Fig. 6). The presence of Quercus and Corylus pollen in this interval suggests nearby chaparral on dry soils. High Sporormiella abundances indicate relatively high megafauna activity around the lake from 15,400 cal yr BP to 15,000 cal yr BP, perhaps tracking the progressive increase in lowland vegetation.
DCA axis 1 shows major turnover of pollen taxa between two samples taken 8 cm apart at 904 cm to 896 cm composite-core depth, when pollen concentrations and microcharcoal influxes increased. The age-depth model indicates an age of 14,800 (15,400–14,200 cal yr BP) cal yr BP for these samples, although the chronological control in that interval of the core is poor. The appearance of Tsuga mertensiana and Ceanothus pollen suggests the establishment of montane forest communities within the basin (Anderson and Davis, Reference Anderson and Davis1988). Similarly, lowland herb and shrub pollen of plants found in woodland understories (Barbour et al., Reference Barbour, Keeler-Wolf and Schoenherr2007), such as Poaceae, Ambrosia, and Asteraceae, also increased. We find no evidence of a sedimentary hiatus between the two samples, suggesting this major vegetation turnover occurred rapidly. It could potentially record a response to the onset of rapid warming and hydroclimate changes of the Bølling interstadial, the influence of which has been documented by paleoclimate records throughout the western US (e.g., Oster et al., Reference Oster, Montañez, Sharp and Cooper2009, Reference Oster, Montañez, Santare, Sharp, Wong and Cooper2015; Wagner et al., Reference Wagner, Cole, Beck, Patchett, Henderson and Barnett2010; Heusser et al., Reference Heusser, Kirby and Nichols2015; Feakins et al., Reference Feakins, Wu, Ponton and Tierney2019). Paleoshoreline records show Mono Lake stabilized during much of the Bølling interval (Ali, Reference Ali2018), probably because of higher influx of glacial meltwater from retreating Tioga glaciers (Schaefer et al., Reference Schaefer, Denton, Barrell, Ivy-Ochs, Kubik, Andersen, Phillips, Lowell and Schlüchter2006; Rood et al., Reference Rood, Burbank and Finkel2011) balancing the increased evaporation. As a result, riparian zones featuring Salix also expanded (Fig. 4). The decrease in Sporormiella likely reflected a reduction in the activity of megafauna around the lake. A peak in microcharcoal and a spike in Artemisia and Cupressaceae pollen at 14,100 (14,700–13,500 cal yr BP) cal yr BP could record a brief signal of ecosystem change in response to the short, Older Dryas stade, although it is seen in only one pollen sample (Fig. 6).
The brief rise in Cupressaceae pollen between ca. 12,800 cal yr BP to 12,500 cal yr BP may reflect an expansion of Juniperus woodlands near the onset of the Younger Dryas due to an increase in precipitation and decrease in temperatures, which is shown by hydroclimate proxies nearby at Barrett Lake and Starkweather Pond (MacDonald et al., Reference MacDonald, Moser, Bloom, Porinchu, Potito, Wolfe, Edwards, Petel, Orme and Orme2008). A peak in microcharcoal is also observed near the onset of the Younger Dryas, similar to other records in the western US (Marlon et al., Reference Marlon, Bartlein, Walsh, Harrison, Brown, Edwards and Higuera2009). However, the overall trend in pollen turnover, reflected by DCA axis 1, shows the Younger Dryas to be a transitional period consisting of two distinct phases. DCA axis-1 scores show high pollen turnover from 12,800 cal yr BP to 12,000 cal yr BP. A second possible phase occurred from ca. 12,500 cal yr BP to 11,500 cal yr BP, when Amaranthaceae and Sarcobatus pollen increased. Sporormiella abundance also declines at the onset of the Younger Dryas, indicating an extirpation of many megafauna herbivores, and is consistent with the last appearance datum of many megafauna species throughout the western US (Grayson, Reference Grayson2016).
From 11,500–10,300 cal yr BP (Zone E2), the MONO15 pollen record was probably autogenically influenced by the lake regression (Ali, Reference Ali2018). However, the extirpation of Sequoiadendron-type and Corylus pollen shown in both the MONO15 and Davis (Reference Davis1999a) cores probably reflects the end of chaparral and Sierran montane vegetation communities near Mono Basin. Cupressaceae pollen abundance fell below modern levels (Fig. 4), indicating a decline in Pinus-Juniperus woodlands within the basin, perhaps resembling the very heterogenous distribution found in the Late Holocene (Constantine, Reference Constantine1993). From 10,300 cal yr BP to the end of the pollen record at 9,100 cal yr BP, several pollen types increase slightly, including Amaranthaceae, Sarcobatus, Artemisia, and Purshia-Cercocarpus type, all suggesting the dominance of semiarid vegetation like that found today (Fig. 4). Prior studies at high-elevation lakes in the eastern Sierra Nevada show that Early Holocene vegetation communities were open, wooded environments dominated by Pinus, Quercus, and shrubs, also suggesting dispersal upslope and stratification of vegetation previously found in Mono Basin (Anderson, Reference Anderson1990a; Davis, Reference Davis1999a; MacDonald et al., Reference MacDonald, Moser, Bloom, Porinchu, Potito, Wolfe, Edwards, Petel, Orme and Orme2008). Early Holocene dryness has been observed throughout the Sierra Nevada and Great Basin (Davis and Moratto, Reference Davis and Moratto1988; Anderson and Smith, Reference Anderson and Smith1994; Mensing, Reference Mensing2001; Brugger and Rhode, Reference Brugger and Rhode2020), based on the decline in mesophilic arboreal taxa at lower elevations and the establishment of the semiarid vegetation assemblages seen today. Similarly, the complete absence of Sporormiella from 11,500–9,200 cal yr BP captures the final extirpation of Pleistocene megafauna in the basin, also consistent with the last appearance dates of megafauna fossils found in the Great Basin (Grayson, Reference Grayson2006).
Climate change effects on canopy dynamics and megafauna
Around Mono Lake, the response of the terrestrial ecosystem to climate transitions was characterized by rapid changes in the relative abundances of Pinus, Cupressaceae, Artemisia, and herbaceous pollen (Poaceae, Asteraceae, and Ambrosia). These pollen types represent the major constituents of lowland, wooded ecosystems, and their variability likely captures reorganization of the canopy structure in response to hydroclimate changes. In particular, the increase in Cupressaceae and herbaceous pollen produce similar patterns to climate transitions documented in isotope records in California at McLean's Cave (Oster et al., Reference Oster, Montañez, Santare, Sharp, Wong and Cooper2015), Barrett Lake (MacDonald et al., Reference MacDonald, Moser, Bloom, Porinchu, Potito, Wolfe, Edwards, Petel, Orme and Orme2008), and Lake Elsinore (Heusser et al., Reference Heusser, Kirby and Nichols2015). Large peaks in microcharcoal at ca. 14,000 cal yr BP and ca. 12,900 cal yr BP suggest that these vegetation changes were associated with more wildfires around Mono Lake.
A proposed scheme for understanding the dynamics of Pleistocene Juniperus woodlands around Mono Lake and their decline into the early Holocene is shown in Figure 7. Modern pollen assemblages from core-top samples from throughout the western Great Basin and Sierra Nevada (Table 1) show low Cupressaceae pollen abundances (<5%), reflecting the sparse patchwork of modern juniper-pinyon woodlands interspersed within Artemisia steppe on Great Basin landscapes today (Fig. 7A). The abundance of Artemisia pollen reflects the presence of Artemisia plants within the sagebrush steppe. Artemisia pollen abundances are near zero in the drier, lower elevation Alkali Sink steppe, and increase to nearly 20% in sagebrush-dominated environments.
In stark contrast, late Pleistocene MONO15 samples show Cupressaceae pollen abundances of 20%, particularly during the early phase of the Younger Dryas and Bølling-Allerød interstadial (Fig. 7B). During these periods, Cupressaceae abundances fluctuated while Artemisia pollen abundances remained relatively constant. This suggests that Juniperus woodlands expanded and contracted within an otherwise sagebrush-dominated landscape, resulting in alternately more open- or closed-canopy structure around Mono Lake. During events such as the early Younger Dryas, an increase in charcoal is followed by an increase in Cupressaceae pollen (Fig. 7B). More frequent burning of sagebrush steppe likely resulted in increased abundances of herbaceous types like Poaceae, Asteraceae, and Ambrosia (Fig. 7C). This suggests that greater effective moisture provided more fuel to enhance fire activity, followed by a rapid expansion of juniper at the expense of sagebrush, a process that is ongoing in the modern Great Basin (Romme et al., Reference Romme, Allen, Bailey, Baker, Bestelmeyer, Brown and Eisenhart2009).
Major vegetation and climate change during the last deglaciation has also been invoked to explain the decline and extinction of Pleistocene megafauna in North America (Gill et al., Reference Gill, Williams, Jackson, Lininger and Robinson2009; Faith, Reference Faith2011; Meltzer, Reference Meltzer2015). The early Holocene contraction of Juniperus woodlands would have put pressure on megafauna populations as food resources found in the woodland ecosystem declined. Lowland herb and shrub pollen abundances during periods of high Artemisia and Cupressaceae pollen imply that most of the pollen was produced by understory plants growing within the juniper-sage communities (Fig. 7C). Sporormiella decreased in two steps at 14,800 (15,400–14,200 cal yr BP) cal yr BP and 12,800 (13,200–12,100 cal yr BP) cal yr BP before its last appearance at 11,500 (11,900–11,050 cal yr BP) cal yr BP. The timing suggests a connection with vegetation and wildfire changes observed in the pollen record, implying climate and vegetation change may have been the major drivers of the megafauna decline near the onset of the Bølling interstade and Younger Dryas. For example, after the Sporormiella decline, lowland herb (Artemisia, Asteraceae, and Poaceae) and shrub (Artemisia and Ceanothus) pollen rapidly increased in abundance. This pollen abundance increase could indicate a release from intensive herbivory (e.g., Gill et al., Reference Gill, Williams, Jackson, Lininger and Robinson2009; Fig. 6). Prior work from the Great Basin has suggested that megafauna populations were low in comparison to the Mojave Desert to the south (Grayson, Reference Grayson2016). This appears to be reflected in limited Sporormiella presence in pollen studies from Great Basin wetlands (e.g., Gund Ranch; Brugger and Rhode, Reference Brugger and Rhode2020). Yet, the high and relatively consistent presence of Sporormiella in Mono Lake sediments indicates higher megafauna activity, and implies that the rim of the Great Basin and Sierra Nevada may have provided more suitable habitats for megafauna than the central Great Basin.
CONCLUSIONS
The MONO15 core pollen record documents both multi-millennial and centennial responses of vegetation, fire, and megafauna activity to major environmental changes around Mono Lake from 15,600–9,100 cal yr BP. The pollen record documents the presence of a mixed assemblage of Sierran and Great Basin plants around Mono Lake during the late Pleistocene, likely supporting substantial populations of mammalian megafauna. Comparison to a littoral record by Davis (Reference Davis1999a) suggests minimal influence of lake level on the pollen record until the Early Holocene. Moreover, both pollen records feature the consistent presence of Sequoiadendron-type pollen, hinting at an expanded Pleistocene Sequoiadendron population. Pinus- and Cupressaceae-dominated woodlands and Artemisia steppe surrounding Mono Lake gradually declined and retreated to higher elevations as temperatures increased and available moisture decreased into the Early Holocene, tracking higher summer insolation. However, this gradual transition was punctuated by periods of rapid structural changes in Pinus-Juniperus-Artemisia communities as wildfire activity and hydroclimate rapidly changed landscape openness. These vegetation and wildfire changes appear to have had major effects on megafauna activity surrounding Mono Lake. Sporormiella declined in a stepwise fashion at 14,800 (15,400–14,200 cal yr BP) cal yr BP and 12,800 (13,200–12,100 cal yr BP) cal yr BP before its disappearance at 11,500 (11,900–11,050 cal yr BP) cal yr BP, all associated with episodes of major vegetation and wildfire changes. Although the age-depth model has relatively high uncertainties during the late Pleistocene, the succession of vegetation communities and turnover mirrors that of the onset of the Bølling-Allerød interstadial, Younger Dryas, and the Early Holocene recognized from regional speleothems and other geochemical records. Overall, the late Pleistocene Pinus-Juniperus-Artemisia communities around Mono Lake proved resistant to rapid climate change and increased wildfire while Pleistocene conditions of high available moisture remained. However, the onset of sustained dryness and higher summer temperatures during the Early Holocene produced major biogeographic changes, replacing the mixed wooded Sierran and Great Basin vegetation with the more zonal modern communities of sagebrush and Alkaline Sink steppe.
Acknowledgments
We thank the LacCore Facility for core curation and processing guidance. We are grateful to R.S. Anderson and the members of the Penn State Paleobiology Seminar for discussion, and G.H. Ali for providing lake-level data and constructive comments on early drafts of the manuscript. We thank two anonymous reviewers and Wyatt Oswald and Nicholas Lancaster for their feedback, and our friend O.K. Davis for inspiration.
Financial Support
This work was supported by funding from The Pennsylvania State University, the University of Kentucky, and NSF award 1829093. Radiocarbon dating was conducted at Lawrence Livermore National Laboratory under grant 17-ERD-052 to S.R.H. Zimmerman; this is LLNL-JRNL-820887.
Data Availability Statement
All palynological and geochronology data from the MONO15 core will be submitted to the Neotoma Paleoecological Database for public access.
Supplementary Material
The Supplementary Material for this article can be found at https://doi.org/10.1017/qua.2022.70


 Open access