

The course of racial politics in the United States changed abruptly between the passage of the Civil Rights Act of 1964 and the Fair Housing Act of 1968. In August 1965 the torching and looting of the Watts area of Los Angeles was the opening salvo in a series of major urban riots.Footnote 1 The 1960s riots were neither the first nor the last race-related “civil disturbances” in American cities in the twentieth century, as examples in the 1910s, 1940s, and more recently vividly attest. Still, in sheer frequency and overall destructiveness the 1960s riots were historically unique. It is not surprising that the riots loom large in historical accounts of race and cities in the 1960s—it is difficult to ignore major cities in flames—but scholars have not explored the extent to which the 1960s riots affected the course of urban economies. Did the riots truly matter in this sense, or should economic historians think of them as violent sideshows to the real drama of urban economic change? Forty years after Watts, the economic legacy of the 1960s riots remains unclear.Footnote 2
The question is important because the riots may have influenced a wide variety of urban issues that preoccupied scholars and policymakers at the time and that continue to do so today. The popular media have linked the riots anecdotally to the concentration of poverty in urban black neighborhoods, the fiscal problems of inner cities, crime, “white flight,” and racial disparities in housing outcomes, but without solid evidence of causality or estimates of magnitude.Footnote 3 The economics and sociology literatures have discussed many factors that influenced urban economic and demographic trends after World War II, including changes in technology, crime, and housing and transportation policy. But nowhere, in our view, has the existing literature adequately assessed the impact of the riots.Footnote 4
This article studies the riots' effects through the lens of owner-occupied property values. Property values are especially useful in this context because they capture a broad range of local characteristics and amenities. Like other assets, the current value of a house represents the discounted value of the expected net flow of utility associated with its ownership, including not only the physical quality of the structure, but also security (and risk); proximity to work, family, friends, and entertainment; the quality of municipal services; and the taxes required to support such services. In theory, if a riot causes a sustained decline in perceived amenities (broadly defined) in one location relative to others, we should be able to detect a relative decline in property values.Footnote 5 It is entirely plausible, however, that a riot's effect on perceived amenities is small and short-lived, in which case any impact on property values would be transitory. Further, under certain conditions, with large transfers of federal or state resources, a riot's effect might even be positive.
Our primary empirical analysis uses city-level data on median values of owner-occupied housing from the 1950 to 1980 censuses in conjunction with measures of riot severity. We focus on the 1960s and 1970s because the historical legacy of the riots is typically debated within this time frame and because longer-run outcomes are likely to be clouded by additional shocks and factors that could confound our measurements (for example, the spread of crack cocaine). Our identification strategy is two-pronged: first, in an ordinary least squares framework, we measure the correlation between riot severity and property value trends, controlling for city-level variables that may have been associated with a greater likelihood of rioting; and second, we employ an instrumental variables strategy that plausibly isolates exogenous variation in riot severity. Our principal finding is that both moderate and severe riots reduced the growth rate of housing values between 1960 and 1980. The negative effects were most stark for homes owned by African-Americans, but they are also visible in overall property-value trends.
The bulk of the article is devoted to the task of measuring the riots' effects on property values by making comparisons across cities. In the article's final section, however, we discuss the causal pathways that might underlie our central empirical findings. In particular, we discuss the demand-driven nature of the property value declines, the relative strength of the effects on black-owned properties, and the persistence of the effects beyond the 1960s. In this context, census tract-level data provide a more detailed portrait of postriot change within a handful of major cities.
THE 1960s RIOTS
The United States has a long history of violent, race-related civil disturbances.Footnote 6 Prior to the 1940s, most cases of such violence were instigated by whites who attacked blacks, as in the infamous 1863 draft riot in New York City and the 1921 Tulsa riot. In 1943 there was an outbreak of riots that in character, if not in number, bear a somewhat closer resemblance to those that occurred in the 1960s, including violent clashes between black civilians and police, looting of retail establishments, and arson. Even against the backdrop of the 1943 riots, the 1960s riots were historically unprecedented—in the space of just a few years, hundreds of riots erupted across the country. Although most of the 1960s riots did not involve massive loss of life or property destruction, several riots were extremely serious by any metric.
Sociologists have carefully compiled information on the timing and severity of race-related civil disturbances in the 1960s and early 1970s. They have done so with the study of the causes of riots in mind, including several statistical studies of cross-city differences in riot occurrence and severity that we discuss in more detail in what follows.Footnote 7 The main sources of information about the riots are the Congressional Quarterly's Civil Disorder Chronology (1967), the Kerner Commission Report (1968), reports in the New York Times, and the “Riot Data Review” compiled by the Lemberg Center for the Study of Violence at Brandeis University. Each primary source used somewhat different definitions of a riot, collected different dimensions of data, and covered different time frames, but the combination of information provides a detailed picture of riot activity in this period.
The standard academic definition of a 1960s race-related riot, as put forth originally by Seymour Spilerman in two seminal studies, was a “spontaneous event” with at least 30 participants, some of whom were black, that resulted in property damage, looting, or other “aggressive behavior.”Footnote 8 Disturbances that were directly associated with organized Civil Rights protests, or that occurred in school settings are excluded. Gregg Carter subsequently extended Spilerman's original data set to 1971, verified it by checking alternative sources (when available), and in general, refined the database for subsequent studies.Footnote 9 Carter's data set begins in 1964 and includes the dates and locations of more than 700 civil disturbances, as well as the associated number of deaths, injuries, arrests, and occurrences of arson.
We rely on the Carter data to construct a cumulative index of riot severity in each city. Specifically, we assign each riot (indexed by j) a value S j = ∑i (X ij / X iT) where X ij is a component of severity (i indexes deaths, injuries, arrests, arson, and days of rioting) and X iT is the sum of component X ij across all riots. S j is the proportion of all riot deaths that occurred during riot j, plus the proportion of all riot injuries that occurred during riot j, plus the proportion of all arrests, and so on. Summed over all riots, there are five total index points, reflecting the five components that enter the calculation. For each city, we add the index values for each riot that occurred in that city to form a cumulative riot severity measure.Footnote 10
The index has some potential shortcomings. Counts of destructive events do not necessarily correspond closely to economic damage, nor to people's perceptions of the event's severity and implications. Therefore, it is possible that potentially important components are missing from the index, or that given the existing components, some should weigh more heavily than others to capture the true severity of the event.Footnote 11 However, the individual components of the index are strongly positively correlated, and so in practice it matters little if we reweight them in various ways.Footnote 12 Moreover, the composite index makes it quantitatively clear that some cities experienced much more severe riots than others. Rather than rely heavily on the exact index values to measure the riot effects, we rely primarily on comparisons across cities grouped by degree of severity.
Table 1 summarizes the riot data by index component, year, and census region. Riots occurred throughout the eight-year period, but the bulk of riot activity was concentrated in just two years, 1967 and 1968 (accounting for 3.3 out of 5.0 index points). When the index numbers are arrayed by census region, there appears to be a comparatively even geographic spread of riot activity.Footnote 13 This impression is somewhat misleading because the “severity” was heavily concentrated in a relatively small number of events and cities, not spread evenly over them. For example, no deaths occurred in 91 percent of the 752 riots underlying Table 1, and 90 percent of the riots have severity index values of less than 0.01. By far, the deadliest riots were in Detroit in July 1967 (43 deaths), Los Angeles in August 1965 (34 deaths), and Newark in July 1967 (24 deaths). Using the index as a broader severity measure, the riot in Washington, D.C. following Martin Luther King's assassination (S = 0.34) joins Los Angeles in 1965 (0.48), Detroit in 1967 (0.44), and Newark in 1967 (0.23) as the most severe events on record.
THE RIOTS OF THE 1960s, FREQUENCY AND SEVERITY
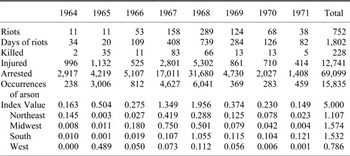
Notes:
See the text for the definition of a riot. Each riot (j) is assigned a value S j = ∑i (X ij / X iT) where X ij is a component of severity (days of rioting, injuries, arrests, deaths, and arsons) and X iT is the sum of X ij across all riots. Summed over all riots in the dataset, there are five total index points (a reflection of the five components that enter the index).
Source:
The data underlie Carter, “1960s Black Riots,” and were received through personal communication.
CITY-LEVEL EMPIRICAL STRATEGY AND RESULTS
To study the riots' effects, we combine the city-level riot severity measures already described with city-level data from the published volumes of the 1950, 1960, 1970, and 1980 censuses, including median property values for black households and for all households. Our sample includes the 104 cities that had at least 100,000 residents and that reported the median property value for nonwhites in 1960.Footnote 14 Our analysis starts with an emphasis on the city-level data for two reasons. First, the existing social science literature on the causes of the riots has generally relied on city-level data as an appropriate unit of analysis. For consistency with that literature, therefore, we also use city-level data. Second, because the existing public-use microdata sample for the 1960 census does not include city codes, it is impossible to use household-level data to conduct a consistent, comprehensive analysis that spans the full 1950 to 1980 period.Footnote 15
The city-level data pertain to residents of central cities rather than to residents of entire metropolitan areas. In the years we study, the median value variable is based on self-reported estimates of the current value of residential property, including both the land and the house. Although there may be errors in any given individual's estimate, it is likely that such errors average out over large numbers of home owners in a city, and if there is any bias, we have no reason to think that the bias changed over time.Footnote 16
Three additional measurement issues merit attention. First, even though levels of residential segregation were quite high in this period, the median black central-city home owner might not reside very close to the epicenter of the riots. Therefore, the change in median black-owned property value might not capture changes in value in the areas of the city most directly affected by riot activity. Second, a “filtering” process, in which blacks buy formerly white-owned housing of relatively high quality, could have accelerated in cities with severe riots if whites increased their rate of out-migration from such cities. Third, as mentioned already, the riots might have changed perceptions about amenities in all central cities, even those with relatively little riot activity. To the extent that these three considerations come into play, they are likely to diminish the magnitude of measured riot effects in the framework we describe below. Therefore, we regard our estimates as conservative.
Ordinary Least Squares
We begin by estimating the following basic specification by ordinary least squares over the 1960 to 1970 or the 1960 to 1980 period, where i indexes a particular city, and ΔV is the change in log median residential property value for black home owners or for all home owners (separate values for whites are not reported in the census volumes).
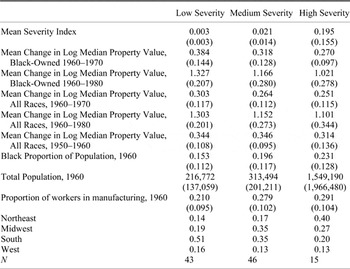
In the most parsimonious regression specification, the set of X-characteristics includes the city's total population (1960) and the black proportion of the city's population (1960). Region is a set of dummy variables for census regions. The Riot variable reflects the severity index described previously. We group cities into three riot severity categories, and we enter dummy variables for “medium severity” and “high severity” in the regressions. The distribution of the riot index across cities is highly skewed—a large number of cities had minor riots, and a small number had quite severe ones. Therefore, the low-severity category includes all cities below the fiftieth percentile in the index (0 to 0.009); the medium-severity category includes the fiftieth to the eighty-eighth percentile (0.009 to 0.07); and the high-severity category includes cities above the eighty-eighth percentile (0.07 to 0.52).Footnote 17 This strikes a reasonable balance between parsimony (with relatively few observations) and flexibility in describing the data.Footnote 18 Although the high-severity category is relatively small, the cities in it account for about 70 percent of all riot activity in the sample (as measured by the severity index).
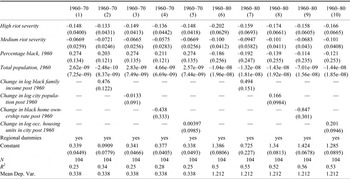
Table 2 presents summary statistics by severity group for the cities that enter the regressions. The average increase in log black-owned property values from 1960 to 1970 was approximately 0.07 higher in low-severity cities than in medium severity cities, and 0.11 higher in low-severity cities than in high-severity cities. The differences in property value changes are larger over the 1960 to 1980 period; black property values in low-severity cities increased by 0.16 more than in medium-severity cities and by 0.31 more than in high-severity cities.
SUMMARY STATISTICS, CITY-LEVEL DATA, BY SEVERITY GROUP
Notes:
The sample for the summary statistics is the same as that in city-level regressions. The sample excludes cities with missing values for any of the variables. Standard deviations are in parentheses.
Source:
See Table 3a
The exogeneity of variation in riot severity is a key concern in interpreting these differences in property-value trends. Table 2 suggests that the city-groups had roughly similar pre-1960 trends in property values (ranging from 0.31 to 0.35), but it is clear that the groups differed in a number of potentially relevant dimensions. As noted, social scientists have long tried to identify city-level factors associated with the incidence and severity of riots in the 1960s. The typical approach has been to predict the likelihood or severity of rioting as a function of city-level characteristics drawn from the 1960 or 1950 published census volumes. In general, the results suggest that after accounting for each city's black population size and region, very little variation in severity can be accounted for by preriot city-level measures of African-Americans' economic status (for example, median income) either in absolute terms or relative to whites.Footnote 19 Thus, Spilerman concludes that “the severity of a disturbance, as well as its location, appears not to have been contingent upon Negro living conditions or their social or economic status in a community.”Footnote 20 The point is not that the 1960s riots had nothing to do with blacks' economic status in the United States, but rather that the variation in riot severity across places was highly unpredictable (beyond region and black population size).
This interpretation is consistent with detailed chronologies that suggest that severe riots were highly idiosyncratic events.Footnote 21 That is, in many cases, there were identifiable, idiosyncratic “sparks” that, through a series of unforeseen complications, turned a routine event into a minor altercation, and a minor altercation into a full-blown riot. In Watts, the arrest of an intoxicated black motorist led to a wider altercation with neighborhood residents and eventually an enormous riot. In Detroit, a raid on a “blind pig” (an after-hours drinking establishment) escalated into the decade's deadliest riot. In Newark, rioting commenced after the arrest (and rumored beating) of a taxi driver.
If, conditional on black population size and region, variation in riot severity is largely unpredictable, then the parsimonious OLS regression described by equation 1 may provide a reliable estimate of the riots' effect on property values. Given the existing body of research on the causes of the riots, the identifying assumption that there are no omitted city-specific factors that affected property values and that are correlated with the severity of riots is defensible on a priori grounds. However, we do not need to maintain this assumption, and can check the robustness of estimates of β 3 to the inclusion of several additional city characteristics in the regression.
Specifically, we add control variables for the proportion of employment in manufacturing industries (1960), the level of SMSA residential segregation (1960), the crime rate per 100,000 population (1962), and the trend in the log median value of all residential properties over the 1950 to 1960 period.Footnote 22 Cities with large manufacturing sectors circa 1960 might have been differentially affected by de-industrialization, and it is possible that the associated labor demand shifts made riots more likely and (independent of riots) depressed property values.Footnote 23 Likewise, cities with high levels of residential segregation and crime might have been more prone to riots and subject to forces that subsequently depressed property values. Finally, pre-existing trends (1950–1960) in property values should capture otherwise unobserved trends in the relative attractiveness of cities.
Table 3a reports OLS results for the 1960 to 1970 period, and Table 3b reports results for the 1960 to 1980 period. In column 1 of Table 3a, we estimate that during the 1960s, black property values fell by about 7 log points in medium-severity and 15 log points in high-severity riot cities relative to low-severity riot cities (the omitted category). The regression specification in column 2 includes the additional control variables for manufacturing employment, pre-1960 property value trends, crime, and residential segregation (a dissimilarity index). The results indicate that, ceteris paribus, cities with comparatively strong housing value growth from 1950 to 1960 continued to have relatively strong growth in the 1960s (at least among blacks), and that cities with relatively high levels of segregation in 1960 subsequently experienced relative declines in black property values. The preriot crime rate appears to have had no significant influence on subsequent changes in property values. Most importantly for the purposes of this investigation, the negative and significant coefficient estimates on the riot variables are not undermined or significantly changed in magnitude in column 2—there is still strong evidence of a negative correlation between riots and post-1960 black-owned property value trends. Columns 3 and 4 of Table 3a indicate that median property values for samples of all owner-occupied housing fell by about 4 log points in the medium-severity cities and 10 log points in the high-severity cities relative to low-severity cities in the 1960s.Footnote 24
RIOTS AND PROPERTY VALUES, CITY-LEVEL DATA, 1960–1970
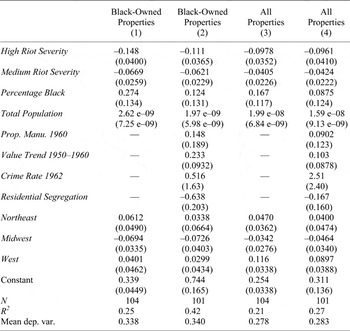
Notes:
Robust standard errors are in parentheses. The property value trends for 1950 to 1960 are for all owner-occupied properties in the city (even for columns 1 and 2). Black-specific trends cannot be discerned for many cities for 1950 to 1960 due to incomplete reporting in the 1950 census volumes. The residential segregation variable is a dissimilarity index; see Cutler, Glaeser, and Vigdor, “Rise.” Regional assignment follows census convention. Following the Federal Bureau of Investigation's Uniform Crime Reports, the crime rate is the ratio of total crimes in 1962 (excluding larceny under $50) to total population in 1960; Montgomery, Alabama's figure is based on 1961 crime data.
Source:
Property values are from the published volumes of the federal censuses of population and housing. Manufacturing and population variables for 1960 are based on census data and taken from issues of the U.S. Department of Commerce, County and City Data Book (tabulated in ICPSR 7735 and checked against data compiled by Michael Haines). Riot severity measures are based on data underlying Carter, “1960s Black Riots.” The crime rate data for 1962 are tabulated from the Federal Bureau of Investigation's Uniform Crime Reports, table 41. The dissimilarity indices are from Cutler, Glaeser, and Vigdor, “Cutler/Glaeser/Vigdor Segregation Data.”
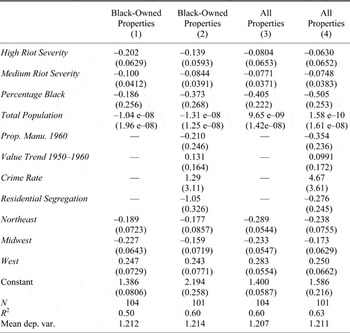
There is no evidence in Table 3b (estimated over the 1960 to 1980 period) that black property values in riot-torn cities bounced back relative to others during the 1970s. If anything, the point estimates for the 1960–1980 period are somewhat larger in magnitude than for the 1960–1970 period. In the medium-severity cities, on average, black property values fell by eight to ten log points relative to the omitted category between 1960 and 1980. The point estimates for the average decline in black home values in the high-severity cities range from 14 to 20 log points. The estimated effects on overall property values (columns 3 and 4) are smaller than for black property values, especially in the high severity cities.
Given our reliance on decennial census data and pre-1960 trends to control for initial conditions, it is very difficult to rule out unobserved factors operating between 1960 and 1965 that could have influenced housing markets. However, we can include a control variable for the change in state-level personal income per capita compiled by the Bureau of Economic Analysis as a rough gauge of changes in local economic conditions just prior to the riots.Footnote 25 Doing so has little effect on the riot coefficients in the base specifications of Tables 3a and 3b.
We have tested the robustness of the OLS estimates in several additional ways. Excluding cities with relatively small black populations (less than 10,000 in 1960) or relatively large black populations (more than 500,000) has little impact on the OLS riot coefficients.Footnote 26 Omitting any one of the high severity cities has little impact on the riot coefficients. Splitting the full sample into nonsouthern and southern segments dramatically reduces the sample size but does not undermine the significant negative relationship between riots and changes in black property values. Quantile regressions of the base specifications, which are less sensitive to outliers, yield riot coefficient estimates that are similar to the OLS results. Finally, albeit imperfectly, we have assembled data on urban renewal projects at the state level to see if such programs confound our estimates of the riot effects on property values. In specifications similar to the base regressions in Tables 3a and 3b, entering the value of urban renewal grants approved (cumulative to the end of 1970) per urban resident has little effect on the size or significance of the coefficients on riot severity.Footnote 27
Controlling for Postriot Changes in Economic Variables
The riots may have affected a broad range of post-1960 economic variables in cities. Therefore, in Tables 3a and 3b we have not controlled for contemporaneous and potentially endogenous changes in black family income, the number of housing units or people in the city, or the black home ownership rate.Footnote 28 Nonetheless, doing so might shed light on the correlates of postriot property devaluation, the channels through which riots affected property values, and the potential for alternative hypotheses to explain the property value declines.
Table 4 reports results for black-owned housing. Adding contemporaneous controls to the base specifications of Tables 3a and 3b has a minimal effect on the riot variables' coefficients. Black family income trends, for example, have a strong positive correlation with contemporaneous black property values (Table 4, columns 2 and 7). This accounts for a small portion of the existing correlation between black property values and severe riots, but the riot coefficients are still large, negative, and statistically significant. Likewise, the change in the black home ownership rate is negatively correlated with the change in black property values, and this tends to diminish the riot coefficients, but only slightly. Thus, it seems unlikely that large changes in the sample composition of black-owned properties associated with the filtering of housing are driving the correlation between riots and observed black property values.Footnote 29 Finally, adding controls for either the change in the supply of housing or the change in city-wide population does not undermine the strength of the correlation between riots and black-owned property values.
RIOTS AND BLACK-OWNED PROPERTY VALUES, CITY-LEVEL DATA WITH POST-1960 CONTROLS
Notes:
See the notes to Table 3a. Following the census, we define the home ownership rate as the ratio of the number of owner occupied housing units inhabited by black households to the total number of housing units occupied by black households. The phrase “post 1960” implies 1960 to 1970 in columns 1 to 5 and 1960 to 1980 in columns 6 to 10.
Source:
See the sources for Table 3a.
Again, given the endogeneity of post-1960 economic variables to the occurrence of riots, we do not attach causal interpretations to the coefficients reported in Table 4. Rather, the main point is that changes in relevant contemporaneous variables are not primarily responsible for the strong correlation between riots and relative declines in property values. The riots coefficients are not simply picking up the influence of other post-1960 economic trends.
Two Stage Least Squares Approach
In Tables 3a and 3b, the inclusion of several city-specific variables should mitigate concerns that unobserved factors correlated with riot severity had an independent influence on post-1960 property value changes. Alternatively, we can pursue an instrumental variable approach that isolates plausibly exogenous variation in riot severity to measure the riot effect. In this case, a viable instrumental variable should influence the severity of riots but should not have an independent influence on long-run trends in property values.
Our first instrument is rainfall in the month of April 1968. Martin Luther King was assassinated on 4 April 1968, and subsequently more than 100 riots erupted. Thus, a specific, identifiable event greatly increased the likelihood of rioting during the month.Footnote 30 There is considerable anecdotal evidence that, in general, people are less likely to engage in collective violence when it rains. Sidney Fine refers to an event in Detroit in 1966 as “the riot that didn't happen” because rainfall helped defuse an emerging riot; he writes, “The major ally of the police and the few peacemakers that night was a steady, drenching rain.”Footnote 31 The New York Times reported that on 10 August 1968, after two days of riots in Miami, heavy rains kept the streets empty. Dade County's sheriff referred to the rainfall as “beautiful” and joked that all off-duty police had been assigned to pray for more rain.Footnote 32
In August 1969 the New York Times cited a Washington community activist who claimed that rainfall had “nipped one riot in the bud.”Footnote 33 The Kerner Commission report, in discussing a riot in Plainfield, New Jersey, noted that late one night “a heavy rain began, scattering whatever groups remained on the streets,” although the rioting recommenced the next afternoon (when it was not raining).Footnote 34 More recently, after riots in Benton Harbor, Michigan in the summer of 2003, a CNN.com headline read “Rain, curfew help bring quiet night to Benton Harbor.”Footnote 35 Finally, the U.S. Army's field manual for dealing with civil disturbances (FM 19-15) suggests that spraying water may be highly effective as “a high-trajectory weapon, like rainfall” especially in cool weather.Footnote 36
Our second instrumental variable relates to the organizational form of each city's government, and in particular, whether or not the city was administered by a city manager in 1960 (rather than a mayor). We believe that this predetermined feature of city government did not have a direct effect on changes in property values in the 1960s, and that therefore, it is a legitimate instrumental variable. It certainly appears to be a poor predictor of property value trends in the 1950s: a regression of change in property values from 1950 to 1960 on the city manager variable, region dummies, population, and black proportion of the population yields a small and statistically insignificant coefficient on the city manager dummy variable (–0.0037, standard error = 0.16). At the same time, it is plausible that city managers, who were supposed to apply professional administrative skills to government operations, defused local racial tensions underlying riots more effectively than mayors did.Footnote 37 Mayors' incentives in this period may have been strongly tied to the votes of local, ethnic white, central-city residents, many of whom held unfavorable views of racial integration and of African-Americans.Footnote 38 Professional city managers, though certainly not immune from local political pressures, faced a broader labor market for their services, one in which their reputation for competent management was paramount.
The OLS results in Tables 3a and 3b suggest that the riots' effects were nearly linear in “severity group”—that is, the high severity coefficient is nearly twice the size of the medium severity coefficient (and both are expressed relative to the low severity group). For the two-stage least squares (2SLS) estimates, therefore, we assign the low riot intensity cities a severity value of zero, medium intensity riot cities a severity value of one, and high intensity riot cities a severity value of two, and then we instrument for severity-group using the rainfall variable and the city manager dummy. Strictly speaking, we only need one instrument for identification with this particular specification, but having multiple instruments allows us to perform an over-identification test (described below). Nonetheless, we acknowledge that our interpretation of the city manager variable given above is speculative, and therefore we discuss some results obtained using only the rainfall instrument. We also check results using the raw severity index as the key independent variable, rather than “severity group.”
The basic first-stage regression results, which we report in column 1 of Table 5, indicate that rainfall in April 1968 and the presence of a city manager are useful predictors of variation in riot severity (additional controls include region dummies, city size, and black proportion of population). Both the rainfall and city manager coefficients are negative, indicating that riot severity was lower in cities with a lot of rainfall in April 1968 and a city-manager form of local government. The F-statistic for the joint significance of the two coefficients is 5.5 (p-value = 0.006) and the partial R-squared on the excluded instruments is 0.08. Thus, there is some scope for weak-instrument bias in the two-stage least squares estimates.Footnote 39
RIOT SEVERITY AND INSTRUMENTAL VARIABLES
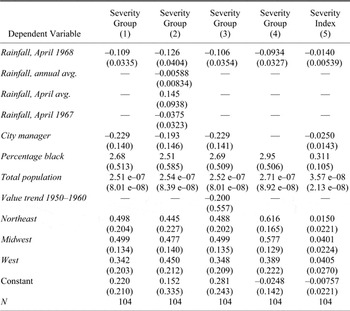
Notes:
Robust standard errors are in parentheses. See the text for discussion of severity group variable: group 2 consists of high severity riot cities; group 1 consists of medium riot cities. The construction of the index is described in detail in the text. Column 1 is the first-stage regression corresponding to the 2SLS results in columns 2 and 5 of Table 6. Column 3 is the first-stage regression corresponding to the 2SLS results in columns 3 and 6 of Table 6.
Source:
The city manager instrumental variable is from Aiken and Alford, Governmental Units. Rainfall data for April 1968 and April 1967 are from National Oceanic and Atmospheric Administration, “Climate Data Online.” Average annual rainfall for the 1931–60 period is from U.S. Department of Commerce, County and City Data Book. Average rainfall for the month of April was collected interactively from www.weather.com (details available from the authors on request). See the notes to Table 3a for sources of other variables.
Our interpretation of the rainfall instrument hinges on its timing (April 1968) relative to the King assassination and the subsequent riots. One might argue, however, that cities in which it rained a lot in April 1968 also had a lot of rain in April in other years, or on average throughout the year. However, as shown in column 2 of Table 5, average annual rainfall, average April rainfall, and rainfall in April of 1967 are poor predictors of riot severity compared to the April 1968 variable. Our instrument, in other words, is not merely picking up an incidental correlation between raininess (even in April) and riot proneness—it is rainfall in April 1968 that matters. Furthermore, in a reduced-form regression of change in black property value (1960–1970) on rainfall in April 1968, average annual rainfall, and region indicators, the April 1968 rain coefficient is 0.0219 (standard error = 0.0106). For 1960–1980, the coefficient is 0.0283 (standard error = 0.0167). That is, conditional on region and average annual rainfall (or rainfall in April 1967), cities with more rain in April 1968 had larger gains in black property values after 1960—it is difficult to imagine a source for such a correlation aside from our hypothesized link between rain and riot severity. Column 3's specification is similar to that in column 1, but it includes the pre-1960 property value trend; the coefficients on rainfall and city manager are nearly identical to those in column 1. Column 4 is similar to column 1, but it excludes the city manager variable; the rainfall coefficient is only slightly changed. Finally, in column 5, we use the actual severity index (rather than severity group) as the dependent variable. The coefficient on April 1968 rainfall is −0.0140 (standard error = 0.00539) and on city manager of −0.0250 (standard error = 0.0143). In sum, the relationship between rainfall in April 1968 and riot severity is robust.
We report the 2SLS regression results in Table 6, along with OLS specifications for comparison. Columns 1 and 4 are estimated by OLS and yield results that are similar to those implied by the first columns of Tables 3a and 3b; this suggests that the replacement of the severity dummies with the severity-group variable (with values zero, one, and two) is a reasonable simplification. Like the OLS results, the 2SLS coefficients (columns 2, 3, 5, and 6) are uniformly negative, implying that riot severity reduced property value appreciation.Footnote 40 The 2SLS coefficient estimates are larger in magnitude than the OLS coefficient estimates. Because the standard errors of the 2SLS coefficients are relatively large, one should be cautious not to over-emphasize the point estimates' magnitude relative to the OLS coefficients. However, a possible explanation is that our measure of severity is only a proxy for true severity (as perceived by residents at the time) and that the 2SLS approach mitigates this measurement error.Footnote 41
RIOTS AND BLACK-OWNED PROPERTY VALUES, OLS AND 2SLS ESTIMATES
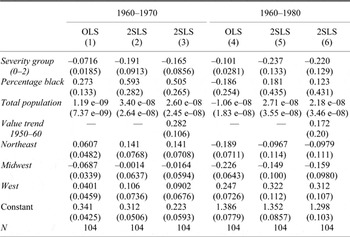
Notes:
Robust standard errors are in parentheses. See the text for discussion of severity group variable: group 2 consists of high severity riot cities; group 1 consists of medium riot cities. In columns 2, 3, 5, and 6 rainfall in April 1968 and the presence of a city manager instrument for the riot severity group. The implicit first-stage regression for columns 2 and 5 is reported in Table 5, column 1. The implicit first-stage regression for columns 3 and 6 is reported in Table 5, column 3.
Source:
The city manager instrumental variable is from Aiken and Alford, Governmental Units. Rainfall data are from the National Oceanic and Atmospheric Administration, “Climate Data Online.” See the notes to Table 3a for sources of other variables.
When only the rainfall instrument is used (the stronger of the two instruments, with an F-statistic of 8.2) in regressions similar to those in columns 2 and 5 of Table 6, we get somewhat larger coefficients on the severity-group variable: β riot = −0.26 (standard error = 0.14) for 1960–1970; β riot = −0.40 (standard error = 0.23) for 1960–1980. Lastly, to check the sensitivity of the basic results to the way we have specified the 2SLS regressions, we have run 2SLS regressions using the raw index of riot severity as the key independent variable (ranging from 0 to 0.5, with mean at 0.04). Again, the results indicate a negative effect on black property values: β riot = −1.60 (standard error = 0.80) for 1960–1970; β riot = −2.06 (standard error = 1.23) for 1960–1980. At the mean index value of the medium-severity group, the coefficients imply losses of 0.034 (1960–1970) and 0.044 (1960–1980); at the mean index value of the high-severity group, the coefficients imply losses of 0.31 (1960–1970) and 0.40 (1960–1980).Footnote 42
Summary: City-Level Results
From each empirical point of view—simple summary statistics, OLS estimates, and 2SLS estimates—the riots are associated with relative declines in black-owned central-city property values. This negative impact manifests itself despite a number of potential biases that could mitigate the estimates, such as intercity spillovers from the riots that may have made all central cities appear less economically attractive than before the wave of riots.
The aggregate effect of the riots on black property values, although felt most strongly in a relatively small number of cities, appears to have been economically significant. To approximate this aggregate effect, we use the results from column 1 of Table 3a and calculate the predicted log value of black-owned housing in 1970 for each city. We also calculated a counterfactual level by adding the estimated “riot loss” back on to the predicted values of cities with medium or high severity riots. After converting from log values, we averaged the predicted actual and counterfactual black-owned property values across cities, weighting by the number of black homeowners in each city in 1970. We assume that the riots had no effect on cities in the “low severity” category, and therefore we believe the counterfactual is a conservative estimate of the loss. Because we are averaging counterfactual medians across cities, the results should be interpreted as no more than a rough guide to the cumulative effects implied by the coefficients. The weighted average of black-owned home values in 1970 is $15,200 in the “no riot” counterfactual compared to $13,700 in the actual data, implying a riot-induced loss of approximately 10 percent.Footnote 43
DISCUSSION OF RESULTS AND EVIDENCE FROM CENSUS TRACTS
Our main explanation for the results described above is straightforward: the occurrence of riots resulted in sharp and persistent declines in the demand for housing in riot-afflicted areas relative to nonriot areas. In this section we discuss why we believe the negative effects on housing values were primarily demand driven, why they were evidently greater for African-Americans, and why they persisted for at least a decade. In this context, census tract-level data provide a more detailed portrait of post-riot change within a handful of major cities. It remains difficult to prioritize factors within the list of potential demand-side channels, but we speculate that unobservable changes in people's perceptions regarding security, risk, and local amenities were paramount.
In principle the relative decline in housing prices could have occurred because of an increase in relative housing supply or decrease in housing demand. Evidence at both the city-level and tract-level favors the hypothesis of a demand-driven price decline. Recall that in Table 4 of the city-level analysis adding a control variable for the post-riot change in the number of housing units had little effect on the strongly negative riot coefficients. If supply changes had been key to driving the differential price trends across cities, the riot coefficients should have been sharply reduced in that specification. Moreover, from both historical and theoretical perspectives, it is difficult to believe that the riots could have provoked a strongly positive supply-side reaction, unless met by massive government building programs (which did not occur).
We looked more closely at patterns of change within cities using census tract-level data (a “tract” is the closest census unit to a “neighborhood,” usually having about 4,000 residents and separated from other tracts by major streets, streams, or other divisions). This approach is difficult because relatively few riots had their areas of activity carefully recorded and because changes in tract boundaries over time complicate the task of forming consistent comparisons.Footnote 44 Nonetheless, for the cities with the four largest riots (Newark, Washington, Detroit, and Los Angeles) and for Cleveland (also in the “high severity” category), we have been able to carefully match extant maps of riot activity to census-tract data.Footnote 45 We cannot be sure that the same criteria and care went into the preparation of each map, but for the sake of identifying “riot areas” we believe that the maps provide the best available information.
The most detailed analysis is possible for property values in Cleveland and Newark because we can accurately trace median values in each census tract from 1950 through 1980 without serious concern arising from changes in tract boundaries.Footnote 46 Starting with Cleveland, we ask whether median property values declined in the area of the Hough riot (1966) relative to other parts of Cleveland. The results are in panel a of Table 7.Footnote 47 The inclusion of the pre-1960 value trend slightly diminishes the riot coefficient (comparing columns 2 and 3), whereas adjusting for the black proportion of the tract's population nearly halves the coefficient. Even with these adjustments, in both column 3 and 4, the value of property in the Hough area declined sharply relative to other parts of Cleveland.Footnote 48
TRACT-LEVEL PROPERTY VALUE CHANGES, CLEVELAND AND NEWARK, 1960–1980

Notes:
The dependent variable is the change in log median value of owner occupied housing in a tract between 1960 and 1980. Observations are weighted by the number of owner-occupied units reporting value in the tract in 1960. Robust standard errors are in parentheses. Value trend and population change are calculated as changes in log values. The sample includes tracts in the central city (not suburbs). Some tracts do not have median value reported for 1950, and so the sample is smaller in columns 2 to 5 than in column 1. In Newark, tracts 48 and 75 both split in two between 1950 and 1960; we impute a 1950 value for each part (for example, 48.1 and 48.2) by aggregating the split tracts in 1960 (into 48) and then assuming that between 1950 and 1960 each part (48.1 and 48.2) trended like the aggregate tract (48).
Source:
Unless otherwise noted, the tract data are from the published volumes of tract-level information of the United States Department of Commerce, Bureau of the Census, various years (details available from the authors on request). The 1950 value figures for Newark are average values (rather than medians) and are from the block-level volume of the housing census for Newark. Comparable averages where computed for Newark in 1960 (to calculate the 1950–1960 trend) from the computer files of Bogue, Census Tract Data (ICPSR study 2932). Population and proportion black in Newark in 1960 are also from Bogue; population for Newark in 1980 is from U.S. Department of Commerce, Census of Population and Housing, 1980 (ICPSR study 8071).
Panel b reports similar regressions for tracts in Newark. In columns 1 and 2, the unadjusted decline in property values in riot tracts relative to nonriot tracts was smaller in Newark than in Cleveland. As in Cleveland, controlling for the pre-existing trend in value has little influence on the riot coefficient in column 3, whereas controlling for the proportion black in 1960 halves the riot coefficient in column 4 (from 0.21 to 0.12). Even so, the riot coefficient remains statistically and economically significant.Footnote 49
William Collins and Fred Smith provide additional detail in a case study of rioting and property values in Cleveland.Footnote 50 They measure the straight-line distance from Hough Avenue and 79th Street, the epicenter of riot activity in Cleveland, to the center of each census tract. In the 1950s, there was no correlation between distance, as just defined, and housing value changes, but between 1960 and 1980, changes in housing values were strongly positively related to distance from the riot. Collins and Smith also show that population change in Cleveland was positively related to distance from the riot epicenter.
One must be wary about making general inferences on the basis of case studies, but in combination with other evidence, the neighborhood-level property value trends in Table 7 suggest that the riots' effects were most strongly felt in the immediate vicinity of the violence (even after controlling for pre-existing trends and demographic characteristics).
For each of the five cities we can study tract-level population changes. We report tabulations for riot and nonriot tracts by city in Table 8.Footnote 51 The riot tracts unambiguously lost population relative to the nonriot tracts in these cities between 1960 and 1980, by approximately 30 percent (when summed across cities). Relative losses are apparent in every city despite substantial differences across cities in terms of total population trends (for example, the total population of Los Angeles continued to grow while that of Detroit did not). The relatively minor destruction of residential property during the riots cannot directly account for such large population shifts, and pre-existing population trends do not suggest that the riot tracts were uniformly losing population relative to other tracts prior to the riots.Footnote 52
POPULATION CHANGES BY CENSUS TRACTS IN SELECTED CITIES
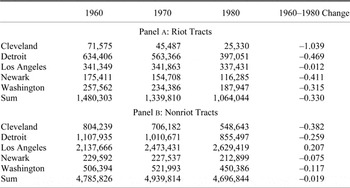
Notes:
Riot tracts were identified by matching maps of riot areas from various sources with census tract maps. This procedure is imperfect due to differences in riot map production and changing census tract boundaries. “Change” is calculated as the difference in the natural log of the population level at each point in time.
Source:
The map for the Los Angeles riot is from the Governor's Commission on the Los Angeles Riots, Violence in the City; the map for Newark and Detroit's riots are from U.S. Senate, Committee on Government Operations, Permanent Subcommittee on Investigations, Riots; the map for Washington's riot is from Gilbert, Ten Blocks; the tracts involved in the Hough riot of Cleveland were identified by Smith (“Real Estate Values” and personal correspondence). The census tract data were extracted from U.S. Department of Commerce data files in ICPSR studies 7552 (1960 census), 9014 (1970 fourth count population summary tape), and 8071 (1980 census). Data for Newark in 1960 are from Bogue, Census Tract Data (ICPSR study 2932).
The tract data are helpful in two ways. First, the patterns are consistent with a demand-driven relative price decline (falling population and prices), but not with a supply-driven price decline. Second, the patterns suggest why the previous section's city-level investigation found relatively large effects on black-owned property values: in cities with sizable civil disturbances large portions of the black population resided in the vicinity of the riots, and the negative impact of the riots was felt most strongly in those communities. In 1960, 64 percent of Detroit's black population lived in tracts that would be riot-affected; in Los Angeles, the corresponding figure was 63 percent; in Newark, 77 percent; in Washington, D.C., 45 percent; and in Cleveland, 21 percent resided in the Hough riot area (and many more were very close). Even at their most intense, the 1960s riots did not touch large numbers of people directly in the sense of injury, death, arrest, and personal property destruction. But it appears that many African-Americans must have been indirectly affected—the mayhem occurred not far from their doorsteps.
After the wave of 1960s riots passed, we found no evidence of a bounce back during the 1970s in the city-level data, particularly among black-owned property values. This persistence could be an indication of slow re-adjustment of perceptions in the postriot period (without true changes in each city's economic fundamentals), or it could indicate that certain places experienced real and lasting declines in local amenities relative to other places. A general theoretical mechanism for such endogenous and persistent decline is through external “neighborhood effects” in the context of racially segregated housing markets.Footnote 53 In either case, a sustained negative shift in perceived local amenities would translate directly into lower property values, particularly in the context of housing markets where the downward adjustment of the stock is slow.Footnote 54
It seems unlikely that any single factor can explain the shift in perceptions and, hence, demand. To the extent that proximity to the riots was viewed as a harbinger of persistently higher risk, demand for housing almost certainly would fall. Perceptions of risk are difficult to observe, but this factor's importance is strongly suggested by the fact that insurance rates and security costs for small businesses rose after the riots, and by evidence that city-level spending on police and fire protection also increased. Such risks also apparently registered in the minds of investors: in August and November of 1967, the New York Times reported on investors' negative views regarding the municipal bonds of cities that had riots.Footnote 55 Local amenities such as access to retail establishments are also valued by households. J. J. Launie; Howard Aldrich and Albert Reiss; and Jonathan Bean have documented that small businesses, especially retail establishments, were more likely to go out of business in riot-afflicted neighborhoods, thereby reducing access to shopping and other retail services.Footnote 56 Finally, households value proximity to earnings opportunities, and in related work we have shown that the riots may have had a negative effect on the incomes of black households.Footnote 57
Another potential pathway is that central-city residents may have perceived an increased cost to racial diversity following a riot, such as potentially higher property taxes and more redistribution toward predominantly black neighborhoods.Footnote 58 Recent work by Leah Boustan has examined differences in housing prices in the 1960s and 1970s in border neighborhoods between central cities and suburbs.Footnote 59 At such borders, political control changes abruptly but housing quality changes smoothly (if at all). Boustan finds that increased racial diversity (percentage black) in central cities was associated with a decrease in housing values on the city side of the border (that is, relative to the suburbs); in this regard, the “discount” for racial diversity was larger in cities that had experienced a severe riot.
CONCLUSION
In the 1960s numerous cities in the United States experienced violent, race-related civil disturbances. In the immediate aftermath of the riots, government at all levels responded with blue-ribbon panels that studied the causes and offered policy recommendations. After the Watts riot, for example, the California Governor's Commission recommended a number of interventions to improve the quality of life of ghetto residents. Three years later, President Johnson's National Advisory Commission on Civil Disorders (the “Kerner Commission”) concluded its report with a chapter of “Recommendations for National Action” aimed at improving the economic outcomes of African Americans in central cities thereby (presumably, to the commission) reducing the chances of a future disturbance.Footnote 60 Following in the wake of government commissions, social scientists have long studied the underlying causes of the riots, but the economic consequences have received far less attention.
This article has examined census data from 1950 to 1980 to gauge the impact of the 1960s riots on the value of residential property, paying special attention to black-owned property value trends. Precisely measuring the riots' economic effect is difficult because the existing data are imperfect, the riots may have been endogenous, and a host of other factors influenced urban economies at the same time. But we believe that the potential econometric problems are not overwhelming, and nearly all of the evidence we have uncovered points in the same direction. We find significant differences in black-owned property value trends in cities that had medium or severe riots compared to cities with minor disturbances. The relative depression of black-owned property values in riot-torn cities was apparent by 1970, and there was little or no rebound during the 1970s. Even when instrumented using plausibly exogenous variation in weather and city-government structures, the riots appear to have had strong negative effects on black-owned property values.
The results are consistent with a significant and persistent decline in relative demand for residence in the places where riots occurred. We believe that changing perceptions of local amenities, including personal and property security, were important factors in driving the decline in demand. From this perspective, our finding (in the city-level analysis) that riots had relatively strong effects on black-owned property values makes sense and squares well with our tract-level case studies—riot activity was concentrated in and around neighborhoods where many African-Americans lived, and property value and population losses show strong signs of localization. Concerns about additional taxes and redistribution may have also played a role in the decline in demand and the depression of housing values relative to other cities, but if this were the dominant factor we would have anticipated less evidence of strongly localized effects within the cities (in this scenario, the net tax-and-transfer would have been least favorable in neighborhoods that were far from the riots). We admit that this prioritization of factors within the demand side is speculative. Future research and more detailed case studies may help clarify the factors underlying the riots' effects.
Residential segregation, urban decay, white flight, and the concentration of poverty in ghetto neighborhoods did not start with the 1960s riots, and so we caution against ascribing too much influence to the riots. Nonetheless, it does appears that the riots left long-lasting, economically significant, negative imprints on the cities and neighborhoods in which they occurred. They vividly illustrated the depth and danger of the social forces that cleaved the United States in the 1960s, and for many places they may have strengthened and accelerated a process of endogenous economic decline.
Appendix
RIOTS AND BLACK-OWNED PROPERTY VALUES, OLS, 2SLS, AND LIML ESTIMATES

Notes:
Robust standard errors are in parentheses. See the text for discussion of severity group variable: group 2 consists of high severity riot cities; group 1 consists of medium riot cities. In columns 2, 3, 5, and 6 rainfall in April 1968 and the presence of a city manager are the instrumental variables. Columns 3 and 6 are estimated using limited information maximum likelihood (LIML) rather than two-stage least squares. LIML is less susceptible to bias from weak instruments.
Source:
The city manager instrumental variable is from Aiken and Alford, Governmental Units. Rainfall data are from National Oceanic and Atmospheric Administration, “Climate Data Online.” See the notes to Table 3a for sources of other variables.


