

Inflammation and oxidative stress are key mechanisms in the pathogenesis of disease states such as cancer, diabetes mellitus and CVD. An effective prevention strategy against these diseases may be a diet enriched or supplemented with flavonoids such as quercetin. Quercetin is a member of the flavonoid subgroup, flavonol, and is found in a variety of foods such as tea, onions, apples, peppers, blueberries and dark green vegetables(1). Quercetin has been demonstrated by in vitro, animal and epidemiological studies to have diverse and wide-ranging physiological effects including anti-oxidative(Reference Ciz, Pavelkova and Gallova2–Reference Dias, Porawski and Alonso4), anti-inflammatory(Reference Comalada, Camuesco and Sierra5–Reference Nair, Mahajan and Reynolds7), anti-pathogenic(Reference Chiang, Chiang and Liu8–Reference Dimova, Mugabowindekwe and Willems13), immune regulatory(Reference An, Zhang and Wu14–Reference Nair, Kandaswami and Mahajan16), anti-carcinogenic(Reference Knekt, Kumpulainen and Jarvinen17, Reference Neuhouser18), cardioprotective(Reference Erdman, Balentine and Arab19, Reference Mink, Scrafford and Barraj20) and pro-mitochondrial biogenesis(Reference Davis, Murphy and Carmichael21) influences. Few human quercetin supplementation studies, however, have been conducted, with reported findings of a modest reduction in blood pressure and little or no effect on blood lipid profiles, or inflammatory and oxidative stress biomarkers(Reference Edwards, Lyon and Litwin22–Reference Boots, Drent and de Boer29).
Metabolomics, the measurement of small molecules or metabolites present in biological samples such as biofluids, tissues and cellular extracts, is a useful tool in understanding the effects of a particular stimulus on metabolic pathways. In nutritional sciences, its use is gaining momentum because of the ability to detect subtle permutations that are not captured by traditional biomarkers, and thus improve our understanding of the health benefits of flavonoids and their underlying molecular pathways(Reference Zulyniak and Mutch30). Bakker et al. (Reference Bakker, van Erk and Pellis31) provide a good example of the utility of metabolomics. In this nutrigenomic analysis in overweight men with mildly elevated C-reactive protein, metabolomics captured significant changes in 135 metabolites including several inflammatory metabolites. These data provided insight into the impact of an anti-inflammatory flavonoid mixture on low-grade inflammation(Reference Bakker, van Erk and Pellis31), which was largely missed by traditional inflammatory biomarkers. To our knowledge, metabolomic shifts in human subjects after quercetin supplementation have not been examined.
The metabolic transformation of quercetin has been analysed in only a few human studies. Quercetin in aglycone form is typically used in tissue culture studies but is not present in human plasma(Reference de Boer, Dihal and van der Woude32, Reference Loke, Proudfoot and McKinley33). In comparison to quercetin aglycone, quercetin conjugates are more water soluble and have diminished anti-inflammatory and anti-oxidative effects in vivo, which may explain the lack of significant findings in human studies(Reference Loke, Proudfoot and McKinley33, Reference Santos, Rodriguez-Gomez and Justino34). Two short-term human studies have measured plasma quercetin conjugates. In an exploratory study, Mullen et al. (Reference Mullen, Edwards and Crozier35) found that glucuronide and sulphate conjugates were the predominate forms in plasma. Egert et al. (Reference Egert, Wolffram and Schulze36) measured plasma levels of two methylated quercetin conjugates, isorhamnetin and tamarixetin, that together represent a small fraction of conjugates formed after supplementation. To our knowledge, the measurement of plasma quercetin conjugates after long-term supplementation has not been conducted in human subjects. Therefore, the purpose of the present study is two-fold: (1) to examine metabolite shifts in human subjects at two doses of quercetin, combined with vitamin C and niacin (Q-500 = 500 mg/d of quercetin, 125 mg/d of vitamin C and 5 mg/d of niacin; Q-1000 = 1000 mg/d of quercetin, 250 mg/d of vitamin C and 10 mg/d of niacin), relative to the placebo at 1 and 3 months post-supplementation and (2) to identify quercetin conjugates in circulation following quercetin-containing supplementation. The mixture was based on unpublished animal studies showing increased bioavailability of quercetin when mixed with vitamin C (1:1 ratio) and niacin (Quercegen Pharma, unpublished results, T Lines, personal communication). We expect that these data will provide insights into quercetin's physiological role in human subjects.
Subjects and methods
Subjects
Healthy, non-institutionalised adults (n 1023; 18–85 years) were recruited via mass advertising from the community, as previously described(Reference Knab, Shanely and Henson24, Reference Shanely, Knab and Nieman26). Plasma was collected from a subset of these individuals (fifty-eight women and forty-two men; aged 40–83 years) for metabolomics analyses. Women were excluded from the study if pregnant or lactating. The present study was conducted according to the guidelines laid down in the Declaration of Helsinki and all procedures involving human subjects/patients were approved by the Institutional Review Board of Appalachian State University. Written informed consent was obtained from all participants.
Research design
During the first visit to the laboratory, height was measured with a stadiometer, and BMI and body composition were determined using a Tanita bioelectrical impedance scale (Tanita). Prior to the first blood draw, participants were asked to complete a FFQ to evaluate typical daily consumption of fruits, vegetables and red meats. This same strategy for fruit and vegetable intake was used in the Anti-Cancer Council of Victoria FFQ, which was previously validated against a wide number of nutrient intakes(Reference Hodge, Patterson and Brown37). Subjects were randomised to one of three groups: Q-500 (n 32), Q-1000 (n 31) or placebo (n 37). The placebo did not contain quercetin, vitamin C or niacin. Subjects were instructed to ingest two soft chew supplements twice daily (upon awakening, and between 14.00 hours and the last meal of the day) for 90 d. A semi-quantitative FFQ was used to assess typical daily consumption of fruits, vegetables, cereals, meat, dairy products and fat(Reference Heinz, Henson and Nieman38, Reference Root, McGinn and Nieman39). No restrictions were placed on diet, supplement usage or medications, with the exception that subjects agreed to avoid supplements containing quercetin. Monthly logs were collected from each subject to monitor (1) adherence to the supplementation regimen, physical activity and diet status; and (2) changes in disease status and medication use, as well as gastrointestinal (constipation, heartburn, bloating, diarrhoea, nausea or vomiting), skin (rash, dryness or flushing), allergy and mental (energy, headache, stress or focus/concentration) symptoms.
Supplements
Supplements were soft, individually wrapped chews (5·3 g/chew) that contained either 125 or 250 mg quercetin, 125 or 250 mg vitamin C (ascorbic acid and sodium ascorbate), 5 or 10 mg niacin and 84 kJ (20 kcal) of sugars in a carnauba wax, soya lecithin, maize starch, glycerine and palm oil base coloured with Food, Drug and Cosmetic Act yellow no. 5 and 6. Vitamin C and niacin were included in the chews because data from Quercegen Pharmaceutical (unpublished results, T Lines, personal communication) indicate that these molecules enhance the bioavailability of quercetin. Placebo supplements were prepared in the same way, but did not include quercetin, vitamin C or niacin. Supplements were prepared by Nutravail Technologies with Quercegen Pharmaceutical and were administered utilising double-blinded procedures.
Blood collection
Overnight fasted blood samples were collected from subjects prior to supplementation, and after 1 and 3 months of supplementation. Blood was collected from the antecubital vein into 5 ml serum separator tubes, clotted at room temperature for 20 min and centrifuged at 3000 rpm for 10 min at room temperature. The serum portion was collected, aliquoted into 1·5 ml microcentrifuge tubes, snap frozen in liquid N2 and stored at − 80°C until further analysis.
Metabolomics
Determination of the metabolomic profile of plasma samples was performed by the Metabolomics Laboratory at the David H. Murdock Research Institute (DHMRI). An untargeted approach using two platforms, GC-time-of-flight MS (TOFMS) and ultra-performance liquid chromatography-quadrupole TOFMS (UPLC-QTOFMS), was employed. GC-TOFMS was used to identify changes in volatile metabolites such as eicosanoids and NEFA. UPLC-QTOFMS was used to identify changes in non-volatile metabolites such as amino acids and sugars larger than trimers. Methodology for each approach is described later.
Standard curve preparation
Standards representing approximately 500 human metabolites (Sigma-Aldrich) were purchased and analysed on both MS platforms to develop an in-house human metabolite library for compound identification and annotation.
Sample preparation
Samples were prepared for metabolomic profiling, as previously reported(Reference Qiu, Cai and Su40, Reference Qiu, Cai and Su41), and briefly described later. For analysis conducted on GC-TOFMS system, a 50 μl sample of plasma was spiked with two internal standards (10 μl of l-2-cholrophenylalanine (0·1 mg/ml in water) and 10 μl of heptadecanoic acid (1·0 mg/ml in methanol)). Small-molecule metabolites were extracted from the samples using 180 μl of methanol chloroformate (3:1, v/v). The samples were then centrifuged at 16 100 rpm for 10 min. Supernatant (200 μl) was added to a glass sample vial and dried under vacuum at room temperature. The residue was derivatised with 50 μl of methoxyamine (15 mg/ml in pyridine) at 30°C for 90 min. Then, 10 μl of alkynes (retention index standards) and 50 μl of N, O-bis(trimethylsilyl)trifluoroacetamide (1 % trimethychlorosilane) were added. The mixture was then incubated for 60 min at 70°C.
For analysis conducted on UPLC-QTOFMS, a 50 μl sample of plasma was mixed with 50 μl internal standard solution (50 μg/ml chlrophenylalanine in water). The diluted sample was extracted with 200 μl of organic solvent (methanol–acetonitrile; 5:3, v/v) for 10 min at 3000 rpm using a VWR™ Signature Digital Vortex Mixer (VWR International, LLC). The resulting extracts were centrifuged at 15 000 rpm for 20 min, and the supernatant was transferred into a 2 ml total recovery sample vial (Waters Corporation).
Metabolomic profiling
Small-molecule metabolites measured on GC-TOFMS (Pegasus HT, Leco Corporation) were separated on an Rxi-5MS column (Crossbond® 5 % diphenyl/95 % dimethyl polysiloxane; 30 m (length) × 250 μm inner diameter, 0·25 μm film thickness). The column temperature was as follows: 80°C (0–2 min), 80–220°C (2–16 min), 220–240°C (16–20 min), 240–290°C (20–22 min) and 290°C (22–30 min). Helium was used as the carrier gas (1 ml/min). The GC-TOFMS was operated in electron impact ionisation mode ( − 70 V) under full scan mode (40–600 Da), with an ion source temperature of 210°C. Raw data were processed with ChromaTOF software (v4.24, Leco Company).
Small-molecule metabolites measured on UPLC-QTOFMS (ACQUITY UPLC-SYNAPT HDMS, Waters Corporation) were separated on an ACQUITY UPLC BEH C18 1·7 μm VanGuard pre-column (2·1 × 5 mm) and ACQUITY UPLC BEH C18 1·7 μm analytical column (2·1 × 100 mm) maintained at 40°C. Mobile phases consisted of 0·1 % formic acid in water (A) and 0·1 % formic acid in acetonitrile (B). For electrospray ionisation (ESI)+ mode, samples were eluted through the column under gradient conditions as follows (0·4 ml/min): 0–1 min (1–15 % B), 1–3 min (15–50 % B), 3–8 min (50–85 % B), 8–10 min (85–100 % B), 10–11 min (100 % B), 11–11·5 min (100–1 % B) and 11·5–13 min (1 % B). For ESI − mode, samples were eluted through the column under gradient conditions as follows (0·4 ml/min): 0–1 min (1–20 % B), 1–3 min (20–60 % B), 3–6 min (60–85 % B), 6–8 min (85–100 % B), 8–11 min (100 % B), 11–11·5 min (100–1 % B) and 11·5–13 min (1 % B). The SYNAPT HDMS was operated in ESI+(3·2 kV) and ESI − (3·5 kV) under full scan mode (50–1000 Da), with an ion source temperature of 120°C. Raw data were processed with the MarkerLynx XS application manager (Waters Corporation)
Metabolite annotation
Metabolite annotation was performed by comparing unknown signal patterns from the study samples with those of reference standards in the DHMRI Metabolomics Laboratory's in-house library. Commercial libraries such as NIST library 2005, LECO/Fiehn Metabolomics Library for GC-TOFMS metabolome data (similarity threshold of 70 %) and on-line databases such as the Human Metabolome Database (http://www.hmdb.ca/) for UPLC-QTOFMS metabolome data (mass tolerance 0·01 Da) were also used for validation and additional compound annotation.
Quercetin conjugate analysis
Quantitative analysis of quercetin and its conjugates was performed by the Metabolomics Laboratory at the DHMRI.
Standard curve preparation
Standards of quercetin-3-glucuronide, quercetin-3-glucoside, isorhamnetin-3-glucuronide (IR-3-GlcUA) and quercetin-3′-sulphate were provided by Professor P. W. Needs from the Institute of Food Research. Quercetin and apigenin (internal standard) were purchased from Chromadex. Standards were dissolved in methanol to create a concentration curve (range: 2·5–2560 ng/ml). Apigenin was added to the diluted solutions to obtain a final concentration of 75 ng/ml. Standards for quercetin diglucuronide and quercetin glucuronide sulphate were not available; however, the retention time and intact and fragmentation ions of these conjugates were determined based on a literature search for compound identification.
Sample preparation
A measure of 200 μl of plasma was acidified to pH 3 with 10 μl of 50 % aqueous formic acid and then 25 μl of ascorbic acid (10 mm) were added to prevent oxidation during the sample preparation. To precipitate plasma proteins and extract quercetin conjugates, 750 μl of acetonitrile (containing 20 ng/ml apigenin) were added to each sample. The resulting mixture was shaken at 1400 rpm for 30 min at room temperature and centrifuged at 15 000 rpm for 20 min at 4°C. The supernatant was transferred to a glass vial, and the pellet was re-extracted as described earlier, but with methanol instead of acetonitrile. The acetonitrile and methanol supernatants were combined and evaporated to dryness under a gentle N2 flow. The residue was reconstituted by 100 μl of methanol plus 100 μl of 1 % formic acid in water and centrifuged at 15 000 rpm for 20 min. The supernatant was filtered through a 13 mm syringe filter with a 0·2 μm polytetrafluoroethylene membrane before chromatographic analysis.
Quercetin conjugate quantification
Plasma concentrations of quercetin conjugates were measured with an UPLC–tandem MS (UPLC-MS/MS; ACQUITY UPLC-Quattro Premier XE MS: Waters Corporation) system. Separation was achieved using an ACQUITY UPLC BEH C18 1·7 μm VanGuard pre-column (2·1 × 5 mm) and an ACQUITY UPLC BEH C18 1·7 μm analytical column (2·1 × 100 mm) maintained at 40°C. Mobile phases consisted of 1 % formic acid in water (A) and 1 % formic acid in acetonitrile (B). Samples were eluted through the column under gradient conditions as follows (0·4 ml/min): 0–12 min (5–40 % B), 12–13 min (40–100 % B), 13–14 min (100 % B), 14–14·2 min (100–5 % B) and 14·2–15·5 min (5 % B). Negative ESI mode (3·5 kV) under selected ion monitoring mode with an ion source temperature of 120°C was used for mass spectrometric analyses.
The calibration/linearity equation and corresponding regression coefficients (R 2) were calculated by QuanLynx application manager (Waters Corporation). The concentrations of quercetin-3-glucuronide, quercetin-3-glucoside, IR-3-GlcUA, quercetin and quercetin-3′-sulphate were calculated by a corresponding calibration equation established using the reference compound standards. Since standards were not available for quercetin diglucuronide and quercetin glucuronide sulphate, the concentration was estimated (semi-quantification) relative to the concentration of quercetin.
Statistics
Partial least square discriminant analysis (PLS-DA) was used to detect metabolites that could best distinguish quercetin supplement groups from the placebo group. To eliminate time effects for each metabolite, a ratio of 3 months post-dose to pre-dose for each subject was calculated and used as input data for PLS-DA. The default seven-round cross-validation in the SIMCA-P software package (12.0.1+, Umetrics) was applied, with 1/7 of the samples being left out from the mathematical model in each round. Variable influence on projection score was calculated based on the PLS weights and the variability explained in PLS-DA. Metabolites with variable influence on projection >2 were considered the most important metabolites responsible for the differentiation of the quercetin supplement groups (Q-500 or Q-1000) from the placebo group.
Linear mixed modelling with repeated measures was used to examine the effect of quercetin supplementation on metabolite concentration, with the metabolite concentration as the response variable and the quercetin supplement group (placebo, Q-500 and Q-1000) and time (pre-dose, 1 month post-dose and 3 months post-dose) as predictor variables. The model also adjusted for age, sex, BMI and subject effect (random). This analysis was performed in the MIXED procedure in SAS (version 9.2, SAS Institute, Inc.), and was performed for each metabolite (or quercetin conjugate) separately. The Benjamini–Hochberg method for false discovery rate (FDR) correction in the MULTTEST procedure in SAS was used for multiple testing corrections. To improve normality and variance homogeneity, the concentration of each metabolite was log transformed, and outliers with studentised residue >3 or < − 3 were excluded. Metabolites (or quercetin conjugates) with a significant (FDR-adjusted, P value < 0·05) group × time interaction effect were considered to be significantly affected by quercetin supplementation, and were further examined by pairwise comparisons. Missing values for a given metabolite were imputed with the observed minimum for that metabolite.
Results
Similar demographic characteristics and dietary intakes among supplement groups
The participants' demographic characteristics are presented in Table 1. Age, BMI and proportion of males and females were similar among the three groups (P>0·05). Food group intake, as assessed by semi-quantitative FFQ, did not differ across groups (data not shown). No significant correlations were found between plasma quercetin levels and dietary variables (data not shown).
Participants' characteristics by supplement group* (Mean values and standard deviations)

Placebo, 0 mg/d of quercetin supplementation; Q-500, 500, 125 and 5 mg/d of quercetin, vitamin C and niacin supplementation, respectively; Q-1000, 1000, 250, 10 mg/d of quercetin, vitamin C and niacin supplementation, respectively.
* Participants were randomly assigned to one of three supplement groups: placebo, Q-500 or Q-1000.
† P-values are two-sided. To assess differences among the three groups at baseline, the χ2 test was used for sex and ANOVA was used for BMI and age.
Effect of quercetin with vitamin C and niacin supplementation on metabolite profile
To examine whether the quercetin supplementation altered the metabolite profile, PLS-DA score plots (Fig. 1) were constructed comparing the change from baseline to 3 months in the Q-500 and Q-1000 groups with the placebo group. A complete separation of the quercetin groups from the placebo group was observed in the PLS-DA models (Fig. 1). The first two components of this model accounted for 99 % (R 2Y value) of the variation in both quercetin groups and had Q 2 values of 60 and 78 % for the Q-500 and Q-1000 groups, respectively.
Partial least square discriminant analysis (PLS-DA). (a) Two-dimensional scatter plot of PLS-DA separation of placebo (○) and 500 mg quercetin/d (+). The ratio of 3 months to 0 months in each group was used for this analysis. R 2Y (cumulative) = 0·994; Q 2 (cumulative) = 0·601. (b) Two-dimensional scatter plot of PLS-DA separation of placebo (○) and 1000 mg quercetin/d (□). The ratio of 3 months to 0 months in each group was used for this analysis. R 2Y (cumulative) = 0·989; Q 2 (cumulative) = 0·777. t[1] is the first PLS component and t[2] is the second PLS component. PLS components are linear combinations of weighted variables (metabolites), and were constructed to maximise sample separation in discriminant analysis.

Small-molecule metabolites altered by quercetin with vitamin C and niacin supplementation
Using GC-TOFMS, 205 small-molecule metabolites were identified in the participants' serum. None of these metabolites, however, was significantly affected by quercetin supplementation after accounting for age, sex and BMI differences (data not shown, P>0·05).
From the UPLC-QTOFMS analysis, a total of 2153 metabolites were identified. Quercetin supplementation was associated with significant shifts in 163 metabolites after accounting for age, sex and BMI differences (FDR, P< 0·05) and excluding metabolites with significant baseline differences among groups. Four of these metabolites were verified against internal standards. The pattern of change in the serum fatty acid levels differed significantly among groups (FDR, P< 0·05), with the greatest effect observed in the Q-1000 group starting at 1 month (Table 2).
Metabolites verified against internal standards by supplement group* (Mean values and 95 % confidence intervals)

Placebo, 0 mg/d of quercetin supplementation; Q-500, 500, 125 and 5 mg/d of quercetin, vitamin C and niacin supplementation, respectively; Q-1000, 1000, 250, 10 mg/d of quercetin, vitamin C and niacin supplementation, respectively.
* Participants were randomly assigned to one of three supplement groups: placebo, Q-500 or Q-1000. These metabolites were characterised using ultra-performance liquid chromatography-quadrupole time-of-flight MS and identified using an in-house library of reference standards.
† Peak area was adjusted for age, BMI and sex.
‡ Significance test was based on a linear mixed model with repeated measures adjusting for age, sex, BMI and subject effect (random). Metabolite concentration was the response variable, and supplement groups (placebo, Q-500 and Q-1000) and time (0, 1 and 3 months) were the predictor variables. The Benjamini–Hochberg method for false discovery rate correction was used.
The top fifteen metabolites with significant shifts that were identified using the Human Metabolite Database are presented in Fig. 2 and Table 3. Quercetin supplementation within the first month caused a significant increase in serum 2-methoxyphenol (guaiacol) levels in a dose–response manner (Fig. 2(a)). Serum levels of 4-methylthio-2-oxo-butanoic acid (MTOB) and allocystathionine increased in the Q-1000 group at 1 month and in the Q-500 group at 3 months relative to placebo (Fig. 2(b) and (d)). In the Q-1000 group, an increase in the bile acids, 3a,7a-dihydroxycoprostanic acid and 3b,12a-dihydroxy-5a-cholanoic acid, relative to the placebo group, was observed at 1 and 3 months (Fig. 2(c) and (e)). A similar pattern of change was also observed in eight of the ten metabolites presented in Table 3. For the remaining two metabolites, phosphatidylcholine (18 : 3n-3/18 : 2n-6) and ubiquinone-2 (Table 3), serum levels, relative to the placebo group, decreased in the Q-1000 group but increased in the Q-500 group.
Top five identified metabolites ((a) 2-methoxyphenol, (b) 4-methylsultanyl-2-oxo-butanoic acid, (c) 3a,7a-dihidroxycoprostanic acid, (d) 3b,12a-dihydroxy-5a-cholanoic acid and (e) allocystathionine) with significant shifts by supplement groups. Participants were randomly assigned to one of three supplement groups: placebo (□; 0 mg/d of quercetin supplementation), Q-500 (![]() ; 500, 125 and 5 mg/d of quercetin, vitamin C and niacin supplementation, respectively) or Q-1000 (■; 1000, 250, 10 mg/d of quercetin, vitamin C and niacin supplementation, respectively). Metabolites (molecular weight, PubChem Compound ID: (a) 123·04, 460; (b) 149·02, 463; (c) 435·35, 440384; (d) 393·30, not available; and (e) 223·07, 834) were characterised using ultra-performance liquid chromatography-quadrupole time-of-flight MS and identified using on-line databases such as the Human Metabolome Database (http://www.hmdb.ca/). Peak area was adjusted for age, sex and BMI. Error bars represent 95 % CI. Significance test was based on a linear mixed model with repeated measures adjusting for age, sex, BMI and subject effect (random). Metabolite concentration was the response variable, and supplement groups (placebo, Q-500 and Q-1000) and time (0, 1 and 3 months) were the predictor variables. The Benjamini–Hochberg method for false discovery rate (FDR) correction was used (FDR-adjusted P value: (a) 1·01 × 10− 11; (b) 1·20 × 10− 10; (c) 5·21 × 10− 6; (d) 4·73 × 10− 5; and (e) 2·23 × 10− 5).
; 500, 125 and 5 mg/d of quercetin, vitamin C and niacin supplementation, respectively) or Q-1000 (■; 1000, 250, 10 mg/d of quercetin, vitamin C and niacin supplementation, respectively). Metabolites (molecular weight, PubChem Compound ID: (a) 123·04, 460; (b) 149·02, 463; (c) 435·35, 440384; (d) 393·30, not available; and (e) 223·07, 834) were characterised using ultra-performance liquid chromatography-quadrupole time-of-flight MS and identified using on-line databases such as the Human Metabolome Database (http://www.hmdb.ca/). Peak area was adjusted for age, sex and BMI. Error bars represent 95 % CI. Significance test was based on a linear mixed model with repeated measures adjusting for age, sex, BMI and subject effect (random). Metabolite concentration was the response variable, and supplement groups (placebo, Q-500 and Q-1000) and time (0, 1 and 3 months) were the predictor variables. The Benjamini–Hochberg method for false discovery rate (FDR) correction was used (FDR-adjusted P value: (a) 1·01 × 10− 11; (b) 1·20 × 10− 10; (c) 5·21 × 10− 6; (d) 4·73 × 10− 5; and (e) 2·23 × 10− 5).

Top ten metabolites with significant changes identified via Internet databases by supplement group* (Mean values and 95 % confidence intervals)

Placebo, 0 mg/d of quercetin supplementation; Q-500, 500, 125 and 5 mg/d of quercetin, vitamin C and niacin supplementation, respectively; Q-1000, 1000, 250, 10 mg/d of quercetin, vitamin C and niacin supplementation, respectively.
* Participants were randomly assigned to one of three supplement groups: placebo, Q-500 or Q-1000. These metabolites were characterised using ultra-performance liquid chromatography-quadrupole time-of-flight MS and identified using on-line databases such as the Human Metabolome Database (http://www.hmdb.ca/).
† Peak area was adjusted for age, BMI and sex.
‡ Significance test was based on a linear mixed model with repeated measures adjusting for age, sex, BMI and subject effect (random). Metabolite concentration was the response variable, and supplement groups (placebo, Q-500 and Q-1000) and time (0, 1 and 3 months) were the predictor variables. The Benjamini–Hochberg method for false discovery rate correction was used.
The top ten unknown metabolites and their characteristics are presented in Table 4. Unknown 1, based on molecular weight, is probably the quercetin conjugate, quercetin glucuronide sulphate. For all of these metabolites, the pattern of change differed significantly among groups (FDR, P< 0·05), with the greatest effect observed in the Q-1000 group starting at 1 month (Table 4).
Characteristics and peak area of top ten unknown metabolites with significant changes by supplement group* (Mean values and 95 % confidence intervals)

Placebo, 0 mg/d of quercetin supplementation; Q-500, 500, 125 and 5 mg/d of quercetin, vitamin C and niacin supplementation, respectively; Q-1000, 1000, 250, 10 mg/d of quercetin, vitamin C and niacin supplementation, respectively.
* Participants were randomly assigned to one of three supplement groups: placebo, Q-500 or Q-1000. These metabolites were characterised using ultra-performance liquid chromatography-quadrupole time-of-flight MS. The identity of these metabolites could not be established via either the in-house library of internal standards or on-line databases such as the Human Metabolome Database (http://www.hmdb.ca/).
† Peak area was adjusted for age, BMI and sex.
‡ Significance test was based on a linear mixed model with repeated measures adjusting for age, sex, BMI and subject effect (random). Metabolite concentration was the response variable, and supplement groups (placebo, Q-500 and Q-1000) and time (0, 1 and 3 months) were the predictor variables. The Benjamini–Hochberg method for false discovery rate correction was used.
Quercetin conjugates detected in plasma following 3 months quercetin with vitamin C and niacin supplementation
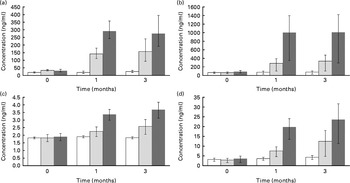
Serum levels of four quercetin conjugates were quantified using UPLC-MS/MS (Fig. 3(a)–(d)). Within the first month, quercetin supplementation caused significant increases in these conjugates in a dose–response manner (Fig. 3(a)–(d)). At 3 months of quercetin supplementation, IR-3-GlcUA had the highest concentration followed by quercetin-3-glucuronide, quercetin-3-sulphate and quercetin diglucuronide.
Quercetin conjugate concentration by supplement group ((a) quercetin-3-glucuronide, (b) isorhamnetin-3-glucuronide, (c) quercetin diglucuronide and (d) quercetin-3′-sulphate). Participants were randomly assigned to one of the three supplement groups: placebo (□, 0 mg/d of quercetin supplementation), Q-500 (![]() , 500, 125 and 5 mg/d of quercetin, vitamin C and niacin supplementation, respectively) or Q-1000 (■, 1000, 250, 10 mg/d of quercetin, vitamin C and niacin supplementation, respectively). Plasma concentrations of quercetin conjugates (PubChem Compound ID: (a) not available, (b) not available, (c) 11972442 and (d) not available) were measured with an ultra-performance liquid chromatography–tandem MS system and verified against internal standards. Concentrations were adjusted for age, sex and BMI. Error bars represent 95 % CI. Significance test was based on a linear mixed model with repeated measures adjusting for age, sex, BMI and subject effect (random). Concentration was the response variable, and supplement groups (placebo, Q-500 and Q-1000) and time (0, 1 and 3 months) were the predictor variables. The Benjamini–Hochberg method for false discovery rate (FDR) correction was used (FDR-adjusted P value: (a) 6·39 × 10− 13, (b) 3·23 × 10− 8, (c) 5·00 × 10− 7 and (d) 1·01 × 10− 5).
, 500, 125 and 5 mg/d of quercetin, vitamin C and niacin supplementation, respectively) or Q-1000 (■, 1000, 250, 10 mg/d of quercetin, vitamin C and niacin supplementation, respectively). Plasma concentrations of quercetin conjugates (PubChem Compound ID: (a) not available, (b) not available, (c) 11972442 and (d) not available) were measured with an ultra-performance liquid chromatography–tandem MS system and verified against internal standards. Concentrations were adjusted for age, sex and BMI. Error bars represent 95 % CI. Significance test was based on a linear mixed model with repeated measures adjusting for age, sex, BMI and subject effect (random). Concentration was the response variable, and supplement groups (placebo, Q-500 and Q-1000) and time (0, 1 and 3 months) were the predictor variables. The Benjamini–Hochberg method for false discovery rate (FDR) correction was used (FDR-adjusted P value: (a) 6·39 × 10− 13, (b) 3·23 × 10− 8, (c) 5·00 × 10− 7 and (d) 1·01 × 10− 5).
Discussion
Quercetin with vitamin C and niacin supplementation was associated with a significant shift in 163 metabolites out of 2153 detected using the UPLC-QTOFMS platform. Relative to the placebo group, metabolite shifts were apparent with the 1000 mg/d dose at 1 month, while the effects of the 500 mg/d dose were either delayed or not significant. Across the affected metabolites, no common theme emerged, suggesting that quercetin exerts a disparate and wide-ranging metabolic effect. To our knowledge, the present study is the first to report the plasma quercetin conjugate profile in human subjects after 12 weeks of supplementation. IR-3-GlcUA was the conjugate with the highest plasma concentration followed by quercetin-3-glucuronide, quercetin-3′-sulphate and quercetin diglucuronide.
The present study design allowed us to measure metabolic shifts after 3 months of quercetin supplementation at two different doses. We are unaware of other human data, but in rats, the urinary metabolite profile after quercetin supplementation was examined by An et al. (Reference An, Zhang and Wu14) using the 1H NMR platform. A single 40 mg/kg quercetin dose was reported to modulate metabolic processes, particularly energy metabolism, in the 48 h period following supplementation(Reference An, Zhang and Wu14). In contrast, we did not identify these metabolic processes as being altered by quercetin supplementation of 1000 mg/d (approximately 10–20 mg/kg) in human subjects. We had expected that metabolomics would discern subtle perturbations in inflammatory and oxidative stress metabolites, such as that reported in the study by Bakker et al. (Reference Bakker, van Erk and Pellis31). Utilising a targeted GCMS approach, we report here no changes in these metabolites, which is in agreement with previous findings of no association between quercetin supplementation and traditional inflammatory and oxidative stress biomarkers(Reference Knab, Shanely and Henson24, Reference Shanely, Knab and Nieman26)
Quercetin supplementation did, however, yield a sizable shift in 163 metabolites. The health consequence of quercetin supplementation is difficult to surmise given the diverse set of metabolites altered. In the present study, the top five identifiable metabolite shifts were increases in serum guaiacol, MTOB, allocystathionine and two bile acids. These metabolites are involved in a diverse range of activities. For example, the derivatives of guaiacol, a phenolic compound, are used as expectorants, antiseptics and anaesthetics(Reference Wishart, Knox and Guo42–Reference Kanehisa, Goto and Furumichi44). MTOB is involved in cell apoptosis and proliferation, and allocystathionine is an intermediate in the homocysteine degradation pathway(Reference Wishart, Knox and Guo42, Reference Kanehisa, Goto and Furumichi44–Reference Quash and Fournet46). Finally, the two bile acids, 3a,7a-dihydroxycoprostanic acid and 3b,12a-dihydroxy-5a-cholanoic acid, facilitate dietary fat and vitamin absorption(Reference Wishart, Knox and Guo42, Reference Kanehisa, Goto and Furumichi44). In addition to these metabolites, quercetin supplementation yielded shifts in haeme and steroid metabolites (e.g. tetrahydrocorticosterone and androsterone) and metabolites involved in cell signalling and energy metabolism. More research is required to determine quercetin's specific physiologic role. One possible explanation for the divergent set of metabolites altered is that quercetin acts as a signalling molecule, modulator or a cofactor and thus influences several metabolic processes.
A secondary purpose in the present study was to quantify the plasma quercetin conjugate profile after 3 month quercetin supplementation at two doses. Human plasma and urinary concentrations of quercetin conjugates were previously measured by Mullen et al. (Reference Mullen, Edwards and Crozier35) in the 24 h period after consumption of fried onions, a food high in quercetin, with samples collected at 0, 0·5, 1, 2, 3, 6 and 24 h. In this acute study, Mullen et al. (Reference Mullen, Edwards and Crozier35) reported that the two predominant plasma quercetin conjugates were quercetin-3′-sulphate and quercetin-3-glucronide, with peak levels achieved within the first hour. Three other metabolites detected in the plasma were IR-3-GlcUA and quercetin diglucuronide, which peaked within 30 min of supplementation, and quercetin glucuronide sulphate, which peaked at 3 h. At 24 h, no plasma quercetin conjugates, however, were detectable. In the present study, these five conjugates were also detected in the plasma of overnight fasted subjects at 1 and 3 months post-supplementation at two doses. We suspect that the unknown one is a sixth metabolite, quercetin glucuronide sulphate, which was also present in high concentration; however, we were unable to verify the identity of this compound. The present findings indicate that these conjugates accumulate in the plasma with chronic supplementation. The methylated quercetin conjugate, isorhamnetin-3-glucoronide, had the highest plasma concentration following chronic quercetin supplementation, but has been reported to be at relatively low plasma concentrations after acute supplementation(Reference Mullen, Edwards and Crozier35). In cell culture and animal studies, quercetin aglycone, which is not present in human plasma, has been reported to have elevated bioactive properties compared to the methylated forms(Reference Lodi, Jimenez and Moreno47). Lodi et al. (Reference Lodi, Jimenez and Moreno47) reported, however, that in high oxidative stress conditions, IR-3-GlcUA had protective cardiovascular proprieties in rats.
To our knowledge, measurement of quercetin conjugates following chronic supplementation in human subjects has only been reported by Egert et al. (Reference Egert, Wolffram and Bosy-Westphal25, Reference Egert, Wolffram and Schulze36). Isorhamnetin and tamarixetin, two methylated quercetin conjugates, accumulated in the plasma after 2 weeks of quercetin supplementation at doses ranging between 50 and 150 mg/d(Reference Egert, Wolffram and Bosy-Westphal25, Reference Egert, Wolffram and Schulze36). In pigs, Bieger et al. (Reference Bieger, Cermak and Blank48) measured these conjugates following 4 weeks of supplementation at a high-quercetin dose (50 mg/kg) and reported that they accounted for < 20 % of total plasma flavonols. In contrast, we measured the glucuronidated and sulphated conjugates of quercetin after 1 and 3 months of quercetin supplementation at high doses and showed that IR-3-GlcUA had the highest plasma concentration.
In conclusion, we report a shift in 163 diverse metabolites and a substantial increase in several types of quercetin conjugates after long-term quercetin supplementation, especially at the 1000 mg/d dose. Quercetin has been demonstrated by in vitro, animal and epidemiological studies to influence many processes, and the present data support a significant potential for wide-ranging physiological changes when quercetin is supplemented for several months in high-dose, aglycone form. In the present study, quercetin, however, was combined with vitamin C and niacin into one supplement, and thus it is not possible to entirely attribute effects to quercetin alone. Future research in human subjects should examine the physiologic pathways and biomarkers related to the top metabolites identified in the present study.
Acknowledgements
D. C. N. sits on the Scientific Advisory Board for Quercegen Pharmaceuticals. M. P. M. is under a post-doctoral fellow supported by Quercegen Pharmaceuticals. All the other authors have no conflict of interest to declare. The authors' contributions are as follows: L. C.-K. and M. P. M. wrote the first manuscript. D. C. N. and R. A. S. implemented and conducted the study and collected the data. L. C.-K., D. C. N. and W. S. analysed the data. L. C.-K., D. C. N., M. P. M., A. M. K. and R. A. S. interpreted the data. L. C.-K., D. C. N., W. S., M. P. M., A. M. K. and R. A. S. gave critical comments. L. C.-K. with D. C. N. revised the paper. The present work is supported by grants from Quercegen Pharmaceuticals. Professor P. W. Needs, Institute of Food Research, Norwich Research Park, Norwich, UK, provided internal standards for quercetin conjugates. The DHMRI performed the analysis of the metabolites.


