

Introduction
Response inhibition is the ability to stop an action that has already been initiated and is thus an important component of executive control. Reference Bjorklund, Harnishfeger, Dempster and Brainerd1,Reference Zacks, Hasher, Dagenbach and Carr2 A successful goal-directed activity is often performed through suppression of ongoing but unnecessary movements in the ever-changing environment. Conversely, impaired inhibition affects the ability of individuals to maneuver through everyday tasks. Reference Okonkwo, Wadley, Griffith, Ball and Marson3 While the neural substrate for this stopping process is yet to be precisely defined, cortical structures including the inferior frontal gyrus (IFG), pre-supplementary motor area (pre-SMA) and supplementary motor area (SMA), Reference Aron, Fletcher, Bullmore, Sahakian and Robbins4–Reference Zhang and Li7 and components of the basal ganglia circuitry, particularly the direct and cortico-subthalamic hyper-direct pathways Reference Jahfari, Waldorp, van den Wildenberg, Scholte, Ridderinkhof and Forstmann6,Reference Hammond, Bergman and Brown8,Reference Obeso, Marin and Rodriguez-Oroz9 have all been implicated.
Inhibitory executive processes can be captured by a range of standard assessments, including the Wisconsin Card Sorting Test, Stroop Task, Go/No-Go Task, Stop Signal Task, and Flanker Task. However, unlike the simple reaction time (RT), which can be measured straightforwardly as the latency of response to a Go signal, quantifying response inhibition is more complex. One approach is to measure the Stop Signal Reaction Time (SSRT) through the Stop Signal Task, originally proposed by Logan and Cowan. Reference Logan and Cowan10 Subjects respond to a Go cue; on some trials, the Go cue is followed by a Stop cue, and subjects must inhibit their response. The outcome of the Stop trial is modeled as a race between a Go process and a Stop process within the nervous system. If the Go process finishes first, the response is executed, but if the Stop wins the race then the response is inhibited. Reference Logan and Cowan10 The mathematical approach is to use the distribution of Go RTs and the fraction of inappropriate responses on Stop trials to calculate SSRT. Reference Logan, Dagenbach and Carr11,Reference Verbruggen, Aron and Band12 We have recently developed and validated a refinement of the SSRT, the optimum combination SSRT (ocSSRT), which uses Bayesian statistics to give more reliable estimates for individual subjects. Reference Choudhury, Roy and Mondal13 In the same year, Verbruggen et al. published a consensus guideline to capture the ability to inhibit actions and impulsive behaviors in the stop signal task. Reference Verbruggen, Aron and Band12
Response inhibition can be altered in various perturbed physiological states and pathological conditions. In a recent study in 20 young healthy individuals, SSRT was significantly prolonged after 24 h of sleep deprivation and deficits in inhibition-related activations in areas involved in response inhibition, especially the inferior frontal gyri bilaterally, the left subthalamic nucleus and left lingual gyrus, were observed on functional brain imaging. Reference Zhao, Zhang and Fei14 SSRT has been used in patients (children and adults) with a range of neurological and neuropsychiatric conditions to elucidate further the neuroanatomical, neurophysiological, and neuropharmacological basis of response inhibition. These studies have included disorders such as attention-deficit hyperactivity disorder (ADHD), substance abuse disorder, bipolar disorder, obsessive compulsive disorder (OCD), Huntington’s disease, focal dystonia, and Parkinson’s disease (PD). For example, SSRT was found to be comparable in PD patients with or without impulse control disorder. Reference Claassen, van den Wildenberg and Harrison15 By contrast, in PD patients with motor impulsivity and involuntary movements, SSRT was delayed, Reference Cerasa, Donzuso and Morelli16 as has also been observed in patients with ADHD and OCD. Reference Nigg17
Recently, Di Caprio et al. demonstrated that reactive inhibition is lost in PD patients in early stages of disease, whereas, proactive inhibition is spared. Reference Di Caprio, Modugno, Mancini, Olivola and Mirabella18 The role of the basal ganglia in response inhibition could be studied using SSRT/ocSSRT in patients with PD. However, coexisting cognitive impairment, which can be severe and thus fulfill diagnostic criteria for PD dementia or dementia with Lewy bodies (DLB), Reference McKeith, Boeve and Dickson19 might confound interpretation. Dissecting out the relative contribution of basal ganglia and cortical degenerative processes to any changes in experimental measures of response inhibition, such as ocSSRT, is therefore important.
To explore the underlying physiology of response inhibition further, we compared the ocSSRT and simple RT in PD patients with and without cognitive impairment, in patients with Alzheimer’s disease (AD) but without overt motor impairment, and healthy participants. Patients with AD are characteristically impaired in multiple cognitive domains, including memory, language, visuospatial, and executive function. Any increase in ocSSRT in AD patients would imply a role for cortical networks in response inhibition. By contrast, we have shown previously that ocSSRT is increased in patients with PD without clinical evidence of cognitive impairment and normalizes with L-DOPA Reference Choudhury, Roy and Mondal13 or subthalamic nucleus (STN)-DBS. Reference Roy, Choudhury, Basu, Baker, Baker and Kumar20 It is still unclear how the severity of cognitive impairment is associated with SSRT/ocSSRT. Using Montreal Cognitive Assessment (MoCA) scores, we estimated the cognitive status of the participants and explored the correlation between MoCA RT and ocSSRT. We show that ocSSRT is significantly prolonged in PD patients compared to healthy controls, but not in AD patients. We also show that ocSSRT but not RT can differentiate AD and PD patients with mild cognitive impairment (MCI), suggesting that ocSSRT might have a role in screening and diagnosis in patients with dementia, particularly those presenting with mild symptoms in the early stages of the disease process.
Material and Methods
The study was performed between two regional/tertiary neurology centers, one in India and one in Bangladesh. The study was approved by the Institutional Ethics Committees of both institutes (INK/SSRT_ADPD/2020 dated 5 March 2020; ERC-NINS letter number 51 Reference Bjorklund, Harnishfeger, Dempster and Brainerd1 dated 18 February 2019). Written informed consent was obtained from all participants in accordance with the Declaration of Helsinki.
Patients were recruited from specialist clinics at both centers by senior neurologists. PD patients were diagnosed according to the UK Brain Bank criteria. Reference Daniel and Lees21 The Unified Parkinson’s Disease Rating Scale motor section (UPDRS-III). Reference Fahn, Elton, Fahn, Marsden, Calne and Goldstein22 and Hoehn and Yahr (H&Y) stage Reference Hoehn and Yahr23 were used to assess disease severity and disease stage, respectively, in each patient. AD patients were diagnosed according to the DSM-IV criteria. Healthy controls were recruited from among the carers or family (but not blood relatives) accompanying the patient to hospital. We excluded patients with a history of other previous or current neurological illness or injury. Other major exclusion criteria included a history of alcohol or drug abuse, or significant visual impairment. MoCA was performed in all subjects. AD patients with a MoCA score of less than 24 were invited to participate in the study. A MoCA score between 18 and 24 was considered consistent with mild AD and a score <18 was regarded as moderate-severe AD.
The Task
The method used to measure SSRT in this study was the optimum combination SSRT (ocSSRT), validated by our previous work. Reference Choudhury, Roy and Mondal13 Figure 1 provides a schematic representation of our version of the Stop Signal Task to measure ocSSRT. Subjects sat comfortably in a semi-illuminated room, where they were provided with a battery-operated handheld electronic SSRT box as described previously. Reference Choudhury, Roy and Mondal13 In brief, the front panel of the box contains one red and one green light-emitting diode (LED; 5 mm diameter), a large central low compliance push button, and a liquid crystal display (LCD). Contained within the box is a dsPIC30F6012A microcontroller (Microchip Inc.), programmed with custom firmware to control the task sequence, and measure RTs (to 1 ms precision) and response probabilities. At the end of the test, the box computes final results (median RT and ocSSRT) and displays them on the LCD. Each trial is initiated by depressing and holding down the central push button. One of two trial types then occur at random:
1. A Go trial (75% of trials), where only the green LED is illuminated, instructing the participant to release the central button as quickly as possible;
2. A Stop trial (25% of trials), where the green LED is illuminated followed by the red LED at an interval of 5 ms, 65 ms, 130 ms, or 195 ms (stop signal delays; order selected at random). This instructs the participant not to release the central button.
Schematic description of Stop Signal Task. Stop signals (illumination of red LED at one of four interstimulus intervals) occur in a pseudorandom order, comprising 25% of trials; the remaining 75% of trials have a Go cue only (illumination of green LED). Participants were instructed to release the button in response to Go trials but to keep pressing the button if the Go signal was followed by a Stop signal. (This figure has been adapted and modified from Roy et al. Reference Roy, Choudhury, Basu, Baker, Baker and Kumar20 published by the same group after obtaining the necessary permission).

For Stop trials, if the button was not released for 0.7 s after the green LED was activated, this was considered a successful trial. Trials were separated by a 1–2.64 s delay (chosen at random).
Trials were presented in blocks of 32, with 24 Go trials and 8 Stop trials (2 for each stop signal delay) within a block. After 2 blocks of 32 trials, testing was paused for 60 s to allow the subject to rest. Subjects could also rest at any point by releasing the button, as the next trial did not start until the central button was again depressed. Data were collected for three sets of 64 trials, giving a total of 192 trials.
We recorded the ocSSRT and median RT. While RT is a commonly used measure of the time taken by a participant to respond to a stimulus in each trial, ocSSRT is a novel measure that uses Bayesian statistics to incorporate the accuracy of individual estimates made from different stop signal delays into a single measure. A detailed mathematical description of ocSSRT has been published previously. Reference Choudhury, Roy and Mondal13
Statistical Analysis
Where appropriate, results were reported as means (± SD). The normality of data was tested using the Shapiro–Wilk test. Based on the distribution of the data parametric or non-parametric statistical tests were used.
The one-way Anova test was used to compare ocSSRT between the three groups and post hoc Tukey’s test was used for pairwise comparison. The Kruskal–Wallis test was used to compare age and RT between the three groups. The post hoc Dunn’s test was used for pairwise comparison. Benjamini–Hochberg adjustment was performed to adjust for multiple comparison. We also computed the Bayes factor for pairwise comparison in case of ocSSRT and RT. The predefined cutoffs were as follows: – BF10 > 100: extreme evidence for H1; BF10 between 30 and 100: very strong evidence for H1; BF10 between 10 and 30: strong evidence for H1; BF10 between 3 and 10: moderate evidence for H1; BF10 between 1 and 3: anecdotal evidence for H1; BF10 = 1 is equal evidence for H1 and H0; BF10 between 0.3 and 1: anecdotal evidence for H0. Reference Stevens24 For comparison of categorical variables between groups, we applied Fisher’s exact test. As our populations were not strictly age-matched, multivariate analysis of covariance (MANCOVA) was used to explore whether age had any influence on both RT and ocSSRT. Pearson’s and Spearman’s correlation coefficient were used to test the potential relationships between ocSSRT and UPDRS or H&Y, and between RT and UPDRS or H&Y in the PD group. We also used the same test to explore potential relationships between MoCA and ocSSRT and RT, respectively. Cumulative distribution plots of ocSSRT across subjects were plotted, and from these receiver operating characteristic (ROC) curves were constructed to investigate the diagnostic utility of ocSSRT. ROC curves were summarized by computing the area under the curve (AUC). An AUC of 0.5 indicates an identical distribution of the measure of interest in patients and controls; an AUC of 1.0 occurs if the distributions are entirely non-overlapping. AUC values were tested for significant differences from 0.5 using a Monte Carlo shuffling procedure. Data were analyzed using IBM SPSS 21 software (Armonk, NY, USA), JASP v. 14 (University of Amsterdam, Netherlands) and custom analysis code written in MATLAB version 2020 (Mathwork, Massachusetts, USA).
Results
The study cohort comprised 35 PD patients (21 male), 22 AD patients (16 male), and 29 healthy controls (15 male). There was no significant difference in male to female ratios between groups (p = 0.37). While the age of participants was unbalanced between groups (p < 0.001), there was no significant difference in age between AD (67 ± 8 years) and PD patients (61 ± 10 years; p = 0.07); the mean age of the healthy control group (55 ± 10 years) was significantly lower than that of the PD (p 0.01) and AD (p < 0.0001) groups. Demographic and clinical details are described in Table 1. (The behavioral data are attached as a Supplementary Table.)
Demographic and clinical profile of study participants (all values are given as Mean ± SD)

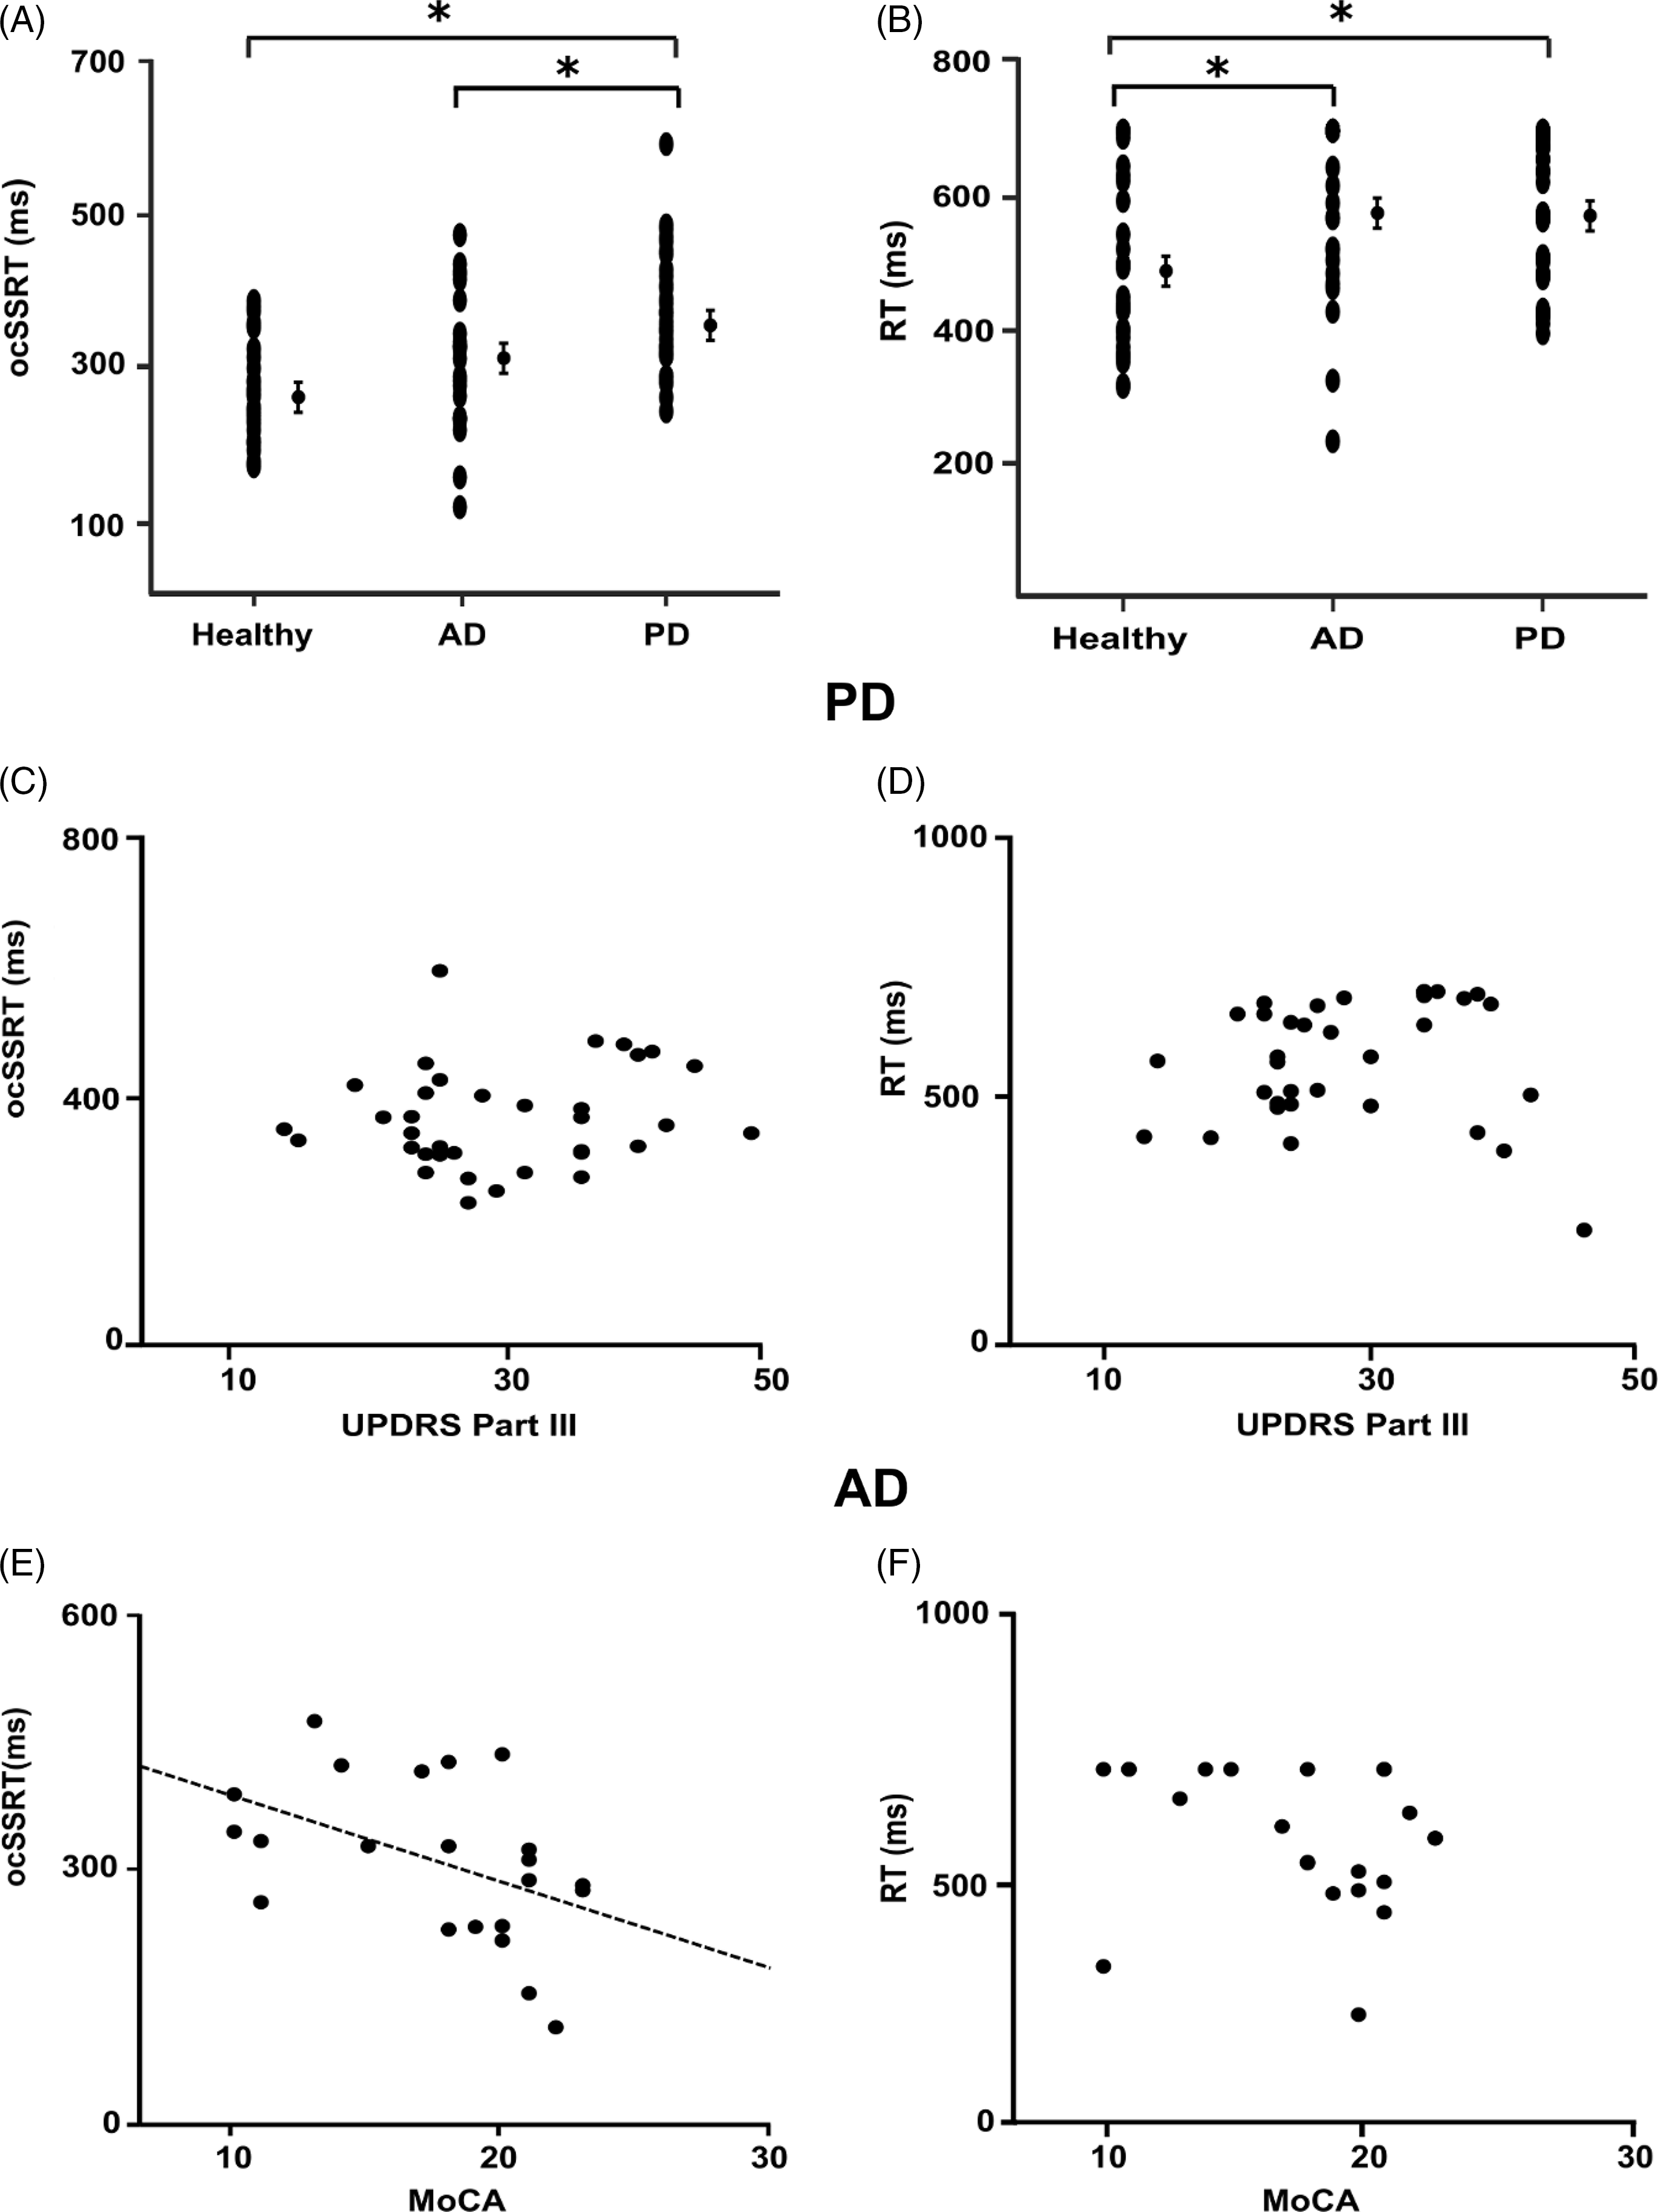
RT and MoCA were found not to be normally distributed, whereas ocSSRT and UPDRS III were consistent with a normal distribution; statistical tests were selected accordingly. The mean ocSSRT was 265 ± 66 ms in healthy controls, 309 ± 93 ms in AD patients, and 368 ± 76 ms in PD patients (Figure 2A), whereas mean RT was 489 ± 124 ms in healthy controls, 570 ± 133 ms in AD patients, and 577 ± 105 ms in PD patients (Figure 2B). RT was significantly prolonged in both the PD (p = 0.009, adjusted p = 0.027, BF10 6.49) and AD (p = 0.01, adjusted p = 0.015, BF10 1.508) cohorts compared to healthy controls (chi square 9.121, df 2). The ocSSRT was also prolonged in the PD cohort compared to healthy controls (p < 0.001, adjusted p < 0.001, BF10 459.06), but there was no significant difference in ocSSRT between AD patients and healthy controls (p = 0.121, adjusted p = 0.121, chi square 9.121, df 2, BF10 0.844).
Optimum combination Start Stop Reaction Times (ocSSRTs) for each experimental group (AD patients, PD patients, and controls) are plotted in A. Median reaction times (RTs) for each experimental group are summarized in B. The ocSSRT (A) was significantly prolonged in the PD group compared to both healthy controls and the AD group (one-way ANOVA with post hoc Tukey’s test; adjusted for multiple comparisons using Benjamini–Hochberg correction). The RT (B) was significantly prolonged in both AD and PD groups compared to healthy controls (Kruskal–Wallis ANOVA with Dunn’s post hoc test; adjusted for multiple comparisons using Benjamini–Hochberg correction). Mean and standard error of the mean are plotted for each group. Correlation analysis comparing ocSSRT, RT, UPDRS III, and MoCA across all groups is summarized in (C–F). There was also no correlation between ocSSRT (C) or RT (D) and UPDRS III. While, as shown in (E), there was a negative linear correlation between MoCA and ocSSRT (ρ = –0.531, p = 0.01; Spearman’s rank correlation coefficient), there was no significant correlation between MoCA and RT (F). A p-value < 0.05 (*) was considered significant for all statistical tests. (Abbreviations: AD – Alzheimer’s disease; PD – Parkinson’s disease; ocSSRT – optimum combination Stop Signal Reaction Time; Med RT – median reaction time].
For the RT, there was no significant difference between the AD and PD groups (p = 0.73, adjusted p = 0.73, BF10 0.30), whereas the ocSSRT was significantly prolonged in the PD cohort compared to AD patients (p = 0.019, adjusted p = 0.03, BF10 3.27). Adjusting for age as a covariate in a multivariate analysis, MANCOVA, we found that the ‘group’ (AD/PD/healthy) remained a significant factor for determining ocSSRT (p < 0.001). Age just failed to reach the significance threshold to qualify as an independent factor controlling ocSSRT (p = 0.051). Similarly, for RT, the ‘group’ (AD/PD/healthy) remained the only significant factor (p = 0.02), with age having no significant effect (p = 0.90).
Within the PD group, we found no significant correlation between ocSSRT and UPDRS (Spearman’s ρ = 0.147; p = 0.400; Pearson’s r = 0.163; p = 0.348; Figure 2C) or between RT and UPDRS (Spearman’s ρ = 0.234; p = 0.176; Pearson’s r = 0.151; p = 0.387; Figure 2D). In the AD group, ocSSRT was negatively correlated with MoCA score (Spearman’s ρ= –0.531; p = 0.011; Pearson’s r = –0.464; p = 0.029; Figure 2E), whereas RT showed no correlation with MoCA (Spearman’s ρ = –0.281; p = 0.206; Pearson’s r = –0.252, p = 0.258, Figure 2F). The ocSSRT was significantly prolonged in moderate-severe AD patients compared to milder cases (274 ± 89 ms vs. 370 ± 67 ms; p = 0.013). Notably, there was no correlation between RT and ocSSRT in either PD (p = 0.371) or AD patients (p = 0.759).
While our statistical analysis showed differences between measurements at the population level, it is perhaps more meaningful to determine how reliably ocSSRT and RT can differentiate between individuals in the groups. We therefore tested this by plotting cumulative probability distributions, and computing ROC (Figures 3 and 4. This analysis confirmed that ocSSRT could distinguish healthy controls from PD and AD patients (ROC AUC 0.81 and 0.65, respectively; both p = 0.001 and p = 0.02; Figure 3B and C and PD patients from AD patients (ROC AUC 0.63; p = 0.03; Figure 3D). However, although RT could also differentiate PD and AD patients from healthy controls (ROC AUC 0.67 and 0.71, respectively; p = 0.005 and p = 0.002; Figure 4B and D it could not differentiate between PD and AD patient groups (ROC AUC 0.56; p = 0.22, Figure 4D).
The cumulative probability and receiver operating characteristic (ROC) curves for ocSSRT in healthy controls and patients with Alzheimer’s disease (AD) and Parkinson’s disease (PD). (A) Cumulative probability distributions of ocSSRT in patients with AD, PD, and healthy controls. (B, C, and D) ROC plots derived from the cumulative probability distributions in (A) confirming that ocSSRT can effectively separate healthy controls from AD and PD patients and AD from PD patients. Dotted diagonal line indicates expected result if ocSSRT were not able to discriminate between the groups.

The cumulative probability and receiver operating characteristic (ROC) curves for RT in healthy controls and patients with Alzheimer’s disease (AD) and Parkinson’s disease (PD). (A) Cumulative probability distributions of RT in patients with AD, PD, and healthy controls. (B, C, and D) ROC plots derived from the cumulative probability distributions in (A) confirming that RT can effectively separate healthy controls from AD and PD patients but cannot separate AD and PD patients. Dashed diagonal line indicates the expected result for a non-discriminatory test.

Figure 5 illustrates the relationship between MCI, as defined by the MoCA, and RT/ocSSRT for patients with AD (red) and PD (black). RT and ocSSRT were clearly increased in PD patients with MCI (gray shaded box; Figure 5A and B) relative to healthy controls (blue lines; mean and SEM). However, unlike ocSSRT, RT could not differentiate PD MCI patients with higher MoCA scores from controls. By contrast, there was no significant difference in RT or ocSSRT between controls and AD patients with MoCA scores within the MCI range (pink shaded boxes; Figure 5A and B). Differences in RT/ocSSRT only became significant in the most cognitively impaired AD patients.
Comparison of RT and ocSSRT as a function of MoCA score in PD and AD patients. Plot of RT versus MoCA (A) and ocSSRT versus MoCA (B). RT/ocSSRT scores for AD patients are plotted in red, while scores for PD patients are plotted in black. The horizontal blue solid lines show the mean scores for healthy controls and the blue dashed lines the standard error of the mean (SEM). Each data point is a sliding mean (MoCA ± 2) and thus a point plotted at 20 used RT/ocSSRT scores from patients with MoCA scores between 18 and 22. Filled circles with asterisk in (A) and (B) indicate data points that were significantly different from healthy controls (t-test; p < 0.05), whereas unfilled circles showed no significant difference. (C and D) The area under the receiver operating curve (AUC) at each MoCA score for AD and PD patients versus controls using RT (C) and ocSSRT (D) as the discriminatory test, filled circles with asterisk on top represent the significant values. (E and F) Summary plots indicating the number of patients (N) contributing at each MoCA score to the results summarized in (A–D) for RT (E) and ocSSRT (F). Pink shaded boxes show the range of MoCA scores defined as MCI in AD and shaded gray boxes the range for MCI in PD. (Key: red circles = AD group, black circles = PD group, pink shaded region = AD MCI, gray shaded region = PD MCI].
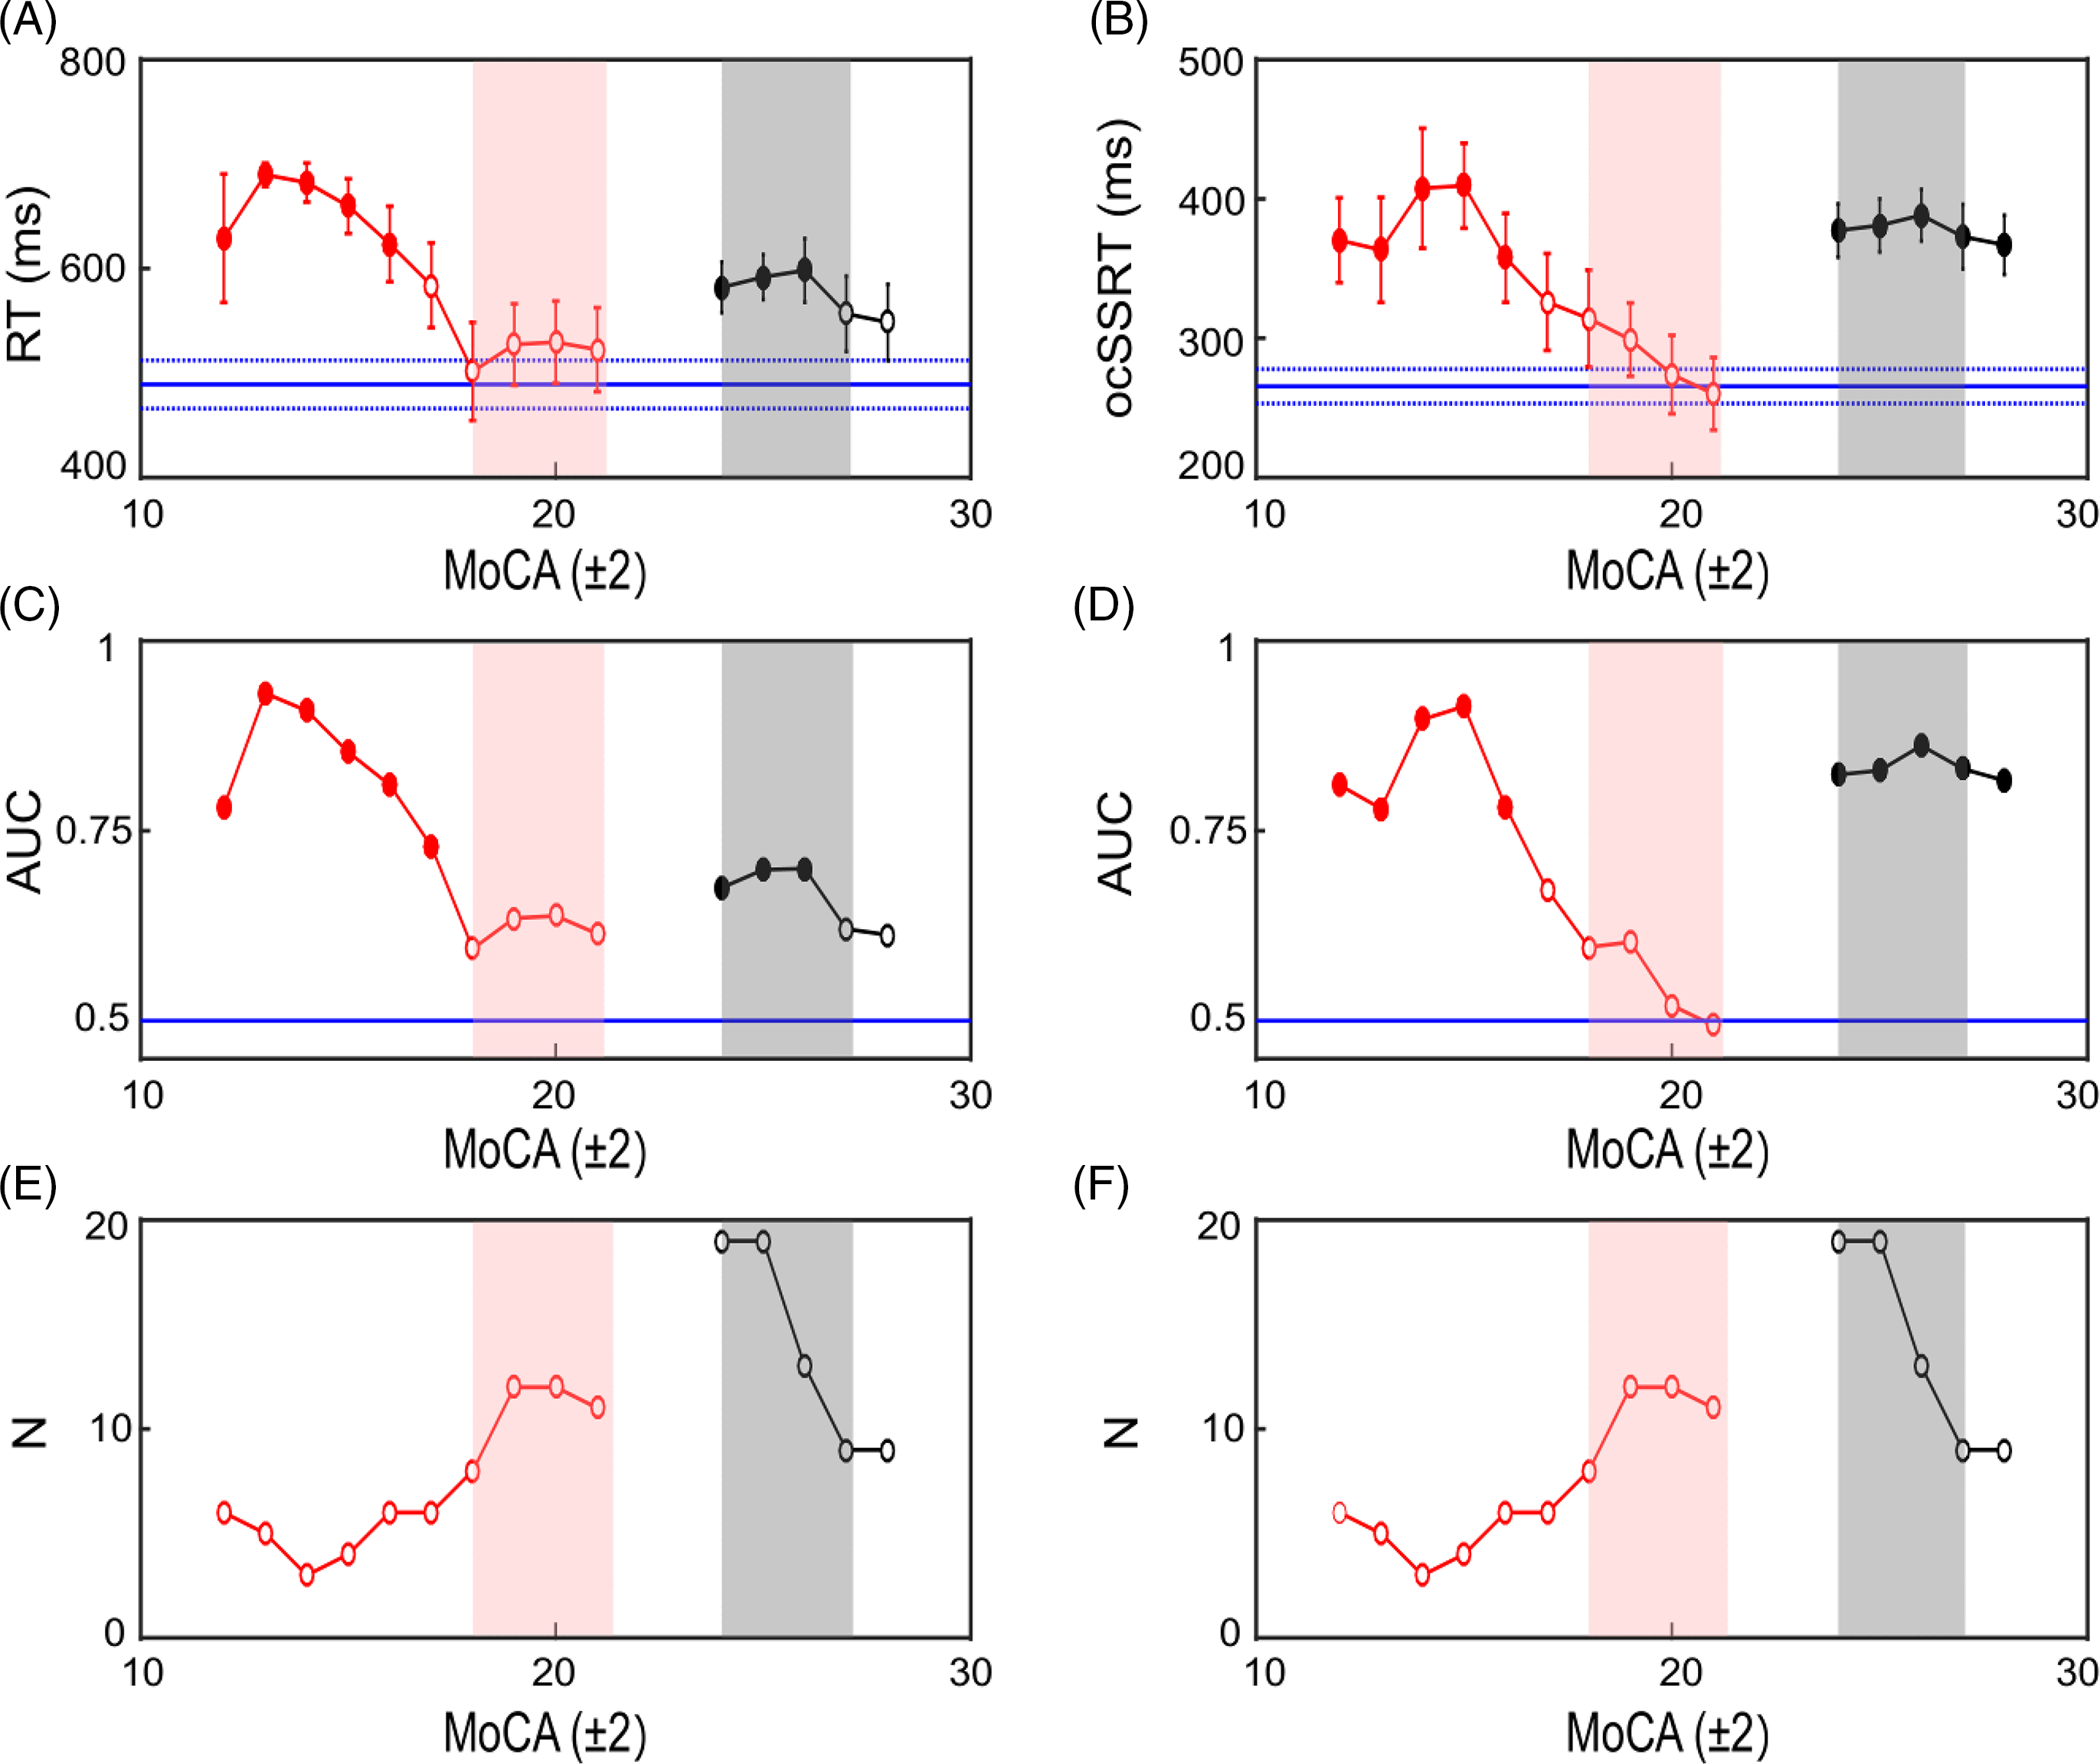
Figure 5C and D presents the results of ROC analysis, again with AD and PD patients separated by MoCA score. For PD patients with MoCA scores within the MCI range, RT and ocSSRT achieved significant separation from healthy controls (Figure 5C and D, whereas AD patients were only separated significantly from controls for MoCA values below the MCI range (pink shading).
Figure 5 is a post hoc analysis of the available data, and hence different numbers of subjects contributed to each range of MoCA scores, as shown in Figure 5E and F. Reassuringly, the numbers of patients (AD and PD) were highest for the range of MoCA scores encompassing PD and AD MCI. The failure to find significant separation for AD patients with MCI from healthy controls is thus unlikely to be due to low power – there were actually more patients for the points which failed to reach significance than for those which showed significant differences. This gives confidence that the results shown in Figure 5 reflect genuine properties of these measures.
Discussion
In this study, we observed that both ocSSRT and RT are prolonged in patients with PD compared to healthy controls, confirming our previous report. Reference Choudhury, Roy and Mondal13 By contrast, ocSSRT was not significantly prolonged in AD patients compared to healthy controls. These differences were not just seen at the population level; ocSSRT could also distinguish individuals with AD from those with PD. By contrast, RT was prolonged in both AD and PD and could not be used to separate the groups. There were no significant associations between ocSSRT or RT and measures of disease severity in PD patients, but ocSSRT was inversely correlated with cognitive impairment in AD patients. Age was an independent factor determining ocSSRT in the patient groups but did not influence RT. However, in our study, controls were not age-matched and there were differences in disease duration, thus limiting to some extent the interpretation of our results.
The Neural Substrate of Response Inhibition/Movement Stopping
Various cortical and subcortical loci have been implicated in the control of response inhibition. While pre-frontal cortex (PFC) undoubtedly plays a pivotal role in mediating response inhibition, Reference Brooks25–Reference Stuss29 other cortical areas, including pre-SMA; Reference Mostofsky, Schafer and Abrams30,Reference Simmonds, Pekar and Mostofsky31 , premotor cortex, Reference Picton, Stuss, Alexander, Shallice, Binns and Gillingham32,Reference Watanabe, Sugiura and Sato33 ventrolateral PFC, insula, Reference Boehler, Appelbaum, Krebs, Hopf and Woldorff34,Reference Swick, Ashley and Turken35 dorsal anterior cingulate cortex, Reference Manza, Hu, Chao, Zhang, Leung and Chiang-Shan36 and anterior cingulate gyrus Reference Casey, Trainor and Giedd37–Reference Rubia, Russell and Overmeyer40 also appear to participate. Studies in patients have served to confirm the importance of PFC to human response inhibition. For example, in one fMRI study in adolescents with substance abuse disorder, hypo-activity was found within PFC, specifically in orbitofrontal cortex (OFC), during response inhibition. Reference Whelan, Conrod and Poline41
Experimental studies in patients have also helped to define the contribution of subcortical structures to response inhibition, specifically fronto-basal interactions in ADHD Reference Whelan, Conrod and Poline41 and the role of the STN in patients with PD. Reference Ballanger, van Eimeren and Moro42–Reference van den Wildenberg, van Boxtel, van der Molen, Bosch, Speelman and Brunia45 Evidence from these studies suggests that the connection between SMA/IFG and STN Reference Aron, Behrens, Smith, Frank and Poldrack46,Reference Inase, Tokuno, Nambu, Akazawa and Takada47 is crucial in controlling response inhibition. Reference Aron and Poldrack48–Reference Munakata, Herd, Chatham, Depue, Banich and O’Reilly53 Studies specifically investigating SSRT in patients with circumscribed cortical lesions (involving the frontal lobes) or lesions to the basal ganglia revealed prolonged SSRTs compared to a non-neurological control patient group. Reference Rieger, Gauggel and Burmeister54 These findings are supported by our previous observations that ocSSRT is impaired in PD patients Reference Choudhury, Roy and Mondal13 and improves with STN deep brain stimulation, Reference Roy, Choudhury, Basu, Baker, Baker and Kumar20 and results from others that identified deficits in response inhibition in PD patients compared to healthy controls. Reference Obeso, Wilkinson and Casabona44,Reference Gauggel, Rieger and Feghoff55,Reference Nombela, Rittman, Robbins and Rowe56 The observation that there was no correlation between RT and ocSSRT provides further evidence that delayed response inhibition in PD is not merely due to bradykinesia but is a specific consequence of abnormal movement stopping.
While a limited number of studies have measured SSRT in AD, the Stroop Colour-Word Test (SCWT Reference Stroop57 ), a measure of cognitive rather than motor response inhibition, has been widely used. The SCWT consists of three parts and participants are requested rapidly to: (i) ‘read the names of colors’; (ii) ‘name the color of ink patches’ (congruent test); and (iii) ‘name the color of ink in which the name of a different color is written’ (incongruent test). The incongruent test is in essence a measure of response inhibition because it captures the efficiency of participants to suppress the natural tendency to read written words. In one study, AD patients performed worse in both congruent and incongruent sections compared to healthy age-matched controls, Reference Bondi, Serody and Chan58 consistent with several other studies which suggested that AD patients in the early stages of disease also suffer from psychomotor slowing. Reference Binetti, Magni, Padovani, Cappa, Bianchetti and Trabucchi59,Reference Fisher, Freed and Corkin60 In another study using a RT-based version of the SCWT, a failure of inhibition was identified in normal aging, which was accelerated in patients with AD. Reference Spieler, Balota and Faust61 On the other hand, Amieva and colleagues, Reference Amieva, Lafont and Auriacombe62 despite finding significant increases in response latency to Go trials compared to healthy controls, found only limited impairment in a Stop Signal Task, suggesting that, in the early stages of AD, inhibitory mechanisms are not as impaired as other aspects of executive function. Reference Amieva, Lafont and Auriacombe62 Our results, showing that RT was significantly prolonged in AD patients compared with healthy controls, are therefore in broad agreement with the literature. Moreover, the significant correlation we observed between increasing disease severity and ocSSRT in AD patients is also not unexpected; that this is not observed in the PD group would suggest it is a consequence of cortical degeneration.
The ocSSRT as a Diagnostic Test in Patients with MCI
MCI is a syndrome that not only encompasses healthy aging but also those displaying the early manifestations of dementia. Identifying and distinguishing those with MCI who will progress to AD and DLB and other forms of dementia is essential if clinical trials of disease-modifying therapies in these diseases are to be successful. There are several accepted tools for measuring MCI, one of which is the MoCA. Several studies Reference Davis, Creavin and Noel-Storr63,Reference Milani, Marsiske, Cottler, Chen and Striley64 recommend a MoCA score of 18–25 out of a total score of 30 to define MCI in AD patients. The Movement Disorders Society (MDS) has proposed criteria for diagnosing MCI in PD. However, a recent study by Kim and colleagues Reference Kim, Nazor and Zabetian65 suggested that a MoCA score of 24–26 should be indicative of MCI in PD patients. While it is not very difficult to differentiate between AD and DLB in the later stages of disease because of the characteristic motor features of PD/DLB that are absent in AD, this is not always true of the early stages of disease when patients present with MCI.
Our observation that mean RT was comparable between both PD and AD groups but that ocSSRT was significantly different raises the possibility that ocSSRT might be used to distinguish patients with MCI who will subsequently develop AD from those who will progress to one of the dementias associated with Lewy body pathology. The area under the ROC curves demonstrated some ability of ocSSRT to discriminate between groups (see Figure 3D), whereas RT performed only at chance levels (Figure 4D). Moreover, our results (see Figure 5) show that ocSSRT can clearly distinguish between PD patients and healthy controls regardless of the MoCA, whereas there appears to be no difference between AD patients and healthy controls at higher MoCA scores, with differences only becoming evident with severe cognitive impairment in AD. The ocSSRT is thus particularly sensitive to basal ganglia degeneration but can also be affected by late stages of cortical degeneration; ideal attributes for a test that might thus be applied to patients with MCI to distinguish patients with early DLB. This is particularly relevant to resource poor settings, where neurological/imaging expertise might not be available. However, this hypothesis would need to be tested in a future study. Moreover, the measured AUC (0.63) does not suggest sufficient specificity to allow ocSSRT to be applied alone as a diagnostic discriminator of AD and DLB. Brain perfusion SPECT studies are known to show variable sensitivity in identifying DLB and AD. Hanyu and colleagues Reference Hanyu, Shimizu and Hirao66 showed an improved AUC value of 0.93 by combining the results of SPECT and the mini-mental state examination. Colloby and colleagues Reference Colloby, Firbank and Pakrasi67 found that 123I-FP-CIT could distinguish between DLB and AD with an AUC value of 0.83. Similarly, we suggest that applying ocSSRT with other measures (clinical indicators, neuroimaging data, laboratory biomarkers, etc.) might boost the diagnostic utility sufficiently to provide a tool for differentiating early DLBs from other causes. ocSSRT is especially attractive in this regard, as it can be measured simply and at minimal cost.
Additional Information
Part of the study was submitted as a poster for the conference organized by International Association of Parkinsonism and Related Disorders 2020. The conference was canceled due to the COVID-19 pandemic, but the abstract was published in their official journal- Parkinsonism & Related Disorders.
Acknowledgements
The authors would like to thank Prof. R.P. Sengupta, MD, FRCS, OBE, for his support throughout the study and all the patients and healthy volunteers who kindly participated in the current study.
Supplementary Material
To view supplementary material for this article, please visit https://doi.org/10.1017/cjn.2021.184.
Funding
HK received institutional support from the Institute of Neurosciences Kolkata, India. The study was also supported by grants awarded by the UK MRC (MC/PC/17168 and MR/P012922/1) to SNB.
Conflict of Interest
The authors have no conflicts of interest to disclose.
Statement of Authorship
SR, US: Study concept and design, acquisition of data, analysis and interpretation, first draft of the manuscript, critical revision of the manuscript for important intellectual content. NI, AR: Data analysis and interpretation, critical revision of the manuscript for important intellectual content. PB, SSA, MAI, MSS, AN, MTIC, and MSJHC: Acquisition of data, critical revision of the manuscript for important intellectual content. JPT: Critical revision of the manuscript for important intellectual content. SC, MRB, and SNB: Study concept and design, Analysis and interpretation, critical revision of the manuscript for important intellectual content. HK: Study concept and design, critical revision of the manuscript for important intellectual content and study supervision.


