

The significance of the microbiome in the gut and overall health has been well established, as it affects metabolism and modulation of the immune system, and provides protection against intestinal pathogens(Reference Hooper, Wong and Thelin1). Various prenatal and postnatal factors, such as the initial exposure to the environment, including the mother(Reference Mackie, Sghir and Gaskins2), composition of milk(Reference Gronlund, Gueimonde and Laitinen3) and diet after weaning, contribute to the development of the core intestinal microbiota. The initial colonisation of the gastrointestinal tract has been shown to have significance in human infants, as it might define the lifelong composition of the gut microbiota and consequently contribute to host health(Reference Adlerberth4). The composition of the gut microbiota during early age also has been reported to affect the onset of metabolic diseases such as obesity in humans(Reference Kalliomaki, Salminen and Isolauri5).
A small number of studies have characterised the gastrointestinal microbiome of healthy adult cats(Reference Ritchie, Steiner and Suchodolski6, Reference Handl, Dowd and Garcia-Mazcorro7) and how it may be modified by dietary fibre(Reference Barry8). Others have reported the gut microbial dysbiosis that occurs during inflammatory bowel disease in cats(Reference Janeczko, Atwater and Bogel9). To our knowledge, however, evaluation of the faecal microbiome of kittens around weaning has not been performed. Because weaning is a stressful period that often results in gut microbiota shifts and gastrointestinal stress, there is a great interest to characterise the gut microbial composition around weaning and design nutritional strategies that minimise these negative outcomes.
Cats are obligate carnivores, having evolved on diets rich in protein and fat. Thus, cats have a higher minimal crude protein requirement (18·0 % for growing kittens and 16·0 % for adult cats; NRC, 2006) and recommended allowance (22·5 % for growing kittens and 20·0 % for adult cats; NRC, 2006) than commonly studied animals (e.g. rodents, dogs) and human subjects. Most commercial cat foods contain a much higher amount of dietary protein than that minimally required, often containing 30–40 % or more of diet dry weight. The macronutrient profile and the processing of such diets (high protein and fat; low fibre) not only make them highly palatable, but lead to high digestibility and low stool volume. While this may be beneficial from an owner's standpoint, the effects on hindgut fermentation have been poorly studied. Moreover, although cats and humans differ metabolically in many ways and cats do not live nearly as long as humans, the effects of diet on long-term intestinal health outcomes (e.g. disease incidence), if any, are unknown and require further study.
Using quantitative PCR, a recent study in adult cats in our laboratory demonstrated reduced faecal Bifidobacterium and Lactobacillus in those fed a high-protein, low-carbohydrate (HPLC) v. moderate-protein, moderate-carbohydrate (MPMC) diet(Reference Lubbs, Vester and Fastinger10). Using quantitative PCR and denaturing gradient gel electrophoresis, a similar response in faecal microbiology was observed in kittens fed these same diets(Reference Vester, Dalsing and Middelbos11). Moreover, diet-induced changes in blood lipids and hormones, physical activity and body fat percentage were observed in these kittens(Reference Vester, Liu and Keel12). Given the targeted microbiological and physiological response observed in these kittens previously, we hypothesised that a HPLC diet will promote the growth of proteolytic bacteria, whereas intake of a MPMC diet will increase the abundance of saccharolytic bacteria. Thus, the study was conducted to characterise the entire faecal microbiome of growing kittens fed a HPLC and MPMC diet using 16S ribosomal RNA (16S rRNA) gene pyrosequencing, and to identify the associations between the microbiota and host physiological data.
Materials and methods
Animals and diets
The animal protocol was approved by the University of Illinois Animal Care and Use Committee and was conducted at the Edward R. Madigan Laboratory of the University of Illinois. For the present study, eight domestic shorthair female cats (3·5 (sem 0·24) kg body weight and 1·3 (sem 0·02) years of age) and one male domestic shorthair cat (5·8 kg and 1·3 years of age) were used to produce kittens. All female cats were randomly assigned to two test diets, 1 month before mating, and continued throughout gestation and lactation. Kittens from mothers fed the MPMC diet (n 7) or the HPLC diet (n 7) were studied herein. The kittens were housed with dams until 8 weeks of age, weaned and then fed the same diets as mothers. After weaning, the kittens were twin- or triple-housed within the dietary group in cages (1 × 0·76 × 0·7 m) in temperature-controlled rooms with ad libitum food and water intake to allow for adequate growth. The kittens were allowed out of their cage to play with people and each other at least once per d to minimise post-weaning stress and to improve their socialisation. Fresh faecal samples (within 15 min of defecation) were collected from all kittens at 8, 12 and 16 weeks of age. All faecal samples were stored immediately at − 80°C.
The diets were formulated and manufactured by Natura Manufacturing, Inc. The ingredients and chemical composition of both diets are given in Table 1. Both diets were formulated to meet or exceed all nutrient requirements for growth according to the Association of American Feed Controls Officials (2007). Chemical analyses of the diets were done according to the procedures described by Vester et al. (Reference Vester, Dalsing and Middelbos11).
Ingredients and chemical composition of the moderate-protein, moderate-carbohydrate (MPMC) or high-protein, low-carbohydrate (HPLC) diet fed to kittens
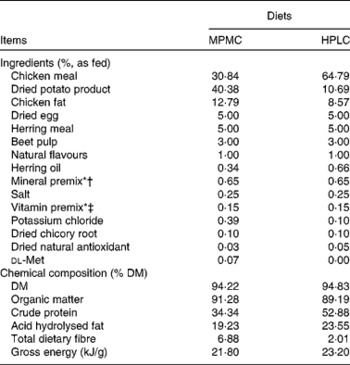
* Trouw Nutrition (Highland, IL, USA).
† Composition of mineral premix (g/kg mix): CaCO3, 360·2; ZnSO4, 208·3; OPTiMIN (Trouw Nutrition) Zn proteinate (15 % Zn; Trouw Nutrition), 166·7; FeSO4, 77·4; OPTiMIN Fe proteinate (15 % Fe), 53·3; CuSO4, 35·7; OPTiMIN Cu proteinate (10 % Cu), 3·0; MnSO4, 23·4; OPTiMIN Mn proteinate (15 % Mn), 16·7; Se, 12·0; carrier (soyabean oil), 10·0; OPTiMIN Co proteinate (2·5 % Co), 3·8; I, 1·8; CoCO3, 0·6.
‡ Composition of vitamin premix (g/kg mix): carrier (pea fibre), 728·4; CaCO3, 170·9; vitamin E (50 % adsorbate), 40·0; betaine (source of choline), 26·0; carrier (soyabean oil), 10·0; nicotinic acid, 9·6; vitamin A, 4·0; d-calcium pantothenate, 2·7; vitamin B1 (thiamin mononitrate), 2·7; vitamin B2 (riboflavin), 1·25; β-carotene, 1·0; vitamin B12, 1·0; vitamin D3, 0·8; biotin, 0·7; vitamin B6 (pyridoxine), 0·7; folic acid, 0·2.
Faecal DNA extraction and pyrosequencing
Bacterial DNA was extracted using a QIAamp DNA stool mini kit (Qiagen) using the repeated bead beating plus column method(Reference Yu and Morrison13). Faecal DNA was quantified using a NanoDrop ND-1000 spectrophotometer (NanoDrop Technologies). Extracted DNA was diluted to 20 ng/μl and genomic DNA quality was assessed using electrophoresis using precast E-Gel® EX Gel 1 % (Invitrogen). Amplification of a 600 bp sequence of the variable region V4–V6 of the 16S rRNA gene was done using barcoded primers according to Cephas et al. (Reference Cephas, Kim and Mathai14). PCR amplicons of all samples were further purified using AMPure XP beads (Beckman-Coulter, Inc.) to remove smaller fragments. Further DNA concentration and quality was measured using a NanoDrop ND-1000 spectrophotometer and electrophoresis, respectively. Finally, the amplicons were combined in equimolar ratios to create a DNA pool that was used for pyrosequencing. DNA quality was assessed before pyrosequencing using a 2100 Bioanalyzer (Agilent). Pyrosequencing of the PCR amplicons was performed at the W. M. Keck Center for Biotechnology at the University of Illinois using a 454 Genome Sequencer and FLX titanium reagents (Roche Applied Science). After sequencing was completed, all reads were scored for quality and any poor-quality reads and primer dimers were removed.
Bioinformatics
The sequences were selected to estimate total bacterial diversity of DNA samples and were trimmed to remove barcodes, primers, chimeras, plastid, mitochondrial, any non-16S bacterial reads and sequences < 350 bp. A total of 4500 ± 100 sequences from each sample were selected based upon the highest average quality score, sequences trimmed to 350 bp and aligned with MUSCLE (Multiple Sequence Comparison by Log-Expectation)(Reference Edgar15), and then the distance matrix was calculated from the alignment with PHYLIP (PHYLogeny Inference Package). Operational taxonomical units was assigned by MOTHUR(Reference Thompson, Gibson and Plewniak16). Bacterial identification community structure was evaluated using Phred20 quality reads, including both 530F and 1100R oriented (each analysed separately), trimmed to remove tags and primer sequence collections, and then depleted of chimera, plastid, mitochondrial and any non-16S reads ( < 70 % identity to any known high-quality 16S sequence) and sequences < 250 bp. The final sequence data were evaluated using Kraken (www.krakenblast.com) against a 10-21-10 version database curated from the NCBI to include >300 000 high-quality 16S bacterial sequences as well as quality-control screening sequences for mitochondria, plastid and chloroplast screening sequences. Blast output based upon top hit designations was compiled to generate percentage files at each taxonomic level as described previously(Reference Gontcharova, Youn and Wolcott17, Reference Smith, Snow and Rees18).
Statistical analyses
Sequence percentages at each taxonomic level were analysed as repeated measures using the Mixed Models procedure of SAS (version 9.2; SAS Institute, Inc.). The statistical model included kitten as a random effect and diet, age and diet × age as fixed effects. Means were separated for treatments using a Fisher-protected least significant difference with Tukey's adjustment. Results are reported as least-squares means with P< 0·05 defined as significant and 0·05 ≤ P< 0·10 as trends. Principal component analysis (PCA) of bacterial families and blood metabolites and hormones at 8 weeks was done using JMP software of SAS (SAS Institute Inc.).
Results
Kitten faecal microbiota
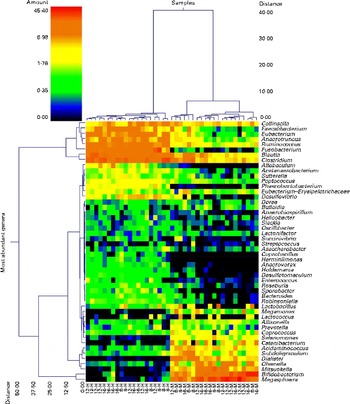
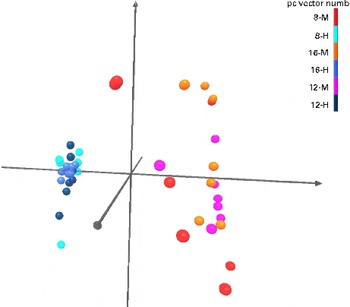
Pyrosequencing of 16S rRNA gene barcoded amplicons resulted in a total of 384 588 sequences, with an average of 9374 (range 5204–13 456) per sample. The operational taxonomical unit estimates of diversity were not different (P>0·05) among the groups (data not shown), which indicates that faecal bacterial diversity was not different among the dietary groups or ages. The dual hierarchical clustering dendrogram of the fifty most abundant bacterial genera indicated distinct clustering of samples based on the protein:carbohydrate ratio regardless of age (Fig. 1). Faecal Collinsella, Faecalibacterium, Eubacterium, Anaerotruncus, Ruminococcus, Fusobacterium, Blautia and Clostridium were most abundant in HPLC-fed kittens. In contrast, kittens fed the MPMC diet had higher abundance of Megasphaera, Bifidobacterium and Mitsuokella. Further analysis using Uni Frac PCA also showed that kittens fed the HPLC diet were clustered distinct from MPMC-fed kittens regardless of age (Fig. 2).
Dual hierarchical clustering dendrogram of the fifty most abundant bacterial genera among the kitten samples collected at 8, 12 and 16 weeks of age and fed the moderate-protein, moderate-carbohydrate (M) or high-protein, low-carbohydrate (H) diet. This double dendrogram is based on the Wards clustering and Manhattan distance methods. The heat map depicts the relative percentage of each genus for each sample. The relative distance scale for the left y-axis is provided in the lower left corner of the figure. The colour scale for the heat map is shown in the upper left corner of the figure.
Principal component analysis of Uni Frac distance metric. Light and dark blue, and black balls represent high-protein, low-carbohydrate (HPLC; H)-fed kittens and orange, red and purple balls represent moderate-protein, moderate-carbohydrate (MPMC; M)-fed kittens. Kittens fed the HPLC diet were clustered distinct from MPMC-fed kittens regardless of age.
Firmicutes was the most abundant bacterial phylum in all kitten faeces at all ages, followed by Actinobacteria, Fusobacteria and Proteobacteria (Table 2). A diet × age interaction was observed for faecal Firmicutes (P< 0·05) and Actinobacteria (P< 0·01). Kittens fed the MPMC and HPLC diets had similar faecal Firmicutes at 8 weeks of age. Kittens fed the MPMC diet had lower faecal Firmicutes at 12 and 16 weeks of age compared with 8 weeks of age (P< 0·05), whereas no change was observed with age for kittens fed the HPLC diet. Faecal Actinobacteria abundance was greater (P< 0·05) in MPMC-fed v. HPLC-fed kittens at 8 weeks. The disparity in faecal Actinobacteria grew with age, as this population did not change over time in kittens fed the HPLC diet, but continued to increase (P< 0·05) with age in MPMC-fed kittens. In contrast, the proportion of faecal Fusobacteria and Proteobacteria was greater (P< 0·0001) in HPLC-fed v. MPMC-fed kittens. Fusobacteria were almost absent in MPMC-fed kittens, but the second most prevalent phylum in HPLC-fed kittens, regardless of age.
Bacterial families (expressed as a percentage of sequences) in the faeces of kittens fed a moderate-protein, moderate-carbohydrate (MPMC) or high-protein, low-carbohydrate (HPLC) diet at 8, 12 and 16 weeks of age as determined by 16S rRNA gene pyrosequencing (Mean values with their pooled standard errors, n 7)

a,b,cMean values with unlike superscript letters within a row were significantly different (P< 0·05).
* Unknown family within the order Clostridiales.
Among the Firmicutes, Veillonellaceae, Ruminococcaceae, Clostridiaceae, Erysipelotrichaceae, Lachnospiraceae, Lactobacillaceae and Eubacteriaceae were predominant families in kitten faeces (Table 2). Veillonellaceae was the most abundant bacterial family present in MPMC-fed kittens and greater (P< 0·0001) than in HPLC-fed kittens at all time points. However, faecal Clostridiaceae, Eubacteriaceae and Lachnospiraceae were greater (P< 0·001) in HPLC-fed kittens. A significant (P< 0·001) diet × age interaction was observed for faecal Ruminococcaceae and Lactobacillaceae. Faecal Ruminococcaceae was not affected by diet at 8 weeks of age. After weaning, however, faecal Ruminococcaceae increased in HPLC-fed kittens and decreased in MPMC-fed kittens. Faecal Lactobacillaceae abundance was greater (P< 0·05) in kittens fed the MPMC v. HPLC diet at 8 weeks of age, but were decreased to abundance similar to that of HPLC-fed kittens after weaning. The abundance of faecal Erysipelotrichaceae was only affected by age, being quite low at 8 weeks of age and then increased (P< 0·05) with age in both dietary treatment groups.
Within the phylum Actinobacteria, the proportion of faecal Coriobacteriaceae and Bifidobacteriaceae demonstrated a diet × age interaction (P< 0·05). At 8 weeks, MPMC-fed kittens had greater faecal Bifidobacteriaceae abundance compared with HPLC-fed kittens. In MPMC-fed kittens, the abundance of faecal Bifidobacteriaceae increased (P< 0·05) with age. Faecal Bifidobacteriaceae, however, remained very low in HPLC-fed kittens throughout the study. Faecal Coriobacteriaceae were not affected by diet at 8 weeks. After weaning, however, faecal Coriobacteriaceae decreased in HPLC-fed kittens and increased in MPMC-fed kittens. Faecal Fusobacteriaceae were only affected by diet, with kittens fed the HPLC diet having greater (P< 0·0001) abundance than those fed the MPMC diet.
Among the well-characterised genera within the phylum Firmicutes, a significant (P< 0·05) diet × age interaction was observed for faecal Blautia, Dialister, Acidaminococcus, Megasphaera, Phascolarctobacterium, Ruminococcus, Faecalibacterium, Subdoligranulum, Eubacterium, Catenibacterium and Lactobacillus (Table 3). Faecal Dialister, Acidaminococcus and Catenibacterium were lower (P< 0·001) in HPLC-fed kittens than in MPMC-fed kittens. Faecal Megasphaera also was lower (P< 0·0001) in HPLC-fed kittens, but greater at 12 weeks of age compared with 8 weeks of age in MPMC-fed kittens. In contrast, faecal Blautia, Ruminococcus, Faecalibacterium and Eubacterium were lower (P< 0·001) in MPMC-fed kittens than in HPLC-fed kittens at all ages. Faecal Clostridium and Mitsuokella were affected (P< 0·0001) by diet; Clostridium being higher and Mitsuokella being lower in HPLC-fed kittens. Faecal Olsenella and Collinsella were affected (P< 0·001) by diet. Faecal Olsenella abundance was greater (P< 0·0001) and faecal Collinsella was lower (P< 0·001) in MPMC-fed kittens. Faecal Bifidobacterium had significant (P< 0·05) diet × age interactions. Faecal Bifidobacterium abundance was greater (P< 0·05) in MPMC-fed kittens at 8 weeks of age, and increased (P< 0·05) with age. Faecal Bifidobacterium remained low in HPLC-fed kittens throughout the study. In contrast, faecal Fusobacterium was greater (P< 0·0001) in HPLC-fed kittens. The abundance of faecal Lactobacillus was highest at 8 weeks in MPMC-fed kittens and then decreased (P< 0·05) after weaning to abundance similar to that of HPLC-fed kittens.
Bacterial genera (expressed as a percentage of sequences) in the faeces of kittens fed a moderate-protein, moderate-carbohydrate (MPMC) or high-protein, low-carbohydrate (HPLC) diet at 8, 12 and 16 weeks of age as determined by 16S rRNA gene pyrosequencing (Mean values with their pooled standard errors, n 7)

a,b,cMean values with unlike superscript letters within a row were significantly different (P< 0·05).
* Unknown genus within the family Clostridiaceae.
The abundance of faecal Clostridium hiranonis, Clostridium citroniae, Blautia glucerasea and Eubacterium coprostanoligenes was higher (P< 0·001) in HPLC-fed v. MPMC-fed kittens (Table 4). In contrast, faecal Megasphaera elsdenii was affected by age × diet interaction (P< 0·0001), being highest at 12 weeks of age in MPMC-fed kittens. The abundance of faecal Catenibacterium mitsuokai was greater (P< 0·05) at 12 and 16 weeks than at 8 weeks of age in MPMC-fed kittens. Faecal Olsenella profusa was only affected by diet and was predominant (P< 0·001) in HPLC-fed kittens.
Bacterial species (expressed as a percentage of sequences) in the faeces of kittens fed a moderate-protein, moderate-carbohydrate (MPMC) or high-protein, low-carbohydrate (HPLC) diet at 8, 12 and 16 weeks of age as determined by 16S rRNA gene pyrosequencing (Mean values with their pooled standard errors, n 7)

a,b,c,dMean values with unlike superscript letters within a row were significantly different (P< 0·05).
The PCA of faecal bacterial families, blood metabolites and hormones resulted in four distinct clusters (Fig. 3). One cluster included blood TAG and faecal Clostridiaceae, Eubacteriaceae, Ruminococcaceae, Fusobacteriaceae and Lachnospiraceae. A second cluster consisted of blood ghrelin and faecal Coriobacteriaceae, Bifidobacteriaceae and Veillonellaceae. A third cluster consisted of blood glucose, cholesterol and leptin, and faecal Lactobacillaceae. The last cluster included body weight, blood creatinine, urea N, protein and albumin. The PCA loading plot indicated that blood TAG are negatively correlated with faecal Veillonellaceae and faecal Bifidobacteriaceae (angle close to 180° among variables). Similarly, faecal Lactobacillaceae had a negative association with body weight and positive with blood leptin.
Principal component analysis loading plot of the primary faecal bacterial families and blood metabolites and hormones of interest in seven healthy growing kittens fed the moderate-protein, moderate-carbohydrate or high-protein, low-carbohydrate diet. The loading plots indicate the relationships among variables. 1, Blood leptin; 2, blood ghrelin; 3, body weight; 4, blood creatinine; 5, blood urea nitrogen; 6, blood protein; 7, blood albumin; 8, blood glucose; 9, blood cholesterol; 10, blood TAG; 11, faecal Eubacteriaceae; 12, faecal Ruminococcaceae; 13, faecal Coriobacteriaceae; 14, faecal Fusobacteriaceae; 15, faecal Clostridiaceae; 16, faecal Veillonellaceae; 17, faecal Lachnospiraceae; 18, faecal Bifidobacteriaceae; 19, faecal Lactobacillaceae.
Discussion
There has been a recent surge in research studying the impact of macronutrient ratios, especially protein:carbohydrate, on human and animal metabolism. In feline nutrition, HPLC diets are often marketed based on the carnivorous nature of cats. Moreover, a HPLC diet has been suggested to prevent metabolic diseases such as obesity and type 2 diabetes(Reference Kushner and Doerfler19). Although HPLC diets have been promoted to improve the metabolic health of humans and companion animals, their effect on the gut microbiome is not known. The commensal microbes are important in the development of the gut immune system and pathogen resistance, and thus the prevention of gastrointestinal diseases(Reference Cebra20). A few studies have provided a detailed view of the gut microbiome of healthy adult cats using next-generation pyrosequencing techniques(Reference Ritchie, Steiner and Suchodolski6, Reference Handl, Dowd and Garcia-Mazcorro7). However, to our knowledge, the present study is the first to describe the dietary and age effects in growing kittens using 16S rRNA gene pyrosequencing.
The predominant bacterial phylum present in our kittens (i.e. Firmicutes) was similar to previous reports in adult cats(Reference Ritchie, Steiner and Suchodolski6, Reference Ritchie, Burke and Garcia-Mazcorro21) and dogs(Reference Middelbos, Vester Boler and Qu22). Interestingly, the abundance of faecal Firmicutes decreased with age slightly, with approximately 10 % of sequences being replaced by faecal Actinobacteria in MPMC-fed kittens. In contrast, no changes were observed for faecal Firmicutes, Actinobacteria and Fusobacteria with increasing age in HPLC-fed kittens.
The colonisation of the newborn gut usually starts immediately after birth. Various internal and external factors contribute to the development of the core microbiota. In humans, the gut microbiota has been considered stable at 2 years of age and almost identical to adults(Reference Thompson-Chagoyan, Maldonado and Gil23). This has not been adequately studied in cats. The initial colonisation of the gastrointestinal tract is believed to be quite important in human infants, as it might define the lifelong composition of the gut microbiota and consequently contribute to host health(Reference Adlerberth4). Specifically, the genus Bifidobacterium has been linked to weight gain. Bifidobacteria numbers were shown to be higher in normal-weight v. overweight children, implying that high Bifidobacterium in infancy may provide protection against metabolic diseases later in life(Reference Kalliomaki, Salminen and Isolauri5). Bifidobacteria are also positively linked with gastrointestinal health. Lower faecal Bifidobacterium, for example, has been associated with the incidence of inflammatory bowel disease in adult cats(Reference Inness, McCartney and Khoo24). The vast differences in Bifidobacterium in the present study, with an almost absence of Bifidobacterium in HPLC-fed kittens, are of great interest. High protein intake may lead to an increased flow of undigested protein to the colon(Reference Magee, Richardson and Hughes25), which is subjected to fermentation and the production of harmful nitrogenous metabolites(Reference Gill and Rowland26). Fermentative end products, such as branched-chain fatty acids, NH3, indoles and phenols, have been associated with increased colon cancer(Reference Norat and Riboli27) and ulcerative colitis(Reference Ramakrishna, Roberts-Thomas and Pannall28) in humans. Although cats differ from humans metabolically, are obligate carnivores that have evolved consuming high protein concentrations, and do not have a high incidence of colon cancer, they do develop inflammatory bowel diseases that may be contributed to by diet. Thus, the effects of diet on the feline gut microbiome and its potential role in disease should be studied in the future. The present data agree with those of earlier studies in adult cats(Reference Lubbs, Vester and Fastinger10) and kittens(Reference Vester, Dalsing and Middelbos11) fed these same diets in which a HPLC diet led to reduced faecal Bifidobacterium. The near absence of Bifidobacterium in HPLC-fed kittens could have been due to the lack of carbohydrate-based substrates, the negative effects of protein-fermentative metabolites or competitive exclusion by protein-fermenting microbes in the gut. While these data would indicate detrimental effects of high protein intake in kittens, all kittens remained healthy throughout the study, without any signs of gastrointestinal distress (e.g. loose stools, excessive gas), and are still maintained in our colony in adulthood.
The presence of faecal Fusobacteria in HPLC-fed kittens is not surprising, as this group has been reported to be proteolytic and to ferment various amino acids and be only weakly saccharolytic(Reference Loesche and Gibbons29, Reference Potrykus, White and Bearne30). In healthy adult cats, a lower abundance of faecal Fusobacteria has been reported previously(Reference Ritchie, Steiner and Suchodolski6, Reference Handl, Dowd and Garcia-Mazcorro7). Although this bacterial group has been associated with liver cirrhosis, appendicitis(Reference Swidsinski, Dorffel and Loening-Baucke31) and various oral cavity infections(Reference Bennett and Eley32) in humans, all of the kittens in the present study were healthy and had Fusobacteria populations similar to those of dogs in recent studies(Reference Middelbos, Vester Boler and Qu22, Reference Suchodolski33).
Among the Firmicutes, faecal Clostridiaceae, Ruminococcaceae, Eubacteriaceae, which include the genera Clostridium, Blautia, Ruminococcus and Faecalibacterium, were dominant in HPLC-fed kittens. C. hiranonis was one species detected in greater amounts in HPLC-fed kittens. This species exhibits bile acid 7α-dehydroxylation activity, which results in the 7α-dehydroxylation of bile primary salts to secondary salts(Reference Kitahara, Takamine and Imamura34). The presence of secondary bile acids is correlated with the increased risk of colon cancer in humans(Reference Reddy, Simi and Patel35). Similarly, Clostridium hathewayi and C. citroniae have been reported to contribute to acute cholecystitis, hepatic abscess and bacteraemia(Reference Elsayed and Zhang36), acute appendicitis(Reference Woo, Lau and Woo37), and clinical infections(Reference Warren, Tyrrell and Citron38). In contrast, the families Ruminococcaceae, Lachnospiraceae and Eubacteriaceae including genera such as Ruminococcus, Faecalibacterium, Eubacterium and Phascolarctobacterium were greater in HPLC-fed kittens. These families are known to degrade dietary fibre and produce SCFA(Reference Louis, Duncan and McCrae39). In particular, E. coprostanoligenes has been shown to have hypocholesterolaemic effects(Reference Freier, Beitz and Li40).
Another lactate-utilising butyrate producer, M. elsdenii, abundance was significantly greater in MPMC-fed kittens. This species has been used as a probiotic to promote recovery from diarrhoea in rats(Reference Hashizume, Tsukahara and Yamada41), and is known to improve mucosal atrophy in the small and large intestine of weaning pigs(Reference Yoshida, Tsukahara and Ushida42). Moreover, Megasphaera is one of the major butyrate producers in the gut and thus promotes intestinal health(Reference Su, Yao and Perez-Gutierrez43). The lactate producer, Mitsuokella, may support Megasphaera (lactate utiliser) in MPMC-fed kittens and highlight the significance of cross-feeding. Although the complete absence of these two bacterial groups in HPLC-fed kittens may suggest detrimental effects of excess protein intake on gut microbes, there was no sign of weaning stress in any kittens.
The abundance of faecal Lactobacillus was higher in MPMC-fed kittens and decreased after weaning (8 weeks). Various studies have reported significant decreases of Lactobacillus after weaning(Reference Su, Yao and Perez-Gutierrez43, Reference Konstantinov, Awati and Williams44), often explained by unavailability of substrates (lactate) and change in gastric pH. Studies in pigs have indicated that early colonisation of Lactobacillus influences the development of the immune system, intestinal structure and integrity, and decreased pathogen load(Reference Scharek, Guth and Reiter45), thus improving intestinal and overall health(Reference Hacin, Rogelj and Matijasic46, Reference Spencer and Chesson47). A higher number of probiotic Lactobacillus also have been reported to prevent gastrointestinal disturbances related to weaning stress in piglets(Reference Siggers, Siggers and Boye48). Considering the significance of Lactobacillus at the time of weaning, a diet containing a moderate balance of protein and carbohydrates may provide greater stability than one containing very high concentrations of protein.
The PCA of faecal microbial data indicated distinct clustering and separation of samples of kittens fed the HPLC diet at all ages. However, no distinct clustering was observed for MPMC-fed kittens, indicating that the HPLC-based effects were more significant than the age effects on gut microbial communities. Similar separation due to the diet has been reported using denaturing gradient gel electrophoresis banding patterns previously, which further confirms that protein intake significantly affects the composition of gut microbial communities(Reference Vester, Dalsing and Middelbos11).
The PCA of abundant faecal bacterial families and blood hormones and metabolites indicated some interesting associations. One association to note was that of the well-known probiotic bacteria, Lactobacillus, with blood leptin concentrations. Leptin has an important role in satiety, interacting with hypothalamic receptors to control appetite and energy storage(Reference Banks49). Other interesting associations involved the bacterial family Bifidobacteriaceae, which was positively correlated with fasting blood ghrelin and negatively correlated with blood TAG. Human studies have reported the positive effects of probiotics on blood lipids through increased deconjugation of bile salts, resulting in greater excretion, which in turn leads to lower enterohepatic circulation(Reference Pereira and Gibson50). Although faecal bile salts were not measured in the present study, the present results seem to agree with previous reports and highlight the significance of the gut microbiome to host metabolism and satiety.
In conclusion, the present study demonstrated a significant impact of dietary protein:carbohydrate ratio on the composition of the gut bacterial microbiome in growing kittens. These data clearly demonstrate that differences in dietary protein and carbohydrate affect the populations of bacteria, especially within the Firmicutes, Actinobacteria and Fusobacteria phyla. In general, high protein intake appeared to have a potential negative impact on the amount of health-promoting bacteria, such as Bifidobacterium, Megasphaera and Lactobacillus. Furthermore, strong associations between blood hormones and metabolites and well-known probiotic bacterial families indicate potential significance as it pertains to satiety and host metabolism. Further research is required to identify any health implications of having such different gut microbiota populations early in life, namely how long-term metabolism and health of the host may be affected.
Acknowledgements
This study received no specific grant from any funding agency in the public, commercial or not-for-profit sectors. S. H., B. M. V. B. and K. S. S. designed the research; S. H., K. R. K. and B. M. V. B. conducted the research; S. H. and S. E. D. analysed the data; S. H. and K. S. S. wrote the paper; K. S. S. had primary responsibility for the final content. All authors read and approved the final manuscript. The authors declare that there is no conflict of interest.


