


The AIDS epidemic is most severe in sub-Saharan Africa, where chronic food insecurity and undernutrition are pervasive. In addition to the well-documented negative impacts of HIV/AIDS on food security and other socio-economic outcomes in Africa(Reference Barnett and Whiteside1–Reference Kadiyala and Chapoto3), there is a growing recognition of food insecurity as a potential cause of worse health outcomes among people living with HIV (PLWHIV). Food insecurity – defined as a lack of access to food of sufficient quality and quantity to perform usual daily activities – has been associated with increased behavioural risk of HIV transmission(Reference Weiser, Leiter and Bangsberg4), adverse antiretroviral pharmacokinetics(Reference Boffito, Acosta and Burger5, Reference Sekar, Kestens and Spinosa-Guzman6), reduced access to HIV treatment and care(Reference Mshana, Wamoyi and Busza7, Reference Tuller, Bangsberg and Senkungu8), decreased adherence to antiretroviral therapy (ART)(Reference Au, Kayitenkore and Shutes9, Reference Olupot-Olupot, Katawera and Cooper10) and worse clinical outcomes among HIV-infected individuals(Reference Au, Kayitenkore and Shutes9, Reference Weiser, Frongillo and Ragland11, Reference Weiser, Fernandes and Brandson12).
The value of a diverse diet to meet the requirements for essential nutrients has long been recognized. Optimal macro- and micronutrient status of PLWHIV is essential to maximize the period of asymptomatic infection, to mount an effective immune response to fight opportunistic infections and to optimize the benefits of ART. HIV infection has long been associated with wasting syndrome, and being underweight with HIV is a strong risk factor for mortality(Reference Tang13, Reference van der Sande, van Der Loeff and Aveika14), even in people receiving ART(Reference Johannessen, Naman and Ngowi15–Reference Zachariah, Fitzgerald and Massaquoi17).
Despite the widespread recognition of the interconnectedness between HIV, food insecurity and undernutrition, there is scant evidence quantifying the associations between household food security and nutritional status among HIV-infected individuals. Food security is a multidimensional concept embodying several dimensions, including the availability of and access to food, the perceptions and experiences of food security and the quality of diets to meet nutrient adequacy. Because of the many facets of the concept, there is lack of clarity in the literature on the dimensions of food security critical for the nutritional well-being of PLWHIV. We therefore examined how the access and experiential dimensions of food security are associated with anthropometric status of PLWHIV.
Additionally, no studies to date have examined the extent to which this association may be mediated through diet quality, rather than food access alone. Diet quality, to meet nutrient adequacy, is a central notion in the definition of food security. Diverse measures of diet quality have been associated with nutrient adequacy(Reference Hatloy, Torheim and Oshaug18, Reference Torheim, Ouattara and Diarra19) and several health and nutrition outcomes, including all-cause mortality, in developed and developing countries(Reference Kant, Schatzkin and Harris20–Reference Ruel22). Therefore, we also investigated whether diet quality predicts anthropometric status of PLWHIV. Finally, it is well established that as incomes increase, consumers shift away from inexpensive staple-based diets and towards a more diverse range of foods such as animal-source foods(Reference Bennett23). We therefore investigated whether the pathway between household food security (access) and anthropometric status is mediated through an individual's diet diversity.
The objectives of the present study were to: (i) examine the independent association between access and the experiential dimension of household food security (from now on referred to as ‘household food security’), individual diet quality and anthropometric status among PLWHIV; and (ii) determine the extent to which any association between household food security and nutritional status is mediated through diet quality.
Methods
Study population
We present results from a baseline survey of 902 HIV-positive adults and their households recruited into a study evaluating the impact of a food assistance programme in Uganda supported by the World Food Programme (WFP). All of the study participants were registered with The AIDS Support Organization (TASO), the largest indigenous non-governmental organization in Uganda with over 200 000 registered clients, which has provided HIV prevention, care and treatment services since 1987. Having recognized the threat food insecurity poses to their HIV-related programme goals, TASO entered into a partnership with WFP to provide monthly household food rations to PLWHIV in selected TASO catchment areas. The eligibility criterion for receiving WFP assistance was determined by the WFP's poverty assessment tool based on several socio-economic criteria.
The present study was conducted in two districts in Uganda – Gulu and Soroti – and was nested within a routine programmatic context of both TASO and WFP. Gulu, where WFP targeted TASO clients and their households with food assistance, served as the intervention site. Soroti, where WFP was not operational at the time of the study, served as the comparison site.
We recruited 451 adult HIV-positive individuals in each district based on the following eligibility criteria: (i) eligible for receipt of a WFP monthly household food basket, based on WFP's poverty assessment criteria; (ii) non-receipt of food assistance in the previous 12 months; (iii) CD4 count between 200 and 450 cell/μl; and (iv) ART-naïve. The study participant recruitment and the baseline survey were conducted between August 2008 and September 2009.
Measures
Household food insecurity
Household food insecurity was measured using the Household Food Insecurity Access Scale (HFIAS)(Reference Coates, Swindale and Bilinsky24). The HFIAS has nine questions on experiential food insecurity (access) with an option of four responses (‘no’ = 0, ‘rarely’ = 1, ‘sometimes’ = 2, ‘often’ = 3) for each of the questions. Scores range from 0 to 27; higher scores reflect more severe food insecurity. HFIAS score, as a continuous measure of the degree of food insecurity and as a dichotomous variable for the severity of food insecurity (severely food insecure v. all other categories), were both used as explanatory variables. Following Coates et al.(Reference Coates, Swindale and Bilinsky24) we created the food security categories sequentially, to ensure that households were classified according to their most severe response. A severely food-insecure household has transitioned to cutting back on meal sizes, or the number of meals, often, and/or experiences any of the most severe conditions (running out of food, going to bed hungry, going a whole day and night without eating), even if infrequently or rarely. That is, a household that experienced any one of the three conditions even once during the previous 4 weeks was classified as severely food insecure.
Individual diet quality
Individual diet quality was measured using the Individual Dietary Diversity Score (IDDS)(Reference Swindale and Bilinsky25), a proxy measure of the nutritional quality of an individual's diet. IDDS is the sum of different food groups consumed in the 24 h preceding the recall. The following set of twelve food groups was used to calculate the IDDS: (i) cereals; (ii) roots and tubers; (iii) pulses and legumes/nuts; (iv) vegetables; (v) fruits; (vi) meat and poultry; (vii) eggs; (viii) fish and seafood; (ix) milk and milk products; (x) oils and fats; (xi) sugar and sweets; and (xii) condiments and miscellaneous. Three categories of dietary diversity were created, based on IDDS: (i) low (0–4), (ii) medium (5–8) and (iii) high (9–12).
Anthropometry
Anthropometric measures were the primary outcome indicators. These included: (i) BMI (kg/m2) and a dichotomous variable of being underweight based on BMI (BMI < 18·5 kg/m2); and (ii) mid upper-arm circumference (MUAC) and a dichotomous variable of being wasting based on MUAC (<230 mm for males; <220 mm for females).
Covariates
Covariates included individual-, household- and community-level variables that may be associated with the main outcome of interest. We included age, sex, CD4 count (cells/μl), education (below or above primary level), if the person is the head of the household or spouse of the household head, if the person is in stable relationship (married or cohabiting for 2 years), if the household lives in an internally displaced camp, household size, per capita total monthly household expenditure in Ugandan Shillings, time to TASO clinic (min) and distance to the nearest government hospital (km). We included an access to market variable (distance to the nearest market in km), as it affects food prices, access to information and resources including food. Finally, we included month and year of the interview, and a district dummy to control for district-level unobservable characteristics.
Ethical review
The ethics review boards of TASO, the Uganda National Council on Science and Technology and the International Food Policy Research Institute approved the study protocol.
Statistical analyses
As per our postulated model, nutrition status is a function of household food insecurity, individual dietary diversity and other individual-, household- and community-level characteristics as described in above. We employed multivariate ordinary least-squares (OLS) methods for continuous outcome variables (BMI and MUAC) and logistic regression for the categorical outcome variables, underweight and wasting. Multicollinearity was assessed in the models using variance inflation factor tests.
We tested for two-way interactions between the main explanatory variables (HFIAS and IDDS) and education and expenditure tertiles in multivariate analyses. None of the interaction variables were significant at 10 % level. That is, the association between HFIAS and IDDS did not change depending on the educational status of the individual and household economic factors. All interaction terms were consequently dropped from the final models presented.
We used path analysis with observed variables to analyse the pathway from household food insecurity to nutritional status of PLWHIV, through individual dietary diversity. Direct associations and standard errors were generated for the household food insecurity to nutritional status pathway. Indirect associations are calculated as the product of the parameter estimates (path coefficients) along a given path. Standard errors for indirect effects with two path coefficients were calculated as the square root of the sum of the square of individual standard errors. We used the pathreg command in the STATA statistical software package version 11 (SAS Institute Inc., Cary, NC, USA) to perform path analysis. We present standardized regression coefficients (β) as well as non-standardized coefficients.
Results
The mean BMI of the study participants was 20·5 (sd 2·6) kg/m2, with 22·4 % of the population classified as being underweight; mean MUAC was 266 (sd 31) mm, with 5·6 % of the population classified as being wasted (Table 1). Mean HFIAS was 15·2 (sd 5·0) and mean IDDS was 6·3 (sd 1·7; number of food groups/d. All individuals in the study were ART-naïve at the time of recruitment with a mean CD4 count of 338 (sd 64) cells/μl.
Descriptive characteristics of the study participants and their households: 902 people living with HIV, Gulu and Soroti districts, Uganda, August 2008–September 2009

HFIAS, Household Food Insecurity Access Scale; IDDS, Individual Dietary Diversity Score; MUAC, mid upper-arm circumference.
Multivariate regression results demonstrated independent associations of HFIAS and IDDS with BMI (Table 2) and MUAC (Table 3), after controlling for individual-, household- and community-level characteristics. Since we did not include interaction terms in the final models, HFIAS and IDDS coefficients show the unconditional effects. Increasing HFIAS score, reflecting increasing food insecurity, and decreasing IDDS, reflecting decreasing dietary diversity, were strongly and negatively associated with BMI and MUAC (Table 2, column 1; Table 3, column 1).
Multivariate regression models of the association of HFIAS and IDDS with BMI among 902 people living with HIV, Gulu and Soroti districts, Uganda, August 2008–September 2009
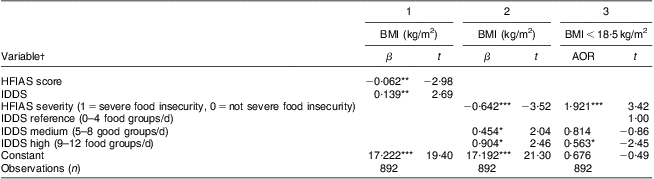
HFIAS, Household Food Insecurity Access Scale; IDDS, Individual Dietary Diversity Score; β, standardized regression coefficient; t, robust t statistic; AOR, adjusted odds ratio.
*P < 0·05, **P < 0·01, ***P < 0·001.
†The control variables included in the models were: age in years; sex; CD4 count (cells/μl); education; if the person is the head of the household or spouse of the household head; if the person is in a stable relationship; if the household lives in an internally displaced camp; household size; per capita total monthly household expenditures in tertiles; time to TASO (The AIDS Support Organization) clinic (min); distance to the nearest government hospital (km); distance to the nearest market (km); month and year of the interview; and a district dummy.
Multivariate regression models of the association of HFIAS and IDDS with MUAC among 902 people living with HIV, Gulu and Soroti districts, Uganda, August 2008–September 2009
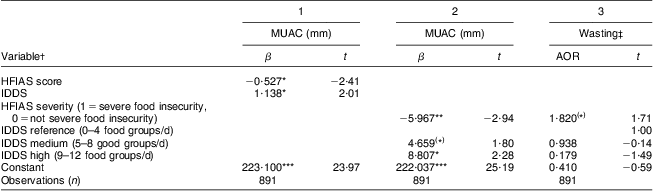
HFIAS, Household Food Insecurity Access Scale; IDDS, Individual Dietary Diversity Score; MUAC, mid upper-arm circumference; β, standardized regression coefficient; t, robust t statistic; AOR, adjusted odds ratio.
(*)P < 0·10., *P < 0·05, **P < 0·01, ***P < 0·001
†The control variables included in the models were: age in years; sex; CD4 count (cells/μl); education; if the person is the head of the household or spouse of the household head; if the person is in a stable relationship; if the household lives in an internally displaced camp; household size; per capita total monthly household expenditures in tertiles; time to TASO (The AIDS Support Organization) clinic (min); distance to the nearest government hospital (km); distance to the nearest market (km); month and year of the interview; and a district dummy.
‡Wasting defined as MUAC <230 mm for males; <220 mm for females.
HIV-infected individuals living in severely food-insecure households had a 0·64 kg/m2 lower BMI compared with those not living in severely food-insecure households (Table 2, column 2); the adjusted mean BMI, based on controlling for all other covariates in our regression models, for PLWHIV from severely and non-severely food-insecure households was 20·29 and 20·92 kg/m2, respectively (Fig. 1). The adjusted odds ratio (AOR) of PLWHIV from severely food-insecure households being underweight (BMI < 18·5 kg/m2) was 1·92 (Table 2, column 3).
Adjusted mean BMI by household food insecurity status and individual dietary diversity (low, 0–4 food groups/d; medium, 5–8 food groups/d; high, 9–12 food groups/d) among 902 people living with HIV, Gulu and Soroti districts, Uganda, August 2008–September 2009. Model controls for individual-, household- and community-level characteristics. The control variables included in the models were: age in years; sex; CD4 count (cells/μl); education; if the person is the head of the household or spouse of the household head; if the person is in a stable relationship; if the household lives in an internally displaced camp; household size; per capita total monthly household expenditures in tertiles; time to the TASO (The AIDS Support Organization) clinic (min); distance to the nearest government hospital (km); distance to the nearest market (km); month and year of the interview; and a district dummy. Mean values were significantly different: *P < 0·05, **P < 0·01
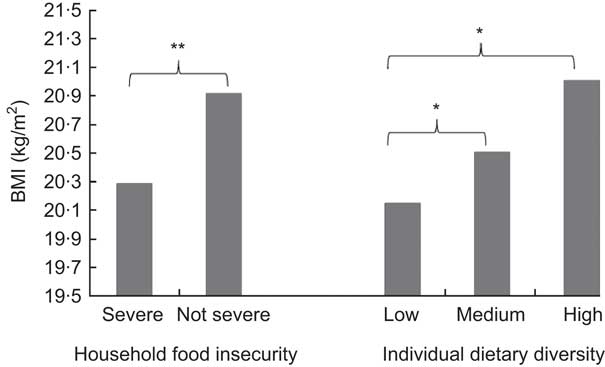
We observe a dose–response relationship between increasing dietary diversity and BMI. Individuals consuming a moderately diverse diet (5–8 food groups in the previous 24 h) and individuals consuming a highly diverse diet (9–12 food groups in the previous 24 h) had a 0·45 kg/m2 and a 0·90 kg/m2 higher BMI, respectively, compared with those consuming a diet of low diversity (0–4 food groups in the previous 24 h; Table 2, column 2). The adjusted mean BMI in our regression models for HIV-infected individuals consuming diets of low, moderate and high diversity was 20·15, 20·51 and 21·01 kg/m2, respectively (Fig. 1). The AOR of being underweight (BMI < 18·5 kg/m2) among individuals consuming a highly diverse diet was 0·56, compared with those consuming a diet of low diversity (Table 2, column 3).
The multivariate regression results for MUAC and the specifications are analogous to the models presented for BMI (Table 3). We observed a significant and negative association between HFIAS and MUAC, and a positive association between IDDS and MUAC (Table 3, column 1). Compared with PLWHIV from households that were not severely food insecure, those from severely food-insecure households had a MUAC lower by 5·97 mm, and had a 1·80 times greater odds of being wasted. Compared with individuals in the lowest IDDS category, individuals in the medium IDDS category had a MUAC higher by 4·66 mm; individuals in the highest IDDS category had a MUAC higher by 8·81 mm. IDDS categories were not significantly associated with the odds of being wasted (Table 3, columns 2 and 3).
We used path analysis to present a model where we investigated the direct effects of household food insecurity on BMI, and the indirect effects, mediated through individual dietary diversity (Fig. 2 and Table 4). The standardized direct and indirect path coefficients are presented in Fig. 2. We observed that the direct association of HFIAS with BMI (−0·116) is significant and tenfold larger in magnitude than the indirect association between HFIAS and BMI (−0·011) that is mediated through IDDS. This indirect association, less than an absolute value of 0·05, is considered trivial(Reference Hatcher26). Expressed in original non-standardized units (Fig. 2), for each unit increase in HFIAS score (with possible scores ranging from 0 to 27), the direct effect on BMI is a decrease of 0·062 kg/m2, while the indirect effect is a decrease of 0·006 kg/m2. The net result of a unit increase in HFIAS score is a decrease in BMI of 0·068 kg/m2.
Path analysis diagram showing coefficients of the direct path ( $$$$) from household food insecurity to BMI and the indirect path (
 $$$$) mediated by individual dietary diversity among 902 people living with HIV, Gulu and Soroti districts, Uganda, August 2008–September 2009. For both Path 1 (dietary diversity) and Path 2 (BMI), the model is adjusted for all variables included in regression models presented in Tables 2 and 3. *P < 0·05, **P < 0·01

Non-standardized path coefficients for direct, indirect and total effects of food insecurity through dietary diversity on BMI among 902 people living with HIV, Gulu and Soroti districts, Uganda, August 2008–September 2009

Discussion
Although the interaction between HIV, food security and nutrition status is widely postulated, few studies to date have empirically investigated underlying socio-economic and behavioural risk factors for undernutrition among HIV-infected populations in sub-Saharan Africa, where HIV and chronic food insecurity are pervasive. Using a sample of 902 PLWHIV in Uganda, we estimated the predictive link between access dimensions of household food insecurity, individual dietary diversity and anthropometric status, controlling for disease severity and other individual-, household- and community-level characteristics.
The present study reports three key findings. First, both household food insecurity and individual dietary diversity independently predict BMI and MUAC of PLWHIV in our sample. Second, the levels of food insecurity and dietary diversity matter: PLWHIV from severely food-insecure households and consuming the least diverse diets have the highest odds of being underweight and wasted. Third, the effect of household food insecurity on BMI is not mediated through individual dietary diversity. The indirect effect of food insecurity on BMI, mediated through dietary diversity, is negligible and almost entirely a result of the direct effect of food insecurity on BMI. Our paper goes beyond a qualitative description(Reference Bukusuba, Kikafunda and Whitehead27, Reference Norman, Chopra and Kadiyala28) of the relationship between food security and nutritional status among PHWHIV, and quantifies the association between key dimensions of this relationship in Uganda. To our knowledge, our study is the first to have examined the predictive link between individual dietary diversity and nutritional status in an HIV-positive population.
While the cross-sectional nature of our data limits the inferences we can make regarding causality, our study nevertheless provides new insights into some of the underlying determinants of undernutrition, beyond the disease-related determinants. Our results provide an empirical basis for focused efforts to improve access to and quantity of food, as well as the quality of food through improved dietary diversity, in HIV-infected populations. Further, our results underscore the need for broad-based approaches, regardless of their education and economic status, to tackle undernutrition (both access and quality) among PLWHIV.
The need to integrate food and nutrition interventions is now widely recognized as an essential part of a comprehensive response to the HIV epidemic, and is being rolled out and advocated for by many international organizations(29, 30) and initiatives(31). Efforts to date adopt primarily two programming approaches: (i) targeted therapeutic and supplementary nutritional support to underweight adults (e.g. PEPFAR's (The US President's Emergency Plan for AIDS Relief) Food by Prescription); and (ii) targeted food rations to food-insecure households affected by HIV in several medium and high HIV prevalence countries (e.g. WFP household food basket). More recently, there has been an increasing recognition of the need to incorporate broader solutions to promote food security. A recent review of approaches to nutrition in HIV programmes in Africa concluded that current HIV/AIDS policies ‘have tended toward highly medicalized approaches’ and called for ‘a comprehensive approach to link health strategies with community-oriented food-based strategies’(Reference Panagides, Graciano and Atekyereza32).
In an attempt to address broader underlying determinants of undernutrition at the household and community level, organizations are increasingly seeking to integrate livelihood promotion, social protection and HIV programmes to improve the food security of people infected and affected by the epidemic(31, 33, 34). Although noteworthy for a shift away from narrowly focused short-term food assistance, this shift in programming needs further refinement. Operationalizing food security in an HIV context remains weak. In order to effectively address the key dimensions of food insecurity and consequently undernutrition, these programmes need to strengthen their focus on promoting both household access to food and dietary diversity. This includes alleviating economic constraints as well as promoting consumption of locally available nutrient-rich foods to meet nutrient needs through strengthened, scaled-up and context-tailored programmes including nutrition counselling and mass campaigns to promote optimal nutrition.
Acknowledgements
This study was funded by the Regional Network on AIDS, Livelihoods and Food Security (RENEWAL) facilitated by the International Food Policy Research Institute (IFPRI), 3ie, and through an IFPRI–Concern Worldwide research partnership funded by the Kerry Group. RENEWAL is grateful for support from Irish Aid and the Swedish International Development Cooperation Agency (SIDA). The funding bodies had no role in the study. Neither author had any conflict of interest. S.K. and R.R. originated the study, conducted the data analysis, interpreted the data and wrote the paper. Both authors read and approved the final manuscript. The authors gratefully acknowledge the support of staff from TASO in Uganda, particularly those at the TASO centres in Gulu and Soroti who were directly involved in the study; the field team and the field supervisor, Moses Odeke, for their efforts in data collection; Robert Ochai and Frances Babirye at TASO headquarters for helping manage the logistics of the study; the WFP in Uganda for its support of the study; and Wahid Quabili for his guidance in data management and cleaning. Lastly, they thank all TASO clients for their participation.



