





1 Introduction
Intense lasers and strong-field physics are intricately linked and mutually beneficial. Intense lasers create extreme light conditions essential for strong-field physics research, while the demands of strong-field physics drive the development of intense lasers. To generate a stronger ponderomotive force (which scales with the product of laser intensity and square of the wavelength), the field of intense lasers has focused on enhancing both laser intensity and laser wavelength over recent decades. Currently, intense lasers with peak powers reaching up to 10 PW[
Reference Radier, Chalus, Charbonneau, Thambirajah, Deschamps, David, Barbe, Etter, Matras, Ricaud, Leroux, Richard, Lureau, Baleanu, Banici, Gradinariu, Caldararu, Capiteanu, Naziru, Diaconescu, Iancu, Dabu, Ursescu, Dancus, Ur, Tanaka and Zamfir
1
,
Reference Li, Gan, Yu, Wang, Liu, Guo, Xu, Xu, Hang, Xu, Wang, Huang, Cao, Yao, Zhang, Chen, Tang, Li, Liu, Li, He, Yin, Liang, Leng, Li and Xu
2
] and focused intensities as high as 10 ${}^{23}$
W/cm
${}^{23}$
W/cm ${}^2$
[
Reference Yoon, Kim, Choi, Sung, Lee, Lee and Nam
3
] have become pivotal in fields such as laser fusion, laser acceleration and intense secondary radiation. Furthermore, certain mid-infrared laser sources with gigawatt to terawatt level peak powers have demonstrated unique benefits in particle acceleration and high-order harmonic generation[
Reference Mei, Zha, Pan, Wang, Sun, Lei, Ke, Zhao and Wang
4
,
Reference Popmintchev, Chen, Popmintchev, Arpin, Brown, Ališauskas, Andriukaitis, Balčiunas, Mücke, Pugzlys, Baltuška, Shim, Schrauth, Gaeta, Hernández-García, Plaja, Becker, Jaron-Becker, Murnane and Kapteyn
5
]. As research evolves, scientists have discovered that vortex intense lasers, endowed with orbital angular momentum (OAM), offer additional degrees of freedom and opportunities for laser–plasma interactions[
Reference Shi, Zhang, Arefiev and Shen
6
,
Reference Zürch, Kern, Hansinger, Dreischuh and Spielmann
7
]. Vortex intense lasers have demonstrated significant impact in areas such as low-divergence particle acceleration[
Reference Wang, Jiang, Dong, Lu, Li, Xu, Sun, Yu, Guo, Liang, Leng, Li and Xu
8
,
Reference Brabetz, Busold, Cowan, Deppert, Jahn, Kester, Roth, Schumacher and Bagnoud
9
], the generation of high-energy photons carrying OAM[
Reference Jentschura and Serbo
10
], the creation of strong magnetic fields[
Reference Longman and Fedosejevs
11
] and the suppression of instabilities in laser fusion[
Reference Guo, Zhang, Xu, Guo, Shen and Lan
12
]. Taking high-gradient positron acceleration as an example, it cannot take place in the highly nonlinear blowout regime generated by a conventional intense laser, because the associated spherical wakefield structure can effectively focus electrons but not positrons. Twisted vortex laser pulses can resolve this issue by altering the geometry of the plasma response into a doughnut shape[
Reference Piccardo, Cernaianu, Palastro, Arefiev, Thaury, Vieira, Froula and Malka
13
]. Nonlinear doughnut-shaped plasma waves are characterized by a dense axial electron filament, which can exert a focusing force for positrons in the acceleration phase. In addition, vortex beams carrying OAM give rise to the violation of the standard dipolar selection rules during interaction with matter and provide the additional angular momentum that is required for atomic quadrupole transitions[
Reference Picón, Benseny, Mompart, de Aldana, Plaja, Calvo and Roso
14
]. The challenge now is to develop high-quality vortex intense lasers, marking a new frontier in this domain.
${}^2$
[
Reference Yoon, Kim, Choi, Sung, Lee, Lee and Nam
3
] have become pivotal in fields such as laser fusion, laser acceleration and intense secondary radiation. Furthermore, certain mid-infrared laser sources with gigawatt to terawatt level peak powers have demonstrated unique benefits in particle acceleration and high-order harmonic generation[
Reference Mei, Zha, Pan, Wang, Sun, Lei, Ke, Zhao and Wang
4
,
Reference Popmintchev, Chen, Popmintchev, Arpin, Brown, Ališauskas, Andriukaitis, Balčiunas, Mücke, Pugzlys, Baltuška, Shim, Schrauth, Gaeta, Hernández-García, Plaja, Becker, Jaron-Becker, Murnane and Kapteyn
5
]. As research evolves, scientists have discovered that vortex intense lasers, endowed with orbital angular momentum (OAM), offer additional degrees of freedom and opportunities for laser–plasma interactions[
Reference Shi, Zhang, Arefiev and Shen
6
,
Reference Zürch, Kern, Hansinger, Dreischuh and Spielmann
7
]. Vortex intense lasers have demonstrated significant impact in areas such as low-divergence particle acceleration[
Reference Wang, Jiang, Dong, Lu, Li, Xu, Sun, Yu, Guo, Liang, Leng, Li and Xu
8
,
Reference Brabetz, Busold, Cowan, Deppert, Jahn, Kester, Roth, Schumacher and Bagnoud
9
], the generation of high-energy photons carrying OAM[
Reference Jentschura and Serbo
10
], the creation of strong magnetic fields[
Reference Longman and Fedosejevs
11
] and the suppression of instabilities in laser fusion[
Reference Guo, Zhang, Xu, Guo, Shen and Lan
12
]. Taking high-gradient positron acceleration as an example, it cannot take place in the highly nonlinear blowout regime generated by a conventional intense laser, because the associated spherical wakefield structure can effectively focus electrons but not positrons. Twisted vortex laser pulses can resolve this issue by altering the geometry of the plasma response into a doughnut shape[
Reference Piccardo, Cernaianu, Palastro, Arefiev, Thaury, Vieira, Froula and Malka
13
]. Nonlinear doughnut-shaped plasma waves are characterized by a dense axial electron filament, which can exert a focusing force for positrons in the acceleration phase. In addition, vortex beams carrying OAM give rise to the violation of the standard dipolar selection rules during interaction with matter and provide the additional angular momentum that is required for atomic quadrupole transitions[
Reference Picón, Benseny, Mompart, de Aldana, Plaja, Calvo and Roso
14
]. The challenge now is to develop high-quality vortex intense lasers, marking a new frontier in this domain.
There are mainly two categories of methods for generating intense vortex lasers. One approach involves converting ordinary intense lasers into vortex intense lasers using passive optical devices. Experimentally validated conversion devices include reflective-type spiral phase mirrors[ Reference Wang, Jiang, Dong, Lu, Li, Xu, Sun, Yu, Guo, Liang, Leng, Li and Xu 8 , Reference Lee, Yoon, Sung, Lee, Kim, Yang, Hwang, Nam, Yeo, Jeong, Jeon, Choi, Kim, Kim, Lee, Chang, Pak, Choi and Kim 15 ], plasma mirrors featuring light fan structures[ Reference Denoeud, Chopineau, Leblanc and Quéré 16 ] and plasma holograms[ Reference Leblanc, Denoeud, Chopineau, Mennerat, Martin and Quéré 17 ]. Nevertheless, the practical deployment of these devices still faces numerous challenges, including aperture limitations, efficiency issues, bandwidth constraints and other aspects. The alternative approach involves directly amplifying weak vortex seed lasers to produce intense vortex lasers via chirped-pulse amplification (CPA)[ Reference Chen, Zheng, Lu, Wang, Cai, Wang, Zhen, Ai, Leng, Xu and Fan 18 ] or optical parametric chirped-pulse amplification (OPCPA)[ Reference Xu, Yu and Liang 19 – Reference Zhong, Liang, Dai, Huang, Hu, Xu and Qian 23 ]. Given the diverse and sophisticated methods available for generating and manipulating weak vortex beams[ Reference Shen, Shen, Wang, Xie, Min, Fu, Liu, Gong and Yuan 24 – Reference Qiao, Kong, Xie, Qin, Yuan, Qian, Xu, Xu and Fan 27 ], direct amplification of these weak vortices stands out as a superior approach for producing ultrafast intense vortex lasers. In particular, OPCPA, due to its high gain, large bandwidth, strong wavelength tuning capability and ability to preserve topological charges, holds great promise to generate ultrafast intense vortex lasers with controllable parameters.
Although OPCPA for vortex lasers can leverage existing intense laser technologies and systems, it also exhibits distinctive features. Notably, the hollow structure of vortex beams renders them more susceptible to contamination from spontaneous parametric superfluorescence (PSF) noise during the amplification process[ Reference Homann and Riedle 28 – Reference Acco, Blau and Arie 32 ]. This contamination results in a deterioration in both spatial and temporal contrasts, ultimately affecting their interaction with plasmas[ Reference Veisz and Duarte 33 ]. In this study, we explore the characteristics and evolution of PSF during the OPCPA process of vortex lasers. Based on these understandings, we develop methods to suppress PSF for enabling high-contrast amplification of vortex intense lasers. Initially, we outline the simulation parameters and describe the characteristics of PSF. Subsequently, we detail techniques to suppress PSF overlapping with the vortex through the use of strong seeding. Finally, we introduce two suppression strategies specifically tailored to address PSF near the vortex singularity center: one involves spatial filtering after focusing, and the other employs vortex pumping. Our research findings will provide a theoretical framework for designing high-contrast vortex OPCPA systems.
2 Simulation parameters and parametric superfluorescence characteristics
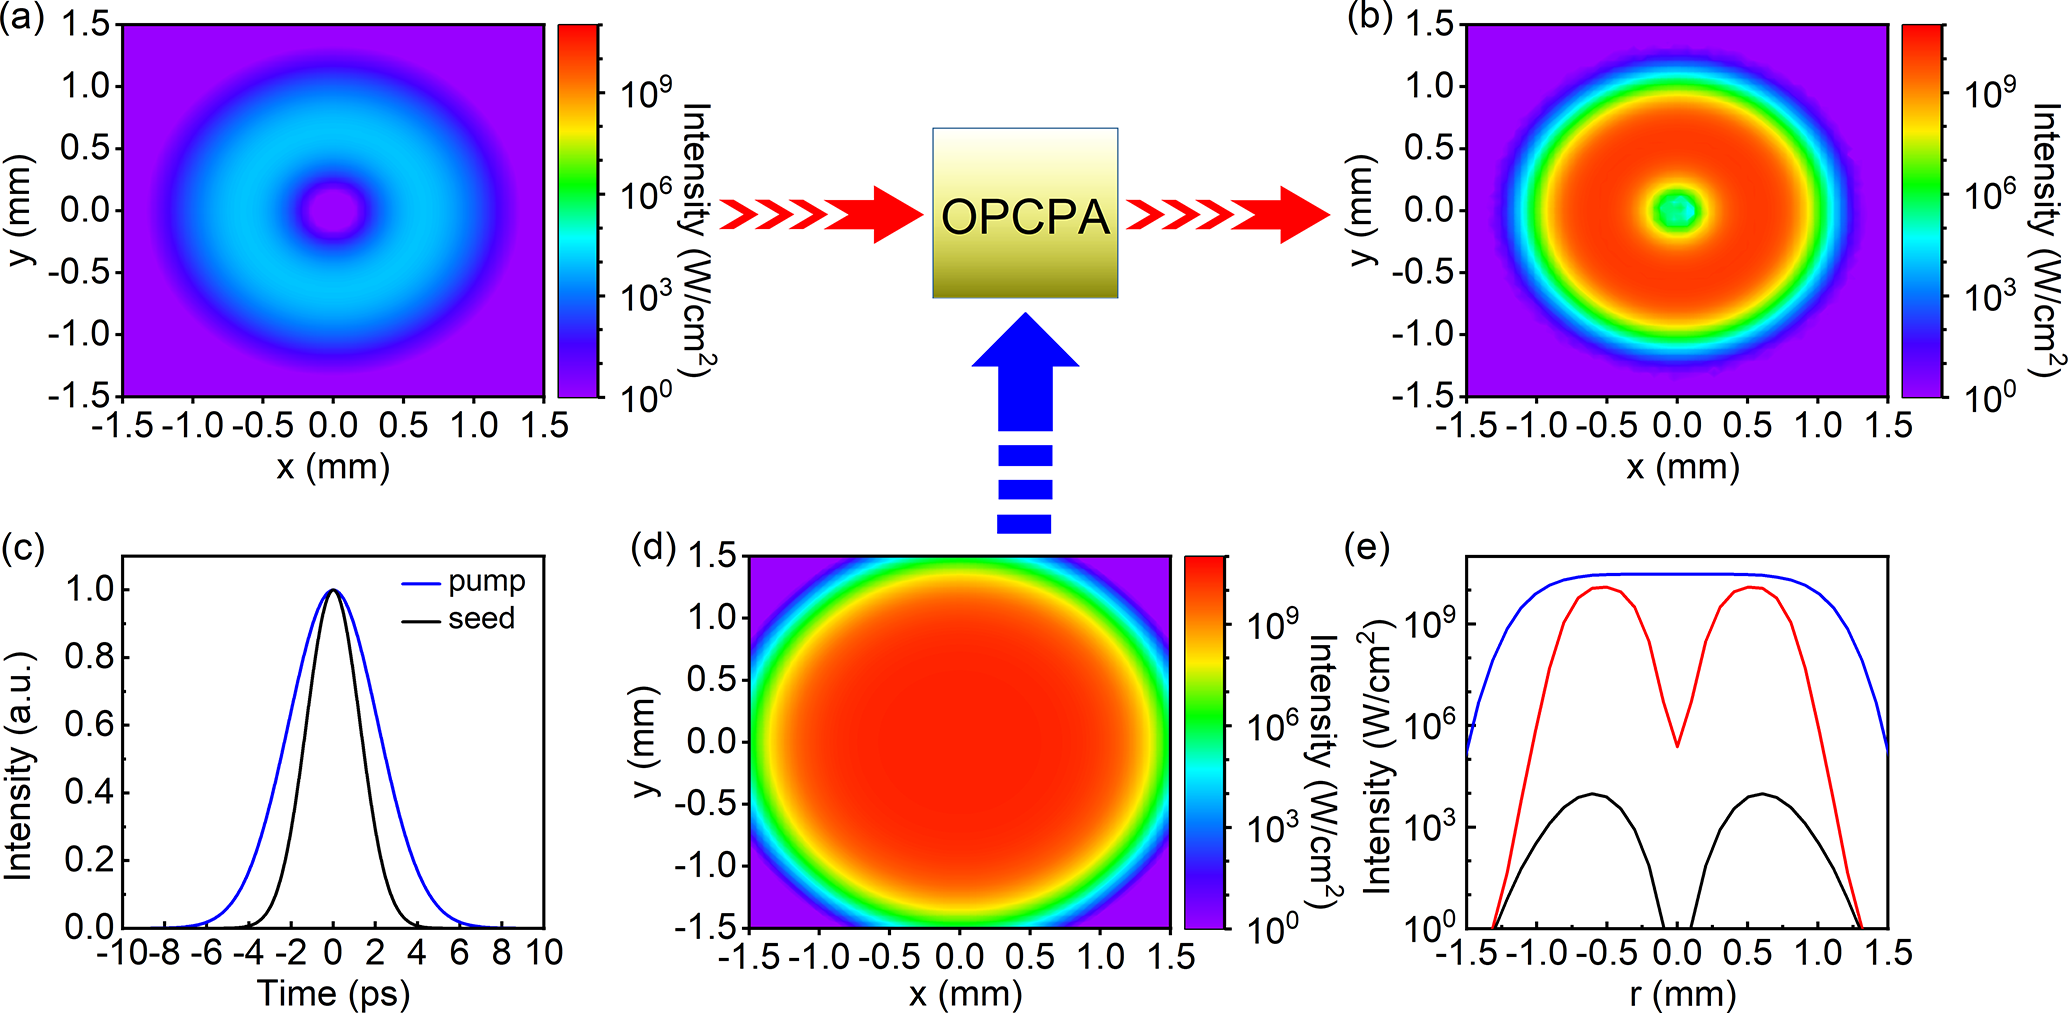
In our simulation, we consider a single-stage vortex OPCPA setup, depicted in Figure 1. For simplicity while maintaining generality, we employ 515 nm pump pulses to collinearly amplify 1030 nm vortex pulses within a 3-mm-long beta barium borate ( $\beta$
-BBO) crystal, based on a degenerate Type-I phase matching condition. The pump pulse is modeled with a Gaussian temporal profile, featuring a full width at half maximum (FWHM) duration of 5 ps (blue curve in Figure 1(c)), and a sixth-order super-Gaussian beam profile with an FWHM width of approximately 1.85 mm (Figure 1(d)). Prior to amplification, the ultrafast vortex pulse, with a Fourier-transform-limited (FTL) pulse duration of 20 fs (FWHM), is stretched to 3 ps (black curve in Figure 1(c)) to better accommodate the temporal profile of the pump pulse. The vortex beam exhibits a high-order Laguerre–Gaussian (LG) mode (Figure 1(a)) with an azimuthal index of 5 and a radical index of 0[
Reference Yang, Li and Wang
34
].
$\beta$
-BBO) crystal, based on a degenerate Type-I phase matching condition. The pump pulse is modeled with a Gaussian temporal profile, featuring a full width at half maximum (FWHM) duration of 5 ps (blue curve in Figure 1(c)), and a sixth-order super-Gaussian beam profile with an FWHM width of approximately 1.85 mm (Figure 1(d)). Prior to amplification, the ultrafast vortex pulse, with a Fourier-transform-limited (FTL) pulse duration of 20 fs (FWHM), is stretched to 3 ps (black curve in Figure 1(c)) to better accommodate the temporal profile of the pump pulse. The vortex beam exhibits a high-order Laguerre–Gaussian (LG) mode (Figure 1(a)) with an azimuthal index of 5 and a radical index of 0[
Reference Yang, Li and Wang
34
].
Effect of PSF on the OPCPA of a vortex laser. (a) Beam profile of the vortex laser before OPCPA. (b) Beam profile of the vortex laser after amplification. (c) Temporal profiles of the pump pulse (blue curve) and the chirped vortex pulse (black curve). (d) Beam profile of the pump laser. (e) Radial intensity distributions of the pump laser (blue curve), the seed vortex laser (black curve) and the amplified vortex laser (red curve). The pump and seed intensities are 30 GW/cm ${}^2$
and 10
${}^2$
and 10 ${}^4$
W/cm
${}^4$
W/cm ${}^2$
, respectively.
${}^2$
, respectively.

While the parametric amplification process can be described using standard coupled-wave equations, our simulation emphasizes the precise incorporation of parametric fluorescence into the model. By following the methodology presented in Refs. [Reference Tavella, Marcinkevičius and Krausz29,Reference Gatti, Wiedemann, Lugiato and Marzoli35], we derive a set of three-wave coupling equations that describe the generation and evolution of PSF:
 $$\begin{align}&\frac{\partial {E}_1}{\partial z}-\frac{i}{2{k}_1}\left(\frac{\partial^2}{\partial {x}^2}+\frac{\partial^2}{\partial {y}^2}\right){E}_1-i\;\sum \limits_{n=2}^3\frac{\partial^n{k}_1}{\partial {\omega}^n}\frac{i^n}{n!}\frac{\partial^n{E}_1}{\partial {t}^n}\nonumber\\ &\quad{}=i\frac{d_{\mathrm{eff}}{k}_1}{n_1^2}{E}_3{E}_2^{\ast }{e}^{- i\varDelta kz}+{R}_1,\end{align}$$
 $$\begin{align}&\frac{\partial {E}_2}{\partial z}-\frac{i}{2{k}_2}\left(\frac{\partial^2}{\partial {x}^2}+\frac{\partial^2}{\partial {y}^2}\right){E}_2-i\;\sum \limits_{n=2}^3\frac{\partial^n{k}_2}{\partial {\omega}^n}\frac{i^n}{n!}\frac{\partial^n{E}_2}{\partial {t}^n}\nonumber\\&\quad {}=i\frac{d_{\mathrm{eff}}{k}_2}{n_2^2}{E}_3{E}_1^{\ast }{e}^{- i\varDelta kz}+{R}_2,\end{align}$$
 $$\begin{align}&\frac{\partial {E}_3}{\partial z}-\frac{i}{2{k}_3}\left(\frac{\partial^2}{\partial {x}^2}+\frac{\partial^2}{\partial {y}^2}\right){E}_3-i\;\sum \limits_{n=2}^3\frac{\partial^n{k}_3}{\partial {\omega}^n}\frac{i^n}{n!}\frac{\partial^n{E}_3}{\partial {t}^n}\nonumber\\ &\quad{}=i\frac{d_{\mathrm{eff}}{k}_3}{n_3^2}{E}_1{E}_2{e}^{i\varDelta kz}.\end{align}$$
Here, ${E}_j$
,
${E}_j$
, ${k}_j$
and
${k}_j$
and ${n}_j$
represent the electric field amplitude, wave-vector and refractive index of the jth optical wave, respectively, where j = 1, 2, 3 correspond to the signal, idler and pump waves;
${n}_j$
represent the electric field amplitude, wave-vector and refractive index of the jth optical wave, respectively, where j = 1, 2, 3 correspond to the signal, idler and pump waves; $\varDelta$
k is the wave-vector mismatch at the central frequencies of the three waves;
$\varDelta$
k is the wave-vector mismatch at the central frequencies of the three waves; ${d}_{\mathrm{eff}}$
is the effective nonlinear coefficient. The random terms
${d}_{\mathrm{eff}}$
is the effective nonlinear coefficient. The random terms ${R}_j$
, which originate from vacuum quantum fluctuations and are used to initialize the respective fields, are determined as follows:
${R}_j$
, which originate from vacuum quantum fluctuations and are used to initialize the respective fields, are determined as follows:
 $$\begin{align}{R}_j=\sqrt{\frac{\mathrm{\hslash}{d}_{\mathrm{eff}}{E}_3\overline{\omega_{12}}{n}_j{\omega}_j^3\varDelta {\omega}_j{\varDelta \varOmega}_j}{8{\epsilon}_0{\pi}^3{c}^4\overline{n_{12}}}}{\xi}_j\left(z,t\right),\end{align}$$
where $\varDelta {\omega}_j$
are the spectral bandwidths and
$\varDelta {\omega}_j$
are the spectral bandwidths and ${\varDelta \varOmega}_j$
are the solid-angle windows;
${\varDelta \varOmega}_j$
are the solid-angle windows; $\overline{n_{12}}$
is the geometric mean of
$\overline{n_{12}}$
is the geometric mean of ${n}_1$
and
${n}_1$
and ${n}_2$
, and
${n}_2$
, and $\overline{\omega_{12}}$
is the geometric mean of
$\overline{\omega_{12}}$
is the geometric mean of ${\omega}_1$
and
${\omega}_1$
and ${\omega}_2$
. The complex stochastic variables
${\omega}_2$
. The complex stochastic variables ${\xi}_j\left(z,t\right)$
follow a Gaussian distribution with a mean value of zero. The inclusion of random numbers
${\xi}_j\left(z,t\right)$
follow a Gaussian distribution with a mean value of zero. The inclusion of random numbers ${R}_1$
and
${R}_1$
and ${R}_2$
facilitates the generation of PSF photons at the signal and idler frequencies, even without the external injection of signal or idler photons. No random number term is incorporated into Equation (3) because the PSF at the pump frequency does not originate from vacuum quantum fluctuations[
Reference Tavella, Marcinkevičius and Krausz
29
,
Reference Manzoni, Moses, Kärtner and Cerullo
31
]. Instead, it arises from the parametric up-conversion of photons at the signal and idler frequencies. Consequently, in scenarios where only signal and idler photons are initially present (i.e., no pump photons), Equation (3) remains applicable for computing pump photons without requiring a random term. In Equations (1)–(3), the temporal and spatial walk-off effects among three waves are neglected for highlighting the PSF’s influences. This is a reasonable approximation. On one hand, the group velocities of the signal and idler pulses are equal under degenerate amplification. On the other hand, the pump walk-off angle of 3.25° corresponds to a transverse deviation of approximately 0.17 mm over a 3 mm crystal length, which is an order of magnitude smaller than the spot sizes of the pump and the signal, so its impact on the amplification is insignificant. Moreover, as the spot size increases, the influence of this spatial walk-off effect becomes even weaker. To solve Equations (1)–(3), we utilize the standard split-step Fourier method in conjunction with the Runge–Kutta algorithm. The PSF results calculated by our code are comparable in magnitude to some experimentally reported results[
Reference Homann and Riedle
28
,
Reference Tavella, Marcinkevičius and Krausz
29
], making the simulation results both practically relevant and informative for guiding further research.
${R}_2$
facilitates the generation of PSF photons at the signal and idler frequencies, even without the external injection of signal or idler photons. No random number term is incorporated into Equation (3) because the PSF at the pump frequency does not originate from vacuum quantum fluctuations[
Reference Tavella, Marcinkevičius and Krausz
29
,
Reference Manzoni, Moses, Kärtner and Cerullo
31
]. Instead, it arises from the parametric up-conversion of photons at the signal and idler frequencies. Consequently, in scenarios where only signal and idler photons are initially present (i.e., no pump photons), Equation (3) remains applicable for computing pump photons without requiring a random term. In Equations (1)–(3), the temporal and spatial walk-off effects among three waves are neglected for highlighting the PSF’s influences. This is a reasonable approximation. On one hand, the group velocities of the signal and idler pulses are equal under degenerate amplification. On the other hand, the pump walk-off angle of 3.25° corresponds to a transverse deviation of approximately 0.17 mm over a 3 mm crystal length, which is an order of magnitude smaller than the spot sizes of the pump and the signal, so its impact on the amplification is insignificant. Moreover, as the spot size increases, the influence of this spatial walk-off effect becomes even weaker. To solve Equations (1)–(3), we utilize the standard split-step Fourier method in conjunction with the Runge–Kutta algorithm. The PSF results calculated by our code are comparable in magnitude to some experimentally reported results[
Reference Homann and Riedle
28
,
Reference Tavella, Marcinkevičius and Krausz
29
], making the simulation results both practically relevant and informative for guiding further research.
An important aspect of numerical simulation involves determining appropriate intensities for both the pump and the seed vortex. Fundamentally, PSF can be regarded as the parametric amplification of quantum noise photons[
Reference Homann and Riedle
28
]. While increasing the pump intensity facilitates achieving high-gain amplification of the vortex laser, it concurrently leads to an increase in PSF. To simulate a representative amplification scenario, it is preferable to choose a pump intensity that is close to the threshold where parametric fluorescence begins to grow significantly[
Reference Acco, Blau and Arie
32
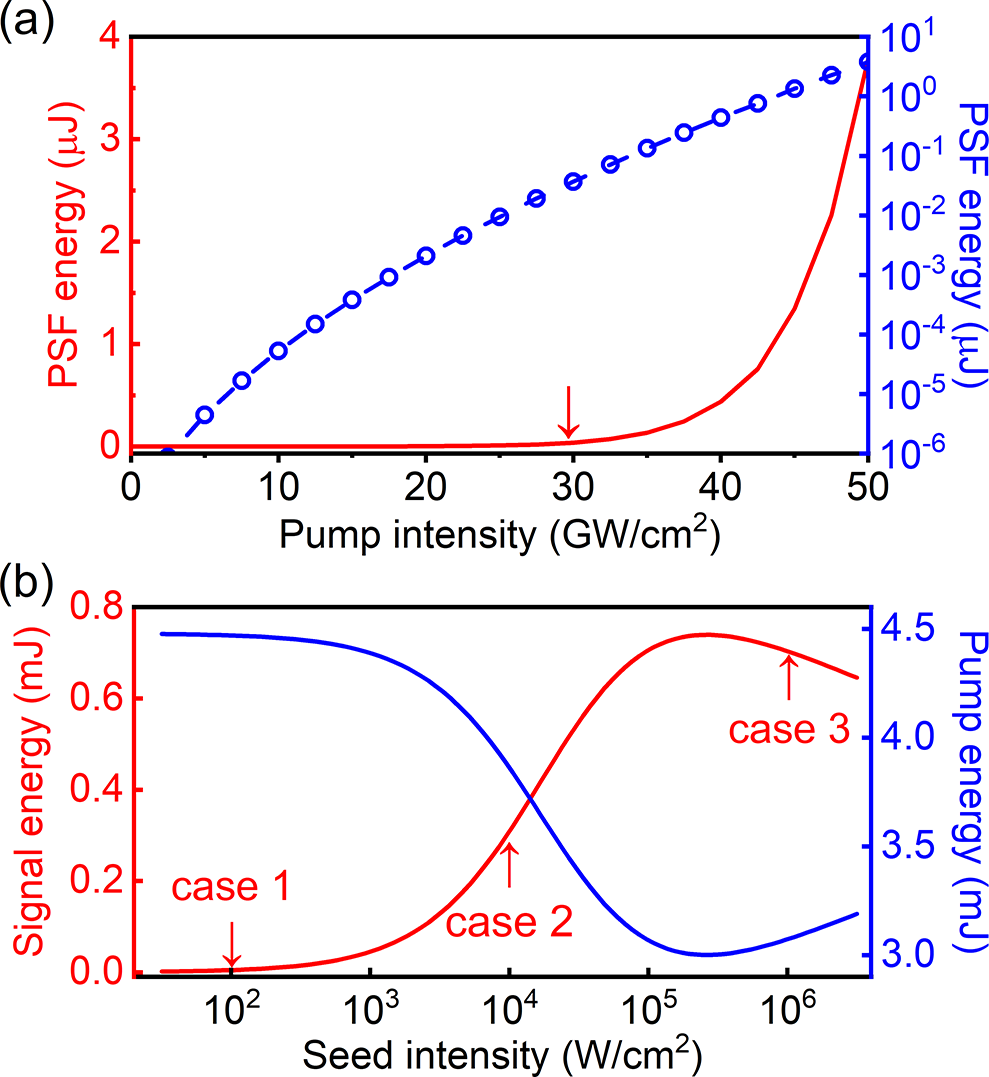
]. To identify this threshold, we initially simulate the correlation between PSF output and pump intensity in the absence of a vortex seed. As depicted by the red curve in Figure 2(a), a notable increase in PSF energy occurs when the pumping intensity exceeds 30 GW/cm ${}^2$
. This means that the PSF threshold in our simulation approximates 30 GW/cm
${}^2$
. This means that the PSF threshold in our simulation approximates 30 GW/cm ${}^2$
. To avoid the significant growth of PSF, we set the pump intensity at 30 GW/cm
${}^2$
. To avoid the significant growth of PSF, we set the pump intensity at 30 GW/cm ${}^2$
, well below the damage threshold of BBO crystals under 515 nm and 5 ps pumping conditions[
Reference Kretschmar, Tuemmler, Schütte, Hoffmann, Senfftleben, Mero, Sauppe, Rupp, Vrakking, Will and Nagy
36
]. Note that, the amplification of the PSF under a pump intensity of 30 GW/cm
${}^2$
, well below the damage threshold of BBO crystals under 515 nm and 5 ps pumping conditions[
Reference Kretschmar, Tuemmler, Schütte, Hoffmann, Senfftleben, Mero, Sauppe, Rupp, Vrakking, Will and Nagy
36
]. Note that, the amplification of the PSF under a pump intensity of 30 GW/cm ${}^2$
is still in the small-signal amplification stage. When we convert the representation of PSF energy from linear to logarithmic coordinates, it becomes evident that, for pump intensities even up to 50 GW/cm
${}^2$
is still in the small-signal amplification stage. When we convert the representation of PSF energy from linear to logarithmic coordinates, it becomes evident that, for pump intensities even up to 50 GW/cm ${}^2$
, the PSF’s evolution is linearly correlated with the square root of the pump intensity (blue curve in Figure 2(a)), which is a typical characteristic of small-signal amplification.
${}^2$
, the PSF’s evolution is linearly correlated with the square root of the pump intensity (blue curve in Figure 2(a)), which is a typical characteristic of small-signal amplification.
Determination of initial incident intensities for OPCPA. (a) Output PSF energy versus pump intensity, with the PSF energy represented in linear coordinates (red curve) and logarithmic coordinates (blue curve). The PSF output energy in logarithmic coordinates (circles) is fitted using a function that is linearly correlated with the square root of the pump intensity (blue dashed curve). (b) Output signal energy (red curve) and residual pump energy (blue curve) plotted against seed intensity, when the pump intensity is fixed at 30 GW/cm ${}^2$
. The three seed cases 1–3 correspond to small-signal amplification, saturated amplification and over-saturated amplification, respectively.
${}^2$
. The three seed cases 1–3 correspond to small-signal amplification, saturated amplification and over-saturated amplification, respectively.

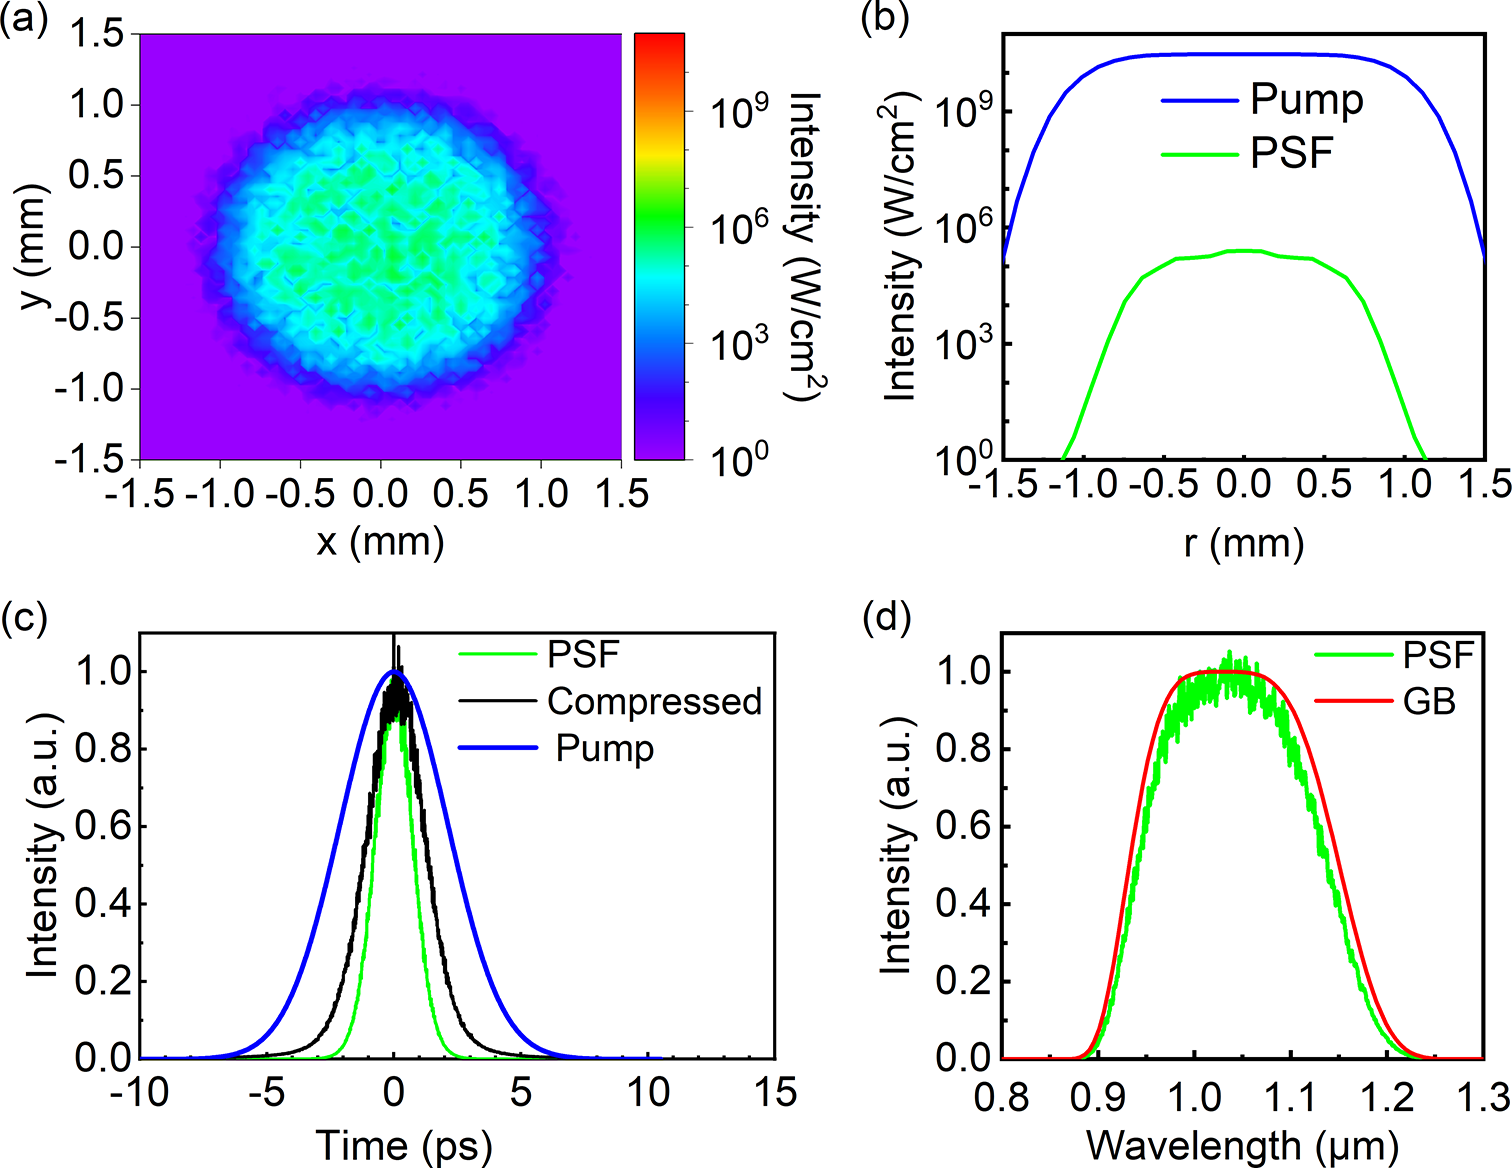
In addition to examining the PSF’s evolution in relation to the pump intensity, the spatial and temporal output characteristics of the PSF are also of broad concern, aiding in understanding the impact of the PSF on the contrast of vortex pulses. As shown in Figures 3(a) and 3(b), the output PSF spot exhibits a uniform intensity distribution within a circular area of a 0.8 mm radius, due to the uniform intensity of the spatially super-Gaussian pump beam within this range (blue curve in Figure 3(b)). Outside this range, the intensity of the PSF decreases as the pump intensity diminishes. This characteristic of the PSF leads to the filling of the central singularity of the vortex when a vortex is seeded, thereby reducing the spatial contrast of the amplified vortex beam (Figures 1(b) and 1(e)). In the temporal domain, since the pump pulse has a Gaussian profile, the parametric gain, which is highly correlated with the pump intensity, causes the output PSF pulse (green curve in Figure 3(c)) to be narrower than the pump pulse (blue curve in Figure 3(c)). In the frequency domain, the PSF gains output almost across the entire gain bandwidth of OPCPA, rendering it a broadband pulse (Figure 3(d)). After undergoing a compression process that precisely compensates for the dispersion of the chirped vortex pulse, the PSF is not compressed in the temporal domain like the vortex but is instead further broadened (black curve in Figure 3(c)). This occurs because the phase of the PSF is random and cannot be compensated by the chirp introduced during the compression process, instead contributing to a broadening effect. Precisely for this reason, the PSF forms a widely distributed noise pedestal around the compressed vortex pulse, ultimately reducing the temporal contrast.
Spatial and temporal characteristics of PSF generated without seeding. (a) Beam profile of the PSF. (b) Radial intensity distributions of the pump (blue curve) and the PSF (green curve). (c) Temporal profiles of the pump pulse (blue curve), the PSF prior to compression (green curve) and the PSF following compression (black curve). (d) Spectrum of the PSF (green curve) and the calculated gain bandwidth (GB, red curve).

Next, we simulate the evolution of the OPCPA output energy with respect to the vortex seed intensity, with the pump intensity fixed at 30 GW/cm ${}^2$
. As shown in Figure 2(b), the OPCPA output increases with the increase in vortex seed intensity. At a seed intensity of 10
${}^2$
. As shown in Figure 2(b), the OPCPA output increases with the increase in vortex seed intensity. At a seed intensity of 10 ${}^2$
W/cm
${}^2$
W/cm ${}^2$
(corresponding to case 1 in Figure 2(b)), the pump energy consumption is negligible, indicating that the system remains in the small-signal amplification stage. When the seed intensity rises to 10
${}^2$
(corresponding to case 1 in Figure 2(b)), the pump energy consumption is negligible, indicating that the system remains in the small-signal amplification stage. When the seed intensity rises to 10 ${}^4$
W/cm
${}^4$
W/cm ${}^2$
(corresponding to case 2 in Figure 2(b)), pump energy consumption begins to occur, signaling that the OPCPA is entering the saturation amplification. As the seed intensity further increases to 10
${}^2$
(corresponding to case 2 in Figure 2(b)), pump energy consumption begins to occur, signaling that the OPCPA is entering the saturation amplification. As the seed intensity further increases to 10 ${}^6$
W/cm
${}^6$
W/cm ${}^2$
(corresponding to case 3 in Figure 2(b)), significant pump energy consumption is observed, and microscopically, some spatiotemporal points of the vortex pulse experience back-conversion (see Figures 4(a3) and 4(c3)). With continued increase in seed intensity, the overall output energy starts to exhibit back-conversion, which is a typical characteristic of OPCPA[
Reference Ma, Wang, Yuan, Xie, Xiong, Tu, Tu, Shi, Zheng and Qian
37
,
Reference Ma, Wang, Yuan, Xie and Qian
38
]. In the subsequent sections, we will study the contrast of the amplified vortex pulse under these three seed intensities separately.
${}^2$
(corresponding to case 3 in Figure 2(b)), significant pump energy consumption is observed, and microscopically, some spatiotemporal points of the vortex pulse experience back-conversion (see Figures 4(a3) and 4(c3)). With continued increase in seed intensity, the overall output energy starts to exhibit back-conversion, which is a typical characteristic of OPCPA[
Reference Ma, Wang, Yuan, Xie, Xiong, Tu, Tu, Shi, Zheng and Qian
37
,
Reference Ma, Wang, Yuan, Xie and Qian
38
]. In the subsequent sections, we will study the contrast of the amplified vortex pulse under these three seed intensities separately.
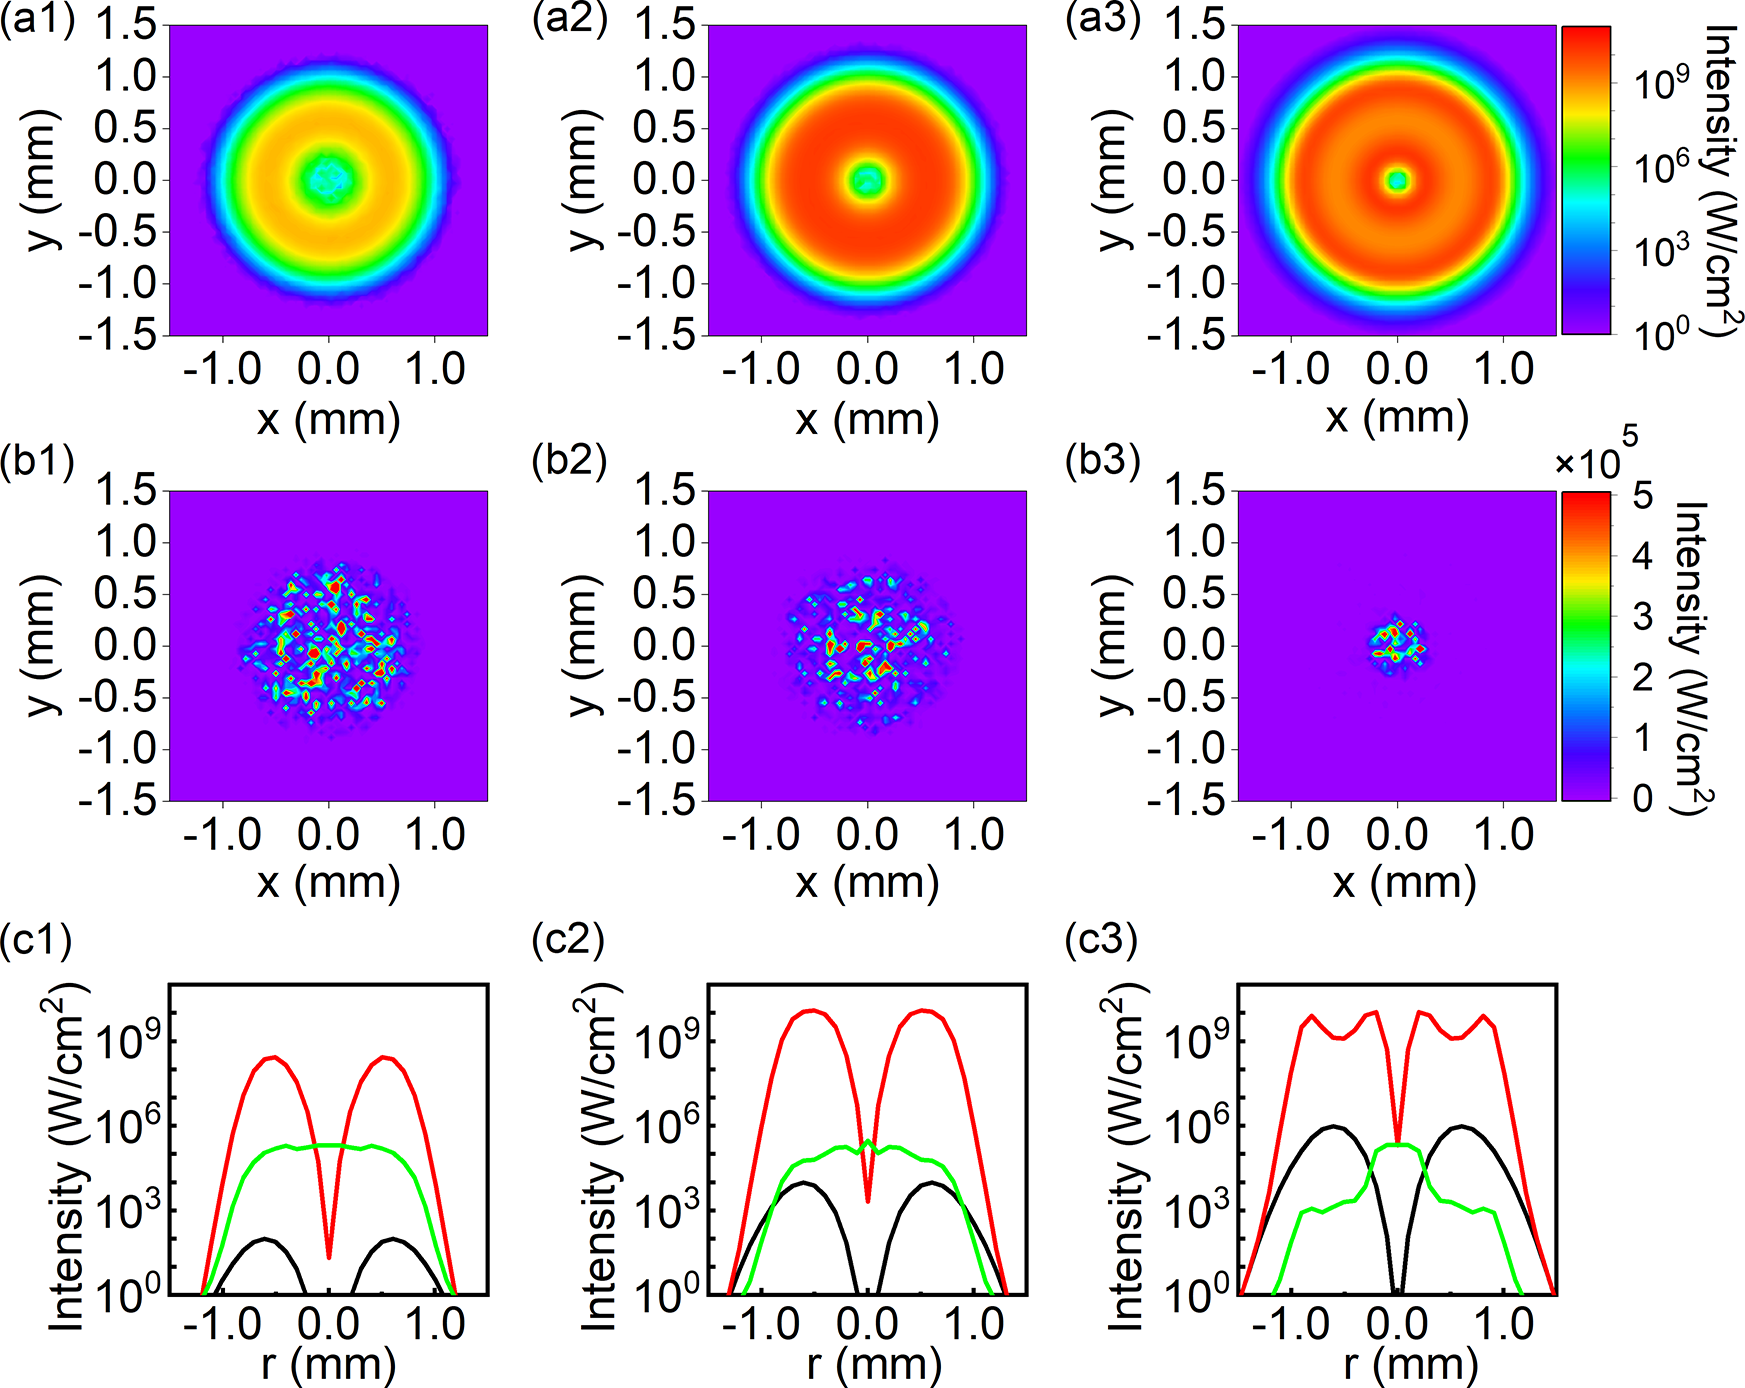
The outputs of amplification at various seed intensity levels. (a) Total output including both the vortex and PSF. (b) PSF output alone. (c) Radial intensity profiles of the seed vortex (black curve), the amplified vortex (red curve) and the PSF (green curve). The sets of plots labeled (a1)–(c1), (a2)–(c2) and (a3)–(c3) correspond to seed intensities of 10 ${}^2$
W/cm
${}^2$
W/cm ${}^2$
(case 1 in Figure 2(b)), 10
${}^2$
(case 1 in Figure 2(b)), 10 ${}^4$
W/cm
${}^4$
W/cm ${}^2$
(case 2 in Figure 2(b)) and 10
${}^2$
(case 2 in Figure 2(b)) and 10 ${}^6$
W/cm
${}^6$
W/cm ${}^2$
(case 3 in Figure 2(b)), respectively, with the pump intensity held constant at 30 GW/cm
${}^2$
(case 3 in Figure 2(b)), respectively, with the pump intensity held constant at 30 GW/cm ${}^2$
. Figures 4(a1) and 4(a2) share a common color bar with 4(a3). Similarly, Figures 4(b1) and 4(b2) share a common color bar with 4(b3).
${}^2$
. Figures 4(a1) and 4(a2) share a common color bar with 4(a3). Similarly, Figures 4(b1) and 4(b2) share a common color bar with 4(b3).

3 Suppression of parametric superfluorescence through strong seeding
Figure 4 presents the spatial domain outputs of OPCPA for three different seed intensities identified in Figure 2(b). The seed pulse profiles for these intensities are depicted by the black curves in Figures 4(c1)–4(c3). Observing the output vortex spots, a significant characteristic that emerges with increasing seed intensity is the radial expansion of the vortex beam’s width, both outwards and inwards, leading to a reduction in the area occupied by the vortex singularity region. Upon closer inspection, it becomes evident that the signal output during saturated amplification (Figure 4(a2)) is stronger than that during small-signal amplification (Figure 4(a1)). During over-saturated amplification, while the peak intensity of the output beam reaches levels comparable to the saturation intensity, the initially intense regions of the beam, which correspond to the areas first amplified in Figure 4(a1) during small-signal amplification, start to exhibit a back-conversion effect (Figure 4(c3)). These detailed characteristics can be more distinctly observed from the radial intensity distribution along a certain diameter, as indicated by the red curves shown in Figures 4(c1)–4(c3).
Compared to vortex amplification, we are more concerned with the output behavior of the PSF when vortex beams of varying intensities are seeded. Numerical simulations allow us to isolate the PSF from the amplified vortex output, a task that is often challenging to achieve in experimental studies. Figures 4(b1)–4(b3) illustrate the PSF output spots for three different vortex seed intensities. In cases where the vortex seed is relatively weak, the PSF output exhibits a large and uniform distribution (Figure 4(b1)). As the intensity of the vortex seed increases, the spatial distribution of the PSF becomes increasingly compressed towards the vortex singularity. This phenomenon occurs because a strong vortex seed consumes pump energy more rapidly, thereby effectively inhibiting the growth of the PSF in the area where it overlaps with the vortex ring (green curves in Figures 4(c1)–(c3)). Intriguingly, near the vortex singularity, the PSF output intensity remains constant across the three vortex seed intensities. This is because there is almost no competition for pump energy with the PSF in this region, resulting in a PSF intensity that is consistent with the intensity observed in the absence of a vortex seed (green curve in Figure 3(b)). These simulation results underscore the suppressive effect of a strong vortex seed on the PSF, which aligns with previous research findings in traditional OPCPA systems[ Reference Stuart, Bigourd, Hill, Robinson, Mecseki, Patankar, New and Simith 39 , Reference Ma, Xiong, Yuan, Tu, Wang, Xie, Zheng and Qian 40 ].
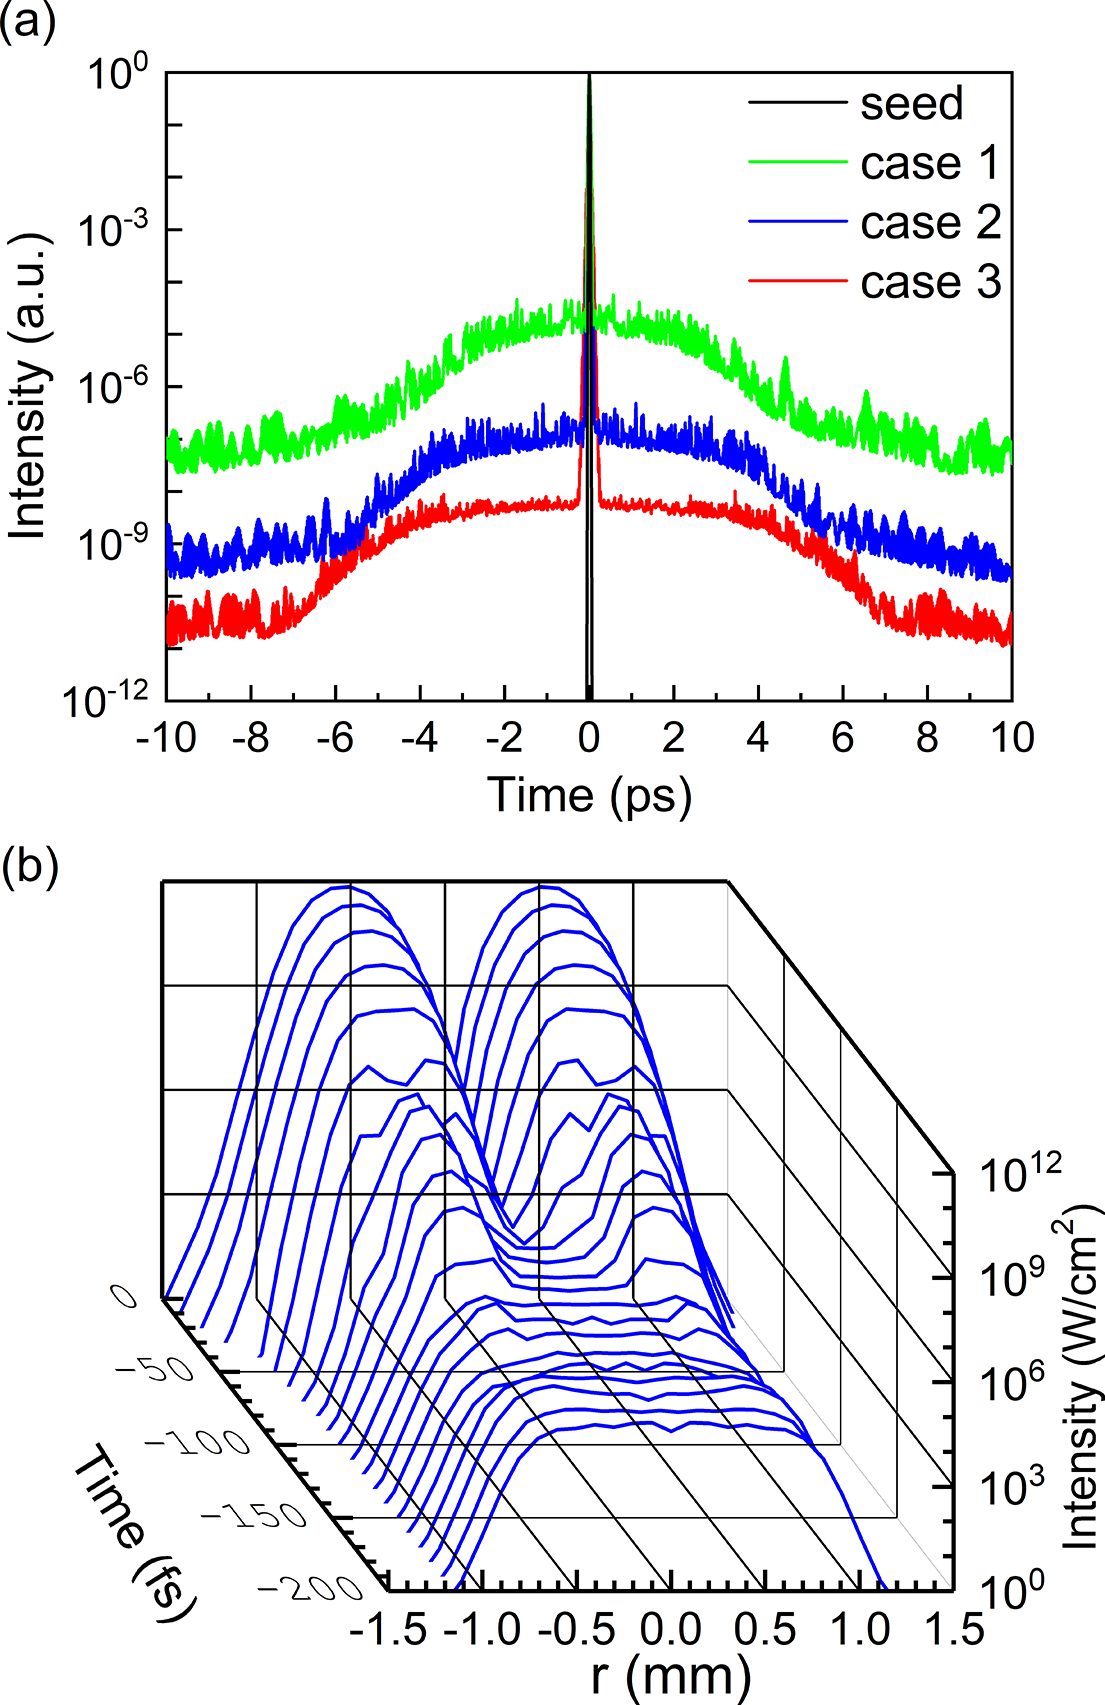
The suppression effect of a strong vortex seed on PSF noise becomes evident in the temporal contrast of the compressed vortex pulse, as shown in Figure 5(a). Compared with the clean vortex seed pulse, the PSF generated by the OPCPA spans from the leading to the trailing edge of the compressed vortex pulse, forming a noise pedestal that degrades the temporal contrast. Fortunately, a strong vortex seed significantly suppresses the PSF noise, leading to an enhanced pulse contrast. For instance, the contrast level at –2 ps increases from approximately 10 ${}^5$
at weak injection to approximately
${}^5$
at weak injection to approximately $2\times {10}^8$
at strong injection. Furthermore, Figure 5(a) highlights that the contrast enhancement is pronounced within
$2\times {10}^8$
at strong injection. Furthermore, Figure 5(a) highlights that the contrast enhancement is pronounced within $\pm$
3 ps of the main pulse, which corresponds to the time region covered by the vortex pulse. Note that the temporal distribution of the PSF pedestal follows the pump-determined parametric gain profile before compression and undergoes reshaping after the compression process (Figure 3(c)). As evidenced by the progression from case 1 to case 3 in Figure 5(a), the pump depletion induced by strong signal seeding leads to the flattening of the PSF pedestal as the saturation degree increases. To further illustrate the impact of the PSF on the vortex pulse contrast, we have plotted the spatiotemporal distribution of the compressed pulse under the second seed condition in Figure 5(b). Here, the vortex characteristics are most prominent near the main pulse, gradually weakening as the temporal position diverges, ultimately leaving only the PSF background. Figure 5(b) clearly demonstrates the impact of the PSF on both the temporal and spatial contrasts of the compressed vortex pulse.
$\pm$
3 ps of the main pulse, which corresponds to the time region covered by the vortex pulse. Note that the temporal distribution of the PSF pedestal follows the pump-determined parametric gain profile before compression and undergoes reshaping after the compression process (Figure 3(c)). As evidenced by the progression from case 1 to case 3 in Figure 5(a), the pump depletion induced by strong signal seeding leads to the flattening of the PSF pedestal as the saturation degree increases. To further illustrate the impact of the PSF on the vortex pulse contrast, we have plotted the spatiotemporal distribution of the compressed pulse under the second seed condition in Figure 5(b). Here, the vortex characteristics are most prominent near the main pulse, gradually weakening as the temporal position diverges, ultimately leaving only the PSF background. Figure 5(b) clearly demonstrates the impact of the PSF on both the temporal and spatial contrasts of the compressed vortex pulse.
Improvement in temporal contrast through strong seeding. (a) Temporal intensity profiles of the output vortex pulse after compression. The seed levels corresponding to cases 1 (green curve), 2 (blue curve) and 3 (red curve) align with those indicated in Figure 2(b). The black curve represents the intensity profile of the seed vortex pulse prior to stretching. (b) Spatiotemporal intensity distribution of the compressed vortex pulse using the seed level from case 2.

4 Suppression of parametric superfluorescence near the vortex singularity
4.1 Far-field filtering
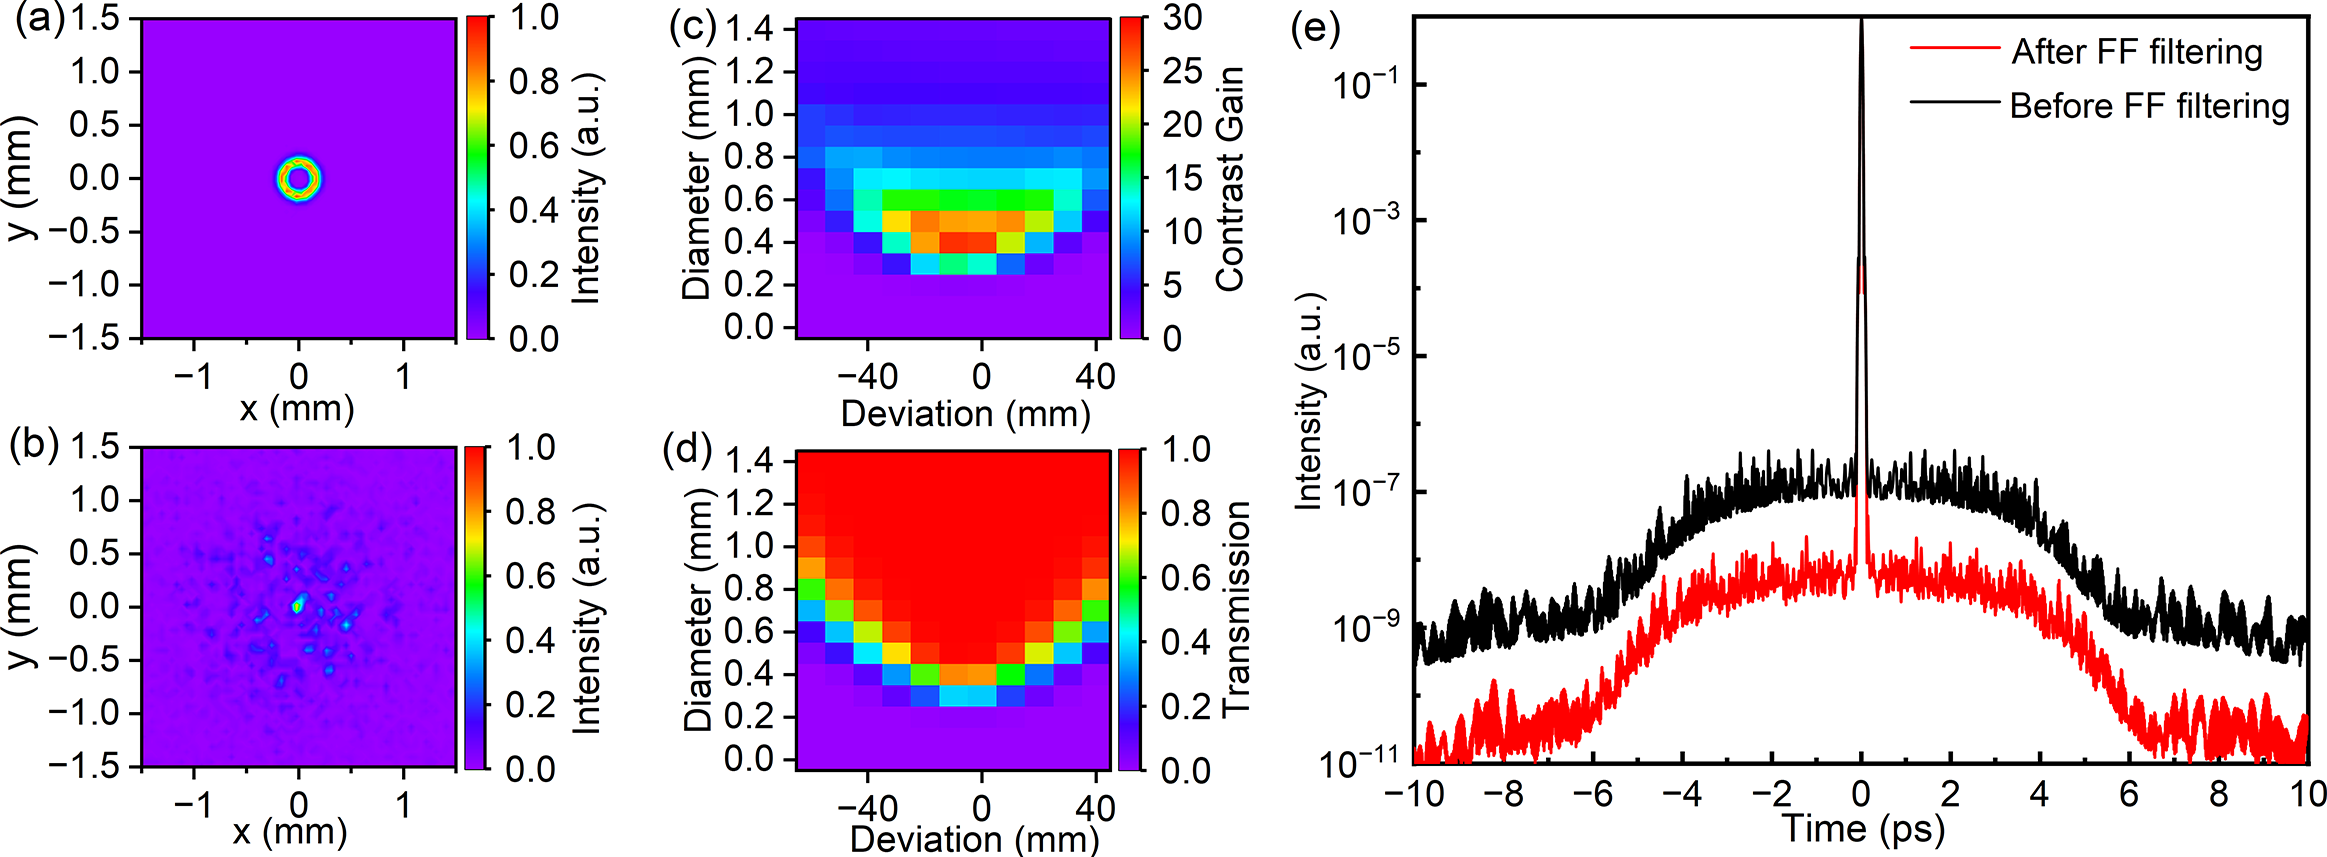
As can be seen from Figure 4, the PSF output near the vortex singularity is basically unaffected by the vortex seed. To further improve the pulse contrast, it is necessary to try to suppress the PSF near the vortex singularity. Although this part of the PSF does not spatially coincide with the vortex pulse, it can still affect the temporal contrast of the vortex pulse. We can make full use of the differences in the near-field spatial distribution of PSF and vortex to suppress PSF. One way is to use a screen to block the PSF of the vortex center in the near-field, but it inevitably interferes with the vortex beam. From another perspective, we can perform the spatial filtering operation in the far-field. For example, when the vortex beam in Figure 4(a2) is focused by a lens with a focal length of 100 mm, it will become a small vortex at the focal plane (Figure 6(a)). However, after the same focusing process, the PSF with a smaller near-field spot will have a much larger spanning range in the far-field than the vortex focal spot (Figure 6(b)). Using this feature, we can use a diaphragm to filter out the PSF outside the vortex focal spot range, further improving the pulse contrast. To determine the trade-offs between the energy transmittance and contrast gain, we calculate their dependencies on both the diameter and longitudinal position of the diaphragm. As shown in Figures 6(c) and 6(d), when the diaphragm diameter is 0.5 mm, it simultaneously exhibits a high energy transmittance (99.3%) and a relatively high contrast gain (23.9). When the diaphragm diameter increases from 0.5 mm, although the energy transmittance will be higher, the filtering efficiency will get worse; conversely, the filtering effect will improve, but the energy transmittance will decline. In addition, the calculations reveal that such a 0.5-mm-diameter diaphragm achieves the best filtering performance when placed approximately 10 mm in front of the focus (Figure 6(e)). The larger the diaphragm diameter, the higher the tolerance for positional deviation will be. However, the degradation of the filtering effect also needs to be taken into account. In practical experiments, the size and position of the diaphragm must be calibrated by monitoring parameters such as the energy transmittance, near-field profile and contrast enhancement of the filtered vortex beam. Furthermore, achromatic lenses should be prioritized to minimize chromatic aberration effects on filtering performance. When the vortex beam returns to the near-field, this far-field filtering operation greatly suppresses the PSF near the vortex singularity without interfering with the vortex beam itself. This means that a traditional 4f filtering system can be used to filter out the PSF noise near the vortex singularity at both the inter-stage and the final end of a vortex OPCPA system.
Suppression of the PSF for case 2 depicted in Figure 4, achieved through spatial filtering with a 100-mm focal-length lens. (a) Focused vortex spot. (b) PSF distribution at the plane of (a). (c) Dependence of contrast gain on both the diaphragm diameter and its longitudinal deviation from the lens focus. (d) Dependence of energy transmittance on both the diaphragm diameter and its longitudinal deviation from the lens focus. (e) Temporal intensity profiles (obtained via full-space integration) of the compressed vortex pulse before (black curve) and after (red curve) undergoing far-field (FF) filtering through a diaphragm with a diameter of 0.5 mm, positioned 10 mm before the lens focus.

4.2 Vortex pumping
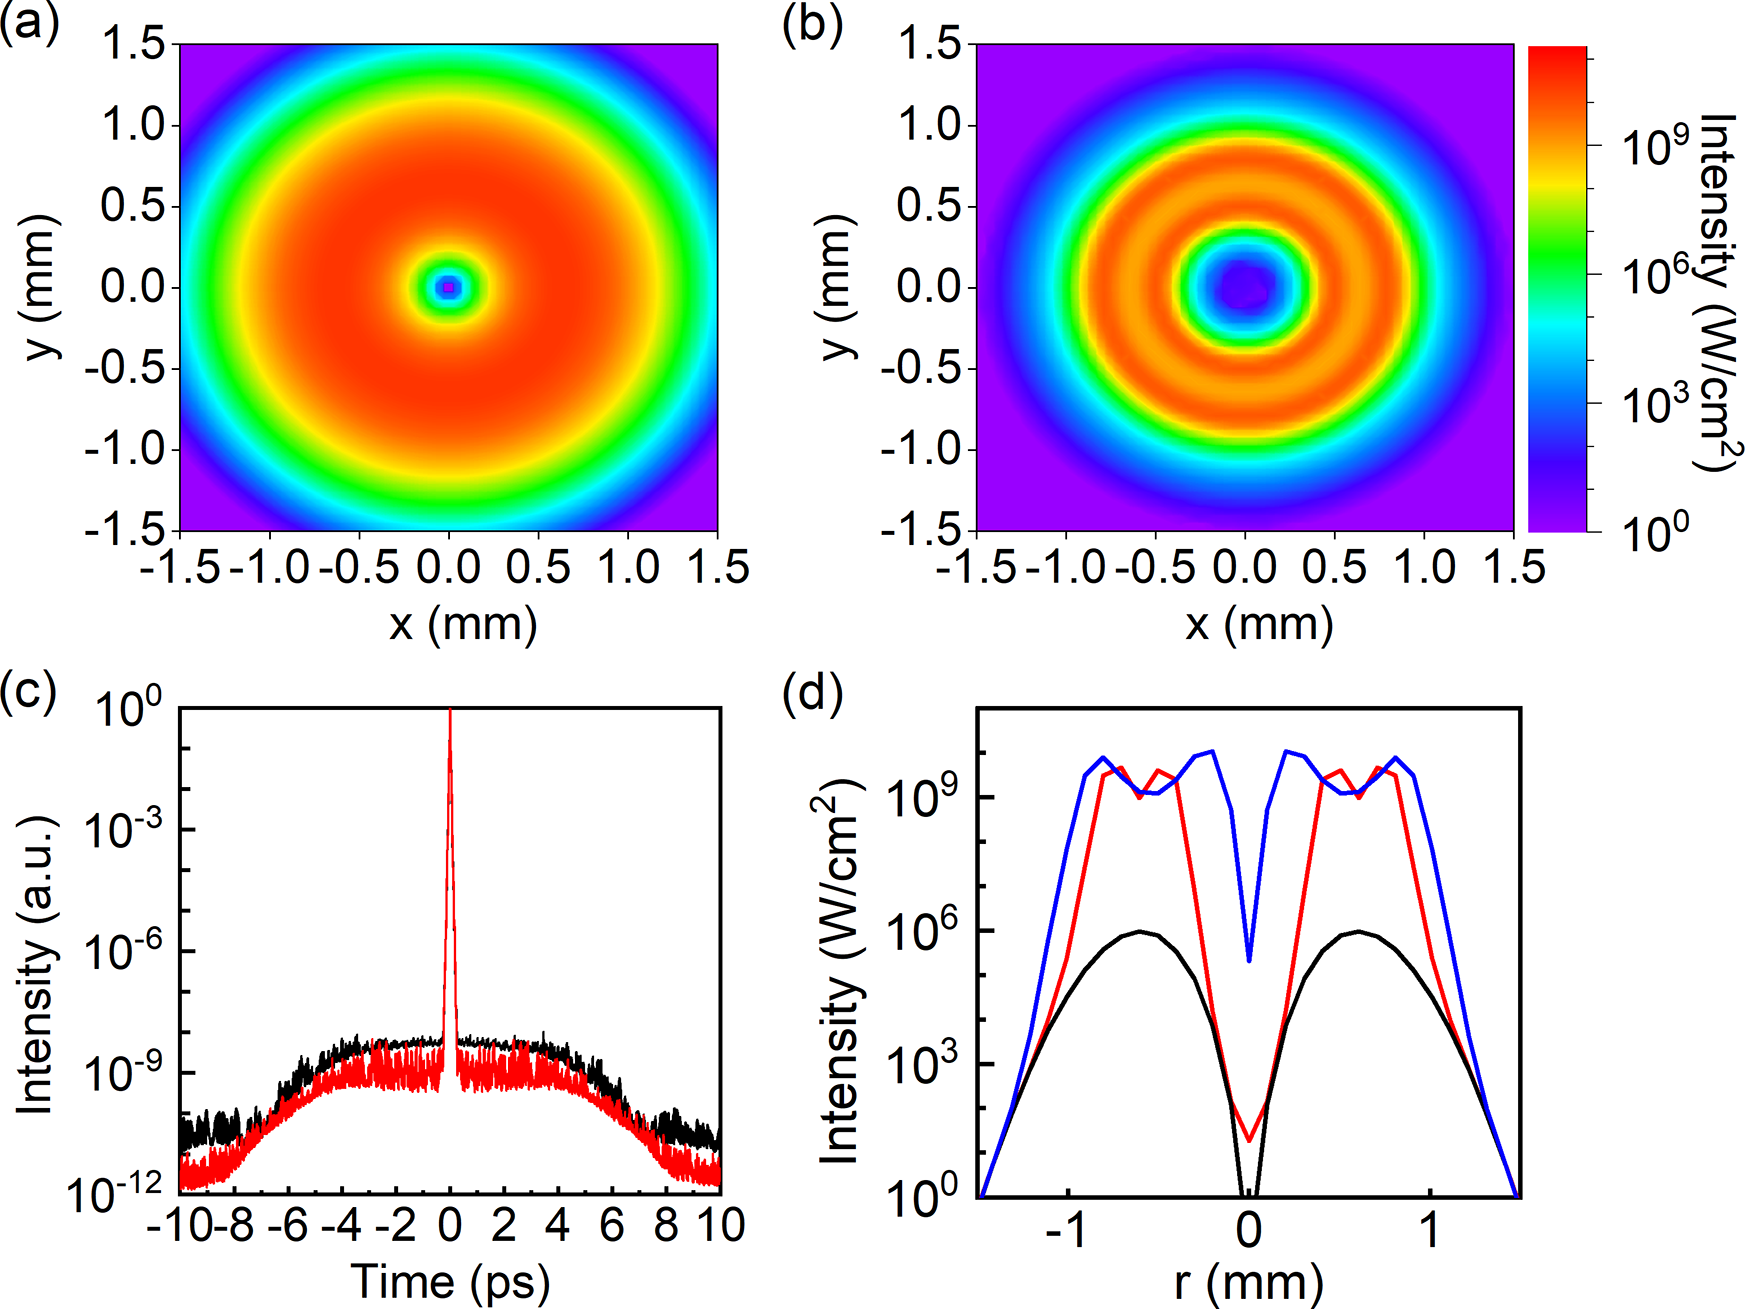
The PSF near the vortex singularity can be partially filtered out using the technique illustrated in Figure 6, but it cannot be completely eliminated. The dependency of OPCPA gain on pump intensity suggests that we can suppress the PSF at the center of the vortex signal singularity by replacing the pump beam from a super-Gaussian beam to a vortex beam. We numerically demonstrate the effectiveness of this approach at the third seed intensity level. When pumping with a vortex beam that has the same profile as the signal (Figure 7(a)), the zero-intensity feature at the center of the amplified vortex singularity is well-preserved, as shown in Figure 7(b). Compared to the super-Gaussian pumping case (blue line in Figure 7(d)), the intensity background at the center of the amplified vortex beam is reduced from approximately 10 ${}^5$
W/cm
${}^5$
W/cm ${}^2$
to approximately 10 W/cm
${}^2$
to approximately 10 W/cm ${}^2$
, and the vortex beam becomes sharper than that in Figure 4(a3), while the peak intensity of the vortex beam remains basically unchanged (red line in Figure 7(d)). Consequently, the spatial contrast of the amplified vortex beam is significantly enhanced. In the time domain, the suppression of the PSF around the vortex singularity also leads to an improvement in temporal contrast (Figure 7(c)).
${}^2$
, and the vortex beam becomes sharper than that in Figure 4(a3), while the peak intensity of the vortex beam remains basically unchanged (red line in Figure 7(d)). Consequently, the spatial contrast of the amplified vortex beam is significantly enhanced. In the time domain, the suppression of the PSF around the vortex singularity also leads to an improvement in temporal contrast (Figure 7(c)).
Suppression of the PSF near the vortex singularity through the use of a vortex pump. (a) Beam profile of the vortex pump. (b) Beam profile of the amplified vortex pulse. (c) Temporal intensity profiles of the amplified vortex pulse after compression, using a Gaussian pump beam (black curve) and a vortex pump beam (red curve). (d) Radial intensity distributions for the seed vortex (black curve), the amplified vortex with a Gaussian pump beam (blue curve) and the amplified vortex with a vortex pump beam (red curve). For both pump cases, the peak intensities of the pump and seed pulses are maintained at 30 GW/cm ${}^2$
and 1 MW/cm
${}^2$
and 1 MW/cm ${}^2$
, respectively. The plot in Figure 7(a) shares the same color bar with Figure 7(b).
${}^2$
, respectively. The plot in Figure 7(a) shares the same color bar with Figure 7(b).

5 Discussion and conclusion
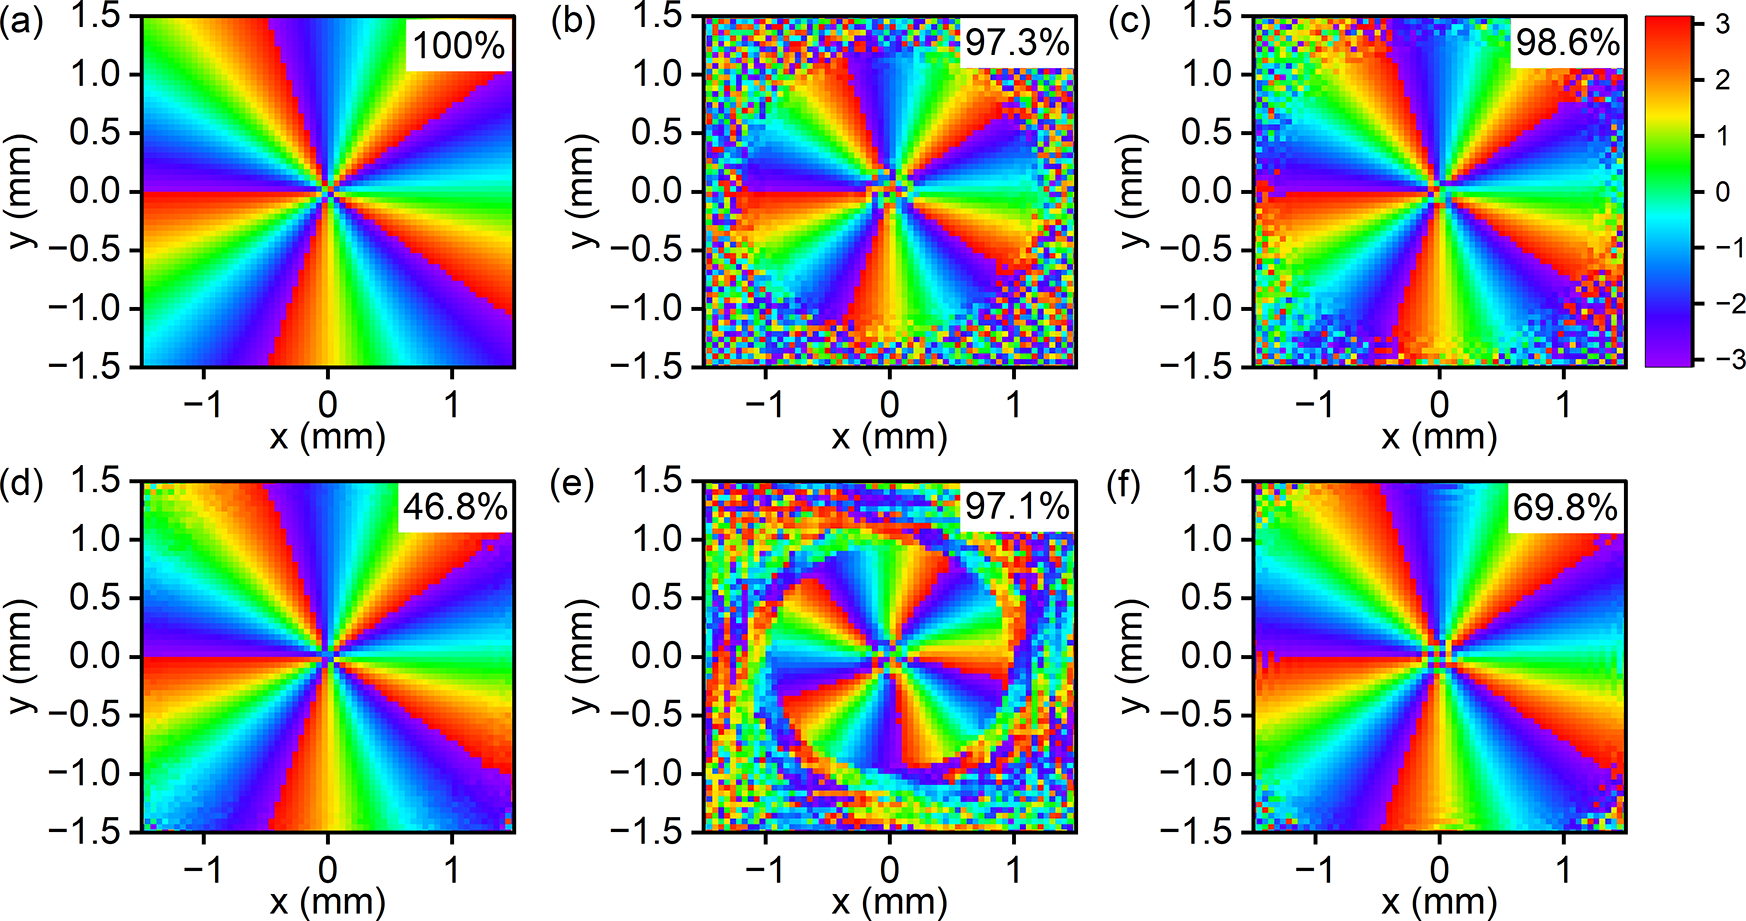
The above simulation results primarily focus on the evolution dynamics and suppression methods of the PSF during OPCPA of vortex beams, providing the spatial intensity distributions of vortex beams in each scenario. For completeness, we here present the spatial phase distributions and corresponding LG mode purities of the vortex beams in each case, as shown in Figure 8. The seed vortex beam is a perfect LG beam with azimuthal and radial indices of 5 and 0, respectively, resulting in a mode purity of 100% (Figure 8(a)). After OPCPA, when the seed intensities correspond to cases 1 and 2 in Figure 2(b), the mode purity of the amplified vortex remains at a high level of more than 97% (Figures 8(b) and 8(c)). However, under a stronger seed in case 3, the mode purity significantly decreases (Figure 8(d)), due to interference with the radial distribution of the vortex beam under over-saturated amplification (Figure 4(a3)). For the amplified vortex beam with the case 2 seed, after far-field filtering, its phase and mode purity remain essentially unchanged (Figure 8(e)). In the vortex pumping scheme, despite employing the strong seed of case 3, the calculated vortex mode purity (Figure 8(f)) is much higher than that achieved with super-Gaussian pumping (Figure 8(d)), reflecting the advantages of vortex pumping.
Spatial phase and LG mode purity of the vortex beam after each PSF mitigation strategy. (a) Phase of the input LG beam shown in Figure 1(a), with azimuthal and radical indices of 5 and 0, respectively. (b)–(d) These correspond to the phases of the amplified vortex beams shown in Figures 4(a1)–4(a3), respectively, with increasing signal seeding levels. (e) Phase of the vortex beam after far-field filtering (Figure 6). (f) Phase of the vortex beam in Figure 7(b) obtained by vortex pumping. The calculated LG mode purity for each case is labeled in the top-right corner of the corresponding subfigure. All subfigures share a common colormap, positioned on the right-hand side of panel (c).

We would like to point out that the evolution dynamics and suppression strategies for PSF in vortex OPCPA can be generalized and applied to the scheme of optical parametric amplification (OPA). The only difference is that in OPA, the suppression of the PSF will not be directly reflected in the improvement of the temporal contrast of the amplified signal. This is because OPA does not involve signal chirping and compression, causing the PSF to be submerged within the amplified signal. Nevertheless, the reduction of PSF content is beneficial for enhancing the energy contrast and/or the spatial contrast of the amplified vortex beam from OPA. Finally, we discuss the beam profile and PSF in the idler channel. Since the idler carries the phase difference between the pump and signal ( ${\phi}_i={\phi}_\mathrm{p}-{\phi}_\mathrm{s}+\pi /2$
), the difference in topological charge between the pump and the signal will be transferred to the idler. Therefore, in OPCPA/OPA pumped by a conventional pump, the idler is also a vortex beam with a topological charge opposite to the signal beam, but in the case of a vortex pump, as shown in Figure 7, the idler becomes a ring-profile beam without OAM. In either case, the PSF in the idler direction follows the same evolution dynamics as the PSF in the signal beam direction. Moreover, the PSF suppression strategies proposed in this paper for the signal beam direction are equally applicable to the PSF in the idler direction. By employing the proposed PSF suppression strategies in the idler channel of a non-degenerate OPCPA/OPA system, it becomes feasible to generate high-contrast vortex lasers at novel wavelengths.
${\phi}_i={\phi}_\mathrm{p}-{\phi}_\mathrm{s}+\pi /2$
), the difference in topological charge between the pump and the signal will be transferred to the idler. Therefore, in OPCPA/OPA pumped by a conventional pump, the idler is also a vortex beam with a topological charge opposite to the signal beam, but in the case of a vortex pump, as shown in Figure 7, the idler becomes a ring-profile beam without OAM. In either case, the PSF in the idler direction follows the same evolution dynamics as the PSF in the signal beam direction. Moreover, the PSF suppression strategies proposed in this paper for the signal beam direction are equally applicable to the PSF in the idler direction. By employing the proposed PSF suppression strategies in the idler channel of a non-degenerate OPCPA/OPA system, it becomes feasible to generate high-contrast vortex lasers at novel wavelengths.
In summary, we investigate the evolution and suppression of the PSF in the context of OPCPA with vortex beams. The unique configuration of vortex beams results in distinct evolution behaviors and suppression strategies for the PSF on the vortex ring and that at the vortex core. PSF, as a spontaneous amplified output originating from quantum noise, primarily populates the gain bandwidth determined by the crystal and pump laser in terms of spectral composition. Its spatiotemporal distribution is determined by the pump laser’s characteristics, with intensity strongly dependent on the pump intensity. Upon the seed of a vortex beam, PSF competes with the vortex pulse for pump energy, with this competition becoming pronounced during strong vortex seeding, whereas it exhibits negligible impact during the small-signal gain state where pump energy consumption is minimal. In proximity to the vortex singularity, the PSF is generally more intense due to the absence of a competition process. The PSF can deteriorate both the spatial and temporal contrasts of the vortex pulse. For PSF spatially aligned with the vortex beam, we propose suppression through enhanced vortex seeding. For PSF centered at the vortex singularity, we introduce two suppression methods: far-field filtering and vortex pumping. These techniques significantly improve the temporal or spatial contrasts of the compressed vortex pulse. Notably, our approach leverages the unique properties of vortex beams to spatially suppress the PSF, while established time-domain contrast enhancement techniques based on nonlinear optical switches, such as cross-polarized wave generation and plasma mirrors[ Reference Veisz and Duarte 33 ], remain viable for vortex OPCPA systems. The integration of these spatial and temporal isolation strategies for PSF ensures ultra-high contrast levels in vortex intense lasers, thereby providing high-quality drivers for future cutting-edge research in intense field physics.
Acknowledgements
This work was supported by the National Key Research and Development Program of China (Grant No. 2023YFA1608503), the National Natural Science Foundation of China (Grant No. 62375165) and the Fundamental Research Funds for the Central Universities (Grant No. YG2024LC06). J. Ma gives thanks for the sponsorship of the Cyrus Tang Foundation through the Tang Scholar program.








 Open access

