

Food insecurity is defined as limited availability of nutritionally adequate and safe foods or the lack of ability to acquire acceptable foods in a socially acceptable ways( Reference Anderson 1 ). In South Korea, national food availability and the purchasing power of Koreans have been enhanced by rapid economic growth( Reference Kim, Moon and Popkin 2 ). However, differences in the quantity and quality of dietary intake based on socio-economic status have widened over time( Reference Hong, Kim and Kim 3 ). Even though a Western-style diet has become popular due to the rapid socio-economic changes and Westernization in Korea, the typical Korean diet is still considered a healthy diet composed of white rice, various vegetables in fresh, cooked and pickled form, and low in fat( Reference Kim, Moon and Popkin 2 ). However, socio-economic inequality and inaccessibility to adequate nutrition increase the intake of unhealthy foods( Reference Darmon and Drewnowski 4 ) as well as hunger, which may contribute to health inequalities. In order to develop strategies or programmes to assist vulnerable individuals with food insecurity, the prevalence of people with food insecurity first needs to be identified using a validated questionnaire among a representative sample of the Korean population and then their dietary intake should be evaluated through comparison with the population who have food security. However, previous studies on food insecurity in South Korea were conducted in socially disadvantaged classes or in a rural area( Reference Oh and Hong 5 – Reference Kim, Kim and Shin 8 ).
Since 2005, surveys on household food insecurity have been conducted using a single-item questionnaire to detect food insufficiency in the Korea National Health and Nutrition Examination Survey (KNHANES). However, this specific parameter was limited to estimating food insufficiency due to poverty. Therefore, it has been difficult to ascertain whether households have problems in terms of accessibility to and availability of foods and to what extent of these problems exist( Reference Anderson 1 ). In order to estimate all aspects of food availability, accessibility and utilization, an eighteen-item questionnaire on household food security was introduced in the 2012 KNHANES.
The present study aimed to examine the extent and severity of household food insecurity in a representative Korean population and to certify which characteristics of the household and householder affect food insecurity. Furthermore, we identified whether dietary intake of household members differs by the status of food security using data from the 2012 KNHANES.
Methods
Study population
The KNHANES is a nationwide cross-sectional survey initiated in 1998 for examining the health and nutritional status of the non-institutionalized Korean population. The survey was conducted as a tri-annual survey in 2001 and 2005. Since 2007, it was converted to an annual survey and conducted by the Korea Centers for Disease Control and Prevention. The present study was based on data from the 2012 KNHANES. In the 2012 KNHANES, 3840 representative households of non-institutionalized Korean citizens residing in Korea were selected using a stratified and multistage clustered probability sampling method. Among 3254 households that participated in the health interview, examination and nutrition survey, a total of 3043 households completed the food security questionnaire. Thirty-six households that were missing data on one or more item(s) of the food security questionnaire were excluded. Finally, 3007 households and their 7118 family members aged ≥1 year in the selected households were included in the current analysis.
All procedures and protocols used in the study were approved by the institutional review board of the Korea Centers for Disease Control and Prevention (2012-01EXP-01-2C). Written informed consent regarding the survey was obtained from all participants.
Data collection
Health interview and examination
The health interview and examination were performed by trained medical staff and interviewers in mobile examination centres. The health interview provided detailed information on household characteristics (e.g. household type, household income, housing ownership, receipt of basic livelihood security, residential location) and family members’ sociodemographic features (e.g. sex, age, education, marital status), receipt of food assistance, health-related behaviours (e.g. smoking, drinking) and general health status.
Nutrition survey
The nutrition survey consisted of dietary habits and a 24 h dietary recall for all family members aged ≥1 year and a semi-quantitative FFQ for adults aged 19–64 years. The nutrition survey was conducted by trained dietitians in the homes of participants. The semi-quantitative FFQ identified the consumption frequency and amount for 112 food items over a 1-year period prior to the interview( Reference Yun, Shim and Kweon 9 ). Daily energy and nutrient intakes from the 24 h dietary recall and semi-quantitative FFQ were estimated using the Korean Foods and Nutrients Database of the Rural Development Administration( 10 , 11 ). The validity and reproducibility of the semi-quantitative FFQ have been described in detail elsewhere( Reference Kim, Song and Lee 12 ). We used data from the FFQ to compare food and nutrient intakes between food-secure adults and food-insecure adults because the reference period of the FFQ was same as that of the food security questionnaire; moreover, FFQ data represented the usual intake. To estimate the proportions of energy intake deficiency (i.e. energy intake less than 75 % of the estimated energy requirement) and nutrient intake deficiency (i.e. nutrient intake less than the estimated average requirement) by age and sex( 13 ), the absolute intakes of energy and nutrients from a 24 h dietary recall were used for all family members aged ≥1 year.
Household food security
The food security questionnaire developed by the Korea Centers for Disease Control and Prevention was based on the eighteen-item US Household Food Security Survey Module (HFSSM). The household food security questionnaire consisted of three questions on household food conditions and seven questions for adults. In cases of households with children, an additional eight questions for children were administered. Each question specified the food condition due to the lack of money to buy food during 1 year prior to the interview. A detailed description concerning the development and validation of this index has been published elsewhere( Reference Kim, Hong and Kwon 7 , Reference Kim, Hong and Kwon 14 ). In brief, as a result of the validity and reliability study conducted in 446 households, the eighteen-item questionnaire had good internal consistency (Cronbach’s α=0·85) and construct validity by showing the parallels between the response curves of food insecurity severity and household income level. Also, criterion-related validity was confirmed by the significant relationship between food insecurity status and characteristics of the household or householder, such as socio-economic status, health status and dietary diversity. In the current study, Cronbach’s α for internal consistency was 0·85 and internal consistency ranged from 0·83 to 0·86 after eliminating each item.
The questionnaire was administered to the predominant food purchaser in each household. To classify the household food security status, a score of 1 for affirmative responses indicating food-insecure conditions (e.g. ‘often’ or ‘sometimes’, ‘almost every month’ or ‘some months but not every month’ and ‘yes’) or a score of 0 for all other responses was given to each question and then a summative score was calculated. Households were classified into a food-secure group if the total score was ≤2 and a food-insecure group if the total score was ≥3. Food-insecure households were further classified into three groups according to the severity of food insecurity as follows: food-insecure without hunger (score of 3–5), moderate food-insecure with hunger (score of 6–8) and severe food-insecure with hunger (score of 9–10) for households without children; and food-insecure without hunger (score of 3–7), moderate food-insecure with hunger (score of 8–12) and severe food-insecure with hunger (score of 13–18) for households with children. There were few households classified as severe food-insecure. Therefore, moderate or severe food-insecure households were placed into the single category of ‘food-insecure households with hunger’. The status of food security of all family members within a household was classified by food security status of the household.
Statistical analysis
Energy-adjusted nutrient values were obtained using the residual method( Reference Willett 15 ). To improve the normality of the skewed distributions of nutrient intake and to create residuals of nutrient intake with a more constant variance across levels of energy intake, the values of nutrient intake were log-transformed prior to adjustment of energy intake. All analyses were conducted using the SAS ‘proc survey’ procedure (in the statistical software package SAS version 9·4) for analysing complex sample survey data. To represent the Korean population, sampling weights assigned to households or participants were applied to all analyses. Sampling weights were generated by considering the complex sample design, non-response rate of the target population and post-stratification. Data are presented as percentages with their standard errors for categorical variables and as means with their standard errors for continuous variables. Significant differences between the food-secure and food-insecure groups were tested using multivariate linear regression (‘proc surveyreg’) for weighted means and the χ 2 test (‘proc surveyfreq’) and multivariate binary or multinomial logistic regression (‘proc surveylogistic’) for percentages after adjusting for age and sex. P values <0·05 were considered statistically significant.
Results
In the 2012 KNHANES, the estimated percentage of households with food security was 88·7 %. The remaining 11·3 % showed food insecurity (9·3 % for food insecurity without hunger and 2·0 % for food insecurity with hunger). The prevalence of food-insecure households in households with children was 13·2 %, which was higher compared with 10·3 % in households without children. Of elderly participants living in a household with children, 21·6 % were in a food-insecure condition (Table 1).
Prevalence of household food security and insecurity in the 2012 Korea National Health and Nutrition Examination Survey
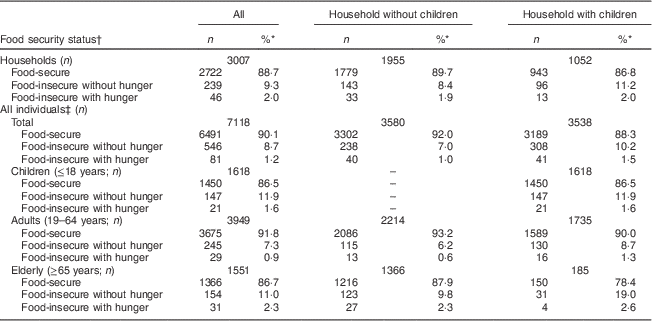
* All percentages were calculated by applying sampling weights assigned to households or individual participants in the nutrition survey.
† Food security status was classified into three groups: food-secure (score ≤2), food-insecure without hunger (score of 3–5 for households without children and score of 3–7 for households with children) and food-insecure with hunger (score ≥6 for households without children and score ≥8 for households with children).
‡ Classified by food security status of households.
General characteristics of households and householders according to food security status are shown in Table 2. Food-insecure households had a higher proportion of a single householder (28·5 %), lone parent (14·9 %) and grandparent-headed families (6·0 %) compared with food-secure households. Furthermore, more than half of the food-insecure households reported the lowest household income and were not homeowners. The proportion of current recipients of basic livelihood security was 17·5 % for food-insecure households (15·5 % for food-insecure households without hunger and 27·2 % for food-insecure households with hunger), which was significantly higher compared with 3·4 % for food-secure households. With respect to householder’s characteristics, the proportion of elderly people aged ≥65 years (46·7 %) and women (60·7 %) was significantly higher in food-insecure households. Additionally, after adjusting for sex, age and income of the householder, education level was significantly lower and the proportions of divorced, separated and widowed and food assistance recipients for last 1 year were significantly higher in food-insecure households compared with food-secure households.
General characteristics of households and householders according to food security status in the 2012 Korea National Health and Nutrition Examination Survey
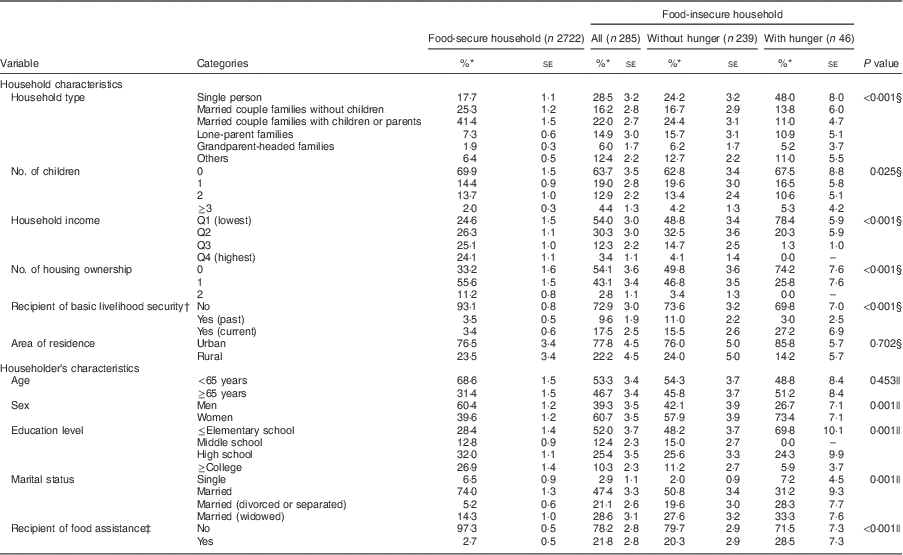
* All percentages and standard errors were calculated by applying sampling weights assigned to households.
† Including livelihood benefits, housing benefits, education benefits or medical benefits, etc. from government.
‡ Experience for the last 1 year of food assistance including NutriPlus+ Program (a supplemental nutrition care programme for women, infants and children in Korea, adopting the US WIC programme), senior meals programme in welfare centres, or lunch delivery programme for low-income families or children during school vacation.
§ P value for differences between food-secure households and all food-insecure households was calculated using χ 2 test.
|| P value for differences between food-secure households and all food-insecure households was calculated using multivariate logistic regression after adjusting for sex, age (continuous) and income (four categories).
Table 3 shows that the proportion skipping breakfast for last two consecutive days was significantly higher in children of food-insecure households (13·2 %) compared with children of food-secure households (8·1 %). The proportion of skipping three or more of any meals for 2 d was significantly higher in children (5·8 %) and adults (5·4 %) of food-insecure households compared with children (1·9 %) and adults (2·2 %) of food-secure households.
Dietary behaviours of participants according to food security status in the 2012 Korea National Health and Nutrition Examination Survey

* Age- and sex-adjusted percentages and standard errors were calculated by applying sampling weights assigned to individual participants in the nutrition survey.
† P value for differences between food-secure individuals and all food-insecure individuals was calculated using multivariate logistic regression after adjusting for age (continuous) and sex.
‡ P value for differences between food-secure individuals, food-insecure individuals without hunger and food-insecure individuals with hunger was calculated using multivariate logistic regression after adjusting for age (continuous) and sex.
The mean weekly food consumption frequencies obtained from FFQ data for adults aged 19–64 years according to their food security status are shown in Table 4. Weekly consumption frequencies of all types of vegetables (fresh, cooked and pickled), seaweeds, fruits, fruit juice, nuts, and milk and milk products were significantly lower in food-insecure adults compared with food-secure adults, especially in adults of food-insecure households with hunger.
Weekly food consumption frequencies obtained from the FFQ according to food security status among adults aged 19–64 years in the 2012 Korea National Health and Nutrition Examination Survey
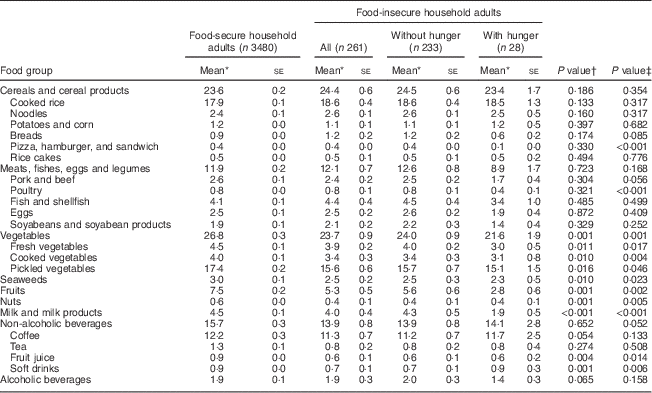
* Age- and sex-adjusted means and standard errors were calculated by applying sampling weights assigned to individual participants in the nutrition survey.
† P value for differences between food-secure adults and all food-insecure adults was calculated using multivariate linear regression after adjusting for age (continuous) and sex.
‡ P value for differences between food-secure adults, food-insecure adults without hunger and food-insecure adults with hunger was calculated using multivariate linear regression after adjusting for age (continuous) and sex.
Table 5 shows the mean daily intakes of energy and nutrients from FFQ data in adults aged 19–64 years according to food security status. Mean intakes of energy, fat and carbohydrates were not significantly different between food-secure and food-insecure adults. In contrast, daily intakes of protein, crude fibre, minerals (Ca, P, Na, K, Fe) and vitamins (vitamin A, thiamin, riboflavin, niacin, vitamin C) were significantly lower in adults of food-insecure households compared with adults of food-secure households, especially in adults of food-insecure households with hunger.
Daily intakes of energy and nutrients obtained from the FFQ according to food security status among adults aged 19–64 years in the 2012 Korea National Health and Nutrition Examination Survey

1 kcal = 4·184 kJ; RE, retinol equivalents.
* Age- and sex-adjusted means and standard errors were calculated by applying sampling weights assigned to individual participants in the nutrition survey.
† P value for differences between food-secure adults and all food-insecure adults was calculated using multivariate linear regression after adjusting for age (continuous) and sex.
‡ P value for differences between food-secure adults, food-insecure adults without hunger and food-insecure adults with hunger was calculated using multivariate linear regression after adjusting for age (continuous) and sex.
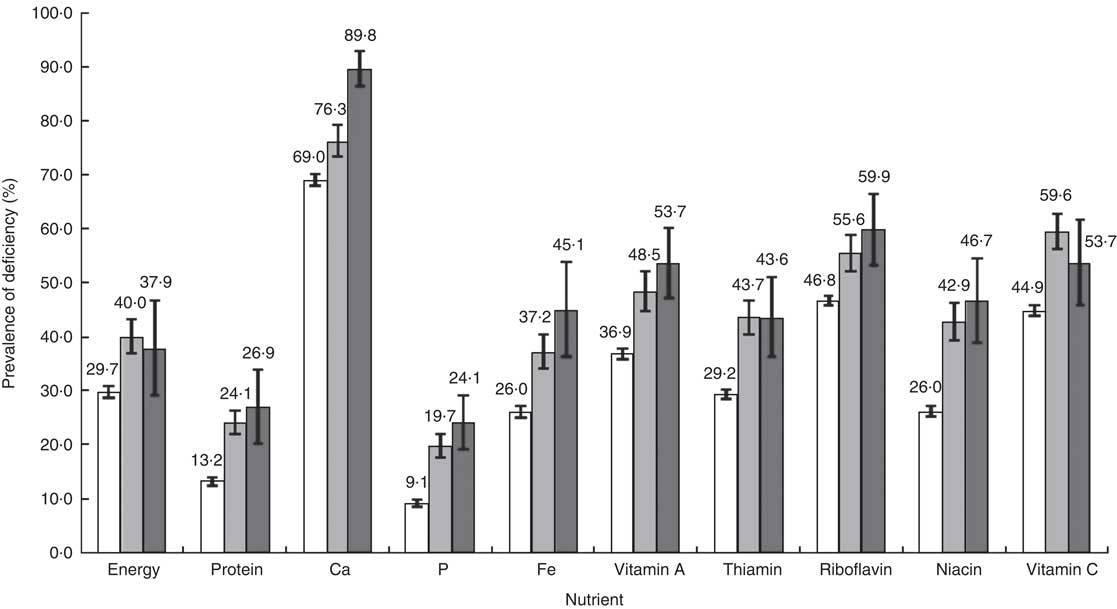
Figure 1 shows the prevalence of energy and nutrient deficiencies compared with the estimated energy requirement or the estimated average requirement among family members aged ≥1 year using data from a 24 h dietary recall. The proportions of deficient intake of energy, protein, Ca, P, Fe, vitamin A, thiamin, riboflavin, niacin and vitamin C were significantly higher in family members of food-insecure households compared with family members of food-secure households.
Prevalence of deficient intakes of energy and nutrients compared with the Korean Dietary Reference Intake according to food security status (![]() , food-secure (n 6486);
, food-secure (n 6486); ![]() , food-insecure without hunger (n 546);
, food-insecure without hunger (n 546); ![]() , food-insecure with hunger (n 81)) among family members aged ≥1 year who participated in a 24 h dietary recall survey, 2012 Korea National Health and Nutrition Examination Survey. Energy deficiency was defined as energy intake less than 75 % of the estimated energy requirement according to sex and age for Koreans; nutrient deficiency was defined as nutrient intake less than the estimated average requirement according to sex and age for Koreans. Values are weighted percentages with their standard errors represented by vertical bars, which were calculated by applying sampling weights assigned to individual participants in the nutrition survey. Using the χ
2 test, all P values for differences in prevalence between food-secure individuals, food-insecure individuals without hunger and food-insecure individuals with hunger were <0·01
, food-insecure with hunger (n 81)) among family members aged ≥1 year who participated in a 24 h dietary recall survey, 2012 Korea National Health and Nutrition Examination Survey. Energy deficiency was defined as energy intake less than 75 % of the estimated energy requirement according to sex and age for Koreans; nutrient deficiency was defined as nutrient intake less than the estimated average requirement according to sex and age for Koreans. Values are weighted percentages with their standard errors represented by vertical bars, which were calculated by applying sampling weights assigned to individual participants in the nutrition survey. Using the χ
2 test, all P values for differences in prevalence between food-secure individuals, food-insecure individuals without hunger and food-insecure individuals with hunger were <0·01
Discussion
Using data from the 2012 KNHANES, we estimated that the prevalence of household food security was 88·7 % in a representative Korean population. We also found that the food security status of households was related to the socio-economic status of the household and householder. The proportion of skipped meals was significantly higher in children and adults of food-insecure households. Moreover, intakes of foods (vegetables, seaweeds, fruits, fruit juice, nuts, and milk and milk products) and nutrients (protein, crude fibre, minerals and vitamins) were significantly lower in food-insecure adults compared with food-secure adults. However, intakes of energy, fat and carbohydrates were not significantly different between food-insecure and food-secure adults.
Although South Korea has experienced rapid economic growth during the past several decades, social polarization deepened after a financial crisis in 1997( Reference Kang, Shin and Lee 16 ). For this reason, concerns about food insecurity are increasing in South Korea. In the present study, the percentage of food-insecure households was 11·3 % (including 2·0 % for food insecurity with hunger). This is lower than the 14 % of the general US population with food insecurity (including 5·7 % for food insecurity with hunger) characterized using the eighteen-item HFSSM( Reference Coleman-Jensen, Nord and Singh 17 ). In our study, food insecurity was more prevalent among households with children (13·2 %) than among households without children (10·3 %), which is consistent with results from a national survey in the USA( Reference Coleman-Jensen, Nord and Singh 17 ) and Australia( Reference Babbington and Donato-Hunt 18 ). The Korea National Statistical Office has reported that the relative poverty rate in Korea (defined as the proportion of the population with income below 50 % of the median income) was 11·1 % in households with children and 14·3 % in households without children( 19 ). However, it has been determined that the average monthly cost of raising a child in South Korea is 1·19 million won (approximately $US 1150)( Reference Kim, Kim and Kim 20 ). Therefore, households with children may have reduced money to purchase food. In our study, the prevalence of food insecurity was 13·5 % (including 1·6 % for food insecurity with hunger) among children, which exceeded the 8·2 % found among adults (including 0·9 % for food insecurity with hunger). The prevalence of skipping breakfast and any meals was significantly higher in food-insecure children compared with food-secure children. Using data from a 24 h recall, we observed that the mean intakes of energy and nutrients of young children aged 1–4 years in food-insecure households were not different from those of children in food-secure household (data not shown). This can be explained by the fact that young children aged ≤4 years residing in food-insecure households are protected from the effects of the household’s food insecurity( Reference Coleman-Jensen, Nord and Singh 21 ). However, food-insecure children aged 5–18 years showed significantly lower intakes of protein, fat, Ca, P and K compared with food-secure children (data not shown). During childhood, inadequate dietary intake can negatively impact health and growth( Reference Cook and Frank 22 ) and can lead to increased obesity and diet-related chronic diseases during adulthood( Reference Ness, Maynard and Frankel 23 , Reference Power and Parsons 24 ). Also, elderly individuals living in households with children demonstrated the worst food security conditions. Therefore, food assistance programmes are needed for food-insecure household with children and the elderly.
It has been suggested that food insecurity is affected by the socio-economic status of the household and householders( Reference Kim, Kim and Shin 8 , Reference Coleman-Jensen, Nord and Singh 17 , Reference Babbington and Donato-Hunt 18 , Reference Temple 25 ). In the present study, food-insecure households showed a higher proportion of individuals living alone, lone parents or grandparent-headed families compared with food-secure households. A majority of food-insecure households had the lowest income and did not have a permanent residence. These results indicate that food insecurity is strongly associated with socio-economic status of the household. Food-insecure households were more likely to receive basic livelihood security. However, among food-insecure households with hunger, only 27·2 % received current basic livelihood security and only 28·5 % had experienced food assistance during 1 year prior to the study(Table 2). Moreover, approximately 65 % did not receive either basic livelihood security or food assistance although they were in hunger (data not shown). This indicates that a strategy for selecting food-insecure households with hunger as recipients of food assistance programmes is needed.
The condition of limited access to sufficient, safe and nutritious foods can lead to inadequate dietary intake. In the present study, the weekly consumption frequencies of vegetables (fresh, cooked and pickled), seaweeds, fruits, fruit juice, nuts, and milk and milk products were significantly lower in food-insecure adults compared with food-secure adults. As income decreases, food choices usually shift from healthy foods including high-quality proteins, whole grains, vegetables and fruits to less expensive energy-dense foods( Reference Drewnowski and Eichelsdoerfer 26 ). Vegetables and fruits are a major source of antioxidant nutrients, fibre and phytochemicals known to contribute to a reduced risk of chronic diseases, including cancer and CVD( 27 , Reference Wang, Ouyang and Liu 28 ). Koreans often consume processed vegetables including cooked and pickled vegetables rather than fresh vegetables. Although vegetables are not considered expensive, cooking vegetables is more time consuming. Decreased vegetable intake among food-insecure adults could be attributed to the lack of affordable time to cook food or knowledge of a healthy diet. Moreover, food-insecure adults showed significantly higher consumption of processed products, such as ramen and curry rice, and inexpensive street foods (ready-to-eat foods) including tteokbokki (stir-fried rice cake with fermented red pepper paste), sundae (a kind of sausage made of pig’s intestines stuffed with cellophane noodles and pork blood) and fish paste compared with food-secure adults (data not shown). Also, food-insecure adults with hunger more frequently consumed soft drinks (0·9 times/week) compared with food-insecure adults without hunger (0·7 times/week). Except for energy, fat and carbohydrates, the mean intakes of protein, fibre, vitamins and minerals were significantly lower in food-insecure adults compared with food-secure adults. When stratified analysis was conducted by sex, a pattern of lower intakes of food groups and nutrients in food-insecure households was observed in both men and women, except for alcohol; food-insecure men more frequently consumed alcohol (3·1 times/week) compared with food-secure men (2·8 times/week) with significance (P<0·001; data not shown). Additionally, the proportions with deficient intakes of energy and nutrients compared with dietary reference intakes were higher in family members of food-insecure households. These results indicate that food insecurity is directly associated with inadequate dietary intake.
The present study has several limitations. First, there is a possibility of under-reporting because of the sensitive nature of questions regarding food insecurity. In addition, households that refused to participate or did not complete the food security survey shared similar characteristics to food-insecure households in the study (data not shown). Moreover, the KNHANES did not include institution-dwelling individuals or people who are difficult to identify, locate or interview (e.g. homeless individuals). This indicates that the prevalence of household food insecurity could be underestimated. Second, we applied the status of household food security to individuals, although there is a possibility that food security of family members was not directly affected by the status of household food insecurity. Third, there were no data from FFQ for children and the elderly. However, the results from a 24 h recall were similar with those from the FFQ among adults having both data; using data from a 24 h recall, daily intakes of most nutrients, except for energy, carbohydrates, Na and vitamin A, showed significant differences between the food-secure adults and food-insecure adults (data not shown). Despite these limitations, our study is the first nationwide survey to evaluate the prevalence of household food insecurity and compare dietary intake by food security status using a validated food security questionnaire in a representative Korean population.
Conclusion
Our results revealed that food-insecure people consumed significantly less healthy foods and nutrients essentially needed for health and growth. Inequality in the accessibility to and availability of various foods could contribute to health inequalities through inadequate nutritional status( Reference Campbell 29 ). Therefore, development of a good approach for identifying food-insecure households with hunger and implementation of enhanced food assistance programmes are required for food-insecure households in Korea.
Acknowledgements
Financial support: The KNHANES was financially supported by the Health Promotion Fund with administrative support by the Ministry of Health and Welfare. The Health Promotion Fund and the Ministry of Health and Welfare had no role in the design, analysis or writing of this article. Conflict of interest: None. Authorship: H.J.K. contributed to the analysis and interpretation of data and writing the article. K.O. participated in the design of study, acquisition of data, and analysis and interpretation of data. Ethics of human subject participation: The institutional review board of the Korea Centers for Disease Control and Prevention approved all procedures and protocols used in the study (2012-01EXP-01-2C). Written informed consent regarding the survey was obtained from all participants.


