


Information on the sources and intake of salt in the diet is of interest in a number of countries because of the causative link between high Na (from salt) intake and increased blood pressure leading to CVD, gastric cancer, osteoporosis, cataracts, kidney stones and diabetes(Reference Tuomilehto, Jousilahti and Rastenyte1–3). Since blood pressure progressively increases above Na exposures of half the adult adequate intake level, and high blood pressure is a risk factor for heart disease that is highly prevalent(Reference Hay4), salt exposure is a public health concern in New Zealand(Reference Hay4).
Salt accounts for approximately 90 % of Na intake with the remainder of Na sourced from food ingredients such as sodium bicarbonate, monosodium glutamate, sodium phosphate, sodium carbonate and sodium benzoate, although these estimates are now dated(Reference Fregly5, 6). Dietary salt includes the salt that occurs naturally in most foods, that which is added as an ingredient of processed foods, and that added at the time of cooking or at the table. Processed foods are the major source of salt in our diet contributing between 60 and 80 % of Na, and hence, salt intake(7, Reference Mattes and Donnelly8). Therefore information on the major contributors of salt from processed foods is important for informing salt reduction strategies.
Chemically, salt is sodium chloride comprising Na and Cl ions and therefore salt intake could potentially be derived from either Na or Cl concentrations in foods. In practice, Na content has been cited as the basis for estimates of salt intake(2, Reference Brady9, 10) with no reports of Cl intakes found in the literature. In addition, labelling of foods for Na is mandatory in New Zealand and Australia(11), resulting in more information on Na than Cl levels in foods. Therefore the Na concentration of targeted foods was ascertained as the basis for salt content.
Mean daily Na intakes calculated from the 2003–4 New Zealand Total Diet Survey (NZTDS), based on simulated diets and the analysis of 121 widely consumed foods, were two to four times above the adequate intake level for each of the eight age–gender groups considered(Reference Thomson, Vannoort and Haslemore12). This assessment excluded any contribution from salt added at the time of cooking or at the table. Mean Na intakes exceeded the upper intake limits for males aged 25 years and over, young males aged 19–24 years, and 11–14-year-old boys and girls by up to 125 % for the average consumer.
The present study reports consolidated data of Na concentrations in a wider range of New Zealand processed foods than included in the NZTDS, estimates of the distribution and variability of salt intake from consumption of these foods for seven age groups over 5 years of age, based on 24 h diet recall information (n 5771) and trends in the Na content of key foods over the 16-year period 1987–2003.
Materials and methods
Food selection
The selection of fifty-eight processed foods was based on the list of 121 foods included in the 2003–4 NZTDS that represented approximately 70 % of the most commonly consumed foods in New Zealand(3). Excluded from this list were: non-processed foods (milk, egg, beef-mince, lamb/mutton, beef-rump, pork chop, whole peanuts, carrot, silverbeet, lambs liver, water, potatoes, cream, cabbage, tomato, celery, kumara, apple, oysters, mussels and fresh fish), foods that would be inappropriate to salt (coffee, tea, wine and infant foods), foods where the level of discretionary salt was likely to be highly variable (hot potato chips and takeaways) and foods that made a contribution of < 0·05 % to Na intake. The remaining fifty-one foods were augmented to include processed foods that showed high Na levels in the New Zealand Food Composition Database but were not included in the NZTDS: beef pastrami, frozen beef patties, ham and ham steaks, luncheon meat, sauces and smoked meat and fish (FOODfiles 2004(13); J McLauglin, personal communication, September 2005).
Concentration of salt in processed foods
Data of Na concentrations in fifty-eight processed foods were collated from the 2003–4 NZTDS(Reference Thomson, Vannoort and Haslemore12), the New Zealand Food Composition Database(13) and from the analysis of selected New Zealand manufactured food samples where there was no, or limited, Na concentration data.
Food sampling and analysis
Eight samples of each of the following foods were purchased in October and November 2005 from Christchurch supermarkets except where noted otherwise:
processed chicken, including reformed chicken products (‘Loopys®’ nuggets), hotdogs, stuffed chicken products, crumbed chicken and KFC purchased from Christchurch (four) and Auckland (four) outlets;
bacon, comprising four brands, shoulder and middle;
beef pastrami, comprising five brands of pre-packed and delicatessen products;
convenience foods, including frozen processed potato(cheese medallions, shaped potato pieces, hash brown nuggets), crumbed meats, prepared dinners;
sushi purchased from eight different food stalls located in retail malls;
frozen beef patties, comprising eight pre-packed products representing six brands;
ham and ham steaks, comprising five brands of pre-packed and delicatessen products;
luncheon meat, comprising three brands and six products;
pâté, including eight pre-packed brands;
salami, comprising five brands and seven products;
sauces, mayonnaise dressings, pasta sauces, chilli sauces, stir-fry sauces, piccalilli/chow;
smoked meat/fish, including salmon, mussels, beef and pork representing five brands.
Individual units, or a minimum of 250 g of each sample, were purchased. Details of the label claim were recorded as a cross-reference for the analytical determination of Na.
Samples were analysed as purchased, i.e. raw foods were analysed raw. A minimum of 250 g of each product were homogenised in a domestic blender. Duplicate 50 ml portions were frozen at − 18°C until analysis. An aliquot of sample was ashed in a muffle furnace at 500°C, the residue dissolved in concentrated nitric acid Aristar® specific gravity 69%; Merck-BDH, Poole, Dorset, UK), with caesium chloride (Sigma, St Louis, MO, USA) as an ionisation suppressant. Na was determined by atomic emission spectroscopy on a Varian SpectrAA 400 (Varian Australia Pty Ltd, Mulgrave, Victoria, Australia), by the Institute of Environmental Science and Research (ESR) Ltd Christchurch Science Centre food chemistry laboratory that is accredited by International Accreditation New Zealand (IANZ) to the standard NZS/ISO/IEC/17 025, 2.72/5 for this analysis.
Quality assurance of sodium determinations
The following quality assurance procedures were followed to ensure the robustness of the analytical results.
(1) Thirty-two of 168 samples (19 %) were analysed in duplicate, including samples of each food type, to determine variability. The analytical precision and intra-sample variability, expressed as % CV ranged from 0·1 to 10·0 %.
(2) Eleven samples were spiked with Na to correspond to a spike level equivalent to that in the product (i.e. doubling the amount of Na in an extract between the spiked and unspiked samples). Recovery compares the amount of Na measured in the spiked sample corrected for the amount of Na in the unspiked sample, with the amount of Na added in the spike. The recovery of Na from spiked samples ranged from 84 to 102 %, confirming the general accuracy of the analytical method except for the luncheon meat sample. The low recovery for luncheon meat (62 %) is most likely a single poor result. Four duplicate analyses for luncheon meat showed a high degree of reproducibility. A comparison of measured Na levels with the label claim did not show a bias towards a low recovery.
(3) A milk powder certified reference sample (RM155), supplied by AgriQuality (Mt Wellington, Auckland, New Zealand), was analysed with each batch to ensure precision. The analysis of Na in this reference sample ranged from 93 to 130 % of the certified value, also confirming the accuracy of the analytical method.
Assessment of salt intake
Estimates of dietary exposure to salt were made by combining mean Na levels in processed foods with 24 h dietary recall information from the 1997 National Nutrition Survey (NNS)(Reference Russell, Parnell and Wilson14) and the 2002 National Children's Nutrition Survey (CNS)(15) using Microsoft Foxpro (Microsoft Corp., Redmond, WA, USA). Repeat records for a proportion of respondents were used to examine day-to-day variability in individuals' dietary exposure.
Food descriptors from the NNS and CNS were mapped to the processed foods of interest for the present study. For example, all ‘muesli bars’ in the NNS were mapped to ‘snack bars’. Where a food of interest may be only a component of a described item, such as the bread component of a filled roll, an estimate of the proportion of the food of interest was specified. Each food of interest was assigned a mean Na concentration (as in Table 2). The mean Na concentrations were multiplied by the amount of that food consumed by each respondent in the two consumption surveys, and summed over all foods assessed to estimate the dietary exposure to Na from processed foods for each individual surveyed.
The Na intake was converted to a salt intake by adjusting for the difference in molecular weight (58·5/23·0) and to account for non-salt sources of Na (0·9)(Reference Fregly5, Reference Mattes and Donnelly8).
Arithmetic mean, selected percentiles, and minimum and maximum exposures were determined using Microsoft Excel (Microsoft Corp.). The distribution of salt intake for each population group was formatted as lognormal graphs with @risk® software (Palisade Corp., Ithaca, NY, USA).
Age–gender population groups evaluated
The two consumption surveys included respondents aged 5–14 years and aged 15 years and over, allowing for exposure estimates for a variety of age and gender groups. The complete sets of dietary exposure estimates were subdivided to provide information on seven subgroupings, namely: males aged 25 years and over, females aged 25 years and over, young males aged 19–24 years, young females aged 19–24 years, boys aged 11–14 years, girls aged 11–14 years and children aged 5–6 years.
Risk characterisation
The adequacy and toxicity of salt intakes were assessed by comparison with Australian and New Zealand reference health standards for Na adopted in 2006(16).
Food contributions
The contribution of a particular food to Na intake was calculated by summing the contributions to Na exposure from each food, across all consumers in a particular age–gender group, and dividing by the sum of all Na exposures for that group. The resulting proportion was converted to a percentage by multiplying by 100.
Trends in sodium content of processed foods
Trends in the Na content of major contributing foods identified from the present study were collated from the three NZTDS where Na was analysed (1987–8(17), 1990–1(Reference Hannah, Vannoort and Pickston18) and 2003–4(Reference Thomson, Vannoort and Haslemore12)). Consistent methodologies in terms of sample purchase and preparation provided the best possible data for comparison of concentration change with time.
Results
The mean, minimum and maximum levels of Na in fifty-eight processed foods are shown in Table 1. Seven of the food types had Na concentrations varying by a factor of ten or more, with the greatest range in Na levels seen across the muesli samples. The saltiest food was yeast extract followed by the processed meats (salami, bacon, ham, smoked fish/meat) and flavoured snacks.
Consolidated data of sodium in New Zealand processed foods

* Results from the present study.
† Data from the 2003–4 New Zealand Total Diet Survey(Reference Thomson, Vannoort and Haslemore12).
‡ Data from FOODfiles 2004(13).
Estimates of salt exposure from the consumption of these fifty-eight processed foods, for the seven age–gender groups, are shown in Table 2. Selected percentile consumers, including mean, median, maximum and minimum consumers are presented to illustrate the variability of salt intake. The 5th percentile values were the intake for the lowest 5 % of the population and thus represent very low salt intakes but exclude the extreme values of the minimum consumers. Conversely, the 95th percentile was the intake for the top 95 % of the population, indicative of very high intakes, but excluding the extreme values of the maximum consumers. The zero minimum intake of salt reflects that there were some individuals within each age group who did not consume any of the fifty-eight foods in the 24 h period of the consumption survey. Median salt intakes ranged from 3·1 to 5·5 g/d and maximum salt intakes ranged from 21·5 g/d for a 5–6-year-old child to 51·7 g/d for an adult male aged over 25 years old.
Dietary intake estimates of salt (g/d) from fifty-eight processed foods for seven subpopulations and adequate intakes(AI) and upper limits (UL)
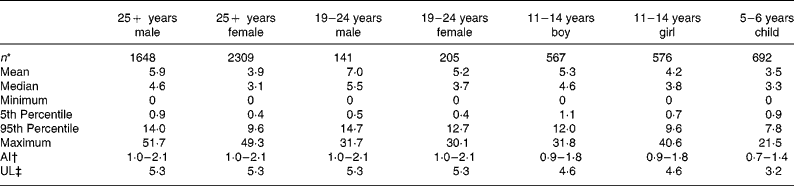
The range of salt intake between the lowest and highest consumers of processed foods (5th and 95th percentiles) varied by a factor of 9 to 32 with the smallest range of intake seen for the younger children, aged 5–6 years, and the widest range observed for the 19–24-year-old females.
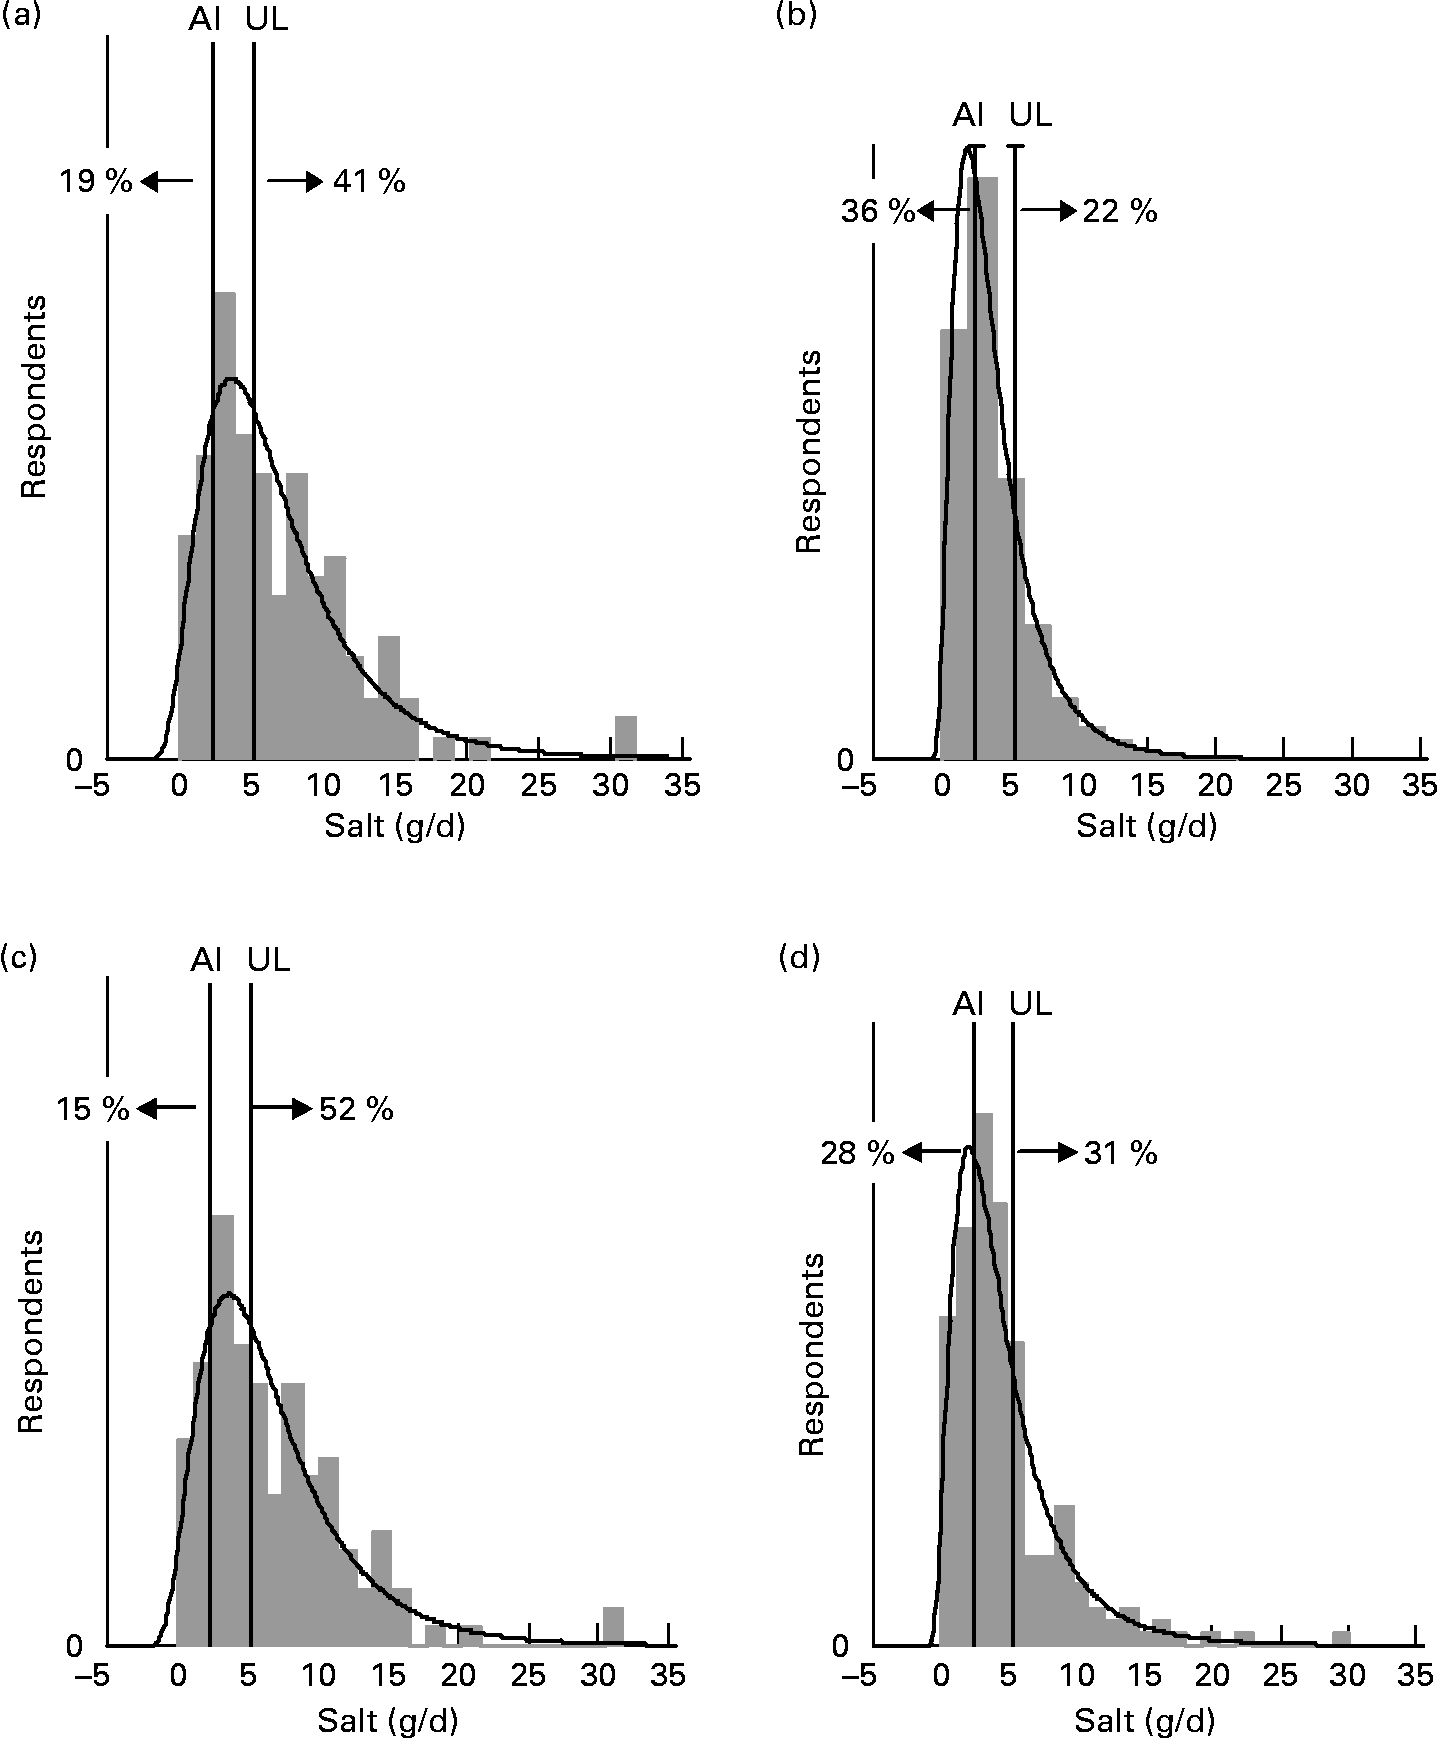
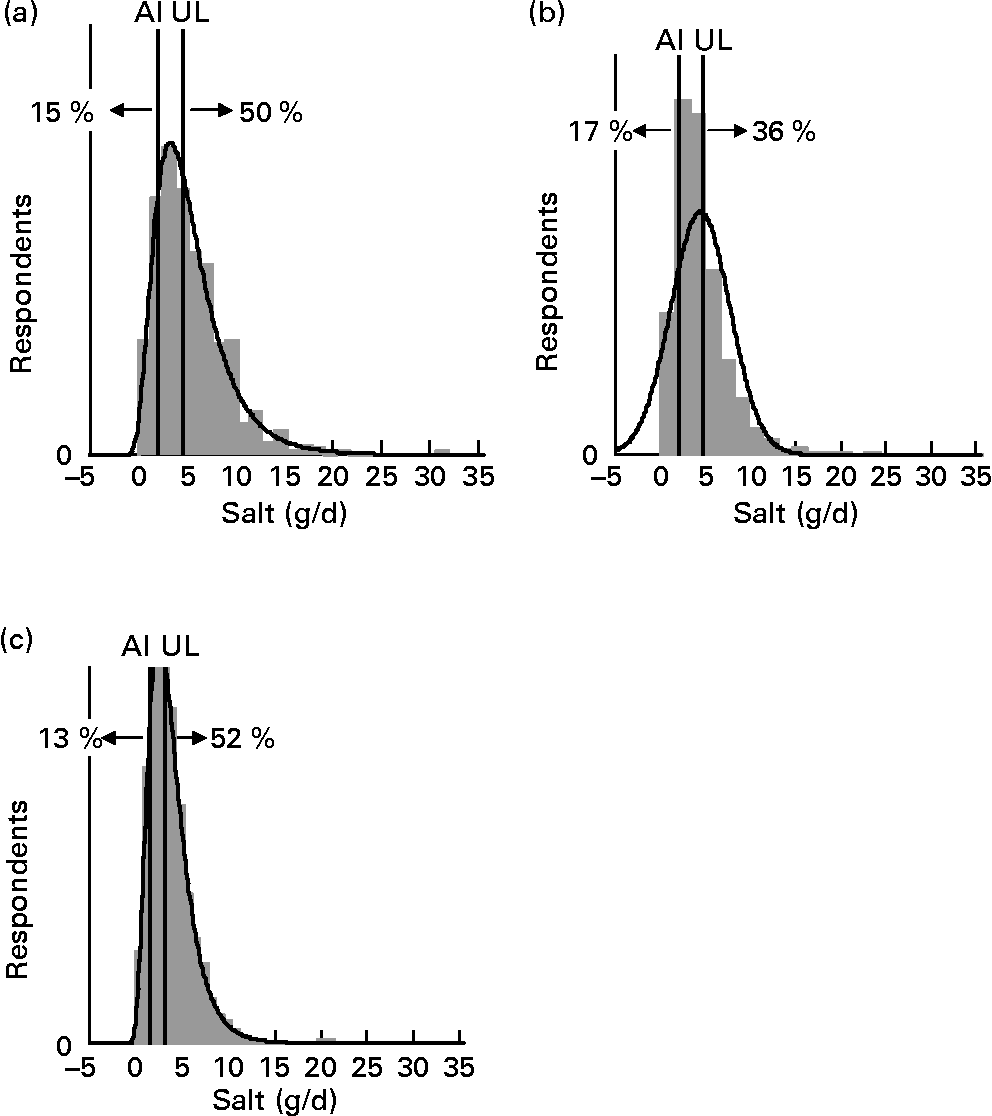
For each age–gender group, the median was less than the mean, indicative of right-skewed distributions of intake, illustrated for each subpopulation in Figs. 1 and 2. Also shown are the proportions of each age–gender group that had intakes below the adequate intake level and above the upper limit for Na, from processed foods alone. Between 22 and 52 % of each group had salt intakes that exceeded the upper limit for Na excluding any contribution from discretionary or naturally occurring salt including ≥ 50 % of 5–6-year-old children, 11–14-year-old boys and 19–24-year-old young males.
Distribution of salt intake from processed foods (g/d) for males 25+ years (a), females 25+ years (b), young males 19–24 years (c) and young females 19–24 years (d) showing the proportions of the population groups below and above adequate (adequate intake; AI) and upper (upper limit; UL) Na reference intake values.
Distribution of salt intake from processed foods (g/d) for boys 11–14 years (a), girls 11–14 years (b) and children 5–6 years (c) showing the proportions of the population groups below and above adequate (adequate intake; AI) and upper (upper level; UL) Na reference intake values.
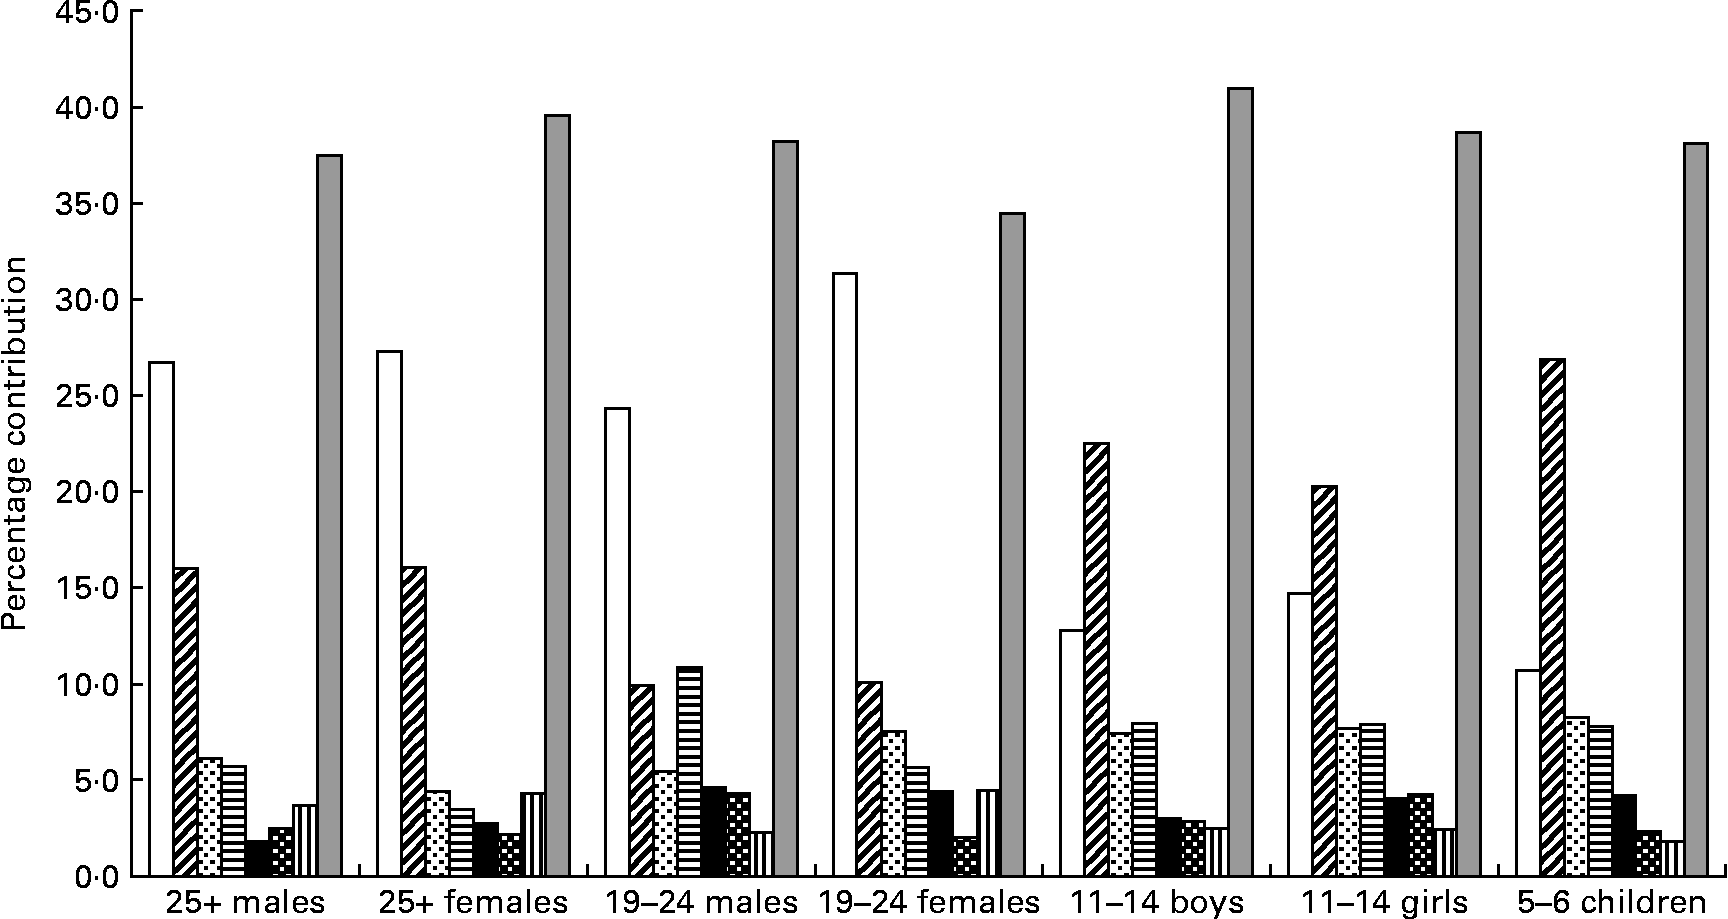
Salt was spread across a wide range of foods. For each of the age–gender groups, bread, white and wheatmeal combined, clearly made the greatest contribution accounting for 35–43 % of salt intake. Other foods that contributed 2 % or more to salt intake and were common across the age groups were sausage, meat pies, pizza, instant noodles (except for the males aged 25 years or over) and cheese (except for the 5–6-year-old children) (Fig. 3). Biscuits, potato crisps and tomato sauce were salt-contributing foods common for young people (aged 5–11 years).
Foods contributing more than 2 % of salt intake from fifty-eight processed foods that were common across the seven population groups. (□), White bread; ( ), wheatbread; (
 ), sausage; (
 ), meat pie; (■), instant noodles; (
 ), pizza; (
 ), cheese; (
 ), other.
Processed foods that contributed more than 2 % of the salt intake and were specific to particular age–gender groups were:
(1) 25+-year-old males: bacon (2·9 %), margarine (2·6 %), corned beef (2·5 %), ham (2·3 %) and butter (2·1 %).
(2) 25+-year-old females: cake (2·6 %), margarine (2·6 %), muffin (2·5 %), bacon (2·4 %), soup (2·1 %), butter (2·1 %), corned beef (2·0 %) and yeast extract (2 %).
(3) Young males: hamburgers (6·2 %), tomato sauce (3·2 %) and pasta sauce (2·4 %).
(4) Young females: bacon (2·2 %), tomato sauce (2·2 %), corned beef (2·1 %), soup (2·0 %), margarine (2·0 %) and flavoured snacks (2·0 %).
(5) 11–14-year-old boys: ham (4·0 %), biscuits (2·6 %), tomato sauce (2·5 %), flavoured snacks (2·5 %), corned beef (2·4 %) and potato crisps (2·0 %).
(6) 11–14-year-old girls: flavoured snacks (3·4 %), biscuits (3·0 %), ham (2·7 %), potato crisps (2·4 %), corned beef (2·4 %) and tomato sauce (2·3 %).
(7) 5–6-year-old children: plain biscuits (3·1 %), flavoured snacks (3·1 %), ham (2·7 %), canned spaghetti (2·6 %), potato chips (2·0 %) and tomato sauce (2·0 %).
The mean concentrations of Na in those foods making the greatest contribution to salt intake from processed foods, across the time period of 1987 to 2003, are shown in Table 3. With the exception of corned beef and whole milk that have decreased by 34 and 50 % respectively, there has been little change in Na concentration of these foods over the 16-year period.
Mean sodium concentration (mg/kg) of targeted processed foods as reported in successive New Zealand Total Diet Surveys, Australian and United States Department of Agriculture food composition tables

NA, not available.
* Data from R Wills, University of Newcastle, Australia, personal communication, 2007.
† Data from K Egan, US Food and Drug Administration Total Diet Study, personal communication, 2005.
Discussion
Whilst analysis of 24 h urinary samples is considered the most accurate method of assessing Na(Reference Tuomilehto, Jousilahti and Rastenyte1, 3, Reference He, Marrero and MacGregor19, Reference Reinivuo, Valsta and Laatikainen20), and hence salt intake, such studies are difficult to undertake for large populations and do not provide information on the relative contributions of different foods to salt intake; thus the need for dietary surveys. Calculating Na intake from dietary recalls and diaries has been validated against 24 h urinary analysis and is considered a valid approach, provided that food concentration data are of good quality(Reference Reinivuo, Valsta and Laatikainen20). Dietary surveys do, however, have the limitation of not being able to accurately assess the contribution from salt used in cooking and at the table. In addition, neither 24 h urinary samples nor 24 h diet recall surveys allow for day-to-day variations in salt intake(Reference Egan, Tao and Pennington21, Reference Dyer, Elliott and Chee22). Such variability is more accurately covered by 7 d or 3 d dietary records, but these are not available for New Zealand consumers. The day-to-day variability was recognised, and assessed, by calculating salt intakes from the 15–20 % of individuals who completed a second questionnaire for a subsequent 24 h period. A comparison between the main and repeat data for the NNS and CNS showed agreement within 15 % at the 95th percentile of consumers for each age–gender group, apart from the 5–6-year-olds (21 % difference between the datasets), and were therefore considered fair assessments of habitual intake for these age–gender groups. The estimates of the 5–6-year-olds would tend to less accurately reflect habitual exposure than for the older consumers because of the slightly poorer agreement between estimates based on main and repeat data.
A further limitation of the methodology relates to the targeted processed foods. Not all salt-containing processed foods were included in the assessment. Whilst every effort was made to include the likely major contributors, it was not practical to include the complete array of foods that is available and therefore intakes will be underestimated for some consumers. The fifty-eight foods included in the study were mapped to a wider range of foods described in the NNS/CNS requiring assumptions that mapped foods have similar Na concentrations to the analysed foods. There is a measure of uncertainty around these assumptions.
Salt intake from processed food increased with age and was higher for males than females, consistent with Na intakes from the NZTDS(Reference Thomson, Vannoort and Haslemore12) and international studies(Reference He, Marrero and MacGregor19–Reference Egan, Tao and Pennington21). The estimation that over 50 % of young children aged 5–6 years exceeded the upper intake limits for Na, based on processed foods only, is clearly an area for concern and a target area for risk communicators, parents and the food industry. Whilst the evidence for a causal relationship between salt (sodium chloride) and blood pressure in adults is internationally accepted(3) it is less clear for children. He & MacGregor reported small increases in blood pressure with increases in salt intake from a meta-analysis of salt reduction trials(Reference He and MacGregor23) and a large cross-sectional study of British children and adolescents aged between 4 and 18 years(Reference He, Marrero and MacGregor19). In addition to any elevated blood pressure in early life being tracked into adulthood(Reference He, Marrero and MacGregor19), these children will plausibly be developing a preference for a salty diet that will potentially predispose them to high blood pressure as adults since they will probably continue to eat salty foods.
The intake distribution curves (Figs. 1 and 2) show that a proportion of each age–gender group consumed less salt than recommended, with 36 % of female adults over 25 years of age being in this category. It is hoped that these people use some salt in cooking or at the table, otherwise they are at risk of an insufficient intake. In the drive to reduce salt intake(3), public health messages need to be clear that some salt is necessary for good health.
Clearly, a significant proportion of the New Zealand population consumes excessive amounts of salt from processed foods. For salt reduction strategies, bread is a logical target with evidence that the salt level in bread may be reduced by up to 25 % without a noticeable difference in taste(Reference Girgis, Neal and Prescott24). Also of note is that breads at the lower end of the price range contain more Na than more expensive products(Reference Monro, Young and Wilson25), disadvantaging the cost-conscious consumer. A partnership between the New Zealand Heart Foundation and the two major bread manufacturers is currently underway to reduce the content of Na in low-cost high-volume bread to 4500 mg/kg. This initiative is predicted to remove up to 150 tonnes salt/year from the bread supply(26).
Unlike Finland where Na intake has decreased by about 15 % in men and about 17 % in women between 1992 and 2002, Na (and hence salt) intake in New Zealand has been relatively constant over the 16-year period from 1987 to 2003(Reference Thomson, Vannoort and Haslemore12). Since intake is the product of concentration and consumption, it is of interest to track the concentration of salt in processed foods over time. One of the strengths of the NZTDS studies is the consistency of methodologies applied, especially in the selection of samples for analysis and the rigour of the chemical analyses. Each NZTDS reflects those brands most commonly consumed at the time of the study. Given the international recommendation to reduce average adult salt consumption to < 5 g/d(3), there is a surprising lack of readily available longitudinal data on the concentration of salt (or Na) in foods that are the major contributors to salt intake. The consistency of Na concentrations in New Zealand bacon, ham and cheddar cheese is also observed in data from Australia (R Wills, University of Newcastle, Australia, personal communication, 2007; Food Standards Australia New Zealand(27)) and the USA (Pennington et al. (Reference Pennington, Schoen and Salmon28); United States Department of Agriculture(29); K Egan, US Food and Drug Administration Total Diet Study, personal communication, 2005). The mean concentration of Na in New Zealand bread appears to have dropped between 1990–1 and 2003–4, mirrored by smaller decreases in Australia, but not in the USA. The decrease in New Zealand milk is also observed in data from Australia, but not for the USA. With the international interest in reducing salt intakes and the proliferation of low-sale variants of many foods, it is perhaps surprising that there has not been a more apparent drop in mean concentration values of key foods.
Messages promoting the consumption of less processed food and reduced levels of salt in processed foods, particularly bread, are identified strategies towards reducing the risk of heart disease. However, a reduction in the amount of salt in bread will have implications on iodine intake. In contrast to high salt intakes, most New Zealanders have iodine intakes well below those recommended for optimal health(Reference Thomson, Vannoort and Haslemore12). In order to redress the mild to moderate iodine deficiency in New Zealand(Reference Thomson30), the food regulatory authority (Food Standards Australia and New Zealand (FSANZ)) has mandated the use of iodised salt in the manufacture of bread, from October 2009(31). The level of fortification of iodine in salt may require re-evaluation if the level of salt in bread drops. The need for a careful balance between Na and iodine intakes will require ongoing monitoring to ensure that risk management strategies, for factors such as mental development, are working.
The implication of the range and uneven distribution of salt intakes presented in the present study is that in the event of iodised salt being voluntarily or mandatorily used in the manufacture of processed foods, the intake of iodine will potentially vary by factors of up to 9–32 for different population groups, and the distribution of iodine intake will be influenced by the intake distribution observed for salt intakes.
The potential conflict between the two major health goals of reducing average population salt intake and eliminating iodine deficiency is recognised internationally. Despite this potential conflict, the iodisation of salt was recently reaffirmed as an appropriate strategy to control iodine deficiency(32).
Acknowledgements
Thanks to Janet Goodman, Senior Food Advisor, Food Standards Group, New Zealand Food Safety Authority for contributions to planning, reporting and review. Thanks also to Shirley Jones and Darren Saunders at Institute of Environmental Science and Research (ESR) Ltd, for undertaking the analytical work and to Peter Cressey, ESR, for assistance with the intake estimations.
The present study was undertaken by ESR, as part of their contractual agreement with the New Zealand Food Safety Authority.
The author declares no conflict of interest.



