

Reliable and harmonised food consumption data are an essential element for exposure assessment. Especially, data on food consumption among children are of interest because children are at higher risk due to relatively higher levels of exposure. Until now, national dietary surveys have provided food consumption data for the risk assessment tasks of the European Food Safety Authority (EFSA). However, the existing data were collected with different dietary assessment methodologies, and there is a lack of data from some countries and some population groups, e.g. children and infants. Therefore, the EFSA is planning to organise a first pan-European food consumption survey, EU Menu, in collaboration with Member States during the next 10 years.
The EFCOSUM (European food consumption survey method) and the EFCOVAL (European Food Consumption Validation) projects(Reference Biró, Hulshof and Ovesen1–Reference Trolle, Amiano and Ege4) have provided recommendations on the design and overall methodology of surveys for adults and children, respectively. Several methodological challenges have to be addressed still within the work of implementing a harmonised data collection process across European countries. One important issue is how to ensure the best estimation of the amount of foods consumed. The weighed record method is considered too burdensome for large-scale national surveys where a representative sample and a high response rate are important. A combination of various tools has been used instead. For example, sixteen of twenty adult national dietary surveys included in the EFSA comprehensive food consumption database have reported the use of a picture book besides the use of household measures and standard units(5). As recommended by the EFCOVAL project, these tools need to be country- and age-specific and have to be developed based on knowledge about foods on the national market and food preferences of children and on using weighed records identifying ranges of portion sizes for different foods and recipes(Reference Trolle, Amiano and Ege4). Some studies have shown that providing children with food photographs depicting age-specific portion sizes substantially improved the accuracy of portion size estimates(Reference Foster, Matthews and Nelson6, Reference Foster, Adamson and Anderson7).
The PANCAKE (Pilot study for the Assessment of Nutrient intake and food Consumption Among Kids in Europe) project aimed to develop, test and evaluate protocols and tools for a pan-European food consumption survey for infants, toddlers and children aged 0–10 years. One objective of the PANCAKE project was to develop a picture book for these age groups, aiming to ensure the best possible estimates of portion sizes. Another objective was to provide the participants within the PANCAKE pilot studies (parents of children or other proxies) with a visual quantification tool (in addition to g/ml, household measures, standard portions and standard units) for use with the developed food diaries. Several factors may influence the apparent size of a food in a picture: the size and colour of the surroundings such as the size of the food relative to the plate and relative to the picture size; the position of the food on the plate; and the actual weight, volume and characteristics of the food, such as shape, colour and firmness(Reference Nelson and Haraldsdótttir8, Reference Nelson and Haraldsdóttir9). The aim of the present study was to validate the perception of the portion sizes of the foods in the picture series among parents of children aged from 3 months to 10 years in three culturally diverse countries in Europe.
Methods
The picture book
The PANCAKE picture book included picture series for foods commonly eaten in the countries of the PANCAKE consortium, derived from population-based data, foods that cannot be estimated well using household measures or units and that differ considerably from other foods in shape or size(Reference Nelson and Haraldsdótttir8). In order to guarantee the practical use of the PANCAKE picture book for the participants, the number of picture series was limited to thirty-eight common food picture series, including three series of baby foods; six series of butter and ‘fillings/spreads’ on bread; eight series of breakfast cereals, rice, pasta and potatoes; nine series of meat and fish; eight series of vegetables and four series of cakes and pies (Table 1). Each country could then add country-specific picture series, if needed.
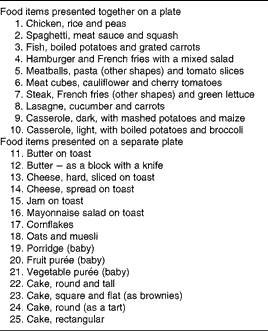
Food items from the PANCAKE (Pilot study for the Assessment of Nutrient intake and food Consumption Among Kids in Europe) picture book served and presented during the validation sessions
The aim was to develop common age-appropriate picture series to be shared by the countries in the pilot study. However, only one picture book was developed to cover the portion sizes for children within the whole age range of 0–10 years, because it would reduce the risk of interviewer bias and because it was possible to cover the range of portion sizes for this age group with six pictures within a series. The 5th and 95th percentiles of Danish weighed portion sizes of foods consumed by children in the relevant age range were used for defining the range from the smallest to the largest portion of each series. Weighed data were not available for Belgium and the Czech Republic. Foster et al. (Reference Foster, Matthews and Lloyd10) used the equal increments on a log scale with reference to Weber's law, which is based on perceptual research – the just notable difference gets bigger, usually in proportion to the stimulus magnitude (when the portion sizes get bigger). However, pre-trials to the present study indicated that the log scale might be in favour when the picture series should cover a wide range and the smallest portion size was above a certain size since it would ensure the visibility of the differences between the largest portions. The equidistant approach seemed to be more suitable for ensuring the visibility of the differences between the smallest portions for foods with a narrower range to cover, starting with a small portion. For approximately half of the common picture series, the portion sizes were distributed according to the equidistant approach (Table 4, equidistant (e) and almost equidistant (varying distance) (e_irreg)), while a mix between a log scale and the equidistant approach was used for the other half, using smaller increments between the smallest portion sizes than between the largest portion sizes (Table 4, increasing distance (i) and mixed (m)).
The photos were taken by a professional photographer in a special photo set-up to ensure the right technical parameters of pictures (e.g. resolution, lighting, contrast and colour balance, besides, for example, photo angles). The tableware was neutral, white, and of a commonly used size. These technical specifications have been described in detail elsewhere (PANCAKE web-library www.kostvaner.dk/pancake), based on the previous work with photo series in Denmark(Reference Nielsen, Biltoft-Jensen and Ygil11, Reference Nielsen, Biltoft-Jensen and Christensen12).
The country-specific bread shapes and pictures of glasses, cups and bowls were not validated in the present study.
Validation study
Subjects were selected using convenience sampling of parents having children aged from 3 months to 10 years. Participants were preferably those who were responsible for the child's food preparation. The aims were to include 108 parents from each country with a minimum of 25 % among each age group, infants (3–11 months), toddlers (1–3 years) and children (4–10 years), and to cover different parental educational levels. In Denmark, parents were recruited at three worksites. In Belgium, parents were recruited via the National Register, via letters distributed to the parents of children and infants in the surrounding schools and day-care centres, and via posters and leaflets distributed in the canteen of a university, a scientific institute, a train station and supermarkets. In the Czech Republic, parents were recruited via leaflets distributed in blocks of flats, supermarkets, schools and kindergartens in Brno city. The potential participants were invited by an explanatory letter. Incentives in Denmark were two cinema tickets of the participant's own choice, in Belgium a voucher of €20 was offered, and participants in the Czech Republic were given 500 CZK (€20). The validation sessions took place in the canteen of worksites or research institutes. The present study was conducted according to the guidelines laid down in the Declaration of Helsinki, and all procedures involving human subjects were approved by the ethical committee of the University of Ghent, Belgium. Verbal informed consent was obtained from all subjects. Verbal consent was witnessed and formally recorded.
To ensure comparable data collection in the three countries, common materials were prepared, such as registration forms and files, coding system and labels, templates for data and instructions for the research staff.
The basic design was that the thirty-eight picture series were evaluated using forty-five foods. Of these, thirty-eight foods were similar to the depicted foods, whereas the seven additional foods – squash, root vegetables, pasta (in other shapes), cauliflower, fried potatoes, mixed salad and maize – were used to validate the picture series for cucumber, potatoes (boiled), spaghetti, broccoli, potatoes (boiled), green salad and peas, respectively. For every food, each of the six pictures in a series was evaluated six times in each country, by serving predefined portion sizes: two portions smaller, two portions equal and two portions larger than the depicted portion: i.e. ± 1/3 of the amount between the picture and the adjacent picture. In total, 45 × 6 × 6 = 1620 pre-weighed servings were evaluated in each country.
In each country, 108 participants evaluated one serving size of fifteen foods each, meaning that in total 108 × 15 = 1620 evaluations were carried out. The serving sizes were randomly allocated between the participants. For practical reasons, the validation sessions were planned on three different days covering fifteen foods per d, with all eighteen serving sizes per food being evaluated at two almost identical sessions with eighteen participants each time, by thirty-six participants per food item.
The research staff dished up all the food items by weighing and coding all the predefined portion sizes. Two picture series differed from this procedure: poultry and tomatoes (whole), for which it was not possible to get exactly predefined portion sizes. Each of the six pieces of chicken shown in the picture series was served three times, the pieces were weighed while dishing up and the actual weight of the portions was noted. These eighteen portions were used in two sessions, implying that in all thirty-six evaluations were conducted. The same procedure was performed for eighteen whole tomatoes of different sizes within the range of 7 and 205 g.
For some food items, such as mixed salads and cakes, densities can vary substantially. However, for the appearance of the portion size, both the volume of the food and the weight of the food are important. Therefore, food volume measurements of all food items were performed in all three countries by a water displacement method described elsewhere (PANCAKE web-library www.kostvaner.dk/pancake). Densities of the food items were calculated from the weight in grams and the volume in millilitres. In addition, a photograph of all portion sizes was taken in all three countries.
The validation sessions started with a short introduction and instruction, which was given individually in Belgium, while in the Czech Republic and Denmark, it was given collectively to the participants. The participants were assigned a table where the plates with the weighed and coded food portions were placed together with the picture book. They evaluated the portion sizes of the different food items in a predefined random order. After evaluating the fifteen portions, each participant completed a short questionnaire about the difficulties encountered while using the picture series, relevance of the pictures, presentation of the pictures and the perception of the range of the pictures in the picture book (data not shown).
Statistical analyses
The pictures of each series were given numbers from 1 (smallest amount) to 6 (largest amount). For each food item, the agreement between the picture chosen by the participant and the picture depicting the correct portion size was assessed, and the percentages of participants choosing the correct picture, the picture adjacent to the correct picture or a distant picture were calculated, as in other studies(Reference Nelson and Haraldsdóttir9, Reference Lillegaard, Øverby and Andersen13).
In addition, the mean and standard deviation of difference between the portion number of the picture chosen by the participants and the portion number of the correct picture for each series were calculated. A sd of 1 was used as the limit of variance since estimations with a random error of ± 1 picture are considered as acceptable. For example, a sd equal to 1 is obtained if all estimates are +1 or − 1, or when not more than 25 % of the estimates are +2 or − 2 and 75 % are correctly estimated (values = 0), or when not more than 11 % are +3 or − 3 and the remaining estimates are 0. The 99·997 % CI of the estimation error based on a normal distribution was used as the limit for bias of the mean. The high percentages of the CI were chosen because they give a broader range of acceptance where the mean value is considered not significantly different from 0 than a lower CI. For data obtained from all countries (n approximately 108 and sd= 1), the limit for bias of the mean is approximately 0·4, and for the individual countries separately (n approximately 36 and sd= 1), the limit for bias of the mean is approximately 0·7, based on the 99·997 % CI of the estimation error. Differences between the countries were tested by the Kruskal–Wallis rank sum test. Spearman's correlation coefficients between the chosen picture number and the correct picture number were calculated for data obtained from all countries together and for those obtained from the individual countries separately. Data were re-analysed after adjustment for density by dividing the actual weight by its density.
The agreement between the chosen picture number and the correct picture number of the individual pictures of the series was shown in mosaic plots, which presented how well the individual pictures within a series performed. Estimation of the extent of overall over- and underestimation of the series and of the individual pictures within the series was done for all the evaluations separately by the estimated differences in grams and in gram percentage (estimated weight – served weight in grams – and as percentages of the served weight). Spearman's correlation coefficients between the weight of the chosen portion in grams and that of the served portion were calculated. Statistical calculations were carried out using the software package JMP 8.0 (SAS Institute, Inc.).
Results
The characteristics of the participants are listed out in Table 2. Parents of infants were under-represented in the present study, especially in Belgium and Denmark. Furthermore, higher educated women were over-represented.
Characteristics of the participating parents in the validation study (Number of subjects and percentages)
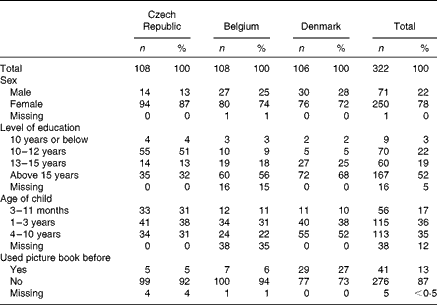
Table 3 summarises for all food items the performance of the corresponding picture series, with and without adjustment for density differences, respectively. With regard to performance, the series were divided into four categories based on the mean and sd of difference between the portion number of the picture chosen by the participants and the portion number of the correct picture: series that were rated as ‘acceptable’ (mean ≤ |0·4| and sd< 1·1); series that were ‘acceptable after density adjustment’ (mean >|0·4| or sd>1·1 before density adjustment and mean ≤ |0·4| and sd< 1·1 after density adjustment); series that were misestimated even after density adjustment (overestimated: mean >0·4 and sd< 1·1; underestimated: mean < − 0·4 and sd< 1·1); series that did not give precise results (sd>1·1).
Percentages of participants choosing the correct, adjacent or distant picture when comparing food items on plates with pictures within the PANCAKE (Pilot study for the Assessment of Nutrient intake and food Consumption Among Kids in Europe) picture book; Spearman's coefficients of correlation between the estimated picture number and the actual portion number; mean and standard deviation (sd) of the difference between the estimated picture number minus the actual portion number; established series category based on the mean and standard deviation; and Kruskal–Wallis test of significance of difference between the countries†

* P< 0·05, ** P< 0·01, *** P< 0·001.
† Values obtained after density adjustment are indicated in parentheses.
Picture series that performed well
Among the twenty ‘acceptable without adjustment’ series, the percentage of participants who selected the correct picture was between 39 and 71 %, the percentage of participants who selected a distant picture varied between 1 and 16 %, and Spearman's correlation coefficients between the chosen picture number and the correct picture number were between 0·73 and 0·92. Significant differences with regard to the mean differences between the estimated portion number and the correct portion number were found between the countries for some of these series, but all means at the country level were within the acceptable range (mean < 0·7 and sd approximately 1), except the Danish mean values for mayonnaise filling and fried potatoes, which were − 0·91 and 0·8, respectively, and the Belgian mean value for butter on toast, which was 1·09 (data at the country level not shown).
There were twelve series rated as ‘acceptable after density adjustment’ (Table 3). After adjustment for density, the percentage of participants who selected the correct picture in these series was between 37 and 67 %, the percentage of participants who selected a distant picture was between 4 and 16 %, and Spearman's correlation coefficients between the chosen picture number and the correct picture number were between 0·76 and 0·90. Of the twelve series, eight performed significantly differently in the three countries, but all means and SD were within the acceptable range, except three sd values exceeding 1·1 (Belgian meat cubes and oats/muesli and Czech fish) (country-specific data not shown).
Problematic picture series
Even after density adjustment, picture series for six food items still seemed to either underestimate portion size (overall mean < − 0·45) – pasta (penne or fusilli), French fries and carrots (grated) – or overestimate portion size (overall mean >0·45) – lasagne, tart and cake (square and flat) (data not shown). The underestimation was reflected in the higher percentage of participants selecting a picture smaller than the correct one (between 39 and 58 %) and the lower percentage selecting the correct picture (only 40 to 54 %) (Table 3). However, data at the country level were within the acceptable range for these series (mean > − 0·7 and sd≤ 1). Spearman's correlation coefficients between the chosen picture number and the correct picture number were 0·91–0·95, 0·84–0·85 and 0·89–0·94 for pasta (penne or fusilli), French fries and carrots, grated, respectively. The overall results for lasagne, tart and cake (square and flat) were borderline to overestimation (mean = 0·5, 0·6 and 0·6, respectively) and to ‘not precise’ (sd= 1·1, 1·0 and 1·1). Data obtained from the individual countries show that only in the Czech evaluation, the picture series of lasagne and cake seemed to perform well. The picture series of ‘tart’ seemed to perform well in Belgium, but not in the Czech Republic and Denmark.
Five series gave overall problematic results and were identified as ‘not precise’ since sd>1·1: salad (lettuce), salad (mixed), vegetable purée, porridge and cake (rectangular pieces). For these series, only between 26 and 35 % of the participants selected the correct picture and 25 and 47 % selected a distant picture. Spearman's correlation coefficients between the chosen picture number and the correct picture number were between 0·62 and 0·78. After density adjustment, data obtained from the individual countries showed that only in the Danish evaluation the picture series of salad (lettuce), porridge and cake (rectangular pieces) performed well, and Spearman's correlation coefficients of these Danish data were between 0·78 and 0·89 (country-specific data not shown).
Difficulties with individual pictures within the series
Table 4 indicates that portion/picture number 6 was most often difficult to detect for the participants (defined as 17 % or more of the participants having chosen a distant picture, which is comparable to the overall results of the acceptable series where less than 16 % of the participants selected a distant picture), while for portion/picture number 1, a distant picture was chosen only in very few cases. From these observations, it can be derived that within the acceptable series, picture numbers 3 and 4 performed best and more pictures in the series categorised as ‘overestimating’ or ‘not precise’ were problematic, compared with the acceptable series. Table 4 also summarises the performance with regard to over- and underestimation by the calculation of the mean difference in grams between the estimated portion and the served portion and the difference in percentages of the served weight. These values varied a lot for the individual pictures (data not shown). Expressed in absolute amounts, the largest differences were found for the largest portion sizes, while the largest differences expressed as percentages were observed for the smallest portion sizes. The problematic series had at least one picture in the series where between 44 and 94 % had chosen a distant picture, while for the acceptable series, it varied between 6 and 67 % (data not shown).
Overview of the performance of the individual pictures of the series: pictures with >16 % distant choices, differences between the estimated portion weight and the actual portion weight (g) and differences in grams related to the actual portion size (g %), and Spearman's correlation coefficients between the estimated weight and the actual weight

i, increasing distance; m, mixed (increasing between the smallest portions or between the smallest and medium portions, or differently for the smallest portions compared with the largest portions); e, equidistant; e_irreg, almost equidistant (varying distance).
* Chicken values are not shown per estimated portion number, since we assumed that the participants were able to detect which part of the chicken they had on the plate in front of them.
† The series of tomatoes and chicken were constructed differently from the others. Whole tomatoes of increasing sizes were depicted. Different parts of the chicken were depicted (1 = 145 g, 2 = 20 g, 3 = 40 g, 4 = 205 g, 5 = 70 g and 6 = 130 g).
Alternative constructed series: tomatoes (whole) and chicken
The series of whole tomatoes and chicken were constructed differently from the others. Whole tomatoes of six increasing sizes were depicted. Different parts of the chicken were depicted. For these series, estimation errors of the mean difference in grams between the estimated portion and the served portion and the difference in percentages of the served weight were only measured, showing a general overestimation of chicken, mean difference in g% = 46, and especially of the largest portion sizes, and overestimation of the smallest tomatoes and underestimation of the largest tomatoes. Spearman's correlations coefficients based on the estimated weight compared with the actual weight were 0·75 and 0·83 for tomatoes (whole) and chicken, respectively (Table 4).
Discussion
The results obtained for all the three countries showed that thirty-two of the forty-five food items could be estimated well using the thirty-eight food picture series, however, twelve of these foods only after adjustment for density differences. This indicated that density differences between the same foods in the three countries influenced the results, but that it was possible to distinguish between the portion sizes of each picture within a series. Between 37 and 71 % of the participants chose the correct picture, with a mean of 50 % including all ‘acceptable’ and ‘acceptable after density adjustment’ series. Between 1 and 16 % of the participants chose a distant picture. Lillegaard et al. (Reference Lillegaard, Øverby and Andersen13) found that 60 % (number of estimates = 2019) selected the correct picture in a similar study with predefined portions in the series with four pictures (children and adolescents aged 9–19 years). In another study serving predefined portions among adults, 50 % chose the correct picture using series with five pictures each(Reference Ovaskainen, Pautri and Reinivuo14). A study with pre-weighed portions among adolescents (series with nine pictures) found that only 28 % selected the correct picture and 74 % the correct or an adjacent photograph(Reference Vereecken, Dohogne and Covents15), while in an earlier study(Reference Lucas, Niravong and Villeminot16), 49 % selected the correct picture and 70 % the correct or adjacent picture; in both the studies, the participants were allowed to choose among seven portion sizes, three depicted and four virtual representing portions between the pictures and below the smallest picture and above the largest picture. Compared with these results, most of the picture series of the present study performed well.
Three food items (French fries, penne or fusilli and carrots, grated) seem to be underestimated by the picture series having a mean bias < − 0·4. However, since the mean and sd for the individual countries without adjustments were within the acceptable limits, these series were acceptable. The picture series of lasagne actually performed well in the Czech Republic but not in Belgium and Denmark, where they overestimated. Examination of the photos taken during the sessions showed that lasagne was distinctly overcooked in Belgium and Denmark (dark brown and dry), and exclusion of these results led to the conclusion that the series was acceptable, but a new validation session is suggested to confirm this.
With regard to cake, square and flat, examination of the photos and densities indicated that the cake from Czech Republic, which also performed well, was more similar to the cake depicted in the picture series regarding height and heaviness than the others. Correspondingly, similar results were obtained for the tart used in Belgium and the rectangular cake in Denmark. Therefore, it seems crucial that the cake used for the pictures is similar to the cake being estimated. Adding an object of a known size to the picture might also make it easier for the user to realise the size of the depicted cake.
It was remarkable that the series of porridge and vegetable purée were rated as ‘not precise’, whereas the fruit purée series was rated acceptable. These series were very similar, depicting the same portion sizes and using the same plate. Examination of the photos of the food items from the fieldwork showed that these picture series must be reserved for soft porridge and purées only, not for firm vegetable mash, as was served during the validation sessions.
Finally, the estimations of the portion sizes of green and mixed salads were problematic. Only the Danish green salad (lettuce) performed acceptably after adjustment. From the photos from the sessions, we know that none of the green salad servings appeared as depicted in the picture series. The mixed salad also appeared differently from country to country, although a common recipe for a mixed salad was used in all the countries. Portions with an amorphous shape-like salad have been described as problematic by others(Reference Subar, Crafts and Zimmerman17), but no suggestion for improvement has been made.
The three series identified as problematic, the cake (rectangular piece), the green salad and the mixed salad, also had lowest Spearman's correlation coefficients between the estimated mean portion number and the correct portion number of all, 0·67, 0·67 and 0·62, respectively (Table 3), while Spearman's correlation coefficients of the acceptable series typically were greater than 0·8. Other studies have found correlation coefficients within the same range(Reference De Keyzer, Huybrechts and De Maeyer18, Reference Turconi, Guarcello and Berzolari19).
The estimation errors of the alternative series of whole tomatoes showed values corresponding to those of the acceptable series, while the values from the series of chicken, in general, were overestimated. It is suggested that only the series of chicken be used in future surveys if the portion sizes reflect the most common size of chicken eaten by the target group of the survey.
Performance of individual pictures within the series
It appeared that the pictures with the largest portion sizes most often exhibited problematic performance. In the thirty-two acceptable series, this was the case of picture number 5 in nine series and picture number 6 in twenty series. Only in few of the acceptable series, picture numbers 3 and 4 turned out to be problematic. Other studies have found that smaller portions were more often correctly estimated than larger portions(Reference Ovaskainen, Pautri and Reinivuo14, Reference Vereecken, Dohogne and Covents15). This might reflect a general hesitation to select the largest portions. However, in the present study, this may have occurred due to general difficulties with perception of the volume of the large portions, and this is probably more likely to happen when the users do not dish up themselves. The portion sizes were randomly assigned to the participants, and from the qualitative evaluation questionnaires, we found that about one-third of the participants believed that the portions, in general, were too large compared with the portions that their children usually consumed.
When picture series are used in dietary surveys, participants having children consuming large portions might perform better when choosing among the largest portions. Further investigations are needed to confirm this.
Measures of estimation errors
We observed no clear association between the performance of the series and how the series were constructed with regard to the increments of the portion sizes (Table 4). A one-way ANOVA and least square mean differences Student's t tests for comparison between means and between SD of the difference between the estimated picture number minus the actual portion number (both non-adjusted and adjusted values) showed only significant differences between the means of series with equidistant and increasing increments. Correspondingly, only the difference between the SD of series with equidistant and mixed increments was significant. There was a tendency for the equidistant series to cause more difficulties while estimating the large portions, while the series with increasing increments were more problematic while estimating the smallest and medium-sized portions. This indicates that, in general, the mixed series performed best and that the performance of the series might benefit from taking equal increments on a log scale as a point of departure and modify from there.
The seven food items that were estimated by a picture series from another similar food item showed different results. For two foods, the series performed acceptably, three were acceptable when adjusted, one was underestimating and one was ‘not precise’.
Density differences
The present study clearly showed that the difference in density of the food items depicted in the picture series and that of the food items on the plate has an impact on the bias of the estimates. However, adjusted values have to be used with caution. Measurement of the volume of the foods as presented on the plate may seem simple but involves great uncertainties. Especially, measurement uncertainties will have a large impact on the density factor for foods with low densities such as (mixed) salad, grated carrots, cornflakes, oats and muesli, and some cakes. However, when carrying out a dietary survey, density adjustment can improve the quantification when densities of the foods depicted in the picture series are known from measurements and the densities of the most common foods eaten by the target group of the survey are known. For instance, it is possible to take density differences directly into account, when picture series are used for foods other than those depicted, but densities of food items eaten by the individuals are rarely known. Further development in the methods of measuring the volume of foods, such as use of image analysis, is needed before it is possible to benefit from adjustments at an individual level.
Strengths and limitations
The foods used in the present study were intended to appear as similar to the foods depicted in the picture series. In practice, this was difficult as the study was conducted at three study centres. Therefore, it was a strength of the present study that the densities of the foods were measured and a photo of each food as dished on the plate was taken during the validation sessions. It was a tool to further investigate contradicting results and to avoid drawing wrong conclusions.
The study investigated the perception of the participants with regard to the portion sizes of the series in the sense of their ability to correctly link an amount of food presented on a plate to the correct picture in a series. This is most relevant when the picture series are going to be used in relation to a food diary. Conceptualisation and memory skills also influence the accuracy of portion size estimations in dietary surveys based on recall methods(Reference Nelson, Atkinson and Darbyshire20), but the present study was not designed to take this into account. Moreover, there are no existing guidelines regarding the level of acceptable accuracy for a picture to be used. Hernández et al. (Reference Hernández, Wilder and Kuehn21) pointed out that there is a lack of consensus of expression of error rates and that precision in portion size estimation is not yet a realistic expectation. It was, therefore, a challenge in the present study to define criteria for acceptability in the evaluation of the picture series. The design of the present study made it possible to determine whether each picture series performed adequately/sufficiently based on mean difference between the estimated portion number and served portion number and the sd.
An additional strength was that each picture of all picture series was evaluated six times each. This made it possible to identify problematic (or less valid) picture series and problematic pictures within the series. However, with the pre-weighed portions in the study, only relative tendency to overestimate and underestimate is indicated. The study design does not give insights into the absolute over- or underestimation of portions eaten by the target group. For the latter, a study should be organised among participants representative for the target group and preferably in real-life situations where they dish up their own realistic portions. Only after such a study is conducted, inferences can be made about the extent of error on overall dietary intake in food consumption surveys.
It was a strength of the present study that it was conducted in three different countries in Europe. This makes it more acceptable to generalise the results to other European countries. However, the under-representation of parents with infants and over-representation of higher educated women in the present study might have influenced the results. Although Nelson et al. (Reference Nelson, Atkinson and Darbyshire22) have suggested sex and age as potential confounders, other studies have indicated that this might not be important for drawing conclusions(Reference Ovaskainen, Pautri and Reinivuo14, Reference Vereecken, Dohogne and Covents15, Reference De Keyzer, Huybrechts and De Maeyer18, Reference Robson and Livingstone23, Reference Faggiano, Vineis and Cravanzola24). The missing information about the participants in Belgium was due to the fact it was not registered during the first two validation sessions.
In the effort of providing comparable food consumption data and harmonising the methodology of data collection, it is regarded as an advantage to use a common tool such as the PANCAKE picture book, developed using science-based principles and practical experiences. Differences in dietary habits between the European countries do, however, necessitate variation as to which picture series are to be included in the picture book at the national level. Before using the series in another country, it is recommended that careful consideration be given as to whether the foods in the series cover the most commonly eaten foods and the relevant range of portion sizes in the new country. Otherwise, new country-specific series are needed. The PANCAKE picture book and the repository on the web, http://www.kostvaner.dk/pancake, offer the needed flexibility, since it is possible to choose between the picture series and add new series when needed. Since the picture book for the food record method is going to be used by the participants when they register their diet on their own, the number of picture series had to be restricted; we suggest a maximum of 45.
Conclusion
We recommend that all picture series in the PANCAKE picture book be included for the future EU Menu survey among infants, toddlers and children. In general, the performance of the picture series was best when the food item to be estimated was similar to the depicted food with regard to appearance and density. However, some specific series should be used with caution:
(1) The picture series of baby food – fruit purée, vegetable purée and porridge – are not suitable for firm and dry porridge and mashed fruits and vegetables, but suitable only for soft and smooth variants.
(2) The picture series of green salad and cakes are suitable only for food items that are very similar to the depicted foods.
(3) It is suggested that only the series of chicken be used in future surveys to identify the eaten part of chicken and the country-specific most common size of chicken eaten by the target group of the survey be used for the estimation of the amount eaten.
New and improved series should be developed or other quantification tools should be sought in order to cover the need for estimating portion sizes of various cakes and salads.
Furthermore, the performance of both large and small picture numbers in the accepted series might be further improved by defining the portions sizes for the pictures with increasing increments of the portion sizes.
For the development of new series, the procedure of the PANCAKE picture book is recommended. It is recommended that the range of portions be based on data from representative weighed data of the target group and increasing increments of the portions of the series be used. It is suggested that equal increments on a log scale be taken as a point of departure. The density of the food items within the series should be measured.
It is recommended that new pictures be validated using a study design and a method for analyses that are the same as those used in the present study. Additional validation is suggested for gaining insights into the over- and underestimation of the amounts as used in the target groups.
Acknowledgements
We thank all colleagues who were responsible for the realisation of PANCAKE picture book validation study: those from NIPH in the Czech Republic – Irena Rehurkova, Danuse Resova, Pavla Steinhauserova, Marie Subrtova, Lucie Machalova, Marie Rossnerova and Darina Lecianova – and the dietitians in Belgium – Sophie Dufourny, Katia Cornelis, Daisy Dejonghe, Cathy Becquaert, Hanne Decuypere, Hyacinthe Voorspoels and Joke Peirlinck. We also thank all colleagues from DTU Food (Technical University of Denmark) who contributed to the development of the PANCAKE picture book and the validation study in Denmark, especially Trine Holmgaard Nielsen, Mia Hjorth Frandsen, Karin Hess Ygil, Majbritt Gille, Anja Biltoft-Jensen, Tue Christensen and Karsten Kørup. Furthermore, we thank Bjarne Kjær Ersbøll, the statistician, and Mathilde Huet, a student, for contributing to the statistical analyses and Jasper Simonsen (http://www.jasperfoto.dk), the photographer, for very professional assistance. The present study is a part of the PANCAKE project and has been funded in part by the European Food Safety Authority (CFP/EFSA/DATEX/2009/02). Sole responsibility lies with the authors. EFSA is not responsible for any use that may be made of the information contained therein, as stated by Article II.5 – Publicity of the Amendment No. 1 to grant agreement CFP/EFSA/DATEX/2009/02. All authors were responsible for the overall study design. E. T. had the overall responsibility of the detailed study design, analysed the data and wrote the manuscript. M. E. contributed to the common materials for data collection in all the three countries and coordinated data collection in Denmark. M. D. and J. R. were responsible for the data collection in Czech Republic and S. V. was responsible for it in Belgium. S. V., M. D., J. R., M. E., E. d. B. and M. O. participated in critical revision of the manuscript and analyses. None of the authors has a financial or personal conflict of interest.


