


Introduction
Dental morphology has profound implications for the dietary ecology of mammals, because the primary function of mammalian teeth is to process food. One crucial aspect of dental morphology is its relationship with dental wear, which is tied to both chewing mechanics and food properties (e.g., Mills Reference Mills1967; Rensberger Reference Rensberger1973; Fortelius Reference Fortelius1985; Lucas Reference Lucas2004). Dental wear can come from direct contact between tooth surfaces (attrition) or contact between teeth and extraneous material (abrasion), such as food and adhering dust/grit (e.g., Baker et al. Reference Baker, Jones and Wardrop1959; Butler Reference Butler1972; Rensberger Reference Rensberger1973; Fortelius Reference Fortelius1985). Because grasses carry an abundance of abrasive particles internally or externally, grass-eating mammals endure high dental wear rates (e.g., Rensberger et al. Reference Rensberger, Forsten and Fortelius1984; Lucas et al. Reference Lucas, Turner, Dominy and Yamashita2000; Sanson et al. Reference Sanson, Kerr and Gross2007; Karme et al. Reference Karme, Rannikko, Kallonen, Clauss and Fortelius2016). As a result, hypsodonty, which refers to teeth that are taller than they are wide, has evolved several times independently in different grass-eating herbivores (e.g., Simpson Reference Simpson1951; van Valen Reference van Valen1960; Janis and Fortelius Reference Janis and Fortelius1988; Jernvall and Fortelius Reference Jernvall and Fortelius2002; Ungar Reference Ungar2010; Madden Reference Madden2014). On the other hand, hypsodonty induces a series of fundamental changes in the organization of dental tissues within a tooth and in the function of the occlusal surface as dental wear progresses (e.g., Fortelius Reference Fortelius1985; Pérez-Barbería and Gordon Reference Pérez-Barbería and Gordon1998). Dentine wears more deeply on the occlusal surface than enamel, which creates enamel ridges and dentine basins as secondary features of a moderately worn tooth (e.g., Rensberger Reference Rensberger1973; Janis and Fortelius Reference Janis and Fortelius1988; Kaiser Reference Kaiser2002). These features are functionally important, as they serve as shearing crests where food particles are mechanically broken down when upper and lower teeth come into occlusion (Lucas and Luke Reference Lucas, Luke, Chivers, Wood and Bilsborough1984; Hofmann Reference Hofmann1989; Archer and Sanson Reference Archer and Sanson2002; Schmidt-Kittler Reference Schmidt-Kittler2002). Most herbivores have complex occlusal surfaces for cutting and grinding (e.g., Cope Reference Cope1896; Butler Reference Butler1956; Fortelius Reference Fortelius1985; Ungar Reference Ungar2010). Hypsodont herbivores, in particular, have enamel and dentine layers that are almost perpendicular to the occlusal surface, to maintain the secondary shearing crests for the majority of the life spans of their cheek teeth (e.g., Janis and Fortelius Reference Janis and Fortelius1988; Pérez-Barbería and Gordon Reference Pérez-Barbería and Gordon1998; Lucas Reference Lucas2004; Ungar Reference Ungar2015).
Extant pigs (family Suidae) are generally medium- to large-sized omnivores and are found in a variety of ecosystems around the world (Meijaard et al. Reference Meijaard, d'Huart, Oliver, Wilson and Mittermeier2011). Some African taxa (warthogs and giant forest hogs) are exceptional in that they diverged tremendously from omnivory and adopted highly herbivorous diets (e.g., Field Reference Field1972; d’Huart Reference d'Huart1978; Viehl Reference Viehl2003; Kingdon Reference Kingdon2015). This ecological divergence can be traced back to the late Miocene to mid-Pliocene (between 6 and 4 Ma) in Africa, during which a prominent dietary shift toward higher proportions of C4 vegetation (typically tropical grasses) was a common response to the local climate and vegetation changes among herbivorous mammals (e.g., deMenocal and Bloemendal Reference deMenocal, Bloemendal, Vrba, Denton, Partridge and Burckle1995; Vrba Reference Vrba, Vrba, Denton, Partridge and Burckle1995; Bobe and Behrensmeyer Reference Bobe and Behrensmeyer2004; Cerling et al. Reference Cerling, Harris, Leakey, Baldwin, Caldwell, Heldmaier, Jackson, Lange, Mooney, Schulze, Sommer, Ehleringer, Dearing and Cerling2005, Reference Cerling, Wynn, Andanje, Bird, Korir, Levin, Mace, Macharia, Quade and Remien2011, Reference Cerling, Andanje, Blumenthal, Brown, Chritz, Harris, Hart, Kirera, Kaleme and Leakey2015; Ségalen et al. Reference Ségalen, Lee-Thorp and Cerling2007; Uno et al. Reference Uno, Cerling, Harris, Kunimatsu, Leakey, Nakatsukasa and Nakaya2011, Reference Uno, Polissar, Jackson and deMenocal2016; Herbert et al. Reference Herbert, Lawrence, Tzanova, Peterson, Caballero-Gill and Kelly2016). Intriguingly, in the most common fossil suid lineages in Africa (Notochoerus, Kolpochoerus, and Metridiochoerus), the dental morphological innovations that supposedly corresponded to this dietary shift displayed convergent evolutionary trends of increased crown height (hypsodonty) and increased length of the third molars (M3s) by adding more cusp(id)s/pillars to the distal end (Cooke and Maglio Reference Cooke, Maglio, Bishop and Miller1972; White and Harris Reference White and Harris1977; Cooke and Wilkinson Reference Cooke, Wilkinson, Maglio and Cooke1978; Harris and White Reference Harris and White1979; Kullmer Reference Kullmer1999; Geraads and Bobe Reference Geraads and Bobe2017). At the same time, an increase in the number of shearing crests and a decrease in enamel thickness have also been observed but not quantified in the M3s of Plio-Pleistocene fossil suids (Cooke and Wilkinson Reference Cooke, Wilkinson, Maglio and Cooke1978; Harris and White Reference Harris and White1979). Based on these dental features, common suid lineages have been divided into distinct species/chronospecies that have been used in biostratigraphic correlations across different Neogene and Pleistocene African sites (e.g., Cooke and Maglio Reference Cooke, Maglio, Bishop and Miller1972; White and Harris Reference White and Harris1977; Cooke Reference Cooke, Bobe, Alemseged and Behrensmeyer2007).
Like other herbivores, suids supposedly evolved M3 hypsodonty as an adaptive trait to prevent premature loss of masticatory function when consuming large amounts of abrasive foods (Fortelius Reference Fortelius1985; Janis and Fortelius Reference Janis and Fortelius1988). Crown elongation has been associated with delayed sequential dental eruption, which permits the functionality of the cheek tooth row to be maintained, as early erupted permanent teeth become worn and nonfunctional (Janis and Fortelius Reference Janis and Fortelius1988; Lanyon and Sanson Reference Lanyon and Sanson2006; Gomes Rodrigues et al. Reference Gomes Rodrigues, Marangoni, Šumbera, Tafforeau, Wendelen and Viriot2011). While both M3 hypsodonty and crown elongation are considered adaptive traits to abrasive diets, the number of shearing crests and enamel thickness are potentially associated with a different set of diet-related functionality. Intuitively, the more shearing crests a herbivore can pack onto an occlusal surface (being more complex), the more efficient it is at processing vegetation per chewing cycle (e.g., Schmidt-Kittler Reference Schmidt-Kittler2002; Ferretti Reference Ferretti2003; Lucas Reference Lucas2004; Famoso et al. Reference Famoso, Feranec and Davis2013; Gailer and Kaiser Reference Gailer and Kaiser2014; Schultz et al. Reference Schultz, Engels, Schwermann, Koenigswald, Martin and Koenigswald2020). On the other hand, thinner enamel can create higher occlusal stress at the shearing crests, which is more effective in breaking down tough and fibrous foods such as grasses, but at the cost of a higher dental wear rate (Fortelius Reference Fortelius1985; Schmidt-Kittler Reference Schmidt-Kittler2002; Ferretti Reference Ferretti2003). For suids that are known to have unspecialized gastrointestinal tracts (Kükenthal and Schmidt-Rhaesa Reference Kükenthal and Schmidt-Rhaesa2017), increase in occlusal complexity and decrease in enamel thickness can theoretically improve short-term energetic return: fewer chews are required to process the same amount of food, and a higher net energy gain is achieved per unit of feeding time. By contrast, M3 crown elongation and particularly hypsodonty can improve long-term reproductive success: the life span of the tooth is extended, which may lead to more offspring in an individual's lifetime. While both categories of success can contribute to the thriving of a species or a lineage, the selective pressure can be different in either category. Neogene and Pleistocene African suids present an exceptional case study into these categories of natural selection with their long-surviving lineages and unique dental morphological evolution.
Unlike other herbivores, suids display complex cusp(id)/pillar configurations and diverse occlusal patterns in their M3s as dental wear progresses (Shaw Reference Shaw1939; Cooke and Maglio Reference Cooke, Maglio, Bishop and Miller1972; Harris and White Reference Harris and White1979; Kullmer Reference Kullmer1999). This feature makes it challenging to compare occlusal traits in specimens at different wear stages. Moreover, the morphometrical correlates and functional implications of M3 elongation are still not fully explored. For example, as fossil suids increased their M3 length, most of them also experienced a reduction in premolar/incisor size and function (Cooke and Wilkinson Reference Cooke, Wilkinson, Maglio and Cooke1978; Harris and White Reference Harris and White1979), which suggests a trend of a heavier reliance on M3s for mastication (Souron Reference Souron, Melletti and Meijaard2017). If this is the case, an increase in M3 length could also provide additional shearing functionality on the occlusal surface, potentially contributing to both short-term energetic return and long-term reproductive success. Such mechanisms could have offered some adaptive advantage for the grass-eating fossil suids, as they were as abundant as bovids during the Pliocene in eastern Africa (e.g., Bobe et al. Reference Bobe, Behrensmeyer and Chapman2002; Bobe and Behrensmeyer Reference Bobe and Behrensmeyer2004; Lazagabaster et al. Reference Lazagabaster, Souron, Rowan, Robinson, Campisano and Reed2018).
In this study, we examined how functional occlusal traits vary as dental wear progresses within the life spans of the M3s, and how the increase in M3 crown length correlates with functional occlusal traits in sympatric suid lineages. We used micro-computed tomography (micro-CT) as a nondestructive method to virtually simulate the progression of dental wear using unworn or barely worn M3s of three different African fossil suid lineages (Notochoerus, Kolpochoerus, and Metridiochoerus). First, we built reference series of simulated “occlusal surfaces” along the trajectory of dental wear and adapted a measurement to quantify dental wear progression. Second, we developed/adapted morphometric measurements to quantify two functional occlusal traits, namely occlusal enamel complexity and enamel thickness, to investigate their variation patterns as dental wear progresses. Third, to examine the functional correlates of M3 elongation and its evolutionary significance, we compared the variation patterns of the occlusal traits among representative members of the three fossil suid lineages, as well as among extant African suids. Finally, we explored the evolutionary trends of the functional occlusal traits in different lineages in the context of their dietary ecology and potential selective pressures.
Materials and Methods
Suid Dental Materials
The M3s of extant and extinct African suids have been chosen as the subject of investigation for the following reasons. First, M3s are the best represented in the suid fossil record due to their large sizes and good preservation (Harris and White Reference Harris and White1979; Cooke Reference Cooke, Bobe, Alemseged and Behrensmeyer2007). Second, M3s are morphologically and morphometrically diagnostic, which is often crucial for species identification (Harris and White Reference Harris and White1979; Kullmer Reference Kullmer1999; Cooke Reference Cooke, Bobe, Alemseged and Behrensmeyer2007). Finally, in most fossil suid species, the M3s have become functionally more important than other teeth for food mastication (Cooke and Wilkinson Reference Cooke, Wilkinson, Maglio and Cooke1978; Harris and White Reference Harris and White1979; Kullmer Reference Kullmer1999; Souron Reference Souron, Melletti and Meijaard2017), making their functional traits potential targets for natural selection.
To investigate how M3 elongation correlates with functional occlusal traits, we selected specimens from Kenya and South Africa that represent different levels of M3 elongation in three major fossil suid lineages (Fig. 1, Table 1). Due to a lack of an exhaustive phylogenetic analysis of fossil suid taxa, the taxonomy and phylogenetic relationships of some fossil suids are still debated (van der Made Reference van der Made1998; Fessaha Reference Fessaha1999; Harris and Leakey Reference Harris, Leakey, Leakey and Harris2003; Geraads Reference Geraads2004; Souron et al. Reference Souron, Boisserie and White2015a; Cherin et al. Reference Cherin, Sorbelli, Crotti, Iurino, Sardella and Souron2018; Reda et al. Reference Reda, Lazagabaster and Haile-Selassie2019). The commonly accepted species that follow an ancestor–descendant relationship are: (1) the Notochoerus euilus–Notochoerus scotti lineage (subfamily: Tetraconodontinae; Cooke and Wilkinson Reference Cooke, Wilkinson, Maglio and Cooke1978; Harris and White Reference Harris and White1979; van der Made Reference van der Made1998; Bishop Reference Bishop, Bromage and Schrenk1999); (2) the Kolpochoerus limnetes–Kolpochoerus paiceae lineage (subfamily: Suinae; Cooke and Wilkinson Reference Cooke, Wilkinson, Maglio and Cooke1978; Souron et al. Reference Souron, Boisserie and White2015a; Souron Reference Souron, Melletti and Meijaard2017); and (3) the Metridiochoerus sp.–Metridiochoerus andrewsi–Metridiochoerus compactus lineage (subfamily: Suinae; Harris and White Reference Harris and White1979; White et al. Reference White, Howell and Gilbert2006). Because of our limited access to micro-CT data, we chose specimens of Metridiochoerus shawi (Cooke Reference Cooke and S2005) instead of Metridiochoerus sp. to represent the early Metridiochoerus morphotype, because they share the same level of M3 elongation and similar occlusal morphologies (Cooke Reference Cooke and S2005; White et al. Reference White, Howell and Gilbert2006). All representative species of the major lineages are considered sympatric in eastern Africa during the Plio-Pleistocene (Harris and White Reference Harris and White1979; Cooke Reference Cooke, Bobe, Alemseged and Behrensmeyer2007; Bibi et al. Reference Bibi, Pante, Souron, Stewart, Varela, Werdelin, Boisserie, Fortelius, Hlusko, Njau and de la Torre2018).
Selected Plio-Pleistocene suids, their previously proposed phylogenetic relationships between chronospecies, and images of representative specimens included in this study, showing trends of increase in hypsodonty and elongation in third molars. The systematics were adapted from White and Suwa (Reference White and Suwa2004) for Nyanzachoerus/Notochoerus (A); Souron et al. (Reference Souron, Boisserie and White2015a) for Kolpochoerus (B); and Cooke (Reference Cooke and S2005) and Cherin et al. (Reference Cherin, Sorbelli, Crotti, Iurino, Sardella and Souron2018) for Metridiochoerus (C). Fossil suid chronospecies, their first and last appearance dates (FAD and LAD), and proposed systematic relationships are summarized and discussed in Appendix 1, section 1, Supplementary Material. Ny., Nyanzachoerus; No., Notochoerus; K., Kolpochoerus; M., Metridiochoerus; H., Hylochoerus; asterisks (*) represent descendants of Kolpochoerus limnetes that became endemic to the Turkana Basin (usually called K. olduvaiensis; see Bibi et al. Reference Bibi, Pante, Souron, Stewart, Varela, Werdelin, Boisserie, Fortelius, Hlusko, Njau and de la Torre2018); question marks (?) represent lineages of debated or unknown phylogenetic relationships. Images of fossil specimens are extracted from the 3D Visualization & Analysis Software, Avizo 7.1, displaying the upper buccal (specimen 6) or lower lingual view (all other specimens). The 3D surface renderings of specimens 1, 5, 6, and 7 were mirrored horizontally to make sure that all specimens display comparable views, with mesial cusp(id)s/pillars on the left of the image.
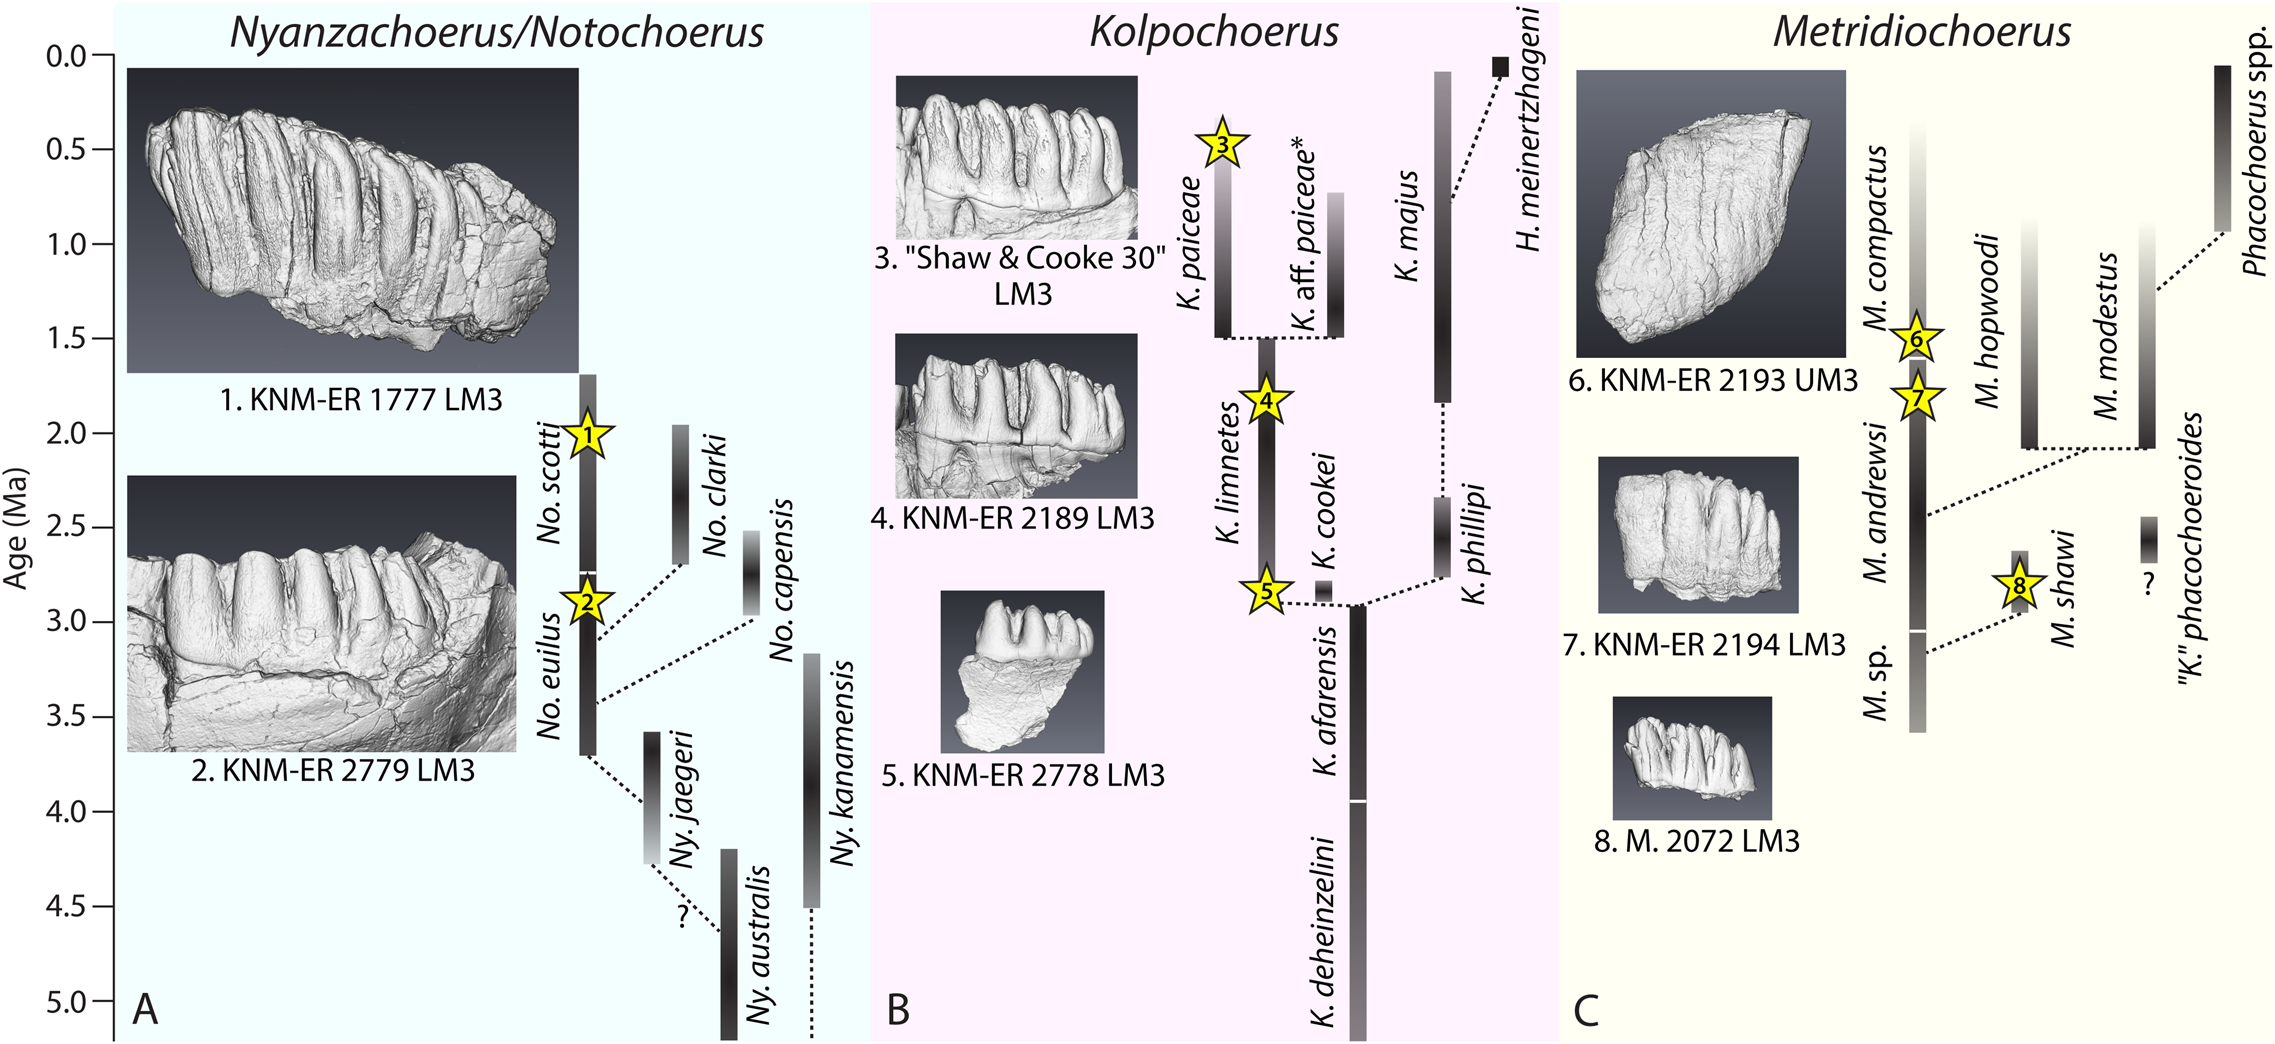
Summary of fossil suid specimens included in this study; note that the number of main pillars in the third molars (M3s) corresponds to the degree of M3 elongation in each species; this number is determined by counting the large pillars on the lingual side of upper M3s or on the buccal side of lower M3s; the age estimates of Turkana basin specimens come from McDougall et al. (Reference McDougall, Brown, Vasconcelos, Cohen, Thiede and Buchanan2012) with notes on stratigraphic provenance (Harris Reference Harris1983; Bobe Reference Bobe2002); the age estimate of Makapansgat Member 3 comes from Herries et al. (Reference Herries, Pickering, Adams, Curnoe, Warr, Latham, Shaw, Reed, Fleagle and Leakey2013); the age estimate of Vaal River Younger Gravel C comes from Helgren (Reference Helgren1977); No., Notochoerus; K., Kolpochoerus; M., Metridiochoerus; UM3, upper M3; LM3, lower M3.
To provide a reference dataset for the Pliocene and early Pleistocene fossil specimens and to better understand the dietary implications of M3 crown elongation, we included extant warthog (Phacochoerus africanus) specimens and one late middle Pleistocene bushpig/red river hog (Potamochoerus sp.) specimen from Lake Eyasi, Tanzania (Supplementary Table 1). Warthogs are considered the only extant suids specialized on grass (Clough Reference Clough1970; Field Reference Field1972; Cooke and Wilkinson Reference Cooke, Wilkinson, Maglio and Cooke1978; Harris and Cerling Reference Harris and Cerling2002; Treydte et al. Reference Treydte, Bernasconi, Kreuzer and Edwards2006; Souron Reference Souron, Melletti and Meijaard2017). They possess high-crowned and mesiodistally elongated M3s with numerous tightly packed pillars (Shaw Reference Shaw1939; Cooke and Wilkinson Reference Cooke, Wilkinson, Maglio and Cooke1978; Kullmer Reference Kullmer1999). Potamochoerus best resembles an ancestral dental morphotype with omnivorous diets (Meijaard et al. Reference Meijaard, d'Huart, Oliver, Wilson and Mittermeier2011; Souron Reference Souron, Melletti and Meijaard2017).
Micro-CT Scans to Simulate Dental Wear Progression
Extinct African suids generally display flat occlusal topography in moderately worn teeth (Rannikko et al. Reference Rannikko, Adhikari, Karme, Žliobaitė and Fortelius2020), most likely due to a high proportion of C4 grass in their diets (Fortelius and Solounias Reference Fortelius and Solounias2000; Harris and Cerling Reference Harris and Cerling2002; Cerling et al. Reference Cerling, Andanje, Blumenthal, Brown, Chritz, Harris, Hart, Kirera, Kaleme and Leakey2015). For this reason, dental wear progression can be simulated using micro-CT images perpendicular to the growth axis of unworn M3s (Adams Reference Adams2005). Micro-CT images of Kenyan and South African materials were collected using a Nikon XTH 225 high-resolution X-ray CT scanner (2000 × 2000 pixels) at the Evolutionary Studies Institute, University of the Witwatersrand, South Africa, at 120–140 kV and 140–150 μA settings. The Sus scrofa (wild boar) specimens were scanned at PACEA/University of Bordeaux, using a General Electric (GE) Phoenix v|tome|x s240 X-ray microtomograph, at 100–120 kV and 200 μA settings. The Phacochoerus africanus specimens were scanned at the National Institute of Applied Sciences of Lyon, using a GE Phoenix Nanotom 180 at 150 kV and 90 μA. For fossil specimens, a 1 mm copper filter was used to limit the beam hardening effect. For extant specimens, a 0.1 mm copper filter was used. Voxel resolution ranged from 6 to 50 voxels/mm, depending on the size of the specimen (Supplementary Table 2).
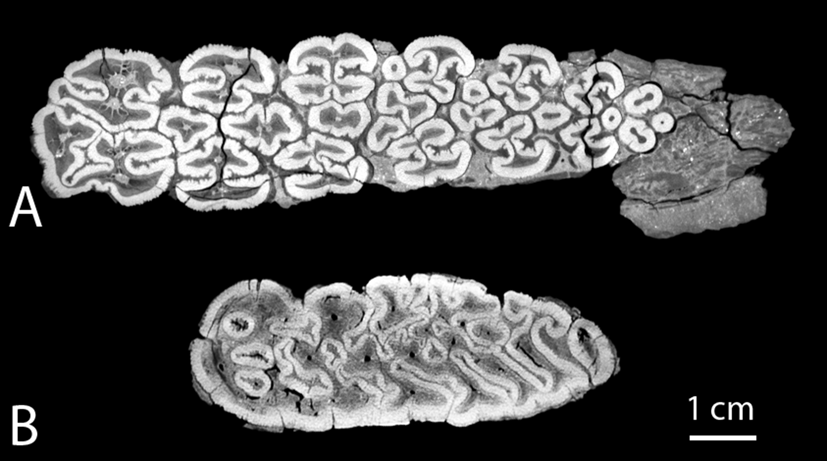
Within each specimen, between 8 and 16 virtually simulated “occlusal surfaces” (slices) were created in Avizo 7.1 (Visualization Science Group) perpendicular to the growth axis of the tooth, using the mesial second pair of pillars as the reference (Fig. 2A). The number of simulated “occlusal surfaces” was determined based on the crown height of the specimen, and the spacing between “occlusal surfaces” is consistent within each specimen. After the slices were generated, they were manually processed in Adobe Photoshop CS6 to create segments of enamel, dentine, and coronal cementum if present (the step-by-step Adobe Photoshop protocol is presented in Appendix 2, Supplementary Material). The segmented images were then exported to the open-source image-analysis software Fiji (Schindelin et al. Reference Schindelin, Arganda-Carreras, Frise, Kaynig, Longair, Pietzsch, Preibisch, Rueden, Saalfeld and Schmid2012) for measurements of occlusal features (the step-by-step Fiji protocol is presented in Appendix 2, Supplementary Material).
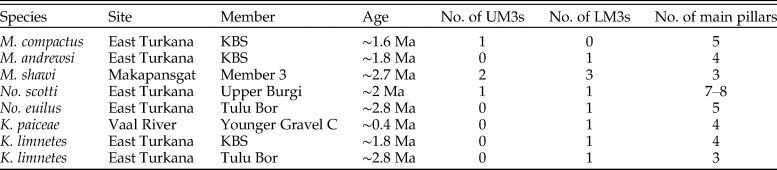
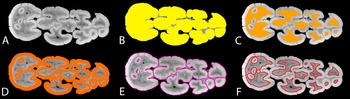
Demonstration of measurements for suid dental morphometrics; A, simulated “occlusal surface” (slice) derived from the micro-computed tomography (micro-CT) data of the right lower M3 of the M.2072 specimen from Makapansgat (Supplementary Table 7); B, OccA, occlusal area; C, DA, “exposed” dentine area; D, EA, enamel area; E, ECBL, enamel–cementum boundary length; F, EDBL, enamel–dentine boundary length.
From the segmented images, progression of dental wear on the simulated “occlusal surfaces” was measured with the dentine exposure ratio (DER). DER was calculated as:
 $${\rm DER} = {\rm DA/OccA}$$
where DA is the “exposed” dentine area (Fig. 2C), and OccA is the occlusal area of the simulated “occlusal surface” (Fig. 2B). DER measures the area of dentine exposure as a fraction of the entire “occlusal” area. This simple measurement has been used to quantify dental wear in primate teeth (Elgart Reference Elgart2010; Galbany et al. Reference Galbany, Altmann, Pérez-Pérez and Alberts2011; Morse et al. Reference Morse, Daegling, McGraw and Pampush2013; Pampush et al. Reference Pampush, Spradley, Morse, Harrington, Allen, Boyer and Kay2016) and generates continuous numerical data for each simulated “occlusal surface,” instead of discrete numbers as in the previously established dental wear scoring system in fossil suids (Kullmer Reference Kullmer1999). Because the amount of spacing within each slice sequence is known, our method permits an investigation into how DER correlates with the “slice depth” of each simulated occlusal image, which represents the height of the crown that is virtually “worn out” in the wear simulation (Appendix 1, section 3, Supplementary Material).
From the same simulated “occlusal surface,” the relative length of the enamel–dentine boundary (enamel–dentine boundary index [EDBI] or “enamel complexity”) was calculated as:
 $${\rm EDBI} = \displaystyle{{{\rm EDBL}} \over {\sqrt {{\rm OccA}} }}$$
where EDBL is the length of the “occlusally exposed” enamel–dentine boundary measured in millimeters (Fig. 2F), and OccA is as defined for equation (1). EDBL or similar measurements have been used as a proxy for occlusal shearing capabilities in several studies (Lanyon and Sanson Reference Lanyon and Sanson1986; Schmidt-Kittler Reference Schmidt-Kittler2002; King et al. Reference King, Arrigo-Nelson, Pochron, Semprebon, Godfrey, Wright and Jernvall2005; Morse et al. Reference Morse, Daegling, McGraw and Pampush2013), but it is often used within a single species. Here we adopted a scaling relationship in EDBI, dividing EDBL by the square root of OccA, which accounts for the dimensionality between the two measurements and makes this index independent of tooth size (Famoso et al. Reference Famoso, Feranec and Davis2013; Pampush et al. Reference Pampush, Spradley, Morse, Harrington, Allen, Boyer and Kay2016). EDBI has been used as a functional indicator for relative shearing capabilities in both extant and extinct herbivore teeth (Famoso et al. Reference Famoso, Feranec and Davis2013, Reference Famoso, Davis, Feranec, Hopkins and Price2015). More importantly, it allows comparison of occlusal enamel complexity in species that display vastly different occlusal morphologies, such as between equids and ruminants (Famoso et al. Reference Famoso, Davis, Feranec, Hopkins and Price2015).
From the same simulated “occlusal surface,” the average thickness of the “occlusal” enamel band (ET) on the simulated “occlusal” surface was calculated as:
 $${\rm ET} = {\rm 2 \times EA}{\rm /}{\rm ( EDBL} + {\rm ECBL) }$$
where EA is the area of the “occlusally exposed” enamel band (Fig. 2D); EDBL is as defined in equation (2); and ECBL is the length of the “occlusally exposed” enamel–cementum boundary (Fig. 2E). Because coronal cementum is present in most suid species that have been included in this study, ECBL is an inclusive term that may comprise two elements. One element corresponds to the outer perimeter of the “occlusal” enamel band in species without coronal cementum, or in fossil specimens where coronal cementum is not preserved (Fig. 2E). The other element corresponds to the enamel–cementum boundary within the occlusal area, where it is present in late wear stages within enamel islets in hypsodont taxa (Fig. 2E). Essentially, ET is a proxy for occlusal enamel thickness that considers the occlusal enamel band as a stretched-out ribbon with a uniform width: the width (ET) equals the area of the band (EA) divided by the average length of the band, which is the average of the outer and inner enamel lengths ([EDBL + ECBL]/2).
The results of EDBI as an indicator of occlusal shearing capability (occlusal enamel complexity) and ET as an indicator of occlusal enamel thickness are visualized in a morphospace (“wear space,” as in Pampush et al. Reference Pampush, Spradley, Morse, Harrington, Allen, Boyer and Kay2016), consisting of the progression of dental wear corresponding to the series of simulated “occlusal surfaces” on the x-axis (measured by DER), and the respective functional trait on the y-axis (measured by EDBI or ET).
Error and Sensitivity Analyses
We investigated potential sources of error that are introduced in different steps of image processing. Because our micro-CT images were manually processed, we investigated both inter- and intra-observer errors by repeating our measurements on the same specimens, including both fossil and extant ones (Appendix 1, section 5, Supplementary Material). Potential error associated with slice angle when 3D surfaces were rotated to virtually simulate dental wear was also investigated. The three sources of error associated with our methods are analyzed in detail in Appendix 1, Supplementary Material. The highest margin of the errors was used to provide upper and lower confidence limits to our measurements when results were illustrated.
Due to the limited number of specimens available in our analysis, most of the chronospecies are only represented by a single specimen in our analysis (Table 1). To better interpret our results, we investigated intraspecific variation among nonassociated specimens from a single site, using five M. shawi M3s from Makapansgat (Table 1). We assumed that these specimens likely represent randomly selected individuals from the same population. For the same reason (limited available scans), not all species have both upper and lower M3s represented in our dataset (Table 1). For example, M. compactus is only represented by one upper M3 specimen in our dataset. To confidently interpret our results consisting of both upper and lower M3s in the same comparison, we compared upper and lower M3s within a single individual, using three associated pairs of upper and lower M3s of S. scrofa (Supplementary Table 1) and two associated pairs of upper and lower M3s of the common warthog (Ph. africanus; Supplementary Table 1). Results of the comparisons of extant specimens are reported in Appendix 1, section 6, Supplementary Material. We also examined whether upper and lower M3s of different individuals display a significant difference in the functional occlusal traits using M. shawi specimens from Makapansgat and No. scotti specimens from the Koobi Fora Formation (Appendix 1, section 7, Supplementary Material).
Results
Estimation of Measurement Errors
Our error analyses showed that the measurements are associated with their respective errors in two different ways. The error for EDBI is linearly correlated with the EDBI value, while there is no significant trend for the errors associated with DER and ET (Supplementary Fig. 1, Supplementary Table 3). We decided to use a linear model to estimate the error associated with EDBI, while the error margins for DER and ET were set at constant values. Among the three sources of error that we investigated, intra-observer error produced the highest margins for DER at ±0.048, and ET at ±0.136 mm, while error associated with slice angle produced the highest margin of error for EDBI at ± (7.3% × EDBI + 0.12) (Table 2, Supplementary Table 4). The highest margins of error were used in constructing the confidence limits, which are presented as shaded areas around the raw data points in figures and Supplementary Material. Detailed analyses for the different sources of error, intraspecific variation, and sensitivity tests are also reported in Appendix 1, section 5, Supplementary Material.
Sources of error associated with manual image processing in this study (see Appendix 1 for detailed analyses). The highest error margin in each measurement (bolded) is used to construct upper and lower confidence limits of the results; DER, dentine exposure ratio; EDBI, enamel–dentine boundary index; ET, enamel thickness.

Wear-induced Changes in Functional Occlusal Traits in Fossil Suids
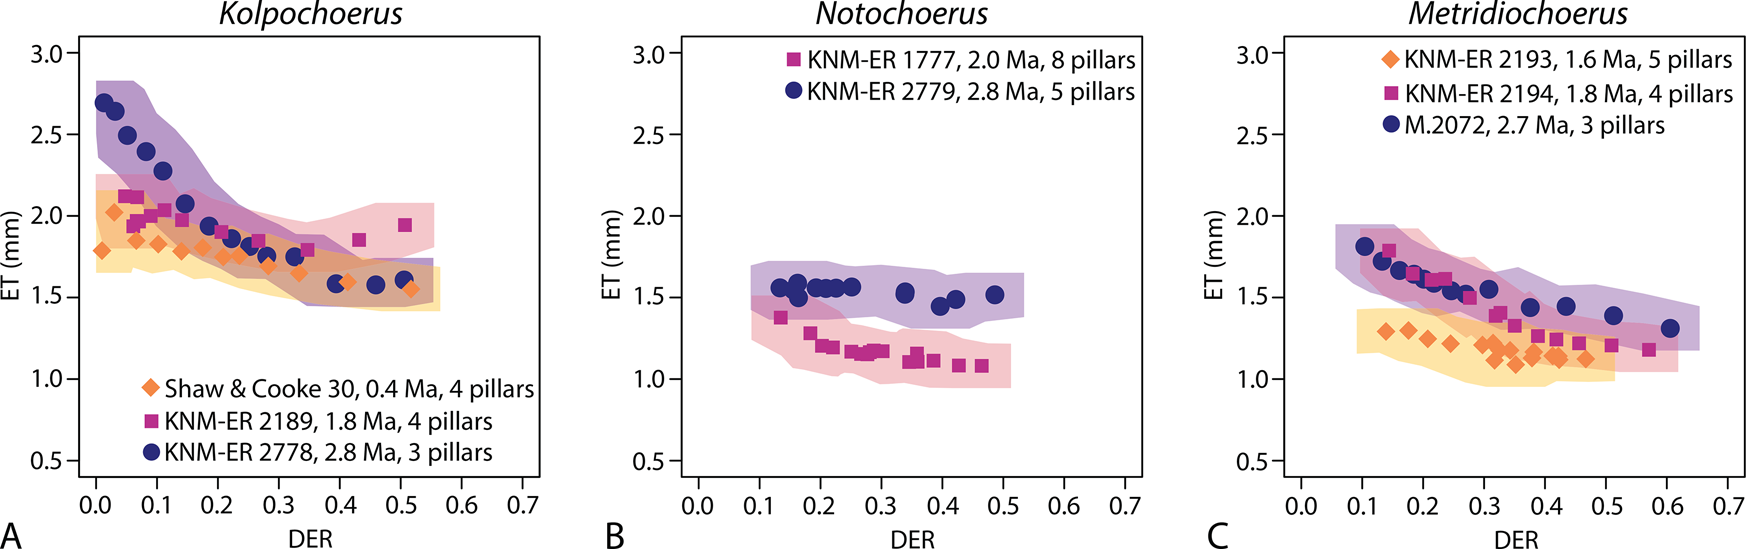
The two functional occlusal traits (EDBI and ET) experience substantial changes in almost all the wear simulations from early to late wear stages. The general pattern of change in EDBI as DER increases in all simulations resembles a quadratic relationship: EDBI increases quickly in all specimens as dental wear progresses in the early stages; it reaches a maximum value in most species when the M3s are moderately worn, corresponding to a DER ranging between 0.3 and 0.5; then it decreases as dental wear progresses in the late stages (Figs. 3, 4). Enamel thickness gradually decreases in all specimens as dental wear progresses, except for one specimen of Kolpochoerus (Fig. 5, KNM-ER 2189), the thickness of which increases slightly in the late stages as dental wear progresses.
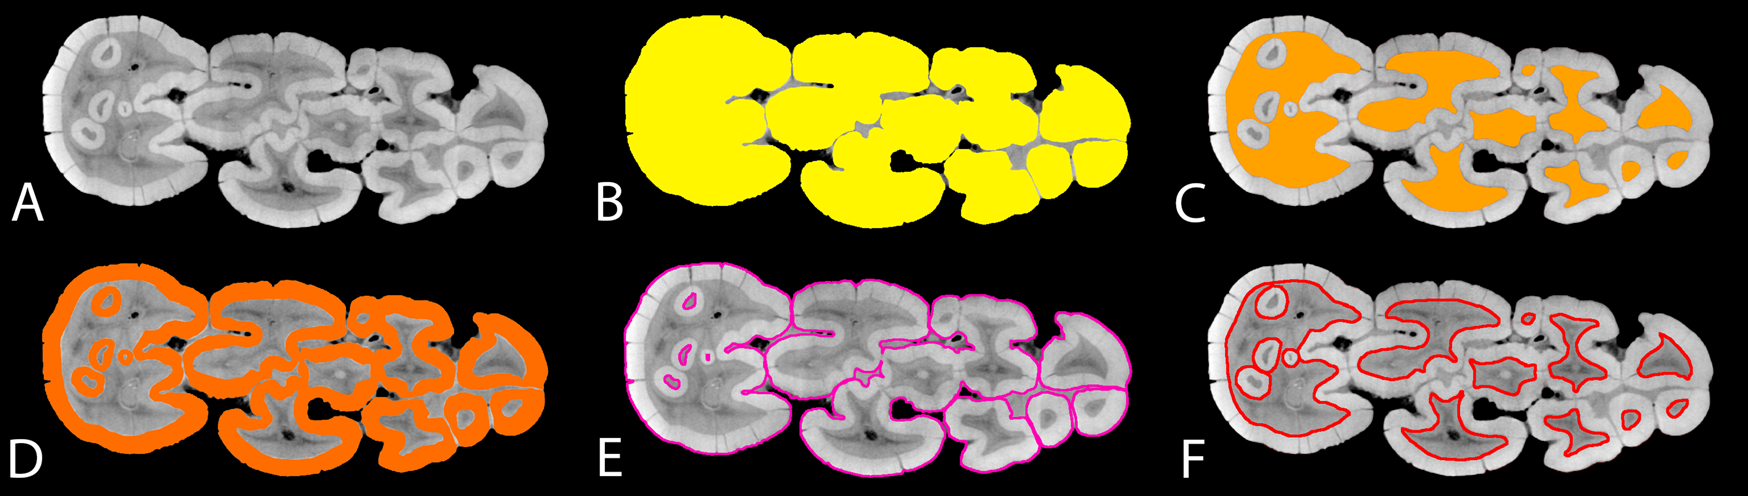
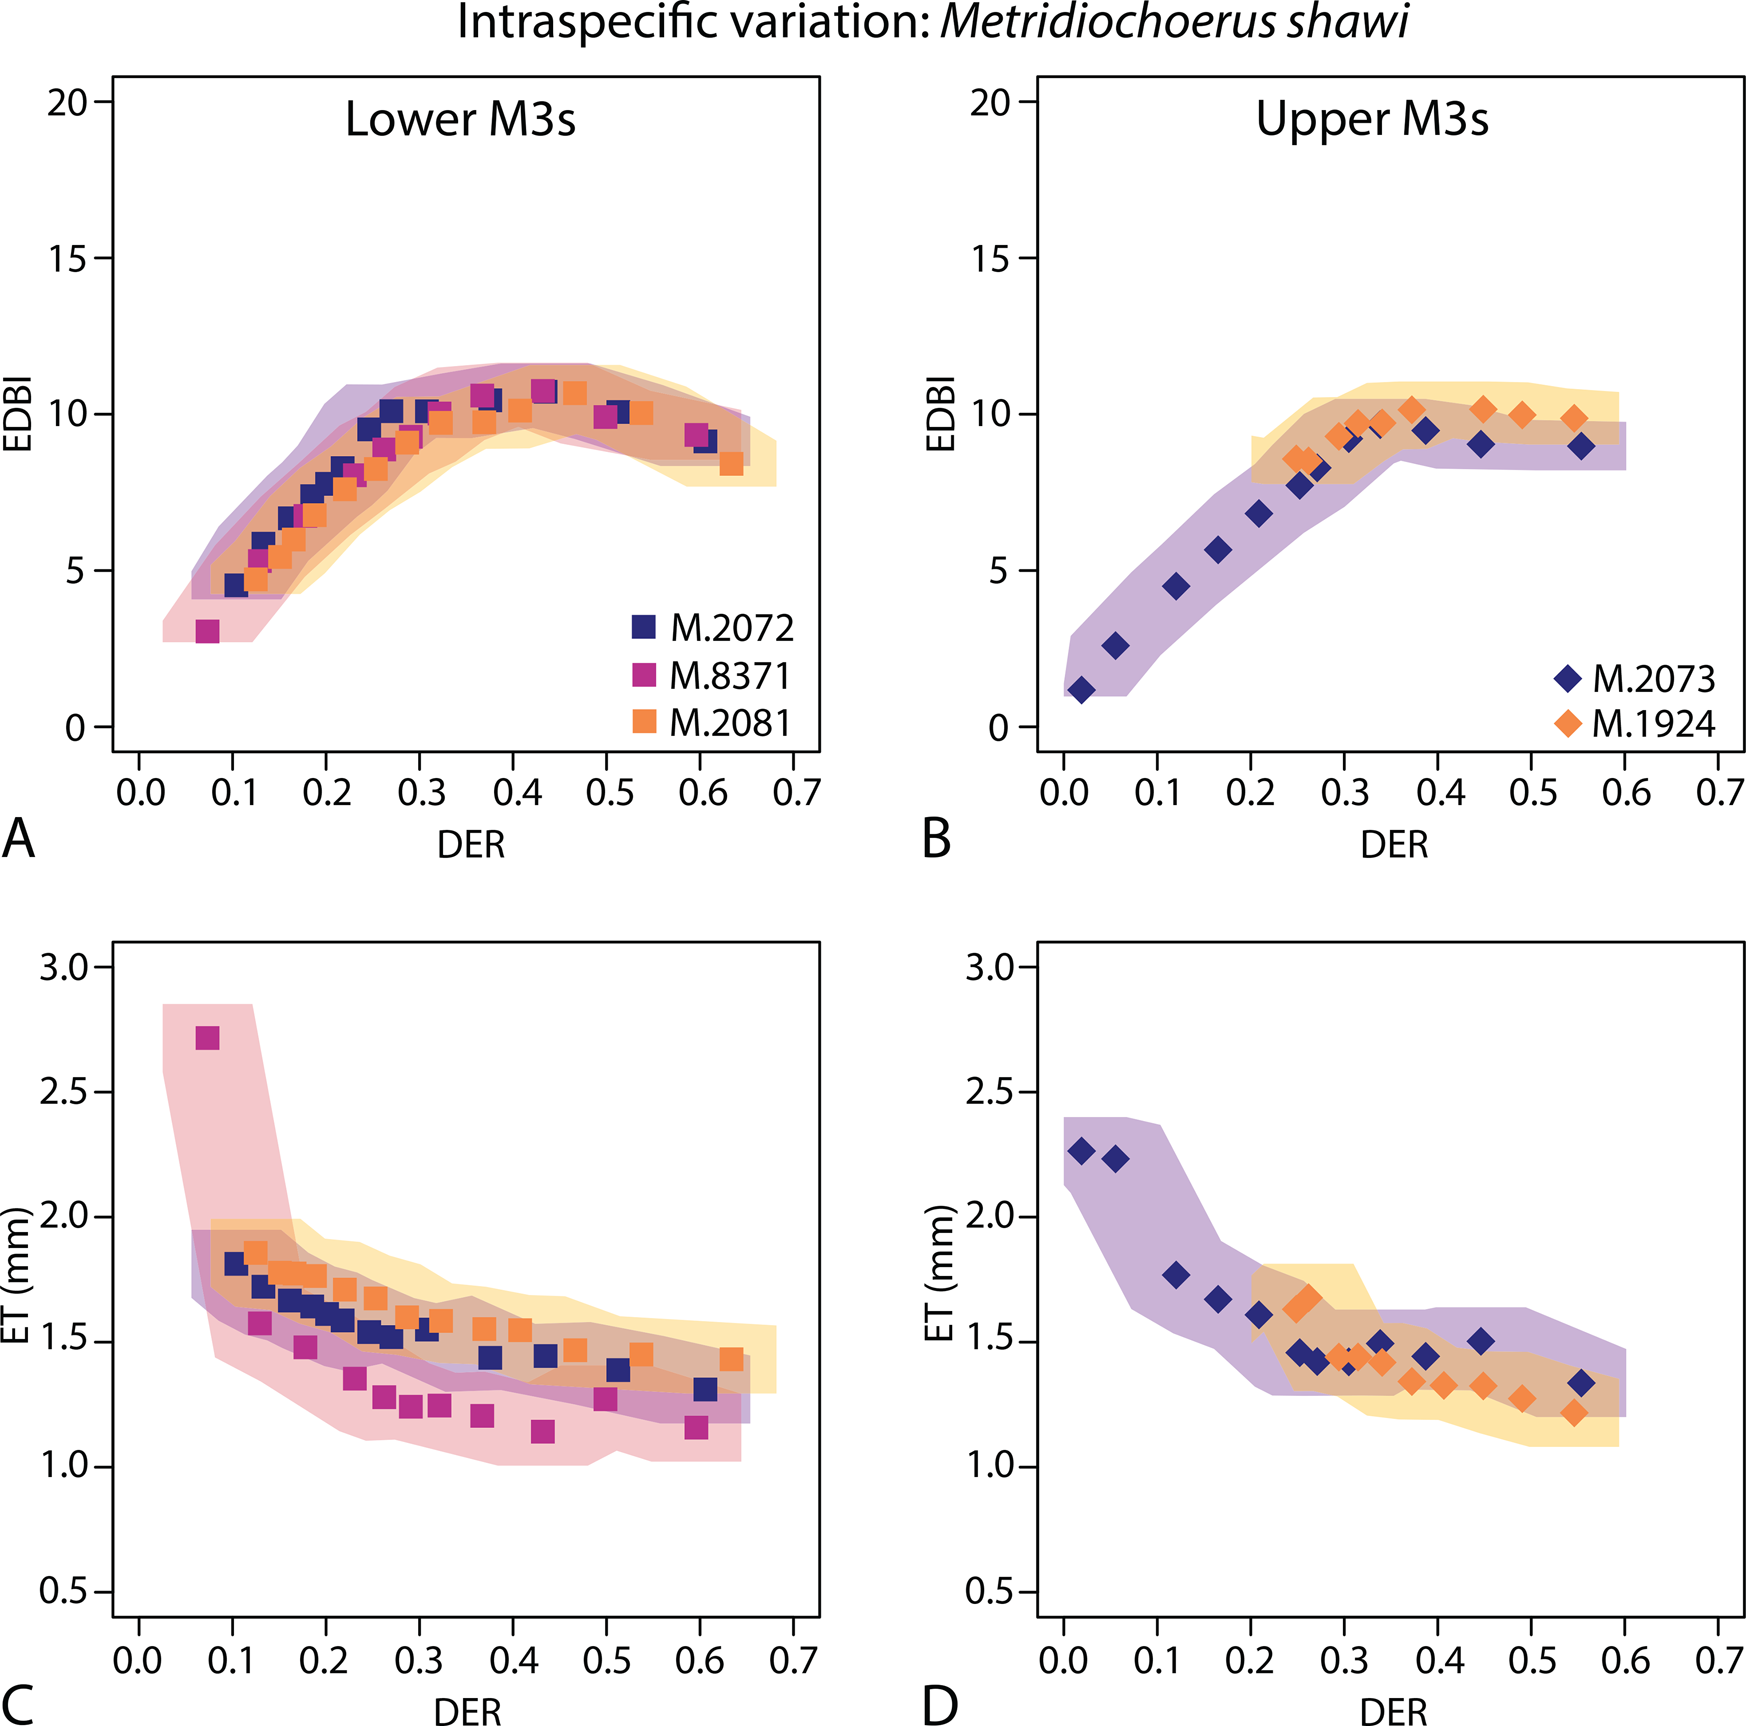
Investigating intraspecific variation of functional occlusal traits (EDBI in A and B, ET in C and D) using specimens of Metridiochoerus shawi from Makapansgat Member 3; results of lower third molars are in the left column (A, C); results of upper third molars are in the right column (B, D); shaded areas represent confidence limits of data points using the highest margins of error in Table 2; note that high values of enamel thickness are recorded in very early stages of dental wear, likely due to the fact that the enamel–dentine junction at the tip of the cusp(id)s is less perpendicular to the simulated occlusal surface, resulting in exaggerated enamel thickness values; DER, dentine exposure ratio; EDBI, enamel–dentine boundary index; ET, enamel thickness.
Comparing the correlations between third molar elongation (marked by the number of main pillars; Table 1) and occlusal enamel complexity (EDBI) in the three studied fossil suid lineages (A, Kolpochoerus; B, Notochoerus; C, Metridiochoerus); shaded areas represent confidence limits of data points ± the highest margins of error in Table 2; DER, dentine exposure ratio; EDBI, enamel–dentine boundary index.

Comparing the correlations between third molar elongation (marked by the number of main pillars; Table 1) and occlusal enamel thickness (ET) in three studied fossil suid lineages (A, Kolpochoerus; B, Notochoerus; C, Metridiochoerus); shaded areas represent confidence limits of data points ± the highest margins of error in Table 2; DER, dentine exposure ratio.
Among the five Metridiochoerus shawi specimens from Makapansgat, the wear trajectories of occlusal enamel complexity (EDBI) show substantial overlap among lower M3s, among upper M3s, and between upper and lower M3s (Fig. 3). In comparison, the wear trajectories of enamel thickness are more variable among specimens but show some degree of overlap.
For EDBI, Notochoerus and Metridiochoerus occupy a similar wear space, showing a maximum EDBI between 10 and 18 (Fig. 4), while Kolpochoerus has consistently lower occlusal enamel complexity values (< ~9; Fig. 4), which is similar to that of Sus scrofa (Appendix 1, Supplementary Material). In both Notochoerus and Metridiochoerus lineages, added pillars in geologically younger specimens correspond to higher maximum occlusal enamel complexity than in early members. Metridiochoerus compactus, the youngest member of the lineage, occupies a similar morphospace as No. scotti, the terminal member of the Notochoerus lineage (Fig. 4). Remarkably, the Metridiochoerus lineage achieved a similar range of maximum occlusal enamel complexity as the Notochoerus lineage with fewer pillars (Fig. 4). By contrast, Kolpochoerus displays almost no trend of increased maximum enamel complexity. Instead, added pillars seem to correspond to a more abrupt increase in enamel complexity in early wear stages, which leads to an earlier achievement of maximum complexity as dental wear progresses (Fig. 4).
For enamel thickness, specimens of the Kolpochoerus lineage generally have thicker enamel in all wear stages compared with contemporaneous Notochoerus and Metridiochoerus spp., while the latter two occupy a similar morphospace. One specimen of the Kolpochoerus lineage (Shaw & Cooke 30, dated at ca. 0.4 Ma) exhibits lower enamel thickness values in the early wear stages, but all specimens converge on a similar thickness in mid- to late wear stages (Fig. 5). The two Kolpochoerus specimens younger than 1.8 Ma display a minimal decrease in enamel thickness as dental wear progresses. Notochoerus scotti has significantly thinner enamel compared with Notochoerus euilus, but No. euilus displays a minimal decrease in enamel thickness as dental wear progresses (Fig. 5). Metridiochoerus shawi and Metridiochoerus andrewsi display similar thickness patterns, while M. compactus has significantly thinner enamel than M. shawi and M. andrewsi. Metridiochoerus compactus also exhibits a minimal decrease in enamel thickness as dental wear progresses (Fig. 5). In general, an increase in M3 crown length is associated with similar patterns of change in enamel complexity and enamel thickness in Notochoerus and Metridiochoerus lineages over time, while the pattern is different in the Kolpochoerus lineage.
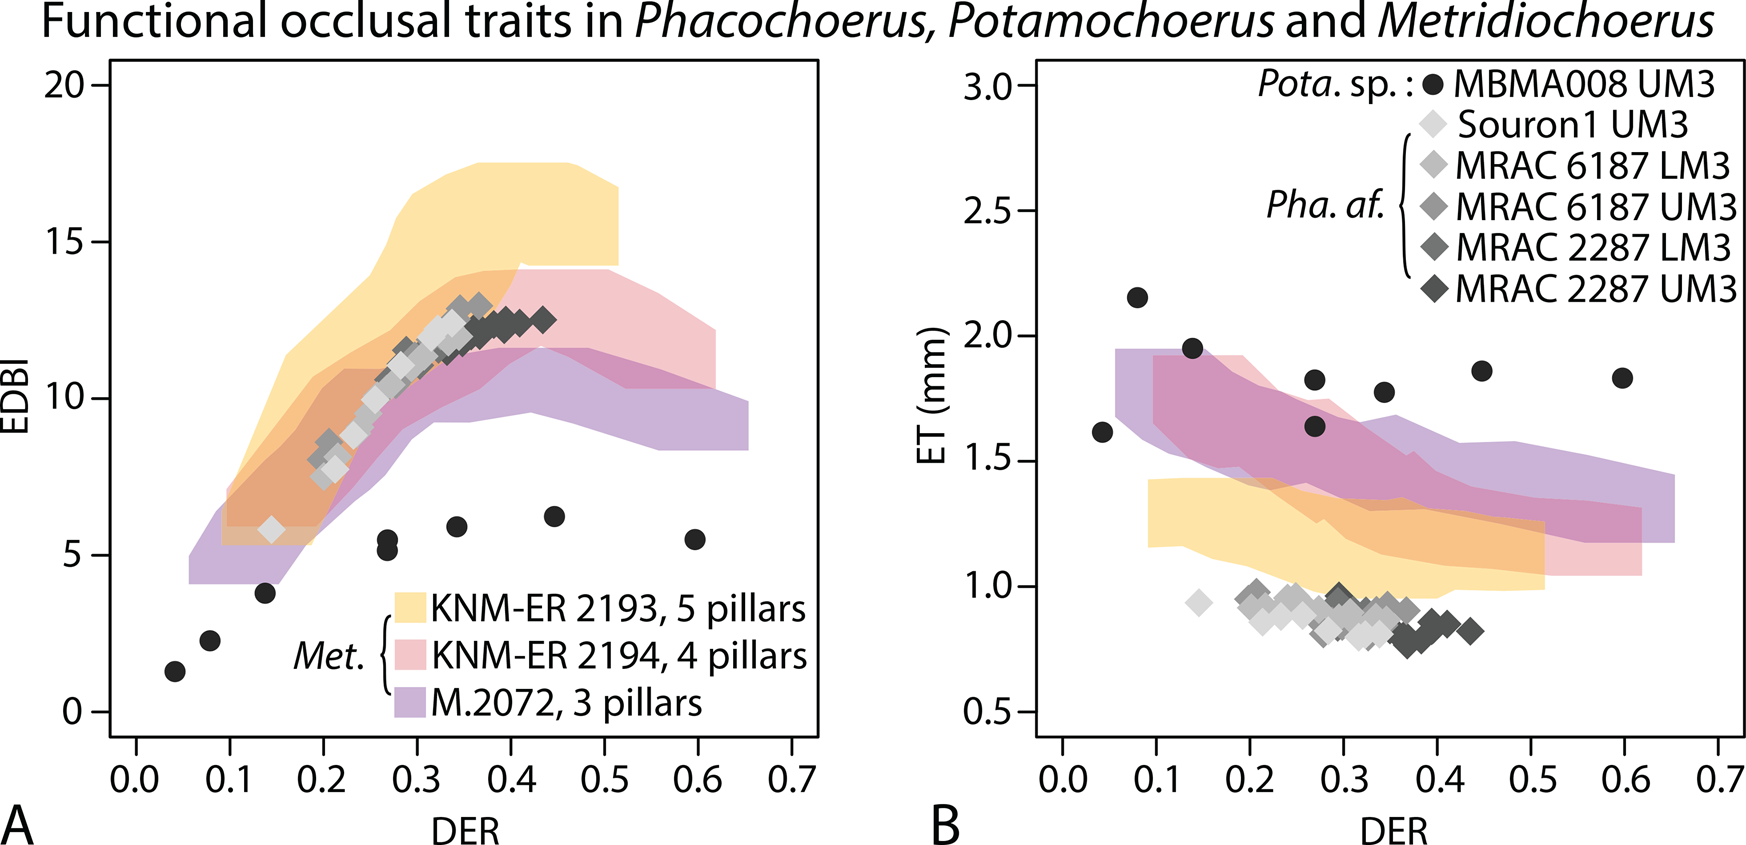
When comparing the EDBI values of extant Phacochoerus africanus and Plio-Pleistocene Metridiochoerus, those of Ph. africanus fall within the morphospace of M. andrewsi with four primary pillars. On the other hand, they display the thinnest enamel among all the suid specimens examined in this study (Fig. 6). Potamochoerus displays the lowest EDBI values (enamel complexity) and the thickest enamel among all the specimens examined (Fig. 6).
Comparing functional occlusal traits (EDBI in A, ET in B) of extant Phacochoerus africanus, Pleistocene Potamochoerus sp., and Plio-Pleistocene Metridiochoerus (Supplementary Table 7); Potamochoerus sp. is characterized by a generalized suid dentition (short and brachydont M3s), compared with dedicated grass eaters with specialized dentition such as Phacochoerus and Metridiochoerus; gray diamonds represent results of Phacochoerus africanus (Pha. af.); black filled circles represent results of Potamochoerus sp. (Pota. sp.); colored shades represent the confidence limits of the results of Metridiochoerus (Met.), as shown in Figs. 4 and 5.
Discussion
Assumptions in Quantifying Functional Occlusal Traits
Our method of simulating dental wear using micro-CT data is associated with several important assumptions. First, the occlusal surface is assumed to be completely flat, which corresponds to the assumption that dental abrasion is the primary cause of wear (Fortelius and Solounias Reference Fortelius and Solounias2000; Karme et al. Reference Karme, Rannikko, Kallonen, Clauss and Fortelius2016). For species with higher occlusal relief and non-flat occlusal topography, our measurement of occlusal enamel complexity (EDBI) likely underestimates the shearing capability of the true occlusal surface, especially at earlier wear stages. This bias applies to species that display non-flat occlusal topography in the M3s in early wear stages, such as in Kolpochoerus spp. and Notochoerus euilus (Rannikko et al. Reference Rannikko, Adhikari, Karme, Žliobaitė and Fortelius2020). On the other hand, our results also suggest that enamel complexity reaches a maximum value or a plateau when the M3s are moderately worn (DER between 0.3 and 0.5). At this moderate wear stage, Rannikko et al. (Reference Rannikko, Adhikari, Karme, Žliobaitė and Fortelius2020) have observed that most species display relatively flat occlusal topography and low occlusal relief. Therefore, EDBI computed from simulated “occlusal” surfaces from micro-CT slices is likely less biased in representing the functionality of the occlusal surface in moderate and late stages of dental wear than in the early stage.
Second, our measurement of occlusal area excludes coronal cementum that is present in most fossil suid species. Coronal cementum was included by Rannikko et al. (Reference Rannikko, Adhikari, Karme, Žliobaitė and Fortelius2020) in their study of dental topographic features as dietary indicators, using extant suids (Phacochoerus and Hylochoerus) as reference species. We excluded coronal cementum from this analysis due to inconsistency in the preservation of coronal cementum among fossil specimens. We have also observed that coronal cementum is poorly preserved in isolated M3s, while it is often well preserved in specimens that are still in alveoli, due to the protection from the dentary or maxillary bones. Therefore, including coronal cementum in the analysis can introduce unnecessary noise due to the inconsistency derived from variable preservation states.
Third, all simulated “occlusal surfaces” are assumed to be perpendicular to the second pair of pillars in the M3s, to maximize the repeatability of the virtual simulation. However, it has been observed that as dental wear progresses, the eruption of the M3s is more rapid toward the distal end, resulting in a gradual rotation of the M3 cervix and a decrease in the angle between the cervical plane and the occlusal surface, especially in Notochoerus and Metridiochoerus (Shaw Reference Shaw1939; Harris and White Reference Harris and White1979; Kullmer Reference Kullmer1999). Our sensitivity test using arbitrarily tilted slices suggests that changing the slice angle does introduce deviations from the reference values, but the deviations fall within the confidence limit of our reported pattern (Appendix 1, Supplementary Material). While our reported patterns may deviate from the true patterns of functional change on the occlusal surface (more discussions in Appendix 1, section 5, Supplementary Material), we are still confident in our interpretation that the primary contributor to the striking difference in EDBI within the Notochoerus and Metridiochoerus lineages, respectively, is the degree of M3 elongation (number of main pillars) and the enamel folding pattern of the enamel–dentine junction. In addition, this study establishes the measurements for functional occlusal traits that can be expanded to widely available digital sources such as occlusal photographs.
Finally, our proxy for dental wear progression (DER) disregards the interplay between crown height and dental wear rate and assumes, in order to focus on selective forces related to short-term energetic return, that the life spans of the M3s are proportional among species. However, dental wear is known to be influenced by multiple factors, including ingesta properties (e.g., Baker et al. Reference Baker, Jones and Wardrop1959; Fortelius and Solounias Reference Fortelius and Solounias2000; Lucas et al. Reference Lucas, Turner, Dominy and Yamashita2000; Xia et al. Reference Xia, Zheng, Huang, Tian, Chen, Zhou, Ungar and Qian2015; Karme et al. Reference Karme, Rannikko, Kallonen, Clauss and Fortelius2016; Martin et al. Reference Martin, Winkler, Tütken, Codron, de Cuyper, Hatt and Clauss2019), enamel thickness (e.g., Molnar and Gantt Reference Molnar and Gantt1977; Pérez-Barbería and Gordon Reference Pérez-Barbería and Gordon1998; Lucas Reference Lucas2004; Lucas et al. Reference Lucas, Constantino, Wood and Lawn2008), and enamel microstructure (Rensberger and von Koenigswald Reference Rensberger and von Koenigswald1980; Fortelius Reference Fortelius1985; Pfretzschner Reference Pfretzschner, Russel, Santoro and Sigogneau-Russell1986; von Koenigswald and Clemens Reference von Koenigswald and Clemens1992; Maas and Dumont Reference Maas and Dumont1999; Bajaj and Arola Reference Bajaj and Arola2009). These factors could influence the rate of dental wear progression, potentially contributing to long-term reproductive success. For instance, thicker enamel has been argued to be more resilient to dental wear (e.g., Janis and Fortelius Reference Janis and Fortelius1988; Lucas et al. Reference Lucas, Constantino, Wood and Lawn2008), which can theoretically extend the life span of the tooth, contributing to an individual's long-term reproductive success. We interpret our results of enamel complexity and thickness primarily in the framework of chewing mechanism and occlusal functionality (more discussions in “M3 Elongation and Its Correlations with Functional Occlusal Traits”). Future studies that investigate the possible interactions between crown height, functional occlusal traits, and enamel microstructure will provide a more comprehensive picture of the selective forces in herbivore dietary ecology.
Proxies for Occlusal Complexity and Its Relationship with Diet
Two-dimensional occlusal complexity as a functional trait has been investigated in two major ways among rodents, ruminants, equids, and suids (Schmidt-Kittler Reference Schmidt-Kittler1984, Reference Schmidt-Kittler2002; Kullmer Reference Kullmer1999; Famoso et al. Reference Famoso, Feranec and Davis2013; Gailer and Kaiser Reference Gailer and Kaiser2014). One way to quantify enamel complexity is known as structural density, D, which indicates the degree of folding in the enamel bands (Schmidt-Kittler Reference Schmidt-Kittler1984). The other way is to quantify the length of enamel band per unit area of the occlusal surface (“OEI” as in Famoso et al. Reference Famoso, Feranec and Davis2013). Our measurement is a slight modification of the latter, using the length of the enamel–dentine boundary (EDB, or the occlusally exposed enamel–dentine junction) on the simulated occlusal surface instead of the length of the enamel band. We chose this measurement over the previously established ones for the following reasons. First, both structural density D and OEI describe a similar geometric relationship between the length of the enamel band and the area that is enclosed by the enamel band. The two measurements are essentially correlated but with slightly different assumptions (see further discussion in Appendix 1, section 8, Supplementary Material). For example, structural density D is efficient in detecting enamel folding in a single cusp(id)/pillar (Kullmer Reference Kullmer1999; Schmidt-Kittler Reference Schmidt-Kittler2002), but not sensitive in accounting for repeated patterns, such as multiple pillars in suid M3s (Schmidt-Kittler Reference Schmidt-Kittler2002). Second, suid M3s experience substantial changes in occlusal enamel pattern at different wear stages (e.g., Kullmer Reference Kullmer1999). As a result, the apparent enamel thickness of the occlusal surface also becomes variable at different wear stages. These features make it difficult to quantify the length of the enamel band consistently (as in Famoso et al. Reference Famoso, Feranec and Davis2013), because a substantial difference exists between the outer perimeter and inner perimeter of the occlusal enamel band. For this reason, we chose to quantify the outer and inner perimeters separately (see “Materials and Methods” section). Third, the EDB has been associated with shearing mechanisms on the occlusal surface in many herbivores (Rensberger Reference Rensberger1973; Schmidt-Kittler Reference Schmidt-Kittler1984, Reference Schmidt-Kittler2002; Archer and Sanson Reference Archer and Sanson2002; Kaiser Reference Kaiser2002; Gailer and Kaiser Reference Gailer and Kaiser2014; Schultz et al. Reference Schultz, Engels, Schwermann, Koenigswald, Martin and Koenigswald2020). In particular, we have observed that the angle of the enamel edge at the EDB is sharper than that of the outer enamel edge in both extant and fossil suids, which theoretically creates higher puncture pressure or occlusal stress for breaking down fibrous plant tissue (Popowics and Fortelius Reference Popowics and Fortelius1997; Archer and Sanson Reference Archer and Sanson2002; Schmidt-Kittler Reference Schmidt-Kittler2002). Finally, measuring EDB length is consistent and repeatable using micro-CT data, because identifying the EDB is straightforward due to the difference in radiodensity between enamel and dentine. This pattern may not always persist due to taphonomic modifications during fossilization (Appendix 1, section 4, Supplementary Material), but in our case, all specimens presented here exhibit a clear difference in radiodensity between enamel and dentine (Fig. 2).
One substantial challenge in investigating suid M3s is the effect of dental wear progression on the morphology of the occlusal surface (Kullmer Reference Kullmer1999), which makes quantitative assessments of occlusal traits difficult. Kullmer (Reference Kullmer1999) carried out the first comprehensive morphometric investigation of the geometric relationships between occlusal enamel complexity and dental wear in the mesial-most two pairs of pillars of fossil and extant suid M3s. In comparison, we investigated the functional implications of M3 crown elongation on the entire occlusal surface in the context of suid evolution. We also analyzed the evolutionary trend of enamel thickness in the context of occlusal complexity (discussed further in “Enamel Thickness”).
Three-dimensional occlusal features, such as dental topographic parameters, have been widely used in primates, distinguishing dietary groups such as omnivores, folivores, frugivores, and insectivores (Ungar and M'Kirera Reference Ungar and M'Kirera2003; Evans et al. Reference Evans, Wilson, Fortelius and Jernvall2007; Boyer Reference Boyer2008; Bunn and Ungar Reference Bunn and Ungar2009; Bunn et al. Reference Bunn, Boyer, Lipman, St Clair, Jernvall and Daubechies2011). Rannikko et al. (Reference Rannikko, Adhikari, Karme, Žliobaitė and Fortelius2020) carried out the first comprehensive study of 3D occlusal complexity in extant and fossil suids and successfully distinguished dietary groups such as omnivores, mixed feeders, and grazers. The estimated diets for fossil suids in Rannikko et al. (Reference Rannikko, Adhikari, Karme, Žliobaitė and Fortelius2020) are broadly consistent with previous interpretations from dental and postcranial morphology, stable isotopes, and microwear texture analyses (Cooke and Wilkinson Reference Cooke, Wilkinson, Maglio and Cooke1978; Kullmer Reference Kullmer1999; Harris and Cerling Reference Harris and Cerling2002; Bishop et al. Reference Bishop, King, Hill and Wood2006; Cerling et al. Reference Cerling, Andanje, Blumenthal, Brown, Chritz, Harris, Hart, Kirera, Kaleme and Leakey2015; Souron et al. Reference Souron, Merceron, Blondel, Brunetière, Colyn, Hofman-Kamińska and Boisserie2015b; Souron Reference Souron, Melletti and Meijaard2017; Lazagabaster Reference Lazagabaster2019). In the context of diet and dental wear, dental topographic analyses correlate surface features created by dental macrowear and the species’ actual diet, which are indicators of the realized diet of a species (e.g, Fortelius and Solounias Reference Fortelius and Solounias2000). In comparison, evolutionary trends in 2D complexity reflect how dental morphometrics changed as a result of diet-related selective forces. While our study does not address diet directly, we discuss the evolutionary trends of dental functional traits in the context of suid dietary ecology, informed by multiple lines of evidence that are generally independent of morphology (see discussion in “Evolution of Occlusal Traits in the Context of Fossil Suid Dietary Ecology”). It is also worth noting that evolutionary trends or functional interpretations of dental traits may not be consistent with the realized diet of a species, as behavioral adaptations can often mitigate some morphological constraints (e.g., Lister Reference Lister2013, Reference Lister2014; Gailer et al. Reference Gailer, Calandra, Schulz-Kornas and Kaiser2016; Souron Reference Souron, Melletti and Meijaard2017).
Our study also underlines the importance of quantifying dental wear in studies of occlusal features such as dental topography (as in Rannikko et al. Reference Rannikko, Adhikari, Karme, Žliobaitė and Fortelius2020). Without reference to dental wear progression, some dental topographic values could vary between specimens of different wear stages (e.g., Bunn and Ungar Reference Bunn and Ungar2009; Pampush et al. Reference Pampush, Spradley, Morse, Harrington, Allen, Boyer and Kay2016), potentially influencing the interpretability of topographic data. Future dental topographic studies that investigate the morphological or morphometrical diversity and dietary indications of worn teeth would benefit from quantifying dental wear progression for more consistent interpretations.
Enamel Thickness
Unlike EDBI, our proxy for occlusal enamel thickness is not scaled by the square root of M3 occlusal area. We chose to present the “absolute” enamel thickness data instead of relative enamel thickness, primarily due to the observed evolutionary trend of M3 elongation, which would possibly lead to a biased interpretation of decreased enamel thickness over time. Alternatively, relative enamel thickness can be calculated as “absolute” enamel thickness divided by M3 width at the cervix, which is theoretically not affected by M3 elongation. When relative thickness is calculated as such, the general evolutionary pattern is similar to that of the “absolute” enamel thickness (Supplementary Fig. 2).
Both the Notochoerus and Metridiochoerus lineages exhibited an increase in enamel complexity but a decrease in enamel thickness over time. It is possible that the increase in enamel complexity is correlated with the thinning of enamel in these lineages. A similar correlation has been found in the evolution of Elephantidae, in which an increase in the plate number and the crown height of the M3s are associated with a decrease in enamel thickness (Maglio Reference Maglio1972, Reference Maglio1973; Ferretti Reference Ferretti2003). This correlation has been explained as a solution to optimize occlusal stress in the shearing mechanism on the occlusal surface (Ferretti Reference Ferretti2003). Our results support this explanation: as enamel complexity increases, the contact area between upper and lower teeth also increases, which would decrease the occlusal stress if enamel thickness remains the same. This would require an increase in masticatory muscle forces to achieve the same occlusal stress to break down tough and fibrous materials. However, an increase in masticatory muscle forces would require substantial restructuring of the masticatory apparatus to permit a larger muscle volume. Assuming that the body size of the animal remains the same, an increase in masticatory muscle forces indicates more energy expenditure in food processing, which would lead to a lower net energetic return for the same amount of food. Alternatively, if enamel thickness decreases, the same occlusal stress can be achieved without any increase in masticatory muscle forces, while the increase in enamel complexity alone can contribute to a higher chewing efficiency. Thinner enamel, however, is at the cost of a higher dental wear rate (Rensberger Reference Rensberger1973; Janis and Fortelius Reference Janis and Fortelius1988), which can explain why a decrease in enamel thickness is frequently associated with an increase in crown height in both suids and elephants (Maglio Reference Maglio1972, Reference Maglio1973; Harris and White Reference Harris and White1979). The way that enamel thickness is associated with both occlusal shearing capability and crown height may have further implications for the evolutionary patterns of dental morphology/morphometrics in other mammalian herbivores.
M3 Elongation and Its Correlations with Functional Occlusal Traits
We observed two distinct patterns in which higher shearing capability can be achieved by M3 elongation among fossil suids. M3 elongation in Kolpochoerus allowed a steeper increase in complexity during early wear stages and maintained maximum complexity for a longer life span of the tooth, whereas M3 elongation in Notochoerus and Metridiochoerus enabled higher maximum complexity. Both patterns increase the “area under the curve” in the wear space for enamel complexity, which can be interpreted as a higher “lifetime” shearing capability. However, the two distinct patterns suggest that M3 elongation influences the functionality of the occlusal surface in different ways. One fundamental distinction of the Kolpochoerus lineage is its much lower crown height compared with Metridiochoerus and Notochoerus, which is probably associated with almost no effect of M3 mesial drift compared with more hypsodont taxa. The combination of a lower crown and a minimal mesial drift allows most cusp(id)s/pillars to be worn in an early wear stage, which explains the pattern of a steeper increase in complexity during early wear stages. In comparison, the pillars in the M3s of the hypsodont taxa are constructed like an escalator: the mesial pillars come into occlusion first, followed by more distal pillars as dental wear progresses and the tooth slowly moves mesially. Although M3 elongation has been associated with the delayed dental eruption and dental mesial drift mechanisms in Phacochoerus and Hylochoerus (Janis and Fortelius Reference Janis and Fortelius1988), it seems to have functioned differently in the Kolpochoerus lineage. Further investigations into the interplay between dental eruption, wear, hypsodonty, and M3 elongation will help to improve our understanding of their functional significance.
Our results support the hypothesis that adding more cusp(id)s/pillars to the distal end of the M3s increases the theoretical shearing capability of the M3 occlusal surface, potentially permitting more efficient comminution of fibrous vegetation (Souron Reference Souron, Melletti and Meijaard2017). However, they only apply to the M3s, whereas it is possible that as dental wear progresses, the functionality of the worn mesial cheek teeth is replaced by added cusp(id)s/pillars in the M3s with the mesial drift mechanism (Shaw Reference Shaw1939; Cooke and Wilkinson Reference Cooke, Wilkinson, Maglio and Cooke1978; Janis and Fortelius Reference Janis and Fortelius1988). It is worth noting that our methods could be easily adapted to occlusal photographs that capture different stages of dental wear on the entire tooth row in both extant and fossil herbivorous mammals. This approach also has great potential for collaborative research on a low budget, as numerous occlusal photographs have already been taken by many researchers.
Another way to evaluate the evolutionary trend in enamel complexity would be to scale the length of the occlusal shearing crests of the entire tooth row with body size instead of occlusal area. Body size is known to correlate with many diet-related physiological and morphological features such as basal metabolic rate (e.g., Kleiber Reference Kleiber1947), tooth size (e.g., Creighton Reference Creighton1980; Fortelius Reference Fortelius1985), and even chewing rate (e.g., Virot et al. Reference Virot, Ma, Clanet and Jung2017; Žliobaitė and Fortelius Reference Žliobaitė and Fortelius2018). The incentive of investigating such a scaling relationship would be to examine M3 elongation and its relationship with the evolution of functional occlusal traits in the context of an animal's physiological limits instead of dental geometry, which is more aligned with our framework of discussions in the short-term versus long-term benefits. Unfortunately, to our knowledge, no reliable body-size estimation method based on dental or osteological metrics has been established for the suid body plan.
Evolution of Occlusal Traits in the Context of Fossil Suid Dietary Ecology
We discussed M3 elongation and its correlations with functional occlusal traits with an explicit assumption that these traits are adaptive. In this case, our discussion of short-term energetic return and long-term reproductive success can distinguish selective pressures at different timescales. Theoretically, natural selection acting on an individual's immediate energetic return also has influences on its long-term reproductive success: when its short-term energetic needs are not met, there is no guarantee that long-term reproductive success will be achieved, as premature death can also be caused by diseases or predation (e.g., Brown et al. Reference Brown, Marquet and Taper1993; Sinclair and Arcese Reference Sinclair and Arcese1995; Chandra Reference Chandra1996; Demas Reference Demas2004; Parsons Reference Parsons2005). On the flip side, reproduction is energetically costly: without being in a good energetic state, there is no guarantee that enough energy can be spared to invest in reproduction and in caring for offspring (e.g., Gittleman and Thompson Reference Gittleman and Thompson1988; Bronson Reference Bronson1989; Wade et al. Reference Wade, Schneider and Li1996; Jönsson Reference Jönsson1997; Schneider Reference Schneider2004). Therefore, it is reasonable to assume that morphological, physiological, and behavioral traits that can improve an individual's short-term energetic return would have more profound effects than traits that can only improve long-term reproductive success. This scenario applies to the context of dental morphology as well as dietary ecology. After all, the primary function of herbivore teeth is to process vegetation, not to tolerate dental wear (Janis and Fortelius Reference Janis and Fortelius1988).
The shared evolutionary trends of increased hypsodonty and M3 elongation suggest that a high dental wear rate was a common and strong selective pressure among all fossil suid lineages included in this study. Indeed, contemporaneous and sympatric species of Plio-Pleistocene suids in eastern Africa showed high proportions of C4 grasses in their diets, placing them close to the dietary range of dedicated grazers such as equids and alcelaphin bovids (e.g., Bibi et al. Reference Bibi, Souron, Bocherens, Uno and Boisserie2013; Cerling et al. Reference Cerling, Andanje, Blumenthal, Brown, Chritz, Harris, Hart, Kirera, Kaleme and Leakey2015; Uno et al. Reference Uno, Rivals, Bibi, Pante, Njau and de la Torre2018; Patterson et al. Reference Patterson, Braun, Allen, Barr, Behrensmeyer, Biernat, Lehmann, Maddox, Manthi, Merritt, Morris, O'Brien, Reeves, Wood and Bobe2019). In this context, the developmental and genetic mechanisms of increase in M3 crown height, M3 elongation, and delayed dental eruption sequence in suids are less constrained than in other herbivores (e.g., Monson et al. Reference Monson, Boisserie, Brasil, Clay, Dvoretzky, Ravindramurthy, Schmitt, Souron, Takenaka, Ungar, Yoo, Zhou, Zuercher and Hlusko2019). Only a few other mammalian groups, such as proboscideans and rodents, display a combination of delayed dental eruption, molar hypsodonty, and crown elongation (Maglio Reference Maglio1972, Reference Maglio1973; Janis and Fortelius Reference Janis and Fortelius1988; Gomes Rodrigues et al. Reference Gomes Rodrigues, Marangoni, Šumbera, Tafforeau, Wendelen and Viriot2011).
Despite the shared evolutionary trends, our results show that in the Kolpochoerus limnetes–Kolpochoerus paiceae lineage, M3 elongation did not correspond to a substantial increase in maximum occlusal enamel complexity or a substantial decrease in enamel thickness. The pattern suggests that in the investigated species of the Kolpochoerus lineage, the amount of selective pressure on occlusal traits for short-term energetic return was smaller than in investigated species of the Notochoerus and Metridiochoerus lineages. On the other hand, in both the Notochoerus and Metridiochoerus lineages, M3 elongation correlates with increased maximum occlusal enamel complexity and decreased enamel thickness. The striking similarity in the evolutionary trends suggests that the amount of selective pressure on occlusal traits was likely large and similar in both lineages. These interpretations further suggest that the Kolpochoerus lineage probably occupied a different ecological niche than those of Notochoerus and Metridiochoerus, whereas the latter two likely experienced some degree of niche overlap.
Interpreting the paleoecology of Kolpochoerus has been contentious primarily due to the somewhat inconsistent results from multiple lines of evidence. Stable carbon isotope analysis of K. limnetes teeth from the Shungura (ca. 2.7–1.9 Ma) suggests a high proportion of C4 plants in the diet (Bibi et al. Reference Bibi, Souron, Bocherens, Uno and Boisserie2013; Negash et al. Reference Negash, Alemseged, Bobe, Grine, Sponheimer and Wynn2020), similar to that of Notochoerus and Metridiochoerus (Harris and Cerling Reference Harris and Cerling2002; Cerling et al. Reference Cerling, Andanje, Blumenthal, Brown, Chritz, Harris, Hart, Kirera, Kaleme and Leakey2015). Kolpochoerus specimens from the same time interval display consistent dental microwear textures similar to that of extant Phacochoerus, also suggesting a grassy diet (Bishop et al. Reference Bishop, King, Hill and Wood2006; M. Louail and G. Merceron, personal communication). Dental topographic analysis, however, suggests that K. limnetes in the Turkana basin had less abrasive diets than typical grass-feeding suids such as Metridiochoerus andrewsi and No. scotti (Rannikko et al. Reference Rannikko, Adhikari, Karme, Žliobaitė and Fortelius2020). One possibility of niche differentiation is that Kolpochoerus fed on different species of C4 plants or different plant parts compared with Notochoerus and Metridiochoerus (Bishop et al. Reference Bishop, King, Hill and Wood2006; Rannikko et al. Reference Rannikko, Žliobaitė and Fortelius2017). However, existing dietary proxies lack the differentiative power to support this possibility. Another possibility of niche differentiation is that Kolpochoerus preferred a different set of habitats compared with Notochoerus and Metridiochoerus. Kolpochoerus has been found to be more frequently associated with fluvial environments (Behrensmeyer Reference Behrensmeyer and Jolly1978), displaying lower enamel oxygen isotope values with a likely water-dependent physiology (Harris and Cerling Reference Harris and Cerling2002; Patterson et al. Reference Patterson, Braun, Allen, Barr, Behrensmeyer, Biernat, Lehmann, Maddox, Manthi, Merritt, Morris, O'Brien, Reeves, Wood and Bobe2019) and having postcranial ecomorphology indicative of less-open habitats (Bishop Reference Bishop, Bromage and Schrenk1999; Bishop et al. Reference Bishop, King, Hill and Wood2006). Our interpretation of the dental evolutionary patterns is aligned with the second possibility, as a more mesic habitat could explain the relaxed selective pressure on occlusal traits associated with the Kolpochoerus lineage.
In comparison, the paleoecological interpretations of the Notochoerus and Metridiochoerus lineages have been more consistent. For earlier species such as Notochoerus euilus, dental microwear texture analyses suggest that they were predominantly grass eaters (Lazagabaster Reference Lazagabaster2019), while dental topography and stable isotopes suggest that they were mixed feeders with an increase in dietary C4 over time (Cerling et al. Reference Cerling, Andanje, Blumenthal, Brown, Chritz, Harris, Hart, Kirera, Kaleme and Leakey2015; Rannikko et al. Reference Rannikko, Adhikari, Karme, Žliobaitė and Fortelius2020). For later species such as No. scotti and Metridiochoerus andrewsi/compactus, multiple lines of evidence, including their specialized dentition (e.g., Cooke and Wilkinson Reference Cooke, Wilkinson, Maglio and Cooke1978; Harris and White Reference Harris and White1979; Kullmer Reference Kullmer1999), stable isotopes (Harris and Cerling Reference Harris and Cerling2002; Cerling et al. Reference Cerling, Andanje, Blumenthal, Brown, Chritz, Harris, Hart, Kirera, Kaleme and Leakey2015), and flat dental topography (Rannikko et al. Reference Rannikko, Adhikari, Karme, Žliobaitė and Fortelius2020), support that both had predominantly grassy diets. Although there is no direct evidence to support their interspecific competition so far, our results suggest that M. compactus filled a similar ecological niche as No. scotti. Despite their similarities in the evolutionary trends of dental functional traits, we observed that higher enamel complexity is achieved in different ways in different lineages: Notochoerus increased the degree of folding within each single pillar, while the pillars stayed well separated into late wear stages, whereas Metridiochoerus increased the interconnectivity of the enamel bands among the pillars (Fig. 7). Such a difference is discernibly rooted in their distinct ancestries (see Appendix 1, section 1, Supplementary Material, for more information), whereby Notochoerus evolved from a tetraconodontine ancestor with well-defined individual pillars, while Metridiochoerus evolved from a suine ancestor with overall fewer constraints on the shape of the enamel–dentine junction, which manifests in a tendency of the pillars to fuse with each other as dental wear progresses. As a result, Metridiochoerus can reach a similar range of occlusal enamel complexity with fewer pillars (Fig. 4), which may indicate a reduced amount of dental tissue investment for a similar functionality. This theoretical advantage could explain the observation that as Metridiochoerus rose in relative abundance in the fossil record, Notochoerus experienced a rapid decline and eventually went extinct in the early Pleistocene (Patterson et al. Reference Patterson, Braun, Behrensmeyer, Merritt, Zliobaite, Reeves, Wood, Fortelius and Bobe2017; Rannikko et al. Reference Rannikko, Žliobaitė and Fortelius2017).
Comparing the enamel folding patterns of Notochoerus scotti (A, KNM-ER 1777, lower M3) and Metridiochoerus compactus (B, KNM-ER 2193, upper M3), when enamel complexity (EDBI) is at its highest value, respectively; No. scotti displays a high level of enamel folding within each pillar while the pillars are separated from each other; by contrast, M. compactus displays complex interconnecting patterns among the pillars.
Finally, it is important to note that the number of fossil specimens included in this study is small due to the limited availability of micro-CT data, which undoubtedly limits the interpretation of our results. Future studies that investigate the variation of functional occlusal traits with a larger number of fossil specimens while using this dataset as a reference will help further our understanding of the potential biases in the methods. This could also facilitate investigations into the evolutionary patterns of functional occlusal traits in the context of regional climate and vegetation, as well as the associated changes in faunal composition and their diets (Bobe et al. Reference Bobe, Behrensmeyer and Chapman2002; deMenocal Reference deMenocal2004; Cerling et al. Reference Cerling, Wynn, Andanje, Bird, Korir, Levin, Mace, Macharia, Quade and Remien2011; Bibi and Kiessling Reference Bibi and Kiessling2015; Cerling et al. Reference Cerling, Andanje, Blumenthal, Brown, Chritz, Harris, Hart, Kirera, Kaleme and Leakey2015; Uno et al. Reference Uno, Polissar, Jackson and deMenocal2016; Faith et al. Reference Faith, Rowan, Du and Koch2018). Nevertheless, our quantitative measurements can provide new dimensions in addition to conventional dental metrics such as M3 length and width, in which the morphological diversity of the occlusal surface can be documented and possibly distinguished among suid species or chronospecies.
Graminivory among Extant and Fossil Suids
The unique dental characteristics of warthogs (Phacochoerus spp.) are exceptional examples of their dietary specialization in grass feeding. While Phacochoerus seems to exhibit the same relative length of shearing crests (EDBI) as M. andrewsi (Fig. 6), the absolute spacing between the shearing crests is much smaller in Phacochoerus spp. (Ewer Reference Ewer1958). In addition, the pillars in M3s of Phacochoerus spp. remain detached over the majority of a tooth's life span (Shaw Reference Shaw1939), which is different from the increasingly interconnected pillars found in the M. andrewsi–M. compactus lineage (Harris and White Reference Harris and White1979). It has been proposed that the configuration of simple but high-density pillars in Phacochoerus spp. is a special adaptive trait for short grass feeding (Souron Reference Souron, Melletti and Meijaard2017), in which small mouthfuls of short grass can be efficiently comminuted with small and tightly packed pillars (Lucas Reference Lucas2004; Souron Reference Souron, Melletti and Meijaard2017). Notably, the body sizes of Phacochoerus spp. are much smaller compared with most Plio-Pleistocene Metridiochoerus. The differences in pillar configuration and body size between Phacochoerus spp. and Metridiochoerus suggest that feeding strategy and body-size differentiation are potential mechanisms of niche partitioning among Plio-Pleistocene grass-feeding suids such as Notochoerus and Metridiochoerus. In addition, this comparison further suggests that the M3s of No. scotti and M. compactus, which display even higher EDBI values than those of Phacochoerus africanus, are highly specialized. Such levels of specialization likely occurred independently, as there was no substantial temporal overlap between the two species (Patterson et al. Reference Patterson, Braun, Behrensmeyer, Merritt, Zliobaite, Reeves, Wood, Fortelius and Bobe2017; Rannikko et al. Reference Rannikko, Žliobaitė and Fortelius2017). The factors that drove the dental specialization in these species are still unresolved. Future studies would benefit from examining suid dental specialization in the context of body-size evolution and changes in the graminivore guild.
Conclusion
We found that third molar elongation increases the theoretical chewing efficiency of the occlusal surface in all lineages but observed two distinct patterns. The Notochoerus and Metridiochoerus lineages increased their maximum occlusal enamel complexity, while the Kolpochoerus lineage achieved a higher “lifetime” complexity by reaching maximum complexity early in the wear progression. In Notochoerus and Metridiochoerus, an increase in maximum occlusal enamel complexity possibly correlates with a decrease in average occlusal enamel thickness. This shared evolutionary trend suggests that Notochoerus and Metridiochoerus likely experienced similar selective pressures on short-term energetic return, which further suggests niche overlap based on existing dietary interpretations. By contrast, the Kolpochoerus lineage maintained its maximum enamel complexity and average enamel thickness, which indicates relaxed selective pressures on short-term energetic return and a different ecological niche. The result that Notochoerus scotti and Metridiochoerus compactus display even higher enamel complexity than extant warthogs suggests that they were highly specialized grass feeders. Our methods can provide a complementary line of evidence to the existing analyses of diet-related dental traits. They can be expanded to other herbivore lineages that also underwent morphological changes in response to tough and abrasive diets.
Acknowledgments
We are grateful to the National Commission for Science, Technology and Innovation (NACOSTI) and the Government of Kenya for granting us the permission to undertake this research project. We would like to thank A.-M. Moigne, A. Canevet, and É. Pubert for assistance with collecting and preparing the wild boar specimens. We thank M. Bouchet, D. Geraads, E. Gilissen, O. Hampe, K. Jakata, R. Ledevin, K. Mahlow, M. Marazanof, Z. Rahman, W. Wendelen, and B. Zipfel for their assistance with obtaining and processing micro-CT images. We thank F. K. Manthi, M. Muungu, F. Ndiritu, M. G. Leakey, and M. Kirinya for their assistance during project development. We thank K. Carlson, J. G. Fleagle, J. E. Lewis, and one anonymous reviewer for their comments and suggestions that helped to improve this article. This project was sponsored by a Sigma Xi Grant in Aid of Research, the College of Arts and Sciences of Stony Brook University, the Turkana Basin Institute, the LaScArBx (a research program of the Agence Nationale de la Recherche, ANR-10-LABX-52), the SYNTHESYS grant (DE-TAF-5741), and the Evolutionary Studies Institute of the University of the Witwatersrand. This research benefited from the scientific framework of the University of Bordeaux's IdEx Investments for the Future program/GPR Human Past.
Data Availability Statement
The data underlying this article are available in the article and in its online Supplementary Material, which is available on DRYAD at: https://doi.org/10.5061/dryad.tmpg4f510.


 Open access