


Irish teens have one of the highest rates of overweight and obesity in Europe(1). It is widely accepted that providing knowledge on healthy eating alone is not enough to change and sustain eating behaviours(Reference Tombor and Michie2,Reference Gill and Boylan3) . However, health promotion messages are one of the best, low-cost interventions available, with the potential to be highly cost effective when targeted at younger people(Reference Merkur, Sassi and McDaid4). To address this issue of obesity, it is important to find new ways to make healthy eating messages more effective and relevant to the target population. There is a need to understand more about what motivates and influences people to choose the foods they eat. Habits developed during adolescence tend to persist into adulthood, particularly in relation to eating behaviours(Reference Craigie, Lake and Kelly5). Therefore, addressing eating behaviours among teens may help support them to start making positive and healthy food choices during the stage in life where they are learning autonomy and beginning to form their own lifestyle habits(Reference Viner, Ozer and Denny6).
Irish teens currently consume more energy, higher levels of fat and lower levels of fibre than recommended(7−Reference Rippin, Hutchinson and Jewell9). A recent report on health behaviours among teens showed that only 23 % of Irish teens consume fruit and 21 % consume vegetables more than once a day, with girls and younger teens more likely to report daily fruit and vegetable consumption(Reference Költő, Gavin and Molcho10). However, several dietary changes have been observed in a recent research in Irish school-aged children, for example, decreases in salt and fat intakes between 2004 and 2019(11). This shows that some positive changes are occurring in Irish dietary intakes. Daily sweet and soft drink consumption has decreased slightly in Irish teens since 2014, but 21 % of teens still consume sweets daily and 7 % drink soft drinks daily(Reference Költő, Gavin and Molcho10). However, we do not fully understand the mechanisms influencing these recent positive changes. Whilst measuring dietary intake is a crucial aspect to understand diet and health, more work is needed to fully understand the elements affecting both how and why teens eat and what they eat, specifically regarding eating behaviours which make them more prone to obesity.
Much research in relation to food choices and eating behaviours in Irish teens has come from qualitative work, looking into the effects of the school environment(Reference Kelly, Callaghan and Molcho12,Reference Browne, Barron and Staines13) and other social, economic and time-related factors influencing food choices(Reference Browne, Barron and Staines13−Reference Stevenson, Doherty and Barnett17). Taste(14,Reference Fitzgerald, Heary and Nixon15) , price/convenience(Reference Fitzgerald, Heary and Nixon15,Reference Share and Stewart-Knox16) and social desirability(Reference Browne, Barron and Staines13,Reference Fitzgerald, Heary and Nixon15,Reference Stevenson, Doherty and Barnett17) are commonly noted factors influencing teen’s food choices. There are mixed findings in relation to knowledge and perceptions of healthy eating, whereby teens themselves feel that they have sufficient knowledge to make healthy food choices but struggle to do so within their food environment, whereas their corresponding adult figures believe knowledge alone is the key limiting factor in teen food choices(Reference Browne, Barron and Staines13). Furthermore, for teens, competing interests for taste and other sensory rewards take preference over the healthfulness of the food(Reference Stevenson, Doherty and Barnett17). Little research has focused on the specific motivations teens have towards healthy eating and the more internal considerations that occur when making food choices, such as choosing foods based on their surrounding environment, current mood or sensory expectations for the food.
Several questionnaires have been developed to classify and quantify the eating behaviour styles of population groups. The Dutch Eating Behaviour Questionnaire (DEBQ) is a commonly used tool to measure three styles of eating behaviour, namely emotional eating, restrained eating and external eating(Reference van Strien, Frijters and Bergers18). Emotional eating in this questionnaire refers to eating more than usual in response to predominantly negative emotions, restrained eating refers to actively avoiding certain foods in case they will make you gain weight or become fat, and external eating refers to eating in response to aspects such as the smell, taste or sight of food or being around others who are eating a certain type of food. This tool has been tested and validated in multiple populations(Reference Barrada, van Strien and Cebolla19−Reference Lluch, Kahn and Stricker-Krongrad25), including teen-aged groups(Reference Snoek, Engels and van Strien26−Reference Wardle, Marsland and Sheikh29). Sex and age differences appear consistently in the responses to the DEBQ questions(Reference Barrada, van Strien and Cebolla19,Reference Cebolla, Barrada and van Strien20,Reference Brunault, Rabemampianina and Apfeldorfer22,Reference Lluch, Kahn and Stricker-Krongrad25,Reference Snoek, van Strien and Janssens27−Reference Burton, Smit and Lightowler30) , as do differences between people of different BMI categories, with people of higher BMI showing higher scores on the Restraint and Emotional scales and lower scores on the External scale(Reference Barrada, van Strien and Cebolla19,Reference Brunault, Rabemampianina and Apfeldorfer22,Reference Caccialanza, Nicholls and Cena24−Reference Snoek, Engels and van Strien26,Reference Lluch, Herbeth and Mejean28,Reference Wardle, Marsland and Sheikh29) . Dietary intake associations have been reported, varying per scale. Most commonly, the Restraint scale tends to be associated with lower energy and nutrient intakes, the External scale associated with higher intakes and the Emotional scale varies in its associations(Reference Snoek, van Strien and Janssens27−Reference Wardle, Marsland and Sheikh29,Reference van Strien, Herman and Anschutz31) .
Numerous factors play a role in determining the eating behaviour styles of population subgroups, which highlights the importance of understanding how and why our teen population of interest eats. If we know more about the eating behaviour styles associated with overweight and obesity, we can work on targeting interventions more appropriately to encourage and support teens to establish positive diet and lifestyle habits early in life. The current research aims to describe and understand the eating behaviour styles of Irish teens, as determined by the three DEBQ categories. The main objectives of the current study were to describe the eating behaviour styles in the Irish teen cohort and to explore the relationships between demographic factors, BMI and dietary intake with these eating behaviour styles.
Methods
Survey methods
The analyses were conducted on data from the Irish National Teens’ Food Survey, a cross-sectional study that was carried out between September 2005 and September 2006 by the nutrition units in University College Cork and University College Dublin, which form part of the Irish Universities Nutrition Alliance (IUNA). The survey investigated habitual food and drink consumption, health and lifestyle characteristics and assessed body weight status of teenagers aged 13–17 years (224 males and 217 females) in Ireland. Participants were recruited with an opt-in approach from thirty-two secondary schools throughout the Republic of Ireland. The overall survey response rate was 63 %. The analysis of the demographic features of this sample has shown it to be a representative sample of the Irish teenagers with respect to age, sex, social class, socio-economic group and geographical location when compared with census data(32). Written informed consent was provided by the participants, as well as their parents/guardians. Further detail on the full survey methodologies is available at www.iuna.net (7).
Eating Behaviour Questionnaires
The Eating Behaviour Questionnaire was completed by the teens, and data from the DEBQ section were analysed in the current research. The DEBQ contains thirty-three items, which make up three scales(Reference van Strien, Frijters and Bergers18). The Restraint scale contains ten items and the questions relate to restraining or limiting the amount and type of food eaten to prevent gaining weight (e.g. Do you watch exactly what you eat? and Do you deliberately eat foods that are slimming?). The Emotional scale contains thirteen items and the questions relate to increased eating in response to predominantly negative emotions (e.g. Do you have a desire to eat when you are disappointed? and Do you have a desire to eat when someone lets you down?). The External scale contains ten items and the questions relate to outside factors which may encourage food consumption and appeal to the senses, such as the sight or smell of food, or physically being near food (e.g. If you see others eating, do you also have a desire to eat? and If food smells and looks good, do you eat more than usual?). All items are answered on a five-point Likert scale, with response options being Never, Seldom, Sometimes, Often or Very often. Mean scores are calculated by dividing the sum of responses by the number of items in the scale, the highest score being 5, making the three scales comparable. In some cases where an item was missing an answer, the sum of the scores was divided by the number of answers given. If >2 answers were missing, the data were excluded from the analysis. Scores were analysed on a continuous basis rather than being classified as high, medium or low scores.
Health and Lifestyle Questionnaires
Parents of the participants completed a self-reported Health and Lifestyle Questionnaire which included information on parental socio-economic status, education level and attitudes to their own diet. This questionnaire was administered to both parents and guardians when possible. The teen was assigned the higher social class and education level category of both parents and guardians.
Anthropometric measurements
Anthropometric measurements for the teen participants were taken by trained researchers during data collection visits. Weight was measured to the nearest 0·1 kg using a Seca 770 digital personal weighing scale (Chasmores Ltd). Height was measured to the nearest 0·1 cm using the Leicester portable height measure (Chasmores Ltd) with the respondent’s head positioned in the Frankfurt Plane. BMI was used to indirectly assess adiposity and was calculated as kg/m2. The International Obesity Task Force (IOTF) age- and sex-specific categories were used to define weight status(Reference Cole, Bellizzi and Flegal33). These cut-offs are linked to BMI cut-offs for adult populations and facilitate international comparisons and are recommended for children aged 2−18 years(Reference Cole, Bellizzi and Flegal33).
Dietary intake measurements
Dietary intake data were collected through a 7-d weighed food diary, with respondents weighing all food and beverages consumed using a portable food scales (Tanita). Other food quantification methods (e.g. food atlas photos and manufacturer’s information) were used where weighing was not possible, as outlined in the IUNA report(7). Nutrient intake data were generated using WISP (Tinuveil Software), with data from McCance and Widdowson’s The Composition of Food, along with newly generated recipes of composite dishes, supplements and generic Irish foods commonly consumed on the market(7).
Variables
The mean scores for each of the three eating behaviour scales were used as separate, continuous dependent variables in bivariate analyses. Independent variables included in the association analyses were chosen based on previous research and potential relevance to the eating behaviour styles. Associations were assessed using both correlation and comparative analyses.
Demographic
Sex and age are common factors associated with teen behaviours and were therefore included in the bivariate analysis and as principle factors in the stratified analysis. Age groups were classified as younger (13–14 years) and older (15–17 years), as determined by the National Teens’ Food Survey protocol(7). Geographical location variables were categorised as Open Country, Small town, Large Town and City, and parents’ social class variables were categorised as Professional Worker, Non-Manual, Skilled Manual and Unskilled, both as per IUNA reporting(7).
Anthropometric
BMI was included as a continuous variable in the correlation analysis and as a categorical variable to assess differences in mean scores between BMI categories. Due to low numbers of participants classified as overweight and/or obese, these categories were combined in the analysis to make a normal weight group and an overweight/obese group.
Dietary intake
The dietary intake variables were included as continuous variables in the correlation analysis. The variables chosen were total daily energy intake (kJ) and daily fat, protein and carbohydrate (CHO) intakes, expressed as a percentage of total daily energy intake (%TE).
Statistical analyses
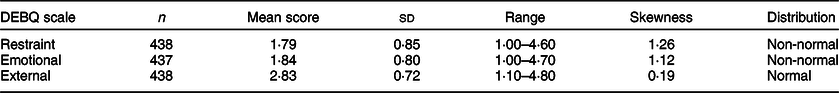
The External scale was normally distributed, but the Restraint and Emotional scales were not; therefore, non-parametric analyses were conducted on these two scales. Differences in mean scores were tested for each of the variables outlined above on each of the three eating behaviour scales. Independent samples t tests and one-way ANOVA with post hoc Tukey analysis were run for the normally distributed scale (i.e. External). Wilcoxon−Mann−Whitney U tests and Kruskal−Wallis tests were run for the non-normally distributed scales (i.e. Restraint and Emotional). Homogeneity of variance was assessed using Levene’s test. Pearson’s and Spearman’s correlations were run to assess the relationship between the three eating behaviour scales and age, BMI and the four dietary intake variables, all as continuous variables. Data were analysed for the whole group and stratified by sex and age groups. Unadjusted significance was set at P < 0·05. Due to the multiple analyses conducted (n 9 variables), a Bonferroni correction was applied, adjusting the significance to P < 0·006. The statistical software package IBM SPSS Statistics version 26.0 was used for all analyses in the current study.
Results
Description of the population characteristics and eating behaviour styles
The study population had an equal sex balance (Table 1), and there was a slightly larger proportion of older teens than younger teens in the population (57·4 v. 42·6 %). The largest proportion of the study population lived in cities (36·7 %), followed by the open country (31·1 %), and half of the population had parents within the professional social class group (Table 1). The study sample was predominantly white (97 %), and therefore, race was not included in any analyses(7). The majority of the teens in the sample had a normal BMI (81·6 %), with a low prevalence of obesity at 2·7 %. Mean daily energy intake for the full group was 8325·3 kJ/d. The percentage of total energy from protein, fat and CHO was 14·8, 35·7 and 49·0 %, respectively.
Descriptive characteristics of the study sample of nationally representative Irish teens aged 13–17 years, National Teens’ Food Survey (2005–2006)

CHO, carbohydrate; TE, total energy.
* Missing data: Parent’s Social Class n 11; Teen BMI n 1.
The Eating Behaviour Questionnaire scales are reported in Table 2. The individual DEBQ scale scores ranged from 1·00 to 4·80, with all mean scores remaining below the midpoint of 3·00. The highest mean score from the DEBQ was on the External scale, which was 2·83 compared with 1·79 on the Restraint scale and 1·84 on the Emotional scale.
Scores for the three scales in the Dutch Eating Behaviour Questionnaire (DEBQ) from a nationally representative sample of Irish teens aged 13–17 years, National Teens’ Food Survey (2005/2006)
Factors associated with the eating behaviour styles
Demographic
Sex was associated with differences in mean scores on all three DEBQ scales, with girls consistently scoring higher than boys, most strongly on the Restraint and Emotional scales (Table 3a). A significant positive correlation was seen between age and the Emotional scale (r 0·164, P = 0·001) and the External scale (r 0·138, P = 0·004). When categorised into age groups, older teens scored significantly higher than younger teens on the Emotional and External scales (Table 3b). No significant associations were observed between geographic location or social class and any of the three scales (see online supplementary material, Supplemental Table S1).
Differences in mean scores from the Dutch Eating Behaviour Questionnaire (DEBQ) scales, across sex for younger and older teens in the nationally representative sample of Irish teens aged 13–17 years, National Teens’ Food Survey (2005/2006)
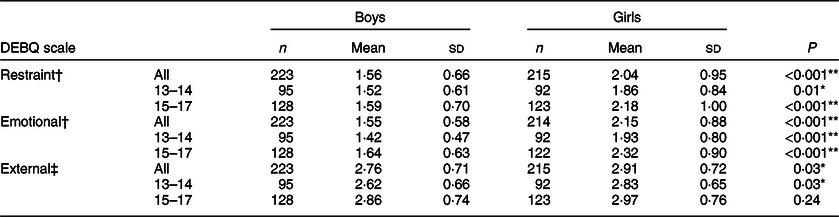
† Non-parametric analysis values reported.
‡ Parametric analysis values reported.
* Uncorrected significance level is P < 0·05.
** Bonferroni corrected value is P < 0·006.
Differences in mean scores from the Dutch Eating Behaviour Questionnaire (DEBQ) scales, across age groups for boys and girls in the nationally representative sample of Irish teens aged 13–17 years, National Teens’ Food Survey (2005/2006)
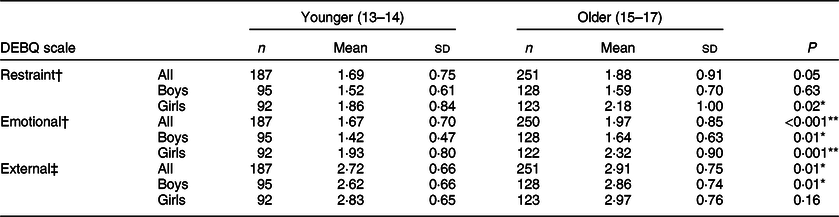
† Non-parametric analysis values reported.
‡ Parametric analysis values reported.
* Uncorrected significance level is P < 0·05.
** Bonferroni corrected value is P < 0·006.
Overall, the age- and sex-stratified analyses followed the same trends as the full-group analysis. Young females scored higher than young males on all three scales, and older females scored higher than older males on the Restraint and Emotional scales (Table 3a). Older males scored higher than younger males on the Emotional and External scales, whereas older females scored higher than younger females on the Restraint and Emotional scales (Table 3b). There were no associations between the eating behaviour scores and either geographic location or social class variables among the stratified data.
Anthropometric
BMI was positively correlated with the Restraint (r 0·279, P < 0·001) and Emotional (r 0·104, P = 0·03) scales and negatively correlated with the External scale (r −0·127, P = 0·01). Comparing mean scores across BMI categories showed significantly higher scores for the overweight/obese group on the Restraint scale and significantly lower scores on the External scale, but no significant differences existed on the Emotional scale (Table 4). The stratified analyses reflected that of the whole group results on the Restraint scale, with overweight/obese males, females, younger and older teens all scoring significantly higher than their normal weight counterparts (Table 4).
Differences in mean scores from the Dutch Eating Behaviour Questionnaire (DEBQ) scales, across BMI categories for boys, girls, younger and older teens in the nationally representative sample of Irish teens aged 13–17 years, National Teens’ Food Survey (2005/2006)

† Non-parametric analysis values reported.
‡ Parametric analysis values reported.
* Uncorrected significance level is P < 0·05.
** Bonferroni corrected value is P < 0·006.
Dietary intake
Daily energy intake was negatively correlated with the Restraint and the Emotional scales and positively correlated with the External scale (Table 5). Energy intake from protein was negatively correlated with the Emotional scale, energy intake from fat was negatively correlated with the Restraint scale and energy intake from CHO was positively correlated with both the Restraint and Emotional scales (Table 5). No macronutrient intake was associated with the External scale in the full-group analysis.
Correlations between the Dutch Eating Behaviour Questionnaire (DEBQ) scales and dietary intake variables for teens in the nationally representative sample of Irish teens aged 13–17 years, National Teens’ Food Survey (2005/2006)

CHO, carbohydrate; TE, total energy.
† Spearman correlation values.
‡ Pearson correlation values.
* Uncorrected significance level is P < 0·05.
** Bonferroni corrected value is P < 0·006.
The stratified dietary analysis showed that daily energy intake was negatively correlated with the Restraint scale for all sex and age subgroups (see online supplementary material, Supplemental Table S2). Energy intake was positively correlated with the External scale for girls and older teens and was negatively correlated with the Emotional scale in older teens only. Older teens showed associations with energy intake from all three macronutrients; energy from protein was negatively correlated with the Emotional scale, energy from fat was negatively correlated with the Restraint scale and energy from CHO was positively associated with the Emotional scale. Energy from CHO intake was also positively correlated with the Emotional scale for boys (see online supplementary material, Supplemental Table S2).
Discussion
Numerous factors can influence health and eating behaviours, encompassing aspects of the individual, family and social relationships, the home environment, wider society and value systems(Reference Viner, Ozer and Denny6,Reference Bronfenbrenner, Morris, Lerner, Damon and Lerner34) . The current analysis follows on from other published papers from the National Teens’ Food Survey, which predominantly described and examined dietary intake data(7,Reference Joyce, Wallace and McCarthy8,Reference Hearty and Gibney35,Reference Lyons, Walton and Flynn36) . Understanding the dietary intakes of Irish teens is a first step towards making improvements to the national health and nutrition status. However, to make positive and sustained improvements to their diets, we need a more comprehensive understanding of how and why teens eat and not just what they eat, as previously reported(7,Reference Joyce, Wallace and McCarthy8,Reference Hearty and Gibney35,Reference Lyons, Walton and Flynn36) . The current research aimed to shed some light on factors relating to the eating behaviour styles of Irish teens from the National Teens’ Food Survey cohort.
The eating behaviour data showed that Irish teens have a low−medium level of the three eating behaviour styles determined from the DEBQ, with all mean scores being slightly lower than the midpoint score of 3·00. Our score ranges reflected those found in other research using the DEBQ in teens, all similarly observing the highest scores on the external scale and lower scores on the restraint and emotional scales(Reference Snoek, van Strien and Janssens27−Reference Wardle, Marsland and Sheikh29). This suggests that teens do not display extreme responses to factors relating to restrained or emotional eating when making their food and eating choices, and other external factors may be at play to influence their choices. Among our population of Irish teens, the highest score was on the external eating scale, suggesting that food choices among Irish teens tend to be influenced more by external factors, such as the smell and taste of food, the sight of food or being around others who are eating a certain type of food. This supports the general understanding that teens are influenced by a range of factors, including their physical and social environment(Reference Viner, Ozer and Denny6,Reference Bronfenbrenner, Morris, Lerner, Damon and Lerner34) . The food that is present in their immediate environment will often be chosen, which coincides with qualitative research in teens which frequently reports the food environment, food availability, convenience and the taste or sensory appeal of food as factors determining their food choices(Reference Browne, Barron and Staines13,Reference Fitzgerald, Heary and Nixon15,Reference Neumark-Sztainer, Story and Perry37,Reference Wills, Backett-Milburn and Gregory38) . Peer influences and social desirability also play a role in food choice, becoming stronger as teens age(Reference Viner, Ozer and Denny6), with negative social connotations associated with ‘weird’ healthy type foods(Reference Neumark-Sztainer, Story and Perry37,Reference Wills, Backett-Milburn and Gregory38) . Scores on both the Restraint and the Emotional scales suggest that the Irish teen cohort displays a low level of both eating behaviour styles, which is similar to teens from other European countries(Reference Snoek, van Strien and Janssens27−Reference Wardle, Marsland and Sheikh29).
The results from our data for sex- and age-group differences in DEBQ responses corroborate other research using the DEBQ tool(Reference Barrada, van Strien and Cebolla19,Reference Brunault, Rabemampianina and Apfeldorfer22,Reference Snoek, van Strien and Janssens27−Reference Wardle, Marsland and Sheikh29) and suggest that females tend to be more emotional and restrained eaters, and older teens tend to respond more to their emotions and external factors than younger teens when making eating decisions. We also observed that older males are more emotionally and externally motivated than younger males, older females are more restrained and emotional than younger females and both younger and older females are more restrained and emotional than younger and older males, which again corroborates other findings in teen cohorts(Reference Snoek, van Strien and Janssens27−Reference Wardle, Marsland and Sheikh29). These sex- and age-related associations suggest that overall, female teens and older teens in the Irish population relate to different factors and cues for eating than their male or younger counterparts, and this could be taken into consideration for health promotion programmes.
BMI is commonly associated with the DEBQ scales for eating behaviours, where those with a higher BMI display higher restrained eating and higher emotional eating, but lower external eating scores(Reference Barrada, van Strien and Cebolla19,Reference Brunault, Rabemampianina and Apfeldorfer22,Reference Snoek, Engels and van Strien26,Reference Lluch, Herbeth and Mejean28,Reference Wardle, Marsland and Sheikh29) . The results of the current study are in agreement with these findings, with BMI being positively associated with the Restraint scale and negatively associated with the External scale. Although not significant, we also observed higher scores for teens classified as overweight/obese on the Emotional scale. When we look specifically at the dietary associations with the eating behaviour styles, we see the strongest correlations for daily energy intake. As would be expected from the description of the eating behaviour styles, daily energy intake is lower in those who are more restrained eaters and is higher in those who are more external eaters, and similar results have been found with other teens(Reference Snoek, van Strien and Janssens27−Reference Wardle, Marsland and Sheikh29).
There is an inverse association between the DEBQ scales with BMI and the dietary energy intake data, where the scales show a positive association with BMI but a negative association with energy intake, and vice versa. As reported by McConnon et al. (Reference McConnon, Burke and McCarthy39) in this same group of teens, there was a high level of body dissatisfaction, particularly among overweight teens. This may have influenced their desire to restrict dietary intakes in an attempt to control or change their body size. In the context of the restrained eating theory as a whole, it certainly seems that restrained eating or dieting may not lead to a lower body weight and therefore is not an appropriate weight management strategy(Reference Hibscher and Herman40,Reference Herman and Mack41) . These findings corroborate previous work on the idea that those who are more overweight tend to be more aware of what they are eating and the effect it may have on their bodies and therefore make specific food choices to prevent gaining extra weight(Reference Snoek, van Strien and Janssens27−Reference Wardle, Marsland and Sheikh29). Similarly, we reflect other findings that the external eating scale is negatively associated with BMI but positively associated with energy intake(Reference Snoek, van Strien and Janssens27,Reference Lluch, Herbeth and Mejean28) . External eaters often eat based on the presence or sensory qualities of food, and since they often have a normal BMI, they are less likely to feel the need to restrict their consumption. Again, we cannot draw conclusions on the causal nature of these relationships, but the consistency of the relationship among this and other teen groups is worth noting. Future research could focus on specific foods or food groups which may be associated with these eating behaviour styles, to understand more on whether the lower energy intake is associated with lower intakes of high fat, sugar and salt foods (i.e. a healthy restriction) or an unhealthy overall restriction, and should include a larger proportion of participants with overweight or obesity.
Given the differences between male and female, and younger and older teens in their responses to these scales, different approaches could be taken to encourage healthy eating behaviour styles, based on the characteristics of the target population. As females, older teens and those with a higher BMI consistently showed stronger associations with restrained eating, health promotion messages addressing the issues with dieting and promoting overall healthy eating may be most appropriate for these groups. Addressing eating in response to emotions would also be important among these groups. On the contrary, since males were found to be more external eaters, health promotion messages relating to the sensory aspects of food or physical changes to the food environment may be more effective to improve their diet. Both nutrition education and environmental-based interventions are common approaches to improving diet and health(Reference Salam, Hooda and Das42,Reference Belogianni and Baldwin43) , and incorporating a more targeted approach based on the different eating behaviour styles of subgroups could help to make these more effective. These approaches could be tested in future research aiming to improve the eating behaviours and food choices among specific teen-aged groups.
Strengths and limitations
A key strength of the current research is that rigorous data collection methods with validated questionnaire tools were used, and the data set is nationally representative(7). However, the analysis was conducted on secondary data collected 15 years ago and therefore may not be directly relevant to society today. As a second iteration of the National Teens’ Food Survey is currently underway, the current research provides the basis for a comparison between the previous and current data set to allow any changes in eating behaviour styles to be assessed over the past 15 years in Ireland.
Second, whilst the DEBQ tool has been consistently shown to be valid in several adult and teen-aged populations, the initial purpose of the tool was to address issues of overweight and obesity. The low rate of obesity in the current study population may be a limitation of using this tool in this specific cohort. The opt-in approach for recruitment may have resulted in teens with a higher BMI choosing to not be involved in a nutrition-specific survey, thereby affecting the obesity rates reported. The questions may not be fully relevant to a general population where the prevalence of overweight and obesity is relatively low, which may explain the relatively low scores reported on each scale. Similarly, the questions on the DEBQ relate to general food situations, some of which the respondents may not have experienced personally, which may have resulted in some response bias from perhaps choosing the mid-range value for convenience. Despite the low rate of obesity in this cohort, the DEBQ has been validated in general populations(Reference Barrada, van Strien and Cebolla19−Reference Bozan, Bas and Asci21), and therefore, it was the best tool available at the time of data collection.
It is important to note that the DEBQ is one of the several tools now available to measure eating behaviour styles. Some criticisms on the validity of the scales have arisen over the years(Reference Jansen, Nederkoorn and Roefs44,Reference Domoff, Meers and Koball45) ; however, the tool has been found to remain fit for purpose and valid in the multiple population groups(Reference van Strien, Herman and Anschutz31,Reference van Strien46) . In relation to emotional eating, the scale is somewhat limited as it only measures responses to negative emotions and only addresses overeating, and therefore cannot ascertain any undereating responses to emotions, or eating in response to positive emotions. The results from this scale should be interpreted with that in mind. There has been evidence of correlations between the Restraint scale and the Emotional scale, which suggests that restrained eating in response to these negative emotions likely exists(Reference Cebolla, Barrada and van Strien20,Reference Caccialanza, Nicholls and Cena24) , and this correlation was observed in the present Irish cohort as well (data not shown).
Whilst any eating behaviour questionnaire can quantify and categorise a range of eating behaviour styles in a population group, they are predominately designed with the aim of preventing overeating and the development or progression of obesity. The questionnaires themselves can only provide information for predetermined characteristics regarding eating behaviours, but they lack the ability to comprehensively determine many other aspects relating to eating behaviours and food choices. This highlights the importance of combining qualitative research with quantitative survey methods in future research for understanding food choice and eating habits or behaviours.
Conclusion
Differences in the eating behaviour styles of teens exist based on several factors including sex, age and BMI and dietary energy intake have a different relationship with each eating behaviour style. Future population-based nutrition surveys should aim to include a measure of eating behaviour styles within the research methodology, to enhance the level of understanding on the dietary behaviours of the population. Assessing eating behaviour styles allows an understanding on how and why people eat, and not just what they eat. These aspects should be considered when designing healthy eating messages or programmes to teens, so that messages are phrased through a sex- and age-specific lens, focusing on aspects that are most relevant to the specific teen groups rather than using a ‘one-size-fits-all’ model. This could help inform health promotion messages tailored to the needs of this sub-population, and by phrasing the messages through the same lens as their motivations, it may help to make the interventions more effective.
Acknowledgements
Acknowledgements: None. Financial support: The current work was supported by the Department of Agriculture Food and Marine, under the National Development Plan 2000–2006 Food for Health Research Initiative 2007–2012, the Irish Department of Health and the Health Research Board. The Department of Agriculture Food and Marine had no role in the design, analysis or writing of the current article. Conflict of interest: There are no conflicts of interest. Authorship: A.N.D. was involved in generation of the research question, carrying out analyses of the data and writing the research article. E.J.O.S. and J.M.K. were responsible for generation of the research question and review of data analyses and the research article. J.W. and B.A.M. were involved in the study design and conducting the study and review of the research article. Ethics of human subject participation: The current study was conducted according to the guidelines laid down in the Declaration of Helsinki, and all procedures involving research study participants were approved by the Clinical Research Ethics Committee of The Cork Teaching Hospitals. Written informed consent was obtained from all participants, as well as their parents/guardians.
Supplementary material
For supplementary material accompanying this paper visit https://doi.org/10.1017/S1368980020003055


