


1. Introduction
Layered patterns are striking features in double diffusive convection (DDC), where the fluid density depends on two scalars with different diffusivities (Turner Reference Turner1974; Huppert & Turner Reference Huppert and Turner1981; Schmitt Reference Schmitt1994; Radko Reference Radko2013; Garaud Reference Garaud2018). A typical example of layer formation is found in the ocean, where seawater density is affected by temperature and salinity. As a result of double diffusion, thermohaline staircases are found in different regions of the ocean, such as a salt-finger regime in (sub)tropic regions (Simeonov & Stern Reference Simeonov and Stern2004; Schmitt Reference Schmitt2005; Johnson & Kearney Reference Johnson and Kearney2009; Yang et al. Reference Yang, Chen, Verzicco and Lohse2020) and a diffusive regime in high-latitude regions (Kelley et al. Reference Kelley, Fernando, Gargett, Tanny and Özsoy2003; Timmermans et al. Reference Timmermans, Toole, Krishfield and Winsor2008; Sommer et al. Reference Sommer, Carpenter, Schmid, Lueck, Schurter and Wüest2013).
An intriguing daily example of layered pattern can be found in café latte, where the corresponding laboratory experiments have recently been conducted by Xue et al. (Reference Xue, Khodaparast, Zhu, Nunes, Kim and Stone2017). When a shot of espresso (lower-density) is poured into a glass of milk (higher-density), the system cools down from the side since it loses heat to the ambient through the sidewall. Pronounced layers form in the mixture, rather than a mixed-up solution as one may expect. Xue et al. (Reference Xue, Khodaparast, Zhu, Nunes, Kim and Stone2017) showed that the injection velocity determines the depth of milk being mixed with espresso. After a while when a stably stratified zone forms in the mixture, the layering process is governed by double diffusion: the temperature difference between the hotter bulk and the colder sidewall fluid layer implies a horizontal thermal driving, whereas a stabilizing vertical concentration gradient exists in the coffee–milk mixture.
Examples in other physical systems also illustrate the importance of horizontal thermal driving to layer formation in a stably stratified fluid. For instance, when sedimenting suspensions of colloidal particles are subjected to a horizontal temperature gradient, the initially uniform suspension will also develop multiple layers (Mendenhall & Mason Reference Mendenhall and Mason1923). Also, one can observe layering when ice blocks melt in salty liquid, building up a salinity gradient (Huppert & Turner Reference Huppert and Turner1980).
To numerically study layer formation in DDC systems with both vertical and lateral gradients, here we pick, inspired by café latte, laterally cooled double diffusive convection with a concentration gradient in the vertical direction. In this set-up, the temperature gradient is imposed horizontally, whereas the vertical concentration gradient is stabilizing. In pioneering experimental and theoretical work of laterally cooled DDC, Thorpe, Hutt & Soulsby (Reference Thorpe, Hutt and Soulsby1969) showed the successive growth of layers in a stratified brine solution heated from one side. They further conducted linear stability analysis to find the onset criteria of layers. Their pioneering paper motivated further experimental and numerical work focusing on how the layers form (Chen, Briggs & Wirtz Reference Chen, Briggs and Wirtz1971; Wirtz, Briggs & Chen Reference Wirtz, Briggs and Chen1972; Lee & Hyun Reference Lee and Hyun1991). Also, salinity and heat fluxes were studied extensively in laterally cooled DDC because it is relevant to the high-latitude ocean being affected by melting icebergs (Huppert & Turner Reference Huppert and Turner1980; Jacobs et al. Reference Jacobs, Huppert, Holdsworth and Drewry1981; Gayen, Griffiths & Kerr Reference Gayen, Griffiths and Kerr2016). Moreover, layer merging in DDC is also an important issue because it influences the fluxes across the layer interface (Tanny & Tsinober Reference Tanny and Tsinober1988; Chen & Chen Reference Chen and Chen1997).
Previous simulations (mostly in the  $20$th century) on DDC had severe CPU-time limitation on the parameter range and on collecting long enough time series of layer evolution. Thanks to the full temperature and velocity information obtained from present numerical simulations, the extension of the parameter space and the possibility to run very long simulations, the layer formation and properties can now be understood in much more detail.
In this work, we study laterally cooled DDC over a wide range in parameter space, namely three decades of temperature Rayleigh number  $Ra_T$ and four decades of density ratio $\Lambda$. We begin with the description of the governing equations and the set-up in § 2. Then we examine the flow morphologies and show the layer formation in § 3. In § 4, we can estimate the thickness of the initially formed layers from an energy balance. We further elucidate the mechanism of layer merging in § 5. Finally, conclusions are given in § 6.
2. Numerical method and set-ups
We consider a two-dimensional rectangular box of width  $W$ and height $H$. The left/right wall has high/low temperature, and there is no salinity flux through the lateral boundaries. The top/bottom wall has low/high salinity and is adiabatic to temperature. No-slip velocity boundary conditions are used on all the walls. We apply the Oberbeck–Boussinesq (OB) approximation, such that the fluid density depends linearly on temperature $\tilde {T}$ and a scalar $\tilde {S}$: $\tilde {\rho } ( \tilde {T} , \tilde {S} ) = \tilde {\rho } _ { 0 } [ 1 - \beta _ {T} ( \tilde {T} - \tilde {T} _ { 0 } ) + \beta _ {S} ( \tilde {S} - \tilde {S} _ { 0 } ) ]$. Here, $\tilde {\rho }_0$, $\tilde {T}_0$, $\tilde {S}_0$ represent the reference density, temperature and concentration, respectively. The thermal and solutal expansion coefficients are $\beta _T$ and $\beta _S$, respectively. The governing equations are non-dimensionalized by normalizing lengths by $H$, velocities by the free-fall velocity $U = \sqrt { g \beta _ {T } | {\rm \Delta} _T | H }$ (such that time is non-dimensionalized by the free-fall time scale $H/U$), temperatures by ${\rm \Delta} _T$ (the temperature difference between the sidewalls) and concentrations by ${\rm \Delta} _S$ (the concentration difference between the top and bottom plates):
 \begin{gather} { \partial _ { t } u _ { i } + u _ { j } \partial _ { j } u _ { i } = - \partial _ { i } p + \sqrt { \frac { P r _ { T } } { R a _ { T } } } \partial _ { j } \partial _ { j } u _ { i } + \left( T - \Lambda S \right) \delta _ { i z } }, \end{gather}
 \begin{gather}{ \partial _ { t } T + u _ { i } \partial _ { i } T = \frac { 1 } { \sqrt { R a _ { T } P r _ { T } }} \partial _ { j }^{2}T}, \end{gather}
 \begin{gather}{ \partial _ { t } S + u _ { i } \partial _ { i } S =\frac { 1 } { Le \sqrt { R a _ { T } P r _ { T } } } \partial _ {j}^{2}S}, \end{gather}
 \begin{gather}\partial _ { i } u _ { i } = 0. \end{gather}
Here,  $u_i/u_j$ are the velocity components, $p$ the kinematic pressure, $T$ the temperature and $S$ the concentration, all now non-dimensional. The Kronecker delta is denoted by $\delta _{iz}$ and the gravitational acceleration by $g$. The five dimensionless control parameters are the aspect ratio $\Gamma$, the thermal Rayleigh $Ra_T$ and the Prandtl $Pr_T$ number for the temperature, the Lewis number $Le$, and the density ratio $\Lambda$, defined as:
 \begin{gather} \Gamma = W/H,\quad R a _ { T } = \frac { g \beta _ { T } H^{3} {\rm \Delta} _ { T } } { \kappa _ { T } \nu } ,\quad {Pr } _ { T } = \frac { \nu } { \kappa _ { T } }, \end{gather}
 \begin{gather}L e = \kappa _ { T } / \kappa _ { S } = { Pr } _ { S } P r _ { T }^{ - 1 },\quad \Lambda = \left( \beta _ { S } {\rm \Delta} _ { S } \right) / \left( \beta _ { T } {\rm \Delta} _ { T } \right) = R a _ { S } R a _ { T }^{ - 1 }L e^{ - 1 }, \end{gather}
where  $R a _ { S } = { g \beta _ { S } H ^{ 3 } {\rm \Delta} _ { S } } /{ (\kappa _ { S } \nu ) }$ is the concentration Rayleigh number and ${ Pr } _ { S } = { \nu } /{ \kappa _ { S } }$ the concentration Prandtl number. Here, $\nu$, $\kappa _T$ and $\kappa _S$ are the kinematic viscosity, the thermal diffusivity and the solutal diffusivity, respectively. The relative strength of the buoyancy force induced by the stabilizing concentration difference to that induced by the destabilizing temperature difference is measured by $\Lambda$. The three key response parameters of the system are the two scalar fluxes and the flow velocity, which are measured by the two Nusselt numbers and the Reynolds number:
 \begin{gather} Nu_T = \sqrt{Ra_T Pr_T}\langle u_x T\rangle _{z,t} - \langle\partial_x T\rangle_{z,t}, \end{gather}
 \begin{gather}Nu_S = \sqrt{Ra_S Pr_S}\langle u_z S\rangle_{x,t} - \langle\partial_z S\rangle_{x,t}, \end{gather}
 \begin{gather}Re = \sqrt{Ra_T/Pr_T}\sqrt{\langle\boldsymbol{u}^{2}\rangle}. \end{gather}
Here  $\langle . \rangle _{x,t}$/ $\langle . \rangle _{z,t}$ represents the average over time and the horizontal/vertical plane. In this work, we calculate $Nu_T$ by temperature gradients at the two sidewalls and $Nu_S$ by concentration gradients at the top and bottom plates. The root-mean-square value of the velocity magnitude, calculated over the entire domain, is $\sqrt {\langle \boldsymbol {u}^{2}\rangle }$.
Equations (2.1)–(2.4) are solved by a second-order finite difference scheme using a fractional-step procedure and advanced in time by a low-storage third-order Runge–Kutta scheme (Verzicco & Orlandi Reference Verzicco and Orlandi1996; van der Poel et al. Reference van der Poel, Ostilla-Mónico, Donners and Verzicco2015). We use fixed aspect ratio  $\Gamma =0.5$. We have also conducted a case of aspect ratio $1$ for $Ra_T=10^{7}$ and $Ra_S=2\times 10^{9}$, which also shows the successive layer merging and eventually a single convection roll. Our simulations cover the range $10^{6}\leq Ra_T\leq 10^{9}$, $10^{-2}\leq \Lambda \leq 10^{2}$ with $Pr_T = 1$ and $Pr_S = 100$ (corresponding to a Lewis number $Le=100$). Although in the café latte problem, $Le$ is approximately $10^{3}$, $Le$ considered in this study is large enough to demonstrate the layer formation. The large $Le$ implies that the resolution for the concentration is more demanding than that for the temperature, and thus a multiple resolutions strategy is employed (Ostilla-Mónico et al. Reference Ostilla-Mónico, Yang, van der Poel, Lohse and Verzicco2015), and such strategy had been already used for DDC simulations (Yang, Verzicco & Lohse Reference Yang, Verzicco and Lohse2015). Specifically, for the case of $Ra_T=10^{9}$, we use $432^{2}$ for the base mesh and $1296^{2}$ for the refined mesh. Uniform grid spacing is adopted horizontally while stretched grid spacing is adopted vertically with more grid points near the top and bottom walls. We also ensure that there are enough grid points to capture the sharp concentration gradient between the layers. Besides, a grid independence test has been conducted to ensure that the same final conclusion has been obtained when the grid size is halved.
We are aware of the limitations of 2-D DDC simulations as compared to 3-D ones. However, at least for large  $Pr\geq 1$, qualitatively the results for 2-D and 3-D are very similar (van der Poel, Stevens & Lohse Reference van der Poel, Stevens and Lohse2013; Chong et al. Reference Chong, Yang, Yang, Verzicco and Lohse2020) and we aim more at elucidating the physical processes originating the layering rather than detailing a specific case. Only by restricting to 2-D, can we explore a large region of the parameter space.
About the initial conditions, the concentration field is linear vertically and the temperature field is linear horizontally. The initial profiles of the scalar fields have also been visualized in the supplementary materials available at https://doi.org/10.1017/jfm.2020.565. For the velocity, the systems are motionless initially, without any perturbation.
3. Flow structures at various density ratios
We begin with the qualitative description on how the flow morphology changes with increasing density ratio  $\Lambda$, where $\Lambda$ measures the strength of the thermal buoyancy compared to stabilization due to the stable stratification. For this study we fix $Ra_T=10^{9}$ and
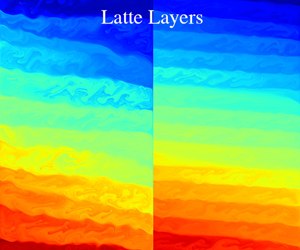
  $Le=100$. In figure 1, we show the concentration and temperature fields for both regimes which emerge.
Snapshots of the concentration (upper row) and temperature fields (lower row) for different  $\Lambda =1,4$ and $7$ (from left to right) with $Ra_T=10^{9}$ and $Le=100$. The global temperature difference is imposed laterally while the global concentration difference is along the vertical direction to stabilize the flow. Layered structures emerge at large enough density ratio $\Lambda$, which contrasts the domain-filling circulation (sketched by arrows) observed at $\Lambda =1$. Corresponding movies are shown in the supplementary materials.

At  $\Lambda =1$, when the thermal buoyancy is dominant, there is a single large-scale circulation. From the temperature field, it can be seen that the detached hot (cold) plumes travel upwards (downwards). For the chosen aspect ratio $\Gamma =1/2$, they travel over the distance of the entire cell height. At the same time, the concentration field is advected by the thermally-driven circulation. As a result, there is a region formed in the bulk with nearly uniform concentration, whereas the concentration only changes sharply near the top and bottom boundary layers. This flow structure is similar to that in vertical convection VC (Ng et al. Reference Ng, Ooi, Lohse and Chung2015; Shishkina & Horn Reference Shishkina and Horn2016; Wang et al. Reference Wang, Xia, Yan, Sun and Wan2019). We thus classify this and corresponding cases into the so-called quasi-VC regime.
Strikingly, different flow structures are obtained for  $\Lambda$ larger than a threshold value, which will be calculated in § 4. For example, for $\Lambda = 4$ beyond this threshold, we identify the formation of a layered structure from the concentration field. The physical process of layer formation is as follows: after starting the simulation, there is formation of hot plumes near the hot sidewall, and they travel upwards since they carry lighter fluid than the surroundings. Due to the restoring force caused by the stably stratified concentration field, thermal buoyancy is not strong enough to maintain the upward-moving plumes throughout the entire domain height. Therefore, thermal plumes travel horizontally towards the middle of the cell because of the incompressible condition and conservation of mass, causing a sequence of thermal streaks as seen from the temperature field. In this case, the thermal driving leads to the vertically stacked convection rolls (localized circulations in the clockwise direction), and the convection rolls appear successively from the top and the bottom of the system. Because the concentration diffuses much slower than the heat ( $Le=\kappa _T/\kappa _S=100$), a well-recognizable layered concentration field results. Within each roll, the concentration is nearly uniform due to the convective mixing. At the interface between two adjacent rolls, the concentration changes sharply. For an even larger stabilization ( $\Lambda =7$), even more layers initially form as compared to the case of $\Lambda =4$, in accordance with our physical explanation of the formation process.
However, when the density ratio  $\Lambda$ is larger than a certain transition value $\Lambda _c$, there is no convection. The boundary between the layered regime and the regime without convection has already been obtained by Thorpe et al. (Reference Thorpe, Hutt and Soulsby1969), which is $\Lambda _c=0.6Ra_T^{1/5}$.
4. Initial layer thickness and phase space
As shown above, a series of layers (in the concentration field) will form initially in the layered regime, and the initial layer thickness decreases with increasing strength of stabilization. What sets the initial layer thickness or, equivalently, the size of the localized circulation? We will derive this initial layer thickness from an energy balance. A similar energy argument was adopted in stratified Taylor–Couette (TC) flow, which is TC flow subjected to vertical linear stratification (Boubnov, Gledzer & Hopfinger Reference Boubnov, Gledzer and Hopfinger1995). In stratified TC flow, spontaneous layer formation can be observed in both the low-Re (Boubnov et al. Reference Boubnov, Gledzer and Hopfinger1995) and the high-Re (Oglethorpe, Caulfield & Woods Reference Oglethorpe, Caulfield and Woods2013) regimes. In order to estimate the layer thickness in stratified TC flow, Boubnov et al. (Reference Boubnov, Gledzer and Hopfinger1995) successfully employed the balance between the work exerted by the centripetal force and the potential energy for moving the fluid parcel in the stable stratification.
Likewise, in laterally cooled DDC, the work for raising the fluid parcel in the stable stratification is done by the thermal buoyancy. As the fluid movement is driven by the horizontal temperature difference  ${\rm \Delta} _T$, the work done by thermal buoyancy to raise the fluid parcel over distance $h$ is $(\beta _T g{\rm \Delta} _T)h$. In stable linear stratification, the potential energy to bring a fluid parcel out of its equilibrium position with vertical displacement $h$ is $N^{2}_0h^{2}$, where $N_0=\sqrt {g\beta _s {\rm \Delta} _s/H}$ is the buoyancy frequency. Assume that all work is converted to potential energy. This balance gives
 \begin{equation} (\beta_T g{\rm \Delta}_T)h = g\beta_s {\rm \Delta}_sh^{2}/H \quad \textrm{implying}\quad h/H=1/\Lambda. \end{equation}
We note that Chen et al. (Reference Chen, Briggs and Wirtz1971) had also introduced this natural length scale to describe the layering pattern in their experiments. We further emphasize that this relationship is only valid for estimating the initial thickness because it assumes a linear stratification which is only the case during the initial stage.
We now check whether (4.1) is a good approximation to the initial layer thickness. We first manually count the number of layers formed in the very initial stage after layer development, which is well recognizable from the snapshots (see for example figure 1). Then the average layer thickness  $\langle h \rangle$ can be estimated by dividing the cell height $H$ over the counted number. Figure 2(a) shows the evaluated layer thickness $\langle h\rangle /H$ versus $1/\Lambda$ for various $Ra_T$. It can be seen that the data points generally follow the trend of $h/H=1/\Lambda$. Yet, close inspection suggests that all data points are actually below the estimated line (black-dashed), consistent with previous experiments, which also found that the measured initial thickness is in general less than $1/\Lambda$ (Chen et al. Reference Chen, Briggs and Wirtz1971). Analogously, in the studies of double diffusive intrusions (Ruddick & Turner Reference Ruddick and Turner1979), layers can also form after removing the barrier separating the two different solutions. Besides, there is successive layer formation when ice blocks melt into a salinity gradient (Huppert & Turner Reference Huppert and Turner1980). The vertical length scales of the layers in those systems are also found to be proportional to $1/\Lambda$ with the proportionality constant being less than $1$. There are two reasons why $h/H$ is smaller than $1/\Lambda$: (i) part of the work is not converted but dissipated which is neglected in obtaining (4.1); (ii) the buoyancy in general is smaller than $\beta _Tg{\rm \Delta} _T$. Thus, (4.1) can only be seen as an upper limit for the initial thickness. In addition, the layer thickness is obviously limited by the system height $H$, and indeed in figure 2(a) it can be seen that $\langle h \rangle$ levels off at $\langle h \rangle =H$ for small $\Lambda \leq 1$ or $1/\Lambda \geq 1$.
(a) Normalized average layer thickness  $\langle h\rangle /H$ versus $1/\Lambda$ for different $Ra_T$. The black-dashed line $\langle h\rangle /H=1/\Lambda$ is derived based on the energy balance discussed in § 4. (b) Explored phase space and illustration of different flow regimes. In the quasi-VC regime, the flow resembles that in vertical convection. In the layered regime, layered structures initially emerge. The boundary between the quasi-VC and the layered regime is given by $\Lambda =2$ as derived by the energy balance in § 4. The boundary between the layered regime and the regime without convection is $\Lambda _c=0.6Ra_T^{1/5}$ as obtained already by Thorpe et al. (Reference Thorpe, Hutt and Soulsby1969). The colours of the points denote the number of layers observed in the early stage of the layer formation; later these layers partly merge.

We now explore the full parameter space ( $\Lambda$, $Ra_T$) to identify when a single large-scale circulation forms, and when there are layers consisting of stacking localized circulations. In figure 2(b), the transition boundary between the quasi-VC regime and the layered regime corresponds to the case with only two initially formed layers, i.e. $\Lambda =2$ from (4.1). Upon increasing $\Lambda$, the number of layers increases but eventually the system reaches the motionless state when stabilization becomes dominant. This transition density ratio $\Lambda _c$ to the no convection regime was deduced previously from linear stability analysis (Thorpe et al. Reference Thorpe, Hutt and Soulsby1969).
5. Layer merging and its mechanism
We next address the merging of the layers, which successively occurs as time proceeds. It obviously coincides with the number of layers decreasing monotonically with time. Previous experiments had observed an eventual single roll state after successive layer merging (Kamakura & Ozoe Reference Kamakura and Ozoe1993) for certain parameters. To study the merging process in detail, we simulated the case of  $Ra_T=10^{9}$ and $\Lambda =7$ for $6\times 10^{4}$ free-fall time units.
Figure 3(a) shows the time evolution of the lateral heat flux ( $Nu_{T,right}$ and $Nu_{T,left}$) and the vertical solutal flux ( $Nu_{S,top}$ and $Nu_{S,bot}$) for this prolonged run; the instantaneous concentration fields at different time instants are also shown in figure 3(b). Between the consecutive merging events, the system reaches a meta-stable state with fluxes fluctuating around an average value. However, just before the transition to another meta-stable state (i.e. layer merging), we observe spikes in the heat flux time series which are characteristic of layer merging. After the neighbouring layers have merged, the heat fluxes then reach another average value. In contrast, the solutal fluxes at the top and bottom walls are less sensitive to the merging event as compared to the heat fluxes at sidewalls. The reason is that the response of solutal fluxes to merging events that happen in the interior is delayed. We also note that the step change in the heat fluxes after layer merging has also been reported in the previous numerical work by Nishimura, Kunitsugu & Morega (Reference Nishimura, Kunitsugu and Morega2000). However, some details have not been discussed, for example, the spikes.
(a) Time series of the temperature and the concentration Nusselt number, see legend. (b) The corresponding concentration field at the marked (in a) time instants (i)–(v) are shown.

The  $Nu$ behaviour leads us to ask: (i) Why are there spikes just before the merging of layers? (ii) What is the merging mechanism in the laterally cooled DDC? To answer these questions, we examine a particular merging event. Figure 4(a) shows the vertical and horizontal Reynolds number, $Re_z$ and $Re_x$, computed by the globally averaged horizontal and vertical velocities. Between $t_1$ and $t_2$, $Re_z$ is almost unchanged, whereas $Re_x$ progressively decreases with time during this period. The weakened horizontal velocity first explains why there is a gradual decrease in lateral heat fluxes shown in figure 4(b).
Time series of (a) the Reynolds number for the horizontal velocity  $Re_x$ and for the vertical velocity $Re_z$. (b) Time series of the temperature Nusselt number for the left sidewall $Nu_{T,left}$, the right sidewall $Nu_{T,right}$ and (c) the averaged temperature $\langle T\rangle _{A_1}$ over the domain $A_1$. (d) Portion of the temperature snapshots at these different time instants as marked in (a–c). The extent of the domain $A_1$ ( $0.3\le z\le 0.4$ and $0\le x\le 0.125$), over which $\langle T\rangle _{A_1}$ is averaged in (c), is also sketched.

To study the merging process in even more detail, we visualize the temperature snapshots at the corresponding time instants  $t_1$ and $t_2$ in figure 4(d). At the moment, when the layers are just about to merge ( $t=t_2$), we observe that the thermal streak becomes shorter than before ( $t=t_1$), reflecting the weakened local circulation within a layer. Eventually, the weakened circulation leads to an accumulation of hot fluid adjacent to the heated walls. Indeed, in figure 4(c), we see that the averaged temperature over the area near the heated wall (denoted by zone $A_1$) increases gradually before $t_2$. Finally, when the hot fluid has large enough potential energy to overcome the stable stratification, two nearby layers merge into a larger one at $t_3$. A new circulation establishes after layer merging; it further carries a chunk of accumulated hot fluid near the heated wall to the opposite cold wall, and subsequently leads to the sharp increase in the heat fluxes. Our results demonstrate the complete process of layer merging in laterally cooled DDC, and further explain why there are spikes in the heat flux time series.
We remark that Radko et al. (Reference Radko, Flanagan, Stellmach and Timmermans2014) had studied a merging pattern in thermohaline staircases, in which the interfaces with sharp gradient grow at the expense of interfaces with the smeared out gradient. It is relevant to the merging event observed in our case where the merging is led by the smearing out of the interface. However, the configuration considered here is different from that in Radko et al. (Reference Radko, Flanagan, Stellmach and Timmermans2014) with both the concentration and temperature gradients acting in a vertical direction. Such a difference in the configuration can indeed lead to different merging behaviour, for example, the merging instability in our case is triggered in the localized region near the hot sidewall.
6. Concluding remarks
In summary, inspired by the layer formation in café latte, we have numerically studied laterally cooled and stably density stratified DDC, which is regarded as a simplified version of café latte. We have clearly demonstrated the layer formation, which occurs after the initial espresso injection process. We numerically explored large range parameters, namely for the temperature Rayleigh number  $10^{6}\leq Ra_T\leq 10^{9}$ and for the density ratio $10^{-2}\leq \Lambda \leq 10^{2}$, with $Le=100$.
Upon increasing strength of the stabilizing concentration gradient at a fixed lateral thermal driving, the study reveals the flow transition from the quasi-VC regime to the layered regime. In the quasi-VC regime, the flow structure is a large-scale circulation. However, in the layered regime, multiple localized circulations initially form which, therefore, lead to the layered structure in the concentration field. Based on the energy balance between the work done by thermal buoyancy and the potential energy to bring a fluid parcel out of its equilibrium position in stratification, we can estimate the initial layer thickness, obtaining that it roughly follows  $h/H=1/\Lambda$. Such a relationship also allows us to find the boundary between quasi-VC and layered regimes, which is $\Lambda =2$.
We finally focused on merging events by running a specific case with a long time series. With sufficiently long simulations, we showed that the layered structures eventually merge into a single large-scale circulation. The merging mechanism is that the weakened circulation within a layer leads to the accumulation of hot fluid over the hot sidewall. The hot fluid parcel at some point obtains enough buoyancy to overcome the energy barrier set by the stable stratification, and it forms a new circulation of larger size. The formation of the new circulation leads to the spikes in the heat flux time series which is characteristic for layer merging.
Until now, we have only considered the cases with fixed temperature at the heated and cooled walls. However, in many circumstances, the DDC may also be subjected to time-dependent boundary conditions, for example, abrupt temperature change caused by falling icebergs, or seasonal temperature variation. Those time-dependent forcings may have a pronounced effect on the layer formation and merging, which is worthy to be studied in the future.
Acknowledgements
We greatly appreciate the valuable discussions with Y. Li and C. S. Ng. We acknowledge the support from an ERC-Advanced Grant under the project number 740479. K. L. C. acknowledges Croucher Foundation for Croucher Fellowships for Postdoctoral Research. We acknowledge PRACE for awarding us access to MareNostrum 4 based in Spain at the Barcelona Computing Center (BSC) under Prace project 2018194742. We also acknowledge that the results of this research have been achieved using the DECI resource Kay based in Ireland at the Irish Center for High-End Computing (ICHEC) with support from the PRACE aisbl. This work was also partly carried out on the national e-infrastructure of the SURFsara with the support of SURF Cooperative.
Declaration of interests
The authors report no conflict of interest.
Supplementary material and movies
Supplementary material and movies are available at https://doi.org/10.1017/jfm.2020.565.


 Open access