


1. Introduction
Understanding and modelling the physics of the turbulent wake is of primary importance to various applications of the transportation and energy sectors, where bluff body aerodynamics play a central role. When analysing its dynamics, the turbulent wake is conventionally divided into a near non-self-preserving region and a subsequent self-preserving region (Tennekes & Lumley Reference Tennekes and Lumley1972; Bempedelis & Steiros Reference Bempedelis and Steiros2022), the region of self-preservation starting several bluff body characteristic lengths downstream of the bluff body (Bevilaqua & Lykoudis Reference Bevilaqua and Lykoudis1978; Nedić, Vassilicos & Ganapathisubramani Reference Nedić, Vassilicos and Ganapathisubramani2013b; Dairay, Obligado & Vassilicos Reference Dairay, Obligado and Vassilicos2015; Obligado, Dairay & Vassilicos Reference Obligado, Dairay and Vassilicos2016). When self-preservation occurs, it allows for a significant simplification of the flow dynamics by reducing the number of the flow variables that govern the flow evolution subject to constraints via the Reynolds-averaged budget equations (Tennekes & Lumley Reference Tennekes and Lumley1972; Townsend Reference Townsend1976).
It is therefore critical to understand when and under which conditions a wake becomes self-preserving. It has been postulated (Townsend Reference Townsend1956, Reference Townsend1970, Reference Townsend1976) that self-preservation is the result of a loss of memory of inlet/initial conditions, i.e. when the flow has departed sufficiently from the bluff body, so that its details are forgotten. However, Bevilaqua & Lykoudis (Reference Bevilaqua and Lykoudis1978) experimentally demonstrated that self-preservation can coexist with turbulence memory carried by large coherent structures that form close to the body. This led to the hypothesis that self-preservation of the mean velocity and Reynolds stress profiles appears when large scale coherent structures can provide the necessary connection between turbulent fluctuations and the mean flow.
Several types of large-scale coherent structures may exist in a turbulent wake, generated by different instabilities (see e.g. Williamson Reference Williamson1996; Prasad & Williamson Reference Prasad and Williamson1997; Castro Reference Castro2005). Bevilaqua & Lykoudis (Reference Bevilaqua and Lykoudis1978) focused on the large-scale vortices that are shed from the bluff body, i.e. vortex shedding. This is perhaps the most widely studied instability of the turbulent wake because it induces large velocity and pressure fluctuations which, on one hand, significantly influence the average flow field (Mantič-Lugo, Arratia & Gallaire Reference Mantič-Lugo, Arratia and Gallaire2014) and, on the other, generate periodic loads on the bluff body (Williamson & Govardhan Reference Williamson and Govardhan2004). Even though vortex shedding has been studied for more than a century, a universal explanation for its emergence has not been put forward. Still, several passive ways for controlling the amplitude of vortex shedding have been proposed. Gerrard (Reference Gerrard1966) postulated that a growing vortex is shed the moment it is large enough to draw opposite-signed vorticity from the other shear layer across the wake. Indeed, the shedding of vortices can be suppressed by impeding the interaction of the two shear layers, e.g. with the introduction of a splitter plate in the wake (Anderson & Szewczyk Reference Anderson and Szewczyk1997; Steiros & Hultmark Reference Steiros and Hultmark2018). If shear layers are allowed to interact, vortex shedding will occur, but can still be attenuated by reducing the mean velocity gradient in the wake, e.g. by introducing fluid bleeding in the bluff body ‘base’ (Castro Reference Castro1971; Steiros et al. Reference Steiros, Kokmanian, Bempedelis and Hultmark2020). Shedding attenuation can also be achieved by introducing irregularities on the perimeter of the bluff body (Law & Jaiman Reference Law and Jaiman2018). In the case of flat plates, irregularities that follow a multiscale/fractal pattern have been shown to be particularly effective for vortex shedding suppression (Nedić, Ganapathisubramani & Vassilicos Reference Nedić, Ganapathisubramani and Vassilicos2013a; Steiros et al. Reference Steiros, Bruce, Buxton and Vassilicos2017). It should be noted that no matter the suppression technique, a simple inspection of the flow field is not sufficient to determine whether vortex shedding has been completely eliminated, as sharp frequencies in the velocity signal of the near wake may persist even when coherent vortices cannot be easily discerned (Castro Reference Castro1971). It is thus important to properly extract and assess the flow structures that correspond to these spectral peaks, e.g. via the use of modal decomposition techniques (Lumley Reference Lumley1970; Towne, Schmidt & Colonius Reference Towne, Schmidt and Colonius2018).
Bevilaqua & Lykoudis (Reference Bevilaqua and Lykoudis1978) also studied a turbulent wake where vortex shedding was completely suppressed via the use of high base bleeding. In that case, it was found that the onset of self-preservation was significantly delayed, compared with a wake that allowed for the formation of vortex shedding. To be consistent with their hypothesis of a connection between coherent structures and self-preservation (see above) Bevilaqua & Lykoudis (Reference Bevilaqua and Lykoudis1978) postulated that, instead of vortex shedding eddies, this type of self-preservation was connected to the emergence of ‘vortex-pair’ eddies. The existence of these hypothetical structures was based on the earlier works of Grant (Reference Grant1958) and Townsend (Reference Townsend1976), who inferred these vortices from measurements of the velocity correlation function in the very far wake (of the order of 500 body diameters). The vortex-pair vortices were hypothesised to form due to the straining of turbulence by the mean flow, i.e. without the influence of the bluff body's initial conditions, as per the Townsend self-preserving hypothesis. Still, Bevilaqua & Lykoudis (Reference Bevilaqua and Lykoudis1978) did not attempt to identify the formation of such vortices in the self-preserving part of the flow.
It is noteworthy to mention that the subsequent smoke visualisation experiments of Cimbala, Nagib & Roshko (Reference Cimbala, Nagib and Roshko1988) hinted that such vortex-pair eddies may originate from earlier vortical structures which appear between  ${O}(10)$ and ${O}(100)$ diameters downstream of the body, and are known as the ‘secondary vortex street’ (in contrast to the ‘primary’ Kármán street closer to the body). Numerous studies have investigated these secondary vortices in both laminar and turbulent regimes, see for instance Wygnanski, Champagne & Marasli (Reference Wygnanski, Champagne and Marasli1986); Cimbala et al. (Reference Cimbala, Nagib and Roshko1988); Williamson & Prasad (Reference Williamson and Prasad1993); Huang, Kawall & Keffer (Reference Huang, Kawall and Keffer1996); Huang & Keffer (Reference Huang and Keffer1996) and Jiang & Cheng (Reference Jiang and Cheng2019). Their formation has been attributed to both the strain of turbulence by the mean flow (Cimbala et al. Reference Cimbala, Nagib and Roshko1988), and the interaction and merging of earlier vortices that form in the vicinity of the body (Huang & Keffer Reference Huang and Keffer1996). The exact formation mechanism of these secondary vortices is not the focus of the current work, but we note its potential relevance to the Townsend self-preserving hypothesis.
We close this brief review by noting that, if the hypothesis of Bevilaqua & Lykoudis (Reference Bevilaqua and Lykoudis1978) is accurate, i.e. if self-preservation is a manifestation of the coupling between the mean flow and the ‘main turbulent motion’ (to use Townsend's terminology) via large-scale coherent structures, then this could mean that various self-preserving behaviours exist for the same flow type (e.g. wake), depending on the dominant structure at play. Indeed, Bevilaqua & Lykoudis (Reference Bevilaqua and Lykoudis1978) found that self-preservation connected with vortex shedding produced characteristic length and velocity scales with starkly different growth rates, compared with self-preservation when vortex shedding is absent. No mention of small-scale differences was made in their work. However, it is now known, since the works of Nedić et al. (Reference Nedić, Vassilicos and Ganapathisubramani2013b), Dairay et al. (Reference Dairay, Obligado and Vassilicos2015), Obligado et al. (Reference Obligado, Dairay and Vassilicos2016), Cafiero & Vassilicos (Reference Cafiero and Vassilicos2019), Chongsiripinyo & Sarkar (Reference Chongsiripinyo and Sarkar2020) and Ortiz-Tarin, Nidhan & Sarkar (Reference Ortiz-Tarin, Nidhan and Sarkar2021), that different small-scale turbulence dissipation scalings lead to different growth rates of the mean-flow velocity and length scales during self-similar evolution. It is therefore not inconceivable that differences in large-scale coherent structures such as those discussed by Bevilaqua & Lykoudis (Reference Bevilaqua and Lykoudis1978) may also lead to differences in the small scales of the turbulence and the cascade as a whole (see Goto & Vassilicos Reference Goto and Vassilicos2016; Alves Portela, Papadakis & Vassilicos Reference Alves Portela, Papadakis and Vassilicos2018). In particular, while vortex shedding was found by Bevilaqua & Lykoudis (Reference Bevilaqua and Lykoudis1978) to generate large-scale intermittency at the edges of the wake due to the rapid alternation between slow fluctuations of low intensity and rapid fluctuations of high intensity, small-scale intermittency was not examined by them and the works of the past ten years mentioned above make it conceivable that coherent structures may also have a direct effect on small-scale intermittency. Demonstrating such an effect is one of this paper's aims.
Based on the above discussion, the primary goal of this work is to shed some light on two issues. First, is the hypothesis of Bevilaqua & Lykoudis (Reference Bevilaqua and Lykoudis1978) justified, i.e. does self-preservation come hand-in-hand with the emergence of large-scale vortices in the turbulent wake? More specifically, if vortex shedding were to be suppressed, would self-preservation disappear and reappear only when another large-scale coherent structure is formed? Our findings hint that this is indeed the case. Second, are small scales sensitive to the different types of large structures, i.e. do different types of self-preservation alter the cascade as a whole?
To answer these questions, this paper reports on four bluff body wakes whose level of vortex shedding was carefully varied by combining two shedding suppression methods: base bleeding and multiscale perimeter modification. We note that these choices do not exhaust the possibilities for wake suppression. The potential to suppress shedding is characterised via modal decomposition and linear stability analysis techniques. The extracted characteristic frequencies are found to scale with mean-flow properties, in support of the ideas of Roshko (Reference Roshko1955). Our results confirm and strengthen the finding of Bevilaqua & Lykoudis (Reference Bevilaqua and Lykoudis1978) that, with decreasing vortex shedding, the wake becomes self-preserving further downstream from the bluff body. We find that, when vortex shedding is completely suppressed, self-preservation occurs when other large-scale structures, namely the secondary vortices, emerge. Furthermore, we find that small-scale intermittency is dependent on the type of coherent structure present, and in fact increases with vortex shedding intensity. Finally, with regard to the connection between turbulence and mean flow that Bevilaqua & Lykoudis (Reference Bevilaqua and Lykoudis1978) considered necessary for self-preservation, we advance a mechanism based on the vortex shedding's generation of Reynolds shear stresses.
The structure of the article is as follows. Section 2 presents the experimental procedure and post-processing methodology employed in the study. Section 3 characterises the vortex shedding properties and describes its influence on the near and far turbulent wake. Finally, § 4 draws the conclusions of this study.
2. Methodology
2.1. Experimental details
Experiments were conducted in the Lille wind tunnel at Lille Fluid Mechanics Laboratory (LFML). The tunnel test section is  $1\ {\rm m} \times 2\ {\rm m} \times 21\ {\rm m}$ and is temperature regulated. The free-stream velocity was set to $U_\infty = 7.5$ ms
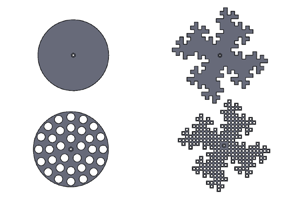
 $^{-1}$. At that speed, the turbulence intensity is 0.2 % when the tunnel is empty. Four types of plate shapes were tested (see figure 1): a solid circular plate (C), a circular plate of 40 % porosity (PC), a solid fractal plate (F) and a fractal plate of 40 % porosity (PF). Both fractal plates had two fractal iterations and were designed via the procedure described in Nedić et al. (Reference Nedić, Ganapathisubramani and Vassilicos2013a). All plates were 3D printed. The circular plate diameter was $D=105$ mm, and the gross area (i.e. before perforating PC and PF) of all plates was identical. The plate thickness was 4 mm. The global Reynolds number was $Re = D U_\infty /\nu = 52\,500$, where $\nu$ is the kinematic viscosity of air corresponding to a fully turbulent regime. The plates were suspended in the middle of the cross-section via the use of four piano strings, attached to a small bracket bolted on the centre of the plates. Visual inspection showed that the plate vibrations were negligible.
(a) Experimental configuration showing the plate mounting location and PIV/HWA measurement plane dimensions. The PIV and HWA experiments were conducted at multiple downstream locations, as indicated in the figure. (b) The various plates tested. From top to bottom: solid circular plate – C, porous circular plate – PC, solid fractal plate – F and porous fractal plate – PF. The characteristic diameter is  $D=105$ mm.

Hot-wire anemometry (HWA) measurements were conducted using a single Pt-W 5 micron wire, 3 mm long, with a 1.25 mm sensing element. The probe was driven by a TSI IFA300 anemometer. The acquisition frequency was set to 50 kHz with a low-pass filter at 20 kHz. For each measurement point, the acquisition time was 180 s. Calibrations of the probe were conducted at the beginning and end of each measurement campaign. It was verified that for all datasets we had at least  $k_w \eta = 1$, where $k_w = 2{\rm \pi} f/U$. In the above, $\eta$ is the Kolmogorov scale, $f$ the Fourier frequency and $U$ the local time-averaged velocity. The probe was translated using a vertical traverse system (see figure 1a), to conduct measurements at 22 equidistant points, located at $0.76>y/D>-2.1$ with respect to the centreline. Measurements were conducted at five locations downstream of the plate (6 $D$, 10 $D$, 20 $D$, 31.5 $D$ and 40 $D$) by manually moving the traverse system.
High-speed planar particle image velocimetry (PIV) measurements were conducted using a Quantronix high-speed laser and a 4MP Miro camera equipped with a 200 mm objective lens with an f-number equal to 5.6. The acquisition frequency was set to 100 Hz. The time separation between frames was between 90 and 180 ms, depending on the field of view. The seeding was water and glycol droplets of approximately 1  $\mathrm {\mu }$m. To obtain the vector fields, multipass processing was performed, with a final pass at $24 \times 24$ windows and 60 % overlap, leading to a final interrogation window size of 1.8 mm. Measurements were conducted in vertical streamwise (streamwise $x$, lateral $y$) planes of size $1.1D \times 1.78D$ (see figure 1a) which could be moved at various locations by translating the laser sheet and camera. For each case, 15 runs of 1018 velocity fields were acquired, resulting in 15 270 fields. The wakes of the plates C, F and PF were measured in the top plane $0.17>y/D>-1.61$ (see PIV1 plane in figure 1a), at distances 1.78 $D$, 6 $D$, 33 $D$ and 55 $D$ downstream of the plate. At distances 33 $D$ and 55 $D$, measurements were also conducted in the bottom plane $-1.40>y/D>-3.20$ (see PIV2 plane in figure 1a) for the C, F and PF plates, in order to capture the full wake which, due to its expansion, exceeded the boundaries of the PIV1 window. For those locations, the two measured planes were stitched together. Additionally, the wakes of the PC plate were measured on the top plane $0.17>y/D>-1.61$, at downstream distances 1.78 $D$ and 6 $D$. The measurement locations for the PIV and HWA experiments are summarised in table 1. Figure 2 shows example PIV snapshots at the near field of view of the four tested plates.
Measurement locations for each plate, for the PIV and HWA conducted in this study.

Example velocity snapshots for the four plates tested in the near PIV field.

2.2. Post-processing methodologies
2.2.1. Spectral proper orthogonal decomposition
Spectral proper orthogonal decomposition (SPOD) was used to characterise the vortex shedding structures emanating from the different plates. The simpler approach of binning the high-speed PIV measurements to produce phase averages was first attempted, but produced results which greatly resembled the total time average of the flow, instead of the various phases of the coherent structure. This was thought to occur due to two reasons. First, because the acquisition frequency of the PIV system could not be set to an exact integer multiple of the average shedding frequency. Second, because turbulent vortex shedding is not a strictly periodic phenomenon, but is rather characterised by a broad range of frequencies.
A partial solution to the above is SPOD, which solves the eigenvalue problem of the Fourier transform of the two-point space–time correlation tensor (Sieber, Paschereit & Oberleithner Reference Sieber, Paschereit and Oberleithner2016; Towne et al. Reference Towne, Schmidt and Colonius2018). In that way, modes that optimally represent the second-order space–time flow statistics and oscillate at specific frequencies (i.e. have time coherence) can be obtained. It can then be argued that the most energetic modes which correspond to frequencies close to the ones of vortex shedding will be representative of that phenomenon. The SPOD approach does not solve the issue that vortex shedding is only quasi-periodic, and therefore its dynamics is distributed into multiple frequencies, but ensures that the produced frequency-locked modes will contain information from the most relevant frequency, and not from frequencies which are unrelated to the coherent structure.
To obtain the SPOD modes from our PIV data, the algorithm described in Towne et al. (Reference Towne, Schmidt and Colonius2018) is used, where the PIV snapshots are separated in an ensemble of  $N$ realisations, with each realisation containing the evolution of a quantity (in our case the radial velocity fluctuations $u_r$) in axial and radial coordinates, respectively, $x,r$, and time $t$. Note that we consider a polar coordinate transformation, which for our planar data means that the axial coordinate $x$ is the same as the streamwise $x$ considered before, while the radial coordinate $r$ is effectively the same as the vertical coordinate $y$. Subsequently, discrete Fourier transform is applied to the ensemble which consists of $N$ realisations of the evolution of the scalar in space $x,r$ at different frequencies $f$. This allows the formulation of an $N\times N$ spectral eigenvalue problem for the ‘cross-spectral density tensor’ (i.e. the Fourier transform of the space–time correlation tensor evaluated at a particular frequency), which is repeated for each of the desired frequencies. For each frequency a set of spatial eigenmodes is produced, ranked according to the magnitude of their eigenvalues. For our experiments, only the first (most energetic) mode exhibited distinctive peaks at the shedding frequency. For more information on the SPOD algorithm see Towne et al. (Reference Towne, Schmidt and Colonius2018).
2.2.2. Local linear stability analysis of the average flow
While the SPOD analysis is a great tool in extracting periodic instabilities from the flow field, it cannot reveal whether they are absolute or convective in nature (see later in the section for these definitions). To further examine the nature of the periodic instabilities in the vicinity of the four plates, we performed stability analysis on the time-averaged axial flow profiles, which are not stationary solutions of the Navier–Stokes equations. We consider the standard Reynolds decomposition  $\hat {u}_j = U_j + u_j$, where $\hat {u}$ is the instantaneous velocity, $U$ the time-averaged velocity and $u$ the instantaneous difference (fluctuation) between the two. The subscript $j$ can be $x$,
$x$,  $r$ or $\theta$, denoting the axial, radial and azimuthal components of velocity, respectively. The average azimuthal velocity, $U_\theta$ is assumed to be zero for all cases, while the wake is assumed locally parallel, i.e. $U_r \approx 0$. Following several authors (Malkus Reference Malkus1956; Triantafyllou, Kupfer & Bers Reference Triantafyllou, Kupfer and Bers1987; Cimbala et al. Reference Cimbala, Nagib and Roshko1988; Mantič-Lugo et al. Reference Mantič-Lugo, Arratia and Gallaire2014; Gupta & Wan Reference Gupta and Wan2019; Gupta et al. Reference Gupta, He, Wan, Chen and Li2020), we consider a ‘mean-flow disturbance’ which in our case leads to perturbation equations expressed in $(x,r,\theta )$. The perturbations are assumed to be of the form $(\tilde {u}_x,i\tilde {u}_r,\tilde {u}_\theta ) \exp ({\rm i} ( m\theta + kx - \omega t ))$, where $\tilde {u}_x$, $\tilde {u}_r$, $\tilde {u}_\theta$ and $\tilde {p}$ are perturbations to the $x,r,\theta$ mean velocities and mean pressure, respectively. In the above, $m$ is the azimuthal wavenumber, $k = k_R + {\rm i}k_I$ is the streamwise wavenumber and $\omega = \omega _R + {\rm i} \omega _I$ is the angular frequency of the oscillation. The subscripts $R$ and $I$ in $k$ and $\omega$ denote the real and imaginary part of the quantities, respectively. Upon linearisation, the perturbation equations become (see also Gupta & Wan Reference Gupta and Wan2019)
 \begin{equation} \left.\begin{array}{c@{}}
0 = k\tilde{u}_x + \dfrac{1}{r}\dfrac{\partial}{\partial r}
(r\tilde{u}_r) + \dfrac{m}{r}\tilde{u}_\theta,\quad \omega
\tilde{u}_x = k\tilde{p} + kU_x \tilde{u}_x + m
\dfrac{\partial U_x}{\partial r}\tilde{u}_r,\\ \omega
\tilde{u}_r = \dfrac{\partial \tilde{p}}{\partial r} + kU_x
\tilde{u}_r, \quad \omega \tilde{u}_\theta =
\dfrac{m}{r}\tilde{p} + kU_x \tilde{u}_\theta.
\end{array}\right\}
\end{equation}
\begin{equation} \left.\begin{array}{c@{}}
0 = k\tilde{u}_x + \dfrac{1}{r}\dfrac{\partial}{\partial r}
(r\tilde{u}_r) + \dfrac{m}{r}\tilde{u}_\theta,\quad \omega
\tilde{u}_x = k\tilde{p} + kU_x \tilde{u}_x + m
\dfrac{\partial U_x}{\partial r}\tilde{u}_r,\\ \omega
\tilde{u}_r = \dfrac{\partial \tilde{p}}{\partial r} + kU_x
\tilde{u}_r, \quad \omega \tilde{u}_\theta =
\dfrac{m}{r}\tilde{p} + kU_x \tilde{u}_\theta.
\end{array}\right\}
\end{equation} Stability analysis is performed based on the Chebyshev spectral collocation method, with the discretisation in the radial direction performed on a Gauss–Lobatto–Chebyshev grid. This is mapped on a radially unbounded space  $r/D = \zeta /(1-\zeta ^2 + 1/R_{max})$, where $\zeta$ is the Chebyshev grid from 0 to 1 and $R_{max}=25$ is large enough to represent an unbounded space. The number of collocation points used was $N=120$. Increasing both $R_{max}$ and $N$ did not alter appreciably the results. More information on the numerical method can be found in Gupta & Wan (Reference Gupta and Wan2019).
The above analysis was used to determine whether an observed instability is of the absolute or convective type. If an impulsive disturbance grows exponentially at the location of its generation (i.e. its group velocity  $\partial \omega / \partial k$ is zero) the flow is termed absolutely unstable (Kupfer, Bers & Ram Reference Kupfer, Bers and Ram1987; Gupta & Wan Reference Gupta and Wan2019). If, on the other hand, the produced wave packet is convected downstream (group velocity non-zero), leaving the flow at the location of its generation undisturbed, the instability is of the convective type. The Kármán vortex street is generally accepted to originate from an absolute instability region close to the bluff body, shifting to a convective instability further downstream (Triantafyllou et al. Reference Triantafyllou, Kupfer and Bers1987; Williamson Reference Williamson1996).
To determine whether the near wake of the four tested plates is subjected to an absolute instability (vortex shedding) the ‘cusp’ method is used (Kupfer et al. Reference Kupfer, Bers and Ram1987; Hwang & Choi Reference Hwang and Choi2006). The spatio-temporal problem is solved, where the system of the above equations receives the input of a complex wavenumber, and yields a complex frequency as output. This procedure is repeated for a grid of complex  $k$ values, which are mapped on isolines of $k_I = \textrm {const}$ at the complex omega plane. The absolute frequency $\omega _0$ is then identified at the end of a typical cusp-like trajectory. If a cusp point is characterised by a positive imaginary part, the instability is of the absolute type, whereas if no cusp with positive imaginary part exists, only convective (amplifier) instabilities exist in the flow field. In our case, it was made sure that the requirement of the cusp point being covered only once by the image of $k_I = 0$ on the omega plane was fulfilled.
The above analysis has two significant limitations. First, it assumes that the average flow is locally parallel (i.e. that the average radial velocity is negligible). While this assumption can be thought correct in the far, self-preserving wake (Tennekes & Lumley Reference Tennekes and Lumley1972; Cimbala et al. Reference Cimbala, Nagib and Roshko1988), it is questionable in the near wake where the Kármán street originates. Still, previous studies have indicated that local weakly non-parallel stability analysis at the near wake of bluff bodies yields accurate predictions regarding the onset of vortex shedding and the frequencies involved (see e.g. Triantafyllou et al. Reference Triantafyllou, Kupfer and Bers1987). The second limitation is that the above analysis assumes that the mean-flow disturbance does not alter the Reynolds stresses of the flow (Malkus Reference Malkus1956), i.e. that turbulence remains ‘frozen’ under perturbations. Again, this assumption is questionable for high Reynolds number flows. However, there is an abundance of works in the literature (see for instance Triantafyllou et al. Reference Triantafyllou, Kupfer and Bers1987; Cimbala et al. Reference Cimbala, Nagib and Roshko1988; Gupta & Wan Reference Gupta and Wan2019) which suggests that the above linearised analysis yields accurate predictions even at very high Reynolds numbers, and in a variety of shear flows.
2.2.3. Zero crossings
A complementary analysis is also performed using the zero crossings of the streamwise fluctuating velocity  $u_x$. This approach allows us not only to characterise various length scales of a turbulent flow (Mazellier & Vassilicos Reference Mazellier and Vassilicos2008; Mora et al. Reference Mora, Pladellorens, Turró, Lagauzere and Obligado2019; Ferran, Aliseda & Obligado Reference Ferran, Aliseda and Obligado2023) but also its intermittency (Mazellier & Vassilicos Reference Mazellier and Vassilicos2008). The Rice theorem, when adapted to turbulent flows (Liepmann & Robinson Reference Liepmann and Robinson1953) allows us to estimate the Taylor micro-scale $\lambda$. In particular, it can be mathematically proved that $\lambda$ is proportional to the average distance $\bar {l}$ between zero-crossing points: $\bar {l}=B \lambda$. The constant $B$ is defined as $B=C_1 {\rm \pi}$, where $C_1$ is a constant that quantifies the non-Gaussianity of velocity derivatives ( $\textrm {d} u_x / {\textrm {d}\kern 0.06em x}$). For a Gaussian distribution $C_1=1$, and $C_1>1$ for an intermittent small-scale turbulence. More specifically, the analytical expression of this constant is (Mazellier & Vassilicos Reference Mazellier and Vassilicos2008)
 \begin{equation} C_1=\sqrt{\frac{2}{{\rm \pi} }}\frac{\sqrt{\overline{ \left( \dfrac{{\rm d}u_x}{{\rm d}\kern0.05em x} \right)^2 }}}{\overline{ \left\vert \dfrac{{\rm d}u_x}{{\rm d}\kern0.05em x} \right\vert }}, \end{equation}
with the overline denoting the time average. The constant  $C_1$ provides a simple way to quantify small-scale intermittency via the non-Gaussianity of the streamwise derivative of $u_x$. A larger value of $C_1$ therefore implies a more intermittent small-scale turbulence.
3. Results and discussion
3.1. Characterisation of vortex shedding
3.1.1. Vortex shedding attenuation
We first test the effect of the plate modifications (see figure 1b) in the near wake, aiming at a gradual attenuation of vortex shedding intensity. Figures 3 and 4 show the results of the SPOD analysis for the radial velocity component at the near PIV field ( $x/D \approx 1.78$). Figure 3 plots the eigenvalue of the first SPOD mode of each plate, over a range of Strouhal numbers $St = f\kern 0.06em D/U_\infty$, normalised with the total energy at each Strouhal number (i.e. the sum of the eigenvalues of all modes). The plates C, F and PC exhibit peaks at Strouhal numbers of $0.13$, $0.12$ and $0.16$, respectively, indicating the presence of coherent vortices. These values agree with the ones measured with the hot-wire for the streamwise velocity component (see figure 3b). As expected, the relative energy of F and PC plates is significantly lowered compared with the one of the C plate, due to the shedding–attenuating effect of wake bleeding and the fractal perimeter, already documented in Castro (Reference Castro1971) and Nedić et al. (Reference Nedić, Vassilicos and Ganapathisubramani2013b), respectively. Remarkably, the combination of both types of modifications (i.e. PF plate) completely eliminates the peak, producing only a very small bump at $St=0.29$ (see figure 3a), suggesting a further (if not total) elimination of vortex shedding. We note that the ‘spectra’ of the suboptimal eigenvalues did not exhibit any distinctive peaks (not plotted).
(a) Eigenvalue of the first SPOD mode, normalised with the sum of the eigenvalues for all modes, evaluated at each  $St$ for the four tested plates. Results are shown for the cross-wise velocity component at the near-wake PIV window ( $x/D \approx 1.78$). (b) The HWA spectra $10D$ downstream, $1D$ below the centreline.

Shape of the first SPOD mode of the radial velocity  $u_r$ at the dominant frequency for each case, at the PIV windows closest to the plate. Here, C, circular plate; F, fractal plate; PC, porous circular plate; and PF, porous fractal plate.

The above conclusions are also supported by the shapes of the first SPOD modes corresponding to the most energetic Strouhal number (i.e. at the peaks of figure 3a), plotted in figure 4. It can be seen that the C, F and PC plates exhibit strong alterations of the radial fluctuating velocity, spanning almost the whole PIV window, indicating the presence of a vortex. Even though the modes are qualitatively similar, there is a slight decrease in radial extent of the structure, from the C to the F and then to the PC plate. The characteristic mode of the PF plate is more fragmented, and remains confined to the upper section of the PIV window, suggesting that the  $St=0.29$ peak corresponds to a shear layer, rather than a vortex shedding type of instability. In Appendix A we show that the conclusions of the SPOD analysis are independent of the relative angle of the PIV plane with respect to the fractal plates.
It is noteworthy to mention that Castro (Reference Castro1971) proposed that two-dimensional porous plates completely suppress vortex shedding for plates beyond 20 % porosity, based on the observation of a sudden kink in the measured wake Strouhal number and drag coefficient at that value. The peaks in the measured spectra found by Castro at higher porosities were instead attributed to a flapping type of instability of the shear layers. Here, we instead show that the porous circular plate exhibits clear traces of vortex shedding, even at 40 % porosity, contrary to the postulation of Castro. Evidently, there seems to be a sudden change in the nature of vortex shedding at 20 % porosity, generating the kink that Castro (Reference Castro1971) observed, but shedding does not completely disappear. Low-order models (Steiros & Hultmark Reference Steiros and Hultmark2018; Steiros, Bempedelis & Ding Reference Steiros, Bempedelis and Ding2021) and recent measurements (Cicolin et al. Reference Cicolin, Chellini, Usherwood, Ganapathisubramani and Castro2024) suggest that, at large porosities, vortex shedding is of low intensity, and occurs sufficiently far from the plate, so that it has a negligible effect on the plate drag.
Figure 5 shows the Reynolds shear stress,  $\overline {u_x u_r}$, of the different plates (the overline denotes time average). A gradual decrease of stresses can be observed, both in magnitude and extent, as the plate changes from the C to the F, PC and PF plate. The PF case exhibits very small stress values confined to the shear layer (i.e. around $r/D = 0.5$), suggesting a shear-layer instability, in agreement with the SPOD results. Appendix A investigates the variation of the Reynolds shear stresses and mean streamwise velocities of the fractal plates with the relative angle of the PIV field of view, relevant to the plates.
Normalised cross-term of the Reynolds stresses,  $\overline {u_x u_r}/U_\infty ^2$, for the four tested plates at the near-wake PIV window.

The results of the SPOD and Reynolds stress analysis suggest that vortex shedding might be completely eliminated in the PF plate case. To investigate this further, we performed local linear stability analysis on the average  $U_x$ velocity profiles of the PIV1 window ( $U_\theta$ and $U_r$ are assumed negligible), for each plate. Using the cusp method, we found that the $m =\pm 1$ modes of the C, F and PF plates exhibit an absolute instability at Strouhal numbers of $0.1, 0.1$ and $0.15$, respectively (see some examples in figure 6), not too far from the experimentally determined ones (see the titles of panels in figure 4). The $C$ plate exhibits an absolute instability for all streamwise distances considered (i.e. $1.2< x/D<2.3$) while the F and PC plates exhibit an absolute instability only for $x/D<2$ and $x/D<1.45$, respectively. No absolute instability could be determined for the PF plate at any azimuthal mode, providing further support of the claim that the PF modification completely eliminates vortex shedding.
Examples of the cusp method for the (a) F, (b) PC and (c) PF plates at  $x/D = 1.4$. The $x$-coordinate of the cusp corresponds to the frequency of the absolute instability (if it corresponds to a positive $y$-coordinate). No cusp is found for the PF plate, suggesting only convective instabilities there.

3.1.2. Vortex shedding frequency scaling
The previous section indicates that a local linear stability analysis of the mean flow is relatively successful in reproducing the value of the characteristic frequency of vortex shedding if applied at the very near-wake location, in agreement with previous works (see for instance Triantafyllou et al. Reference Triantafyllou, Kupfer and Bers1987). This success hints that the shedding frequency at the very near wake (i.e. at the vortex-formation location) is primarily connected to the streamwise velocity gradient of the average flow, i.e.  $f = f(\partial U_x/\partial r)$. On dimensional grounds, we may thus define a revised Strouhal number as
 \begin{equation} St^* = \frac{f}{\dfrac{1}{2}\dfrac{\partial U_x}{\partial r}}, \end{equation}
which we might expect to have a constant value for any of the plates tested and to be applicable in the near vicinity of the plates (the coefficient  $1/2$ is added to render this Strouhal number comparable to the one deduced by Roshko (Reference Roshko1955), as will be shown shortly). Figure 7 is a plot of the above Strouhal number for the four plates tested, along with the streamwise distance interrogated at the near-wake PIV window. For each plate, the frequency is the same for all $x/D$ and is equal to the one acquired from the SPOD results of figure 3, while the mean velocity gradient was calculated as a first-order approximation, i.e. $\partial U_x/ \partial r \approx (U_{x,max} - U_{x,min})/(r_{max}-r_{min})$, where $U_{x,max}$ and $U_{x,min}$ are the maximum and minimum streamwise velocities at a particular cross-section, corresponding to the radial locations $r_{max}$ and $r_{min}$. Note that, due to the proximity of the plate in the near-wake PIV window, $U_{x,max} > U_\infty$, as the flow is locally accelerated in the shear layers; $r_{max}$ is the radial position where this local acceleration is maximum. Here, $r_{min}$ is effectively zero for all plates.
Revised Strouhal number vs normalised downstream distance for the four plates. Circle: C, square: F, cross: PC, triangle: PF. The ‘universal’ value of Roshko is depicted with a dashed line.

It can be observed that the three plates that exhibit vortex shedding have an almost identical behaviour, while the PF plate is distinctly different, a further indication of its drastically different near-wake physics. The C, F and PC plates exhibit a decreasing  $St^*$ as they approach the plate, due to the wake becoming narrower. Even though our PIV window does not allow for an inspection of shorter streamwise distances, the three plates seem to converge to $St^* \approx 0.16$ near the body (where vortex shedding is generated). The vicinity of the body is where (3.1) is expected to hold, and it is noteworthy that there the predicted value approaches the one that Roshko (Reference Roshko1955) proposed to be universal for bluff bodies.
The coincidence of our value with Roshko's is not fortuitous as his method for estimating it shares remarkable similarities to ours (despite the obvious differences). Roshko measured a wide range of vortex shedding frequency values, depending on the bluff body and Reynolds number tested, but postulated that the right length and velocity flow scales would collapse them into a single Strouhal value, independent of the body details. To derive those scales, Roshko considered the potential flow model of Kirchhoff (Reference Kirchhoff1869) for two-dimensional bluff bodies as a starting point, i.e. as a ‘base flow’. Kirchoff's model is known to be inaccurate, but Roshko adjusted it so that its predictions are consistent with the experimentally measured average pressure at the rear side of the various bodies (i.e. base pressure) he tested. Based on that revised Kirchoff model, Roshko then derived predictions for the wake width  $d$ and velocity on the dividing streamline $U_s$, which in turn yielded a universal $St\approx 0.16$ for all shedding frequencies, partially confirming his postulation (even though counter-arguments exist, see Gerrard Reference Gerrard1966).
Our stability analysis leads to the same conclusion as Roshko's method, and that can be seen from the fact that in his simplified model  $\partial U_x/\partial r = 2U_s/d$, i.e. Roshko's Strouhal number definition becomes identical to (3.1). Therefore, both methods identify (via a different starting point) the average velocity gradient as the appropriate normalisation parameter for the vortex shedding frequency. This is in agreement with the idea of Bevilaqua & Lykoudis (Reference Bevilaqua and Lykoudis1978) that large-scale fluctuations (and the rate that those occur) are intimately connected to the mean flow.
3.2. Effect of coherent structures on the wake
3.2.1. Onset of self-preservation
Given the variation of the vortex shedding intensity achieved with the various plate modifications, we now proceed to test its effect on the self-preservation of the wake. For that we consider the evolution of the streamwise velocity and the cross-term of the Reynolds stress tensor, shown in figure 8. In particular, we plot the radial distributions of  $\Delta U = (U_{x,max} - U_x)$ and $\overline {u_x u_r}$, normalised with their maximum values at each streamwise location (note that $\Delta U_{x,max} = (U_{x,max} - U_{x,min})$), vs the normalised radial coordinate $r/\delta$, with $\delta ^2 = ({1}/{\Delta U_{max}}) \int _0 ^\infty \Delta U r \,\textrm {d}r$. In the near-wake PIV window ( $x/D \approx 2$), $U_{x,max}$ is calculated as in § 3.1.2. In the other PIV windows $U_{x,max}$ is effectively $U_\infty$. The upper limit of integration for the calculation of $\delta$ is the lateral end of the PIV domain.
Similarity profiles of streamwise momentum deficit and cross-term of Reynolds stresses, for the four plates. The four colours correspond to the four downstream PIV plane locations, as shown in the top left legend.

In figure 8 four colours are plotted per panel, corresponding to the four PIV windows considered, i.e. at  $x/D = 1.78D, 6D, 33D$ and $55D$ (see figure 1), while the multiple lines correspond to different streamwise locations within the PIV windows. The spikes (e.g. see red line at $r/\delta \approx 1$ in panel a) correspond to locations where the PIV1 and PIV2 windows were stitched (see figure 1). Note that at long distances downstream the velocity deficit is very small and therefore small errors caused by the stitching lead to large spikes in the normalised velocity deficit. The actual stitching error is actually smaller than $0.5\,\% U_\infty$ (see for instance figure 15b). In Appendix B we confront the profiles of the various plates at 55 $D$ downstream, and show that there is a significant difference in the profile shapes, when vortex shedding is suppressed.
It can be observed that the earliest onset of self-preservation is achieved by the C and F plates, with the streamwise velocity and Reynolds stresses roughly collapsing from the second PIV window ( $6D$). The PF plate which lacks the vortex shedding instability exhibits a later onset of self-preservation, only approximately reaching it at the third PIV window, i.e. at 33 $D$, for both flow quantities. These results confirm and strengthen the earlier conclusion of Bevilaqua & Lykoudis (Reference Bevilaqua and Lykoudis1978) that vortex shedding accelerates the onset of self-preservation.
A natural question that may arise is whether the delayed onset of self-preservation in the PF case occurs because, in the absence of vortex shedding, another type of large-scale vortical structure needs to be first formed in the wake to render self-similarity possible. As explained in the introduction, this was the hypothesis of Bevilaqua & Lykoudis (Reference Bevilaqua and Lykoudis1978) that was not, however, verified. Our results indeed suggest that this is the case. Figure 9 plots the normalised eigenvalues of the first SPOD mode for four PIV windows at different downstream distances for the PF case. Well-defined periodicity, reflective of the existence of coherent structures, appears only after  $33D$, i.e. at the point where the wake becomes self-preserving. Figure 10 shows the shape of the SPOD modes at the peak Strouhal number of each curve of figure 9, i.e. the most dominant coherent structure at each PIV window. It can be seen that, up until $6D$, the dominant structures are small and confined to the shear layers of the wake, and are thus of the Kelvin–Helmholtz type, while at $33D$ there is indeed the trace of a large-scale structure. By comparing these results with those of Cimbala et al. (Reference Cimbala, Nagib and Roshko1988) and Huang & Keffer (Reference Huang and Keffer1996) for porous strips, it can be deduced that the large-scale structure that we observe at $33D$ is the secondary vortex street which, under the absence of vortex shedding, appears around $25D$ downstream of bluff bodies (Cimbala et al. Reference Cimbala, Nagib and Roshko1988; Huang & Keffer Reference Huang and Keffer1996). The above results suggest that the postulation of Bevilaqua & Lykoudis (Reference Bevilaqua and Lykoudis1978) is indeed correct, i.e. that self-preservation is a result of the formation of large vortices, capable of linking the mean flow with the ‘main turbulent motion’.
Eigenvalue of the first SPOD mode for the radial velocity component, normalised with the sum of the eigenvalues for all modes, evaluated at each  $St$ for the PF plate. Each curve corresponds to a different PIV window downstream of the plate.

Shape of the first SPOD mode of the peak frequency of each curve of figure 9 for the PF plate. Note that the near wake ( $x/D<7)$ exhibits shear layers instabilities, and the far wake $x/D>30$ a well-defined vortex street, similar to the sketch of Huang & Keffer (Reference Huang and Keffer1996) for two-dimensional porous plates, shown in figure 9(b).

3.2.2. Intermittency
We now turn our attention to the intermittency of the flow by distinguishing between large-scale-dominated external intermittency and small-scale, internal, intermittency. Bevilaqua & Lykoudis (Reference Bevilaqua and Lykoudis1978) showed that the presence of vortex shedding vortices increases large-scale intermittency near the edges of the wake, as their coherent motion induces alternations between slow fluctuations of low intensity (i.e. outer flow) and rapid fluctuations of high intensity (inner wake). This is something that we also observe in our measurements. Figure 11(a) plots the intermittency coefficient  $\varGamma$ at $40D$ for all plates; $\varGamma$ is defined as the inverse of the flatness of $\textrm {d} u_x/{\textrm {d}\kern 0.06em x}$ normalised by its minimum value over the radial profile at $x$ which is at, or very close to, $r=0$. Therefore, $\varGamma$ is defined using the flatness of the velocity derivative, and not via its increments for a given scale separation. Moreover, it is normalised in a way that its value is one for a fully turbulent flow and drops to zero outside the wake's interface. In consequence, in the way we have defined it, and similarly to the approach taken in previous works (Townsend Reference Townsend1949), $\varGamma$ ultimately quantifies the radial dependency of the intermittency of the turbulent wake. The value of $\varGamma$ is much more sensitive to high values of $\textrm {d}u_x/{\textrm {d}\kern 0.06em x}$ than $C_1$, and so in the presence of a sharp dynamic interface between the inner turbulent wake and the outer laminar flow, slowly decreasing values of $\varGamma$ with increasing distance from the centreline reflect high large-scale-dominated external intermittency whereas a steep slope of $\varGamma$ suggests reduced large-scale-dominated external intermittency at the wake boundary (Townsend Reference Townsend1976; Bevilaqua & Lykoudis Reference Bevilaqua and Lykoudis1978). It can be observed that the slope of $\varGamma$ is steeper for the plates with lower vortex shedding intensity (e.g. the PF plate), as shedding promotes mixing: wakes with suppressed vortex shedding are thus expected to exhibit a sharper, and more ‘insulated’ boundary between the wake and the outer flow.
(a) Intermittency factor  $\varGamma$ at $40D$ downstream of the plates and (b) $C_1$ coefficient at the centreline of the wake, for the four different plates. Both quantities were measured using HWA.

The above result is in agreement with the conclusions of Bevilaqua & Lykoudis (Reference Bevilaqua and Lykoudis1978) regarding the large-scale ‘interface’ intermittency, where it was found that a wake with the absence of shedding exhibits steeper  $\varGamma$ profiles compared with a wake dominated by vortex shedding (see figure 3 in Bevilaqua & Lykoudis Reference Bevilaqua and Lykoudis1978). Figure 11(b), however, shows a result concerning another type of intermittency, small-scale internal intermittency on the centreline where $\varGamma =1$ and the flow is not in the proximity of the wake boundary but rather in the turbulent core. The coefficient $C_1$ at the centreline of the wake characterises the intermittency of the small scales of turbulence (see § 2.2.3) and it is plotted in figure 11(b) for all plates. The plates which exhibit vortex shedding show a consistent increase of small-scale intermittency with streamwise distance, while the PF plate exhibits small values very close to unity at all streamwise distances and therefore, effectively, near absence of small-scale intermittency (note that $C_1 = 1$ denotes absence of small-scale intermittency). Evidently, the shed vortices of the C, F and PC plates are more capable of affecting the small eddies of the flow, compared with the secondary street vortices of the PF plate. It is a highly non-trivial conclusion that the large-scale vortices can have such a big influence on the small-scale intermittency of the turbulence in the core of the wake. One may think that the absence of vortex shedding reduces the Reynolds number of the turbulence and thereby reduces small-scale intermittency as it is well known that small-scale turbulence is increasingly intermittent with increasing Reynolds number. Indeed, the Taylor length-based Reynolds number $Re_\lambda = \sqrt {\overline {u_x ^2}} \lambda /\nu$ of the small-scale core turbulence measured via HWA is significantly larger for the C, F and PC plates than for the PF plate ( $\lambda = \sqrt {15 \nu \sqrt {\overline {u_x ^2}}/\epsilon }$). This is shown in figure 12, where it can also be observed, however, that $Re_\lambda$ increases slightly with streamwise distance in the PF case whereas it decreases quite sharply in the C, F and PF cases for which $C_1$ in fact increases with streamwise distance. Low/high values of $C_1$ can therefore not be attributed to high/low values of $Re_{\lambda }$ in our flows. The evidence therefore suggests that small-scale intermittency in the core turbulence at the centre of the wake requires vortex shedding vortices. In fact, $Re_{\lambda }$ and $C_1$ are low in the PF case even in locations where the secondary street is shown to be prominent ( $x/D>30$), suggesting that it may not be just the presence of a large-scale coherent structure that matters for the appearance of small-scale intermittency at the core, but even the type of it.
Reynolds number based on the Taylor microscale at the centreline of each plate measured via HWA.

3.2.3. Wake recovery
Finally, we investigate the effect of vortex shedding (or the absence of it) on the wake development. We consider a simplification of the Reynolds stress evolution equations, in which the pressure terms (pressure-rate-of-strain tensor) are considered to cause a redistribution of energy among the Reynolds stresses (Pope Reference Pope2000). The turbulent transport terms are assumed to attenuate the intense Reynolds stresses located at the shear layers of the flow (Pope Reference Pope2000), decreasing in that way the turbulent production. We may thus assume that, in our simplifying consideration, the effect of turbulent transport can be grouped with that of the dissipation term  $\epsilon$. We thus end up with turbulence stresses which are attenuated by dissipation $\epsilon$, redistributed within its various components by the fluctuating pressure and augmented by the production terms (themselves a product of turbulent fluctuations with the velocity gradient $\partial U_x/\partial r$). We note that the dissipation term of the Reynolds shear stress can be either positive or negative, but its value is expected to be negligible away from solid boundaries (Pope Reference Pope2000). We also note that the production term of the radial Reynolds stress component, $\overline {u_r ^2}$, is negligible in the far wake.
The above simplified representation may be used to shed some light on the flow evolution. The starting point can be thought to be the ‘bluffness’ of the tested body. If it is bluff enough, it will cause a mean recirculation in its wake: wakes like that exhibit large negative convective velocities, and can be thus thought to be prone to absolute instabilities, i.e. vortex shedding (see discussion in § 2.2.2). Indeed, among the plates tested, C, F and PC exhibit an (absolute) vortex shedding instability (see § 3.1.1) and recirculation (see figure 15a). On the other hand, the PF plate lacks a recirculation region, and thus any perturbations are convected downstream by the average flow, rather than staying put. In that case, the instabilities are convective in nature (see § 2.2.2).
If vortex shedding emerges (absolute instability), it will cause an increase of turbulent fluctuations by an order of magnitude (see for instance figure 5), amplifying in that way the production of Reynolds stresses in the near wake (as production of Reynolds stresses is proportional to the magnitude of these stresses). Reynolds stresses will thus increase, and by extension, their dissipation. This intuitive result is verified using our PIV and HWA data in figures 13 and 14(a), where, at the near wake, the plates with the larger vortex shedding intensities (e.g. C and F), exhibit larger maximum turbulence kinetic energies  $K$, Reynolds shear stresses and production/dissipation terms of the streamwise velocity variance. Using our PIV data, the turbulence kinetic energy is estimated as $K=0.5(\overline {u_x^2} + \overline {u_r^2})/U_\infty ^2$ (it was checked that a different estimation $K=0.5(\overline {u_x^2} + 2\overline {u_r^2})/U_\infty ^2$ does not alter the trends) and the production term of the streamwise Reynolds stresses, $u_x ^2$, as $\varPi = 2\overline {u_x u_r} \partial U_x/\partial r + 2\overline {u_x ^2} \partial U_x/ \partial x$. The dissipation rate is calculated from the HWA data as $\epsilon = 15 \nu \int k_w ^2 E_{11} \,\textrm {d}k_w$. $E_{11}$ is the one-dimensional energy spectrum and $\nu$ the kinematic viscosity.
Maximum values over the radial direction of (a) turbulence kinetic energy, (b) Reynolds shear stress and (c) production of the streamwise Reynolds stresses, as functions of the downstream distance, at the four PIV windows. The plates are as shown in (c). The solid lines are power-law fits.

(a) Maximum dissipation rate of the HWA profiles measured for each plate, at four downstream distances and (b) ( $U_{max} - U_{min})/\delta$ over downstream distance at the four PIV windows tested. The solid lines are power-law fits.

Intense vortex shedding in the near wake will therefore generate high Reynolds shear stresses (as also seen in figure 5). In turn, the Reynolds shear stresses will generate strong streamwise velocity gradients  $\partial U_x/\partial x$ through the average momentum equation (i.e. through the mixing of the wake with the outer flow). Considering a slowly expanding wake (i.e. $\partial \delta / \partial x \approx 0$), and approximating $\partial U_x/\partial r \approx (U_\infty - U_x)/\delta$, we obtain
 \begin{equation} \frac{1}{\delta}\partial U_x/\partial x ={-} \frac{1}{\delta} \partial (U_\infty - U_x)/\partial x \approx{-} \frac{\partial}{\partial x}(\partial U_x/\partial r). \end{equation}
A strong gradient  $\partial U_x/\partial x$ will thus lead to a strongly negative $\partial /\partial x (\partial U_x/\partial r)$, i.e. a fast wake recovery for the plates with intense vortex shedding. This is verified in figure 14(b), where the wakes with larger shedding end up having the smallest velocity deficit in the far wake (largest recovery), despite starting from larger velocity deficits in the near wake. The velocity deficit difference is illustrated in figure 15, which compares the normalised streamwise velocity distribution at $x/D = 1.5$ (near wake) and $x/D = 55$ (far wake) for the C, F and PF plates.
Average streamwise velocity distribution at (a)  $x/D = 1.5$ and (b) $x/D =55$. The colours are as in figure 14. The PF plate (green line) has the largest velocity deficit in the far wake, even though it initially exhibits the smallest deficit. Note the spike in the green curve in figure 15, due to the stitching of the two PIV windows.

Finally, the fast wake recovery of the plates with vortex shedding, will lead to the abrupt attenuation of the production term (as the production term scales with the mean velocity gradient). This is verified in figure 13(c), where the plates with higher vortex shedding (and quicker wake recovery) exhibit a faster decay of their production term, compared with the plates with weaker shedding. Given that high-shedding plates also exhibit higher initial dissipation rates, the above result suggests a faster decay of turbulence for the high-shedding plates in the far wake. This is validated in figure 13(a,b), for the C and F plates, when compared with the PF plate.
The above simplified process is summarised in figure 16, which illustrates the process of wake recovery: high vortex shedding (initial, large Reynolds stresses) will accelerate the steps which lead to recovery. The PF plate wake that lacks vortex shedding and only develops large coherent structures in the far wake (i.e. secondary vortex street) exhibits the slowest evolution, retaining the largest momentum deficit and turbulence properties (i.e. Reynolds stresses, dissipation) of the four tested plates in the far wake, despite its initial condition being the mildest. A variation of intensity in vortex shedding thus has a significant effect on the wake's turbulence properties and on their relation with the mean flow. This can be further seen by plotting the distribution of the normalised eddy viscosity (see figure 17), calculated as  $\nu _t = {-\overline {u_x u_r}}/{(\partial U_x/\partial r)}$ for the different plates. It can be seen that an increase in shedding intensity leads to an increase in the eddy viscosity of the flow.
Simplified loop diagram of the recovery of a turbulent wake. Here,  $\varPi$, $\epsilon$, $T$ and $RS$ stand for Reynolds stress production, dissipation, turbulent transport and Reynolds stresses, respectively. Pressure is assumed to only contribute to Reynolds stress redistribution. Vortex shedding gives an initial amplification of the Reynolds stresses, speeding up the recovery process.

Normalised eddy viscosity profiles at (a)  $x/D \approx 6$ and (b) $x/D \approx 33$.

4. Summary and conclusions
This work presents an experimental study of the influence of vortex shedding intensity on the near and far wake of bluff bodies. Four plates were tested using high-speed planar PIV and HWA, and their flow fields were analysed using a combination of SPOD, linear stability analysis of the mean flow and inspection of their turbulence statistics. Variation of the vortex shedding intensity, and its elimination, was achieved by modifying standard flat plates via the separate/combined effects of porosity, and multiscale perimeter.
Vortex shedding is found to be intimately connected to the mean-flow field. In particular, the vortex shedding Strouhal number of our tested plates, when the mean velocity gradient was used in the normalisation, exhibited the value that was postulated by Roshko (Reference Roshko1955) to be universal for vortex shedding. This implies a strong connection between mean flow and turbulent fluctuations induced by the presence of coherent structures. According to the hypothesis of Bevilaqua & Lykoudis (Reference Bevilaqua and Lykoudis1978), this connection is also responsible for the emergence of self-preservation in turbulent wakes, contrary to the hypothesis of Townsend (Reference Townsend1956, Reference Townsend1970, Reference Townsend1976) that self-preservation is the effect of a loss of memory of initial conditions. Our results are in favour of the arguments in Bevilaqua & Lykoudis (Reference Bevilaqua and Lykoudis1978), as we have found that the onset of self-preservation is accelerated when vortex shedding vortices (which carry the memory of initial conditions) are present. Our results also suggest that if vortex shedding is suppressed, self-preservation appears when other large-scale structures (in our case, the secondary vortex street) have had time to form, giving further credibility to the hypothesis of Bevilaqua & Lykoudis (Reference Bevilaqua and Lykoudis1978). The presence/absence of vortex shedding enhances/depletes the large-scale intermittency at the edges of the wake, but also the small-scale intermittency at the centreline of the wake. The latter result is particularly compelling, as it implies that the degree of small-scale intermittency is directly controlled by large-scale structures. Finally, we have studied the evolution of the wake statistics by using theoretical arguments and our experimental results and have found that the presence of strong shed vortices accelerates the growth of Reynolds stresses and the recovery of the wake, bringing it to a well-mixed state sooner than otherwise. By contrast, the wake of the porous–fractal plate, which is the one that lacks vortex shedding, retains relatively high values of velocity deficits and Reynolds stresses for long streamwise distances, even if its initial condition is that of a relatively mild/weak wake. Future work should focus on uncovering the physical mechanisms that link large-scale coherent structures, self-preservation and small-scale intermittency.
Acknowledgements
The experiments were conducted during the 2021 and 2022 Lille Turbulence Programmes. K.S. is grateful to V. Gupta for providing access to the stability analysis code and to Y. Hwang for useful discussions. J.C.V. acknowledges funding by the European Union (ERC Advanced Grant NoStaHo, project number 101054117). Views and opinions expressed are, however, those of the author(s) only and do not necessarily reflect those of the European Union or the European Research Council. Neither the European Union nor the granting authority can be held responsible for them.
Declaration of interests
The authors report no conflict of interest.
Appendix A. Axial symmetry in the near wake of fractal plates
We test the axisymmetry of the near wake of the F and PF plates by conducting planar PIV measurements in two planes with a relative angle of  $45^\circ$, as shown in figure 18(a) (note that F45 and PF45 refer to measurements conducted at the $45^\circ$ angle plane for the F and PF plates, respectively). We first investigate the sensitivity of the coherent structures to the angle of measurement. Figure 18(b) shows that the eigenvalues of the first SPOD mode of the radial velocity are very similar for the different angles. A slight difference can be observed in the PF45 case, which exhibits the highest peak at $St=0.49$, instead of the $St=0.29$ of the PF case (however, we note that the differences in the magnitude of the eigenvalues are very small between the PF and PF45 cases). Figure 19 shows the eigenmode shapes corresponding to the highest eigenvalues of figure 18(b). The F45 case suggests an outward displacement of the vortex structure, compared with the one corresponding in the F case – this is likely because the F45 plane is behind an ‘extrusion’ of the fractal plate (see figure 18a). The most dominant mode of the PF plate exhibits larger shear-layer structures, compared with the PF45 case, as its corresponding Strouhal number is much lower.
(a) The two planes for which PIV was acquired, with  $45^\circ$ between them. (b) Eigenvalue of the first SPOD mode for the radial velocity component, normalised with the sum of the eigenvalues for all modes, evaluated at each $St$ for the F and PF plates, at two angles.

Shape of the first SPOD mode of the peak frequency of each curve of figure 18(b) for the F and PF plates.

Figures 20 and 21 compare the mean streamwise velocities and Reynolds shear stresses of the fractal plates. While there is very little variation in the mean velocity between the two angles of measurement, some differences can be observed in the Reynolds stresses: the F45 and PF45 plates exhibit more extensive shear layers compared with their zero-angle counterparts, as they are behind the ‘extrusion’ of the fractal. However, their maximum values remain approximately the same.
Normalised mean streamwise velocity ( $U_x/U_\infty$) for the F and PF plates at two angles of measurement (see figure 18a for the plane angle).

Normalised Reynolds shear stresses ( $\overline {u_x u_r}/U_\infty ^2$) for the F and PF plates at two angles of measurement (see figure 18a for the plane angle).

Appendix B. Comparison of self-similar profiles for the various plates
In figure 22 we plot the curves of figure 8, but for each of the plates at the location  $55D$ downstream, where all profiles are self-similar. To enable a better comparison between plates, we removed the stitching error of the PIV windows, by performing a ‘crude’ correction where an identical shift of the statistics of the PIV2 window (see figure 1). We observe that, while the $C$ and $F$ plates have similar profiles (even though some differences persist), there is an evidently different distribution of both mean velocities and Reynolds shear stresses of the PF plate, compared with the plates with vortex shedding.
(a) Normalised velocity deficit and (b) normalised Reynolds shear stresses for various plates,  $55D$ downstream.


 Open access