

Introduction
Milking dairy cows once compared with twice daily results in a loss of milk production, but has a positive effect on body condition score (Davis et al., Reference Davis, Farr and Stelwagen1999; Rémond et al., Reference Rémond, Aubailly, Chilliard, Dupont, Pomiès and Petit2002; O'Brien et al., Reference O'Brien, Gleeson and Mee2005). However reduced milking frequency may result in increased milk leakage, longer milking times and udder distension. Some of these factors in turn could impact on animal health and welfare by affecting cow locomotory ability and udder health.
Milk leakage is a condition in which milk loss occurs through the teat canal. Milking high yielding dairy cows once per day could increase the degree of udder filling prior to milking, resulting in larger volumes of milk being stored in the teat cistern. This could increase pressure on the teat sphincter before milking, thus resulting in milk leakage. The frequency of milk leakage differs between farms and can range from 0 to 36% within a farm (Schukken et al., Reference Schukken, Grommers, van de Geer, Erb and Brand1991). For cows that are housed during lactation, leaked milk enhances bacterial growth in the bedding material and thus increases the risk of environmental mastitis (Elbers et al., Reference Elbers, Miltenburg, Lange, Crauwels, Barkema and Schukken1998; Waage et al., Reference Waage, Odegaard, Lund, Brattgjerd and Rothe2001). However, the health implications of milk leakage for cows at pasture are less well known. Automatic milking systems appear to increase the risk of milk leakage possibly due to irregular milking intervals (Persson Waller et al., Reference Persson Waller, Westermark, Ekman and Svennerstyen-Sjaunja2003). An association between peak milk flow-rate and milk leakage was also observed in automatic milking systems (Persson Waller et al., Reference Persson Waller, Westermark, Ekman and Svennerstyen-Sjaunja2003). Milk yield per cow can influence cow peak milk flow-rate (Blake and McDaniel, Reference Blake and McDaniel1978). Irregular milking intervals might influence milk yield per milking and in turn, peak milk flow rate and the level of milk leakage. Klass et al. (Reference Klass, Enevoldsen, Ersboll and Tolle2005) concluded that higher yielding cows, easy milking cows and cows with high peak milk flow-rates were more likely to have an increased risk of milk leakage. Therefore, differences in milk yield per cow due to milking frequency or cow nutritional level may influence peak milk flow-rates and as a consequence milk leakage. A linear association was detected between days in milk and the risk of milk leakage with cows < 100 days calved more likely to have milk leakage (Klass et al., Reference Klass, Enevoldsen, Ersboll and Tolle2005). Bruckmaier and Hilger (Reference Bruckmaier and Hilger2001) also suggested that milk leakage decreased as days in milk increased. Therefore, the stage of lactation is important if differences in milk leakage are to be observed.
Once daily milking could have potential benefits in terms of improved hoof health due to reduced daily walking time on farm roadways (Boyle et al., Reference Boyle, O'Brien and Gleeson2005). However, reducing milking frequency is likely to increase cow discomfort due to udder distension (Osterman and Redbo, Reference Osterman and Redbo2000). Discomfort due to an increase in udder size may act as an impediment to comfortable movement of the rear legs. Indeed Boelling and Pollott (Reference Boelling and Pollott1998) suggested that poor locomotion could be a problem for cows with a large udder. Furthermore, udder firmness may be high in cows milked less frequently, especially in early lactation, and this could also influence cow locomotory ability. A high nutritional level during early lactation could further aggravate the problem (Manson and Leaver, Reference Manson and Leaver1988).
Teat hyperkeratosis (HK) or teat callosity is a commonly observed teat condition in dairy cows and describes a thickened smooth keratin ring or extending fronds of keratin around the teat orifice (Sieber, Reference Sieber1980; Shearn and Hillerton, Reference Shearn and Hillerton1996; Neijenhuis et al., Reference Neijenhuis, Barkema, Hogeveen and Noordhuizen2000). Michel et al. (Reference Michel, Seffner and Schulz1974) observed HK with suckler cows and Sieber (Reference Sieber1980) reported HK with hand milked cows. The condition is the result of a normal physiological process of adaptation to milking which continues during lactation (Sieber and Farnsworth, Reference Sieber and Farnsworth1981).The level of teat HK can be directly related to specific conditions in the milking machine. For example, the length of time teats are exposed to a vacuum may affect the level of HK (Hamann, Reference Hamann1987). Shearn and Hillerton (Reference Shearn and Hillerton1996) concluded that higher yielding cows have higher HK scores and that this may be due to longer milking times. Likewise, Mein and Thompson (Reference Mein and Thompson1993) suggested that the degree of HK was greater with increasing milk yield or machine-on time. Teat HK is also lower where clusters were removed at a flow-rate of 0.8 kg/min compared with a cluster removal time of 0.2 kg/min (Gleeson et al., Reference Gleeson, O'Callaghan and Rath2003). Hence, the condition of the teats of cows milked once per day may be improved due to fewer milking occasions. On the other hand, a longer duration of milking on one occasion per day could negatively affect teat condition. Milking frequency and nutritional level could influence milking characteristics such as cluster-on time due to the larger milk volume at one milking. Physiological or patho-physiological responses of the body to stress due to factors such as udder tension and restricted locomotory ability may be reflected in changes in blood composition. Blood cell constituents maintain a physiological balance between environmental conditions and an animal's body by restoring normal homeostasis (Radostits et al., Reference Radostits, Blood and Gay1994). Neutrophilia and lymphopenia is a common finding in stressed animals and is associated with changes in white blood cell trafficking and release from the bone marrow by elevated concentrations of glucocorticoids (Dunn, Reference Dunn1989).
The objective of this study was to investigate the effect of milking frequency and nutritional level on some aspects of health of cows as measured by long-term (teat condition, milking characteristics over a complete lactation) and short-term (incidence of milk leakage, udder firmness, locomotory ability and blood cell composition in early lactation) indicators.
Material and methods
Animals and experimental design
Sixty spring-calving, pluriparous Holstein-Friesian cows were blocked according to expected calving date, parity and previous lactation milk yield. Cows were assigned to a factorial arrangement of treatments after calving; twice a day (TAD) milking on a high or low nutritional level; once a day (OAD) milking on a high or low nutritional level. High nutritional level and low nutritional level were defined by total concentrate offered over the complete lactation (420 kg and 137 kg per cow, respectively) and post-grazing sward height (75 and 55 mm), respectively, during the grazing season. Mean calving date was 11 March. Cows were housed in cubicles until turnout to pasture on the 22 March. During the indoor period all cows received ad libitum silage and a concentrate supplementation (7 kg per cow per day and 4 kg per cow per day, to high and low nutritional groups, respectively). At turnout, concentrate supplementation was reduced to 4 kg per cow per day and 1 kg per cow per day for high and low nutritional groups, respectively. Cows grazed a similar ryegrass pasture on adjacent paddocks, without supplementation from 17 April until 9 October. Pasture allowance during the grazing period was 28 kg per cow per day and 18 kg per cow per day for high and low nutritional groups, respectively. Pasture allowance was dictated by paddock size and pre-grazing height. During the late grazing period (21 October–30 November) cows were supplemented with silage and concentrate (4 kg per cow per day and 2 kg per cow per day for high and low nutritional groups, respectively). Cows were milked as one group in a 20-unit, 80-degree side-by-side milking parlour, using 16 mm (internal diameter) long milk tubes, with a milk lift of 1.5 m above the cow standing to a 72 mm (internal diameter) single milk-line. Pre-milking teat preparation consisted of washing with warm running water and drying with individual paper towels. The milking unit consisted of a heavy cluster weight (3.2 kg) with a claw volume of 150 ml, wide-bore tapered liners (31.6-21.0 mm) and a simultaneous pulsation pattern. Clusters were automatically removed as directed by electronic milk meters linked to a software program, when milk flow-rate dropped to 0.2 kg/min with a delay time of 20 s. OAD cows were milked at 0730 h and TAD cows were milked at 0730 and 1530 h.
Milking characteristics
Milking characteristics including milk letdown time (s), cluster-on time (s), peak milk flow-rate (kg/min), and average flow-rate were recorded daily for each individual cow using Dairymaster Weigh-all electronic milk meters (Dairymaster, Causeway, Co Kerry, Ireland). Milk letdown time was computed as the time interval from cluster application to when the milk flow increased to 0.2 kg/min. Milking time was computed as the time interval from milk let down to automatic cluster removal when flow-rate decreased to 0.2 kg/min. Data for each individual cow were averaged for each month of lactation.
Teat hyperkeratosis
Teat orifices were classified for hyperkeratosis (HK) using a severity scale described by Neijenhuis (Reference Neijenhuis1998). Teats were scored and placed into one of five classes. Score 1 was a normal teat-end orifice. Score 2 was a slight smooth or broken ring of keratin while score 3 was a moderate raised smooth or broken ring of keratin. Score 4 indicated a large raised smooth or broken ring of keratin, while score 5 indicated a severe broken ring of keratin. Teat inspections were always conducted by the same observer and were carried out within three days of calving and monthly thereafter until the end of lactation. The operator, using a lamp to illuminate the teat-ends, classified teats for HK immediately after cluster removal at the morning milking. A total HK score for each cow on each inspection was obtained by calculating the average score of the four teats.
Milk leakage and udder firmness
One operator inspected cows for milk leakage and udder firmness on two consecutive mornings in mid April, May, June and July. Observations were carried out when cows were presented for milking in the milking stalls and before teat preparation. The intramammary pressure was assumed to be greatest at this time. Cows were scored as being positive (i.e. leakage of milk from one or more teats) or negative for milk leakage each day. Where cows were positive one morning and negative the following morning, or vice versa, they were classified as being positive overall. The firmness of the udder was assessed by manually palpating the udder between the cows' hind legs and categorizing it according to a 3-point scoring system. Score 1 = soft, udder yields significantly to gentle pressure from the fingers; score 2 = firm, udder yields slightly to gentle pressure from the finger tips; score 3 = hard, the udder tissue does not yield to gentle pressure from the finger tips. The average score of the two consecutive days per month was used in the statistical analysis.
Locomotion
Cow locomotory ability was observed on two consecutive mornings in mid April, May, June and July. All cows in each treatment were herded to the paddock entrance prior to the morning milking. Cows were allowed to leave the paddock singly and were observed walking past and then away from the observer on the farm roadway. A sound cow walks with a level spine (1. spine curvature). The hind feet almost exactly trace the placement of the fore feet (2. tracking). The gait appears comfortable and the cow walks at an even pace (3. speed) with little movement of the head (4. head carriage). The feet point in the direction of travel (5. abduction/adduction). Overall locomotory ability and the five individual aspects of locomotion detailed above were scored using a modification of a five-point scale developed by O'Callaghan et al. (Reference O'Callaghan, Cripps, Downham and Murray2003) (Table 1). The average locomotion score for the two consecutive days per month was used in the statistical analysis. One observer who was unfamiliar with the milking treatment or nutritional level conducted all locomotion scoring.
Locomotion scoring system

Haematological parameters
Unclotted (EDTA) whole blood samples were collected from 40 cows (10 cows per treatment) 52 days after the mean calving date. Samples were collected at four additional sampling dates at 21-day intervals. Blood samples were analysed for total white blood cells (WBC), red blood cells (RBC), monocyte and lymphocyte numbers, mean corpuscular volume (MCV), haemoglobin (Hb), and platelet numbers using an automated electronic particle analyser (Celltac, MEK-6108K, Nihon-Kohdon, Tokyo, Japan) within 6 h of blood sampling. Thin blood smears on grease free glass slides (Gold star micro slides, Chance Propper Ltd, UK) were prepared for WBC differential population count. The smears were air-dried and stained using the haematology three-step stain for differentiation of morphological cell types (Accralab, Fisher Scientific Company, L.L.C., 8365 Valley Pike, Middleton, VA 22 645-0307, USA). One hundred cells, including neutrophils, band neutrophils, basophils, eosinophils, monocytes and lymphocytes were counted under the microscope at 40 × .
Statistical analysis
All data were analysed using SAS software (SAS Institute Inc., 1989). All variables were first tested for normality (UNIVARIATE procedure). Variables associated with milking characteristics, locomotion scores, WBC differential counts and haematological parameters were analysed using general linear mixed models (MIXED procedure) with time as a repeated measure. Degrees of freedom were estimated using Satterthwaite's formula (Littell et al., Reference Littell, Milliken, Stroup and Wolfinger1996). The model included effects for milking frequency, nutritional level, time, block and all two- and three-way interactions. The cow effect was considered random and the other effects were considered fixed in all models. The model was reduced if interactions were not significant (P>0.05). Means comparisons were made based on differences in least squares means, with P values adjusted for multiple comparisons using the Tukey option in the MIXED procedure. Results are expressed as least-squares means and standard errors of the mean (s.e.). HK and udder tension scores were analysed by the Kruskal and Wallis test using the NPARIWAY procedure. Data on numbers of cows in each treatment that were positive for milk leakage were analysed by the χ2 tests using the FREQ procedure. The correlation between daily milking time and HK scores on each month of lactation and between locomotion and udder tension scores at the four inspections was carried out by non-parametric Spearman rank order correlations using the CORR procedure.
Results
Milking characteristics
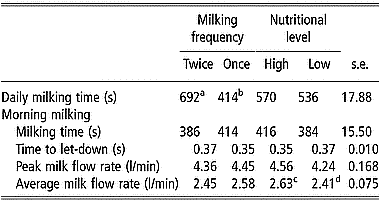
Total 305-day milk production was lower for OAD milking (4620 kg) than TAD milking (6214) and for low nutritional level (4924 kg) than high nutritional level (5910 kg) (O'Brien et al., Reference O'Brien, Gleeson and Berry2006). There were no significant interactions between milking frequency and nutritional level for any of the milking characteristics variables (P>0.10). Thus effects of the two factors are presented separately. Milking frequency had a significant effect on daily milking time (F1,62.3 = 125.95; P < 0.001) (Table 2). There was no effect of nutritional level on daily milking time (F1,62.3 = 1.96; P>0.10). Furthermore, there was no effect of milking frequency or nutritional level on morning milking time (F1,64 = 1.63 and F1,60.5 = 2.20; P>0.10 respectively), time to milk let-down (F1,58.3 = 0.90 and F1,58.3 = 2.26; P>0.10 respectively) or peak milk flow rate (F1,63.7 = 0.14 and F1,59.9 = 1.90; (P>0.10) (Table 2). Milking frequency had no effect on average milk flow rate (F1,73.1 = 1.42; P>0.10). However, average milk flow rate was higher at the high nutritional level (F1,71.4 = 4.80; P < 0.05). There was a significant effect of stage of lactation for all variables (P < 0.001). The interaction between stage of lactation and milking frequency was significant for morning milking time, peak and average milk flow rate (P < 0.01). However, when the P values were adjusted for multiple comparisons using Tukey, there were no meaningful differences between treatments on different months of lactation (P>0.10).
Effect of milking frequency (once or twice) and nutritional level (high or low) on daily milking time and milking characteristics at the morning milking
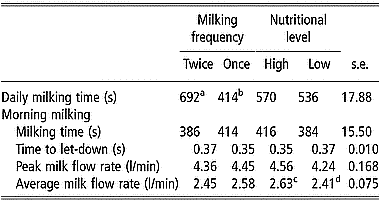
a,b,c,d Values within rows with different superscripts are different (P < 0.001 and P < 0.05, respectively).
Teat hyperkeratosis
There was no effect of milking frequency or nutritional level on HK scores (P>0.10). The mean lactation HK score was 11.2 ( ± 0.49) and 10.2 ( ± 0.55) for twice and once daily milked cows, respectively, and was 10.8 ( ± 0.55) and 10.5 ( ± 0.41) for high and low nutrition cows, respectively. However, OAD cows tended to have lower scores than TAD cows in May (9.9 ± 0.52 v. 11.5 ± 0.59; P = 0.068) and they had numerically lower scores for all other months (Table 3). Teat HK scores increased in both milking frequency treatments during the first 5 months of lactation (P < 0.001).
Effect of milking frequency (once or twice) on the correlation between daily milking time and teat hyperkeratosis (HK) score in each month of lactation

NS = not significant; *P < 0.05; **P < 0.01.
HK scores of OAD cows were positively and significantly correlated with daily milking time from April to September (P < 0.05) (Table 3). There was no correlation between HK scores of TAD cows and daily milking time (P>0.10). There was a positive correlation between HK scores and daily milking time for cows milked once daily on high nutrition during the months of April, May, June and July (P < 0.05) (Table 4). There was no correlation between HK scores in cows milked once daily on low nutrition and daily milking time (P>0.10).
Effect of nutritional level (high or low) on the correlation between daily milking time and teat hyperkeratosis (HK) for cows milked once a day on each month of lactation

NS = not significant; *P < 0.05; **P < 0.01.
Milk leakage and udder firmness
The percentage of cows that were recorded positive for milk leakage on at least one inspection day was 17 and 28% for TAD and OAD cows, respectively. Significantly more OAD cows were positive for milk leakage prior to the morning milking in May (P < 0.01) (Table 5). There was no effect of nutritional level on milk leakage (P>0.10).
Effect of milking frequency (once or twice) and nutritional level (high or low) on proportion of cows (%) (number affected/number inspected) leaking milk at four sampling dates

a,b Values within rows with different superscripts are different (P < 0.01).
There was no effect of milking frequency on udder firmness scores (P>0.10, data not shown). However, nutritional level had a significant effect on udder firmness scores with high nutrition cows having higher scores in June and July (P < 0.05, data not shown). Furthermore, there was an interactive effect of milking frequency and nutritional level on udder firmness scores (Table 6). Cows milked once daily on high nutrition had significantly higher udder tension scores than cows milked once or twice daily on low nutrition and cows milked twice daily on high nutrition levels in June (P < 0.01) and than cows milked once or twice daily at a low nutrition level in July (P < 0.05; Table 6).
Interactive effects of milking frequency (once or twice) and nutritional level (high or low) on udder firmness scores (mean±s.e.) at four sampling dates

a,b,c,d Values within rows with different superscripts are different (P < 0.01 and P < 0.05, respectively).
Locomotion
There was a significant effect of milking frequency (OAD: 8.25 v. TAD: 7.43, s.e. = 0.152; F1,44 = 14.4; P < 0.001) on locomotion scores. Nutritional level had no effect on locomotion scores (F1,46.4 = 1.43; P>0.10). Furthermore, there was a significant interaction between milking frequency and inspection date on locomotion scores (F3,145 = 73.9; P < 0.001) (Table 7). OAD milking resulted in significantly higher locomotion scores than TAD in April (P < 0.001) and numerically higher scores in both May and July. There was a significant correlation between locomotion and udder firmness scores of OAD cows at the June inspection (P < 0.05). Furthermore, the correlations tended to be significant in April and May (P < 0.10). There was no correlation between locomotion and udder firmness scores of TAD cows (P>0.10).
Effect of milking frequency (once or twice) on locomotion scores (lsmean) of cows at four sampling dates

a,b Values within rows with different superscripts are different (P < 0.001).
Haematological parameters
There was no effect of milking frequency or nutritional level on WBC or RBC counts or PCT (haematocrit) parameters (P>0.10) (Table 8). However, there was a significant effect of milking frequency on Hb values (F1,41.3 = 6.11, P < 0.05, Table 8). The interaction between milking frequency and nutritional level tended to be significant for WBC (F1,58.5 = 3.61, P = 0.063) with TAD at low nutrition having lower values than animals in the other three treatments (6.41 v. 7.47 [OAD at high nutrition], 7.54 [OAD at low nutrition] and 7.55 [TAD at high nutrition]). The effect of stage of lactation was significant for WBC, RBC and Hb values (P < 0.01). However, there were no stage of lactation by treatment interactions (P>0.10). There was no effect of milking frequency or nutritional level, nor was there an interaction between the two main effects on neutrophil or lymphocyte counts (P>0.10). Furthermore, the frequency of cows in each milking frequency and nutritional level treatment with counts of eosinophils and basophils that were greater than 0 did not differ (P>0.10, data not shown). However, a significantly higher frequency of OAD cows had monocyte counts greater than 0 on the 7 and 28 July (80%[16/20] v. 50%[10/20] and 50%[10/20] v. 20%[4/20] respectively, P < 0.05). There was a significant effect of stage of lactation of measurement on neutrophil and lymphocyte counts (P < 0.001). There also tended to be an interactive effect between milking frequency and stage of lactation on lymphocyte counts (F4,120 = 2.38, P = 0.055) (Table 9). OAD cows had lower lymphocyte counts on the 26 May than TAD cows. The interaction between milking frequency and stage of lactation was not significant for neutrophil counts (F4,126 = 1.53, P>0.10). Nevertheless, OAD cows had numerically higher counts than TAD cows on 26 May (Table 9). Furthermore, the magnitude of the difference between the two milking frequency treatments was greatest on this date.
Effect of milking frequency (once or twice) and nutritional level (high or low) on haematological parameters

a,b Values within rows with different superscripts are different (P < 0.05).
Effect of milking frequency (once or twice) on differential counts (least-square means) of neutrophils and lymphocytes at five sampling dates

Lymphocytes s.e. = 2.35, Neutrophils s.e. = 2.08.
Discussion
The study presented here indicates that reducing the frequency of milking high yielding cows could have negative implications for their welfare, particularly at peak lactation. Cows milked once daily, especially those on high nutrition had increased milk leakage and higher udder firmness and locomotion scores. The composition of their blood was also altered relative to that of the TAD cows during peak lactation which could be indicative of immuno suppression.
Although not significant, it took longer to milk the OAD cows in the morning. This was probably a consequence of their higher milk yields at this time. Similarly, the high milk yield associated with the high nutritional level probably explains the increase in flow-rate compared with cows on a low nutritional level. Time to milk let down did not differ between milking treatments. This may be as a result of similar teat preparation.
In accordance with Gleeson et al. (Reference Gleeson, O'Callaghan and Rath2003) teat hyperkeratosis scores increased during the first 5 months of lactation and reduced in late lactation. Mein and Thompson (Reference Mein and Thompson1993) suggested that higher yielding older cows tend to have more teat hyperkeratosis and therefore it could be expected that pluriparous cows would have a higher teat HK scores post calving than primiparous cows. The fact that pluriparous cows were used in this study could have masked differences in milking frequency for HK. Even though daily milking time was significantly longer for TAD cows, their teat condition was not adversely affected relative to the OAD cows. On the other hand, there was a positive correlation between milking time and teat hyperkeratosis for the cows milked once daily at high nutrition. This correlation was evident during the peak production period, when cows milked once daily at high nutrition had higher milk yields compared with the other treatments at the morning milking. Some individual cows milked once daily at high nutrition had milk yields in excess of 30 kg/day. It took 50 s and 45 s longer to milk these animals at the morning milking compared with cows milked once daily at low nutrition and TAD cows, respectively. This would suggest that prolonged cluster-on times at one milking might result in teats being more susceptible to HK. Thus, it is particularly important to ensure optimum milking unit performance when milking cows once per day. Optimum milking unit performance maybe defined as harvesting of milk in the shortest possible time without compromising on udder health or milk quality. Guidelines for quantifying the performance of milking units have been described (Mein, Reference Mein1997).
Almost 30% of the cows milked once per day showed evidence of milk leakage. This was considerably higher than that reported (5.5%) by Klass et al. (Reference Klass, Enevoldsen, Ersboll and Tolle2005) when observations were made at a similar time point, just prior to milking. However, the mean milk yield per cow per milking reported in that study (14.0 kg) was considerably lower than the daily milk yield per cow (OAD = 21 kg) recorded in the present study (O'Brien et al., Reference O'Brien, Gleeson and Mee2005). The higher level of milk leakage in this study did not appear to affect the number of clinical cases of mastitis observed during this period (O'Brien et al., Reference O'Brien, Gleeson and Mee2005).
The positive correlation shown between udder firmness and locomotion scores was similar to that shown by Boelling and Pollott (Reference Boelling and Pollott1998). That study concluded that a high locomotion score was primarily a problem in older cows with a large udder. In this study, the udder was distended owing to the large volume of milk produced by the cows during peak lactation. The findings indicate that the cows had some difficulty adopting normal locomotion as a result. Furthermore, there is some evidence from a parallel study of the hoof health of these cows that the abnormal locomotion adopted by the once daily milked cows resulted in higher heel erosion scores in these animals (L. Boyle et al., unpublished results).
Lymphocytes, macrophages, neutrophils and other cells associated with the immune response possess beta-adrenergic receptors on their surface membranes. Glucocorticoids affect the cells of the immune system in a number of ways. Under the influence of increased circulating concentrations of glucocorticoids, the relative and absolute populations of different classes of immune cells are altered. There is a reduction in the number of monocytes and lymphocytes, particularly T lymphocytes (Fauci and Dale, Reference Fauci and Dale1974; Dale et al., Reference Dale, Fauci, DuPont Guerry and Wolff1975; Fauci, Reference Fauci1975). Concurrently there is an increase in neutrophil population due to an expression of polymorphonuclear cells from bone marrow reserves (Dale et al., Reference Dale, Fauci, DuPont Guerry and Wolff1975). Indeed, the relationship between stress induced activation of the HPA axis and alteration of immune functions is well established (Anisman, Reference Anisman2002). In the present study although not affected overall, OAD cows had lower lymphocyte counts and higher neutrophil counts at the end of May. Considering that the other welfare indicators employed in this study suggest that the cows milked once daily and particularly those on a high nutritional level experienced some stress at this time, it is possible that this was responsible for the altered immune response seen in these animals. Nevertheless, in the absence of measurements of cortisol concentrations at this time our interpretation of these findings is somewhat speculative. In any case, the neutrophilia and lymphopenia observed in the present study were not of sufficient potential to pre-condition the immune system for further exposure to stress. However, the changes may have had immune suppression consequences (Radostits et al., Reference Radostits, Blood and Gay1994) and as such warrant further investigation.
In conclusion the increase in milk leakage, higher udder tension and locomotion scores in conjunction with changes in blood cells, suggests that OAD milking may have caused some discomfort to the cows during peak lactation. A reduction in the concentrate input to OAD cows during this period could ameliorate this problem.
Acknowledgements
The authors gratefully acknowledge the technical assistance of J.P. Murphy, J. Kenneally, T. Condon and general farm staff in the conduct of this study.