

The long-chain PUFA (LCP) DHA, EPA and arachidonic acid (AA) are structural components of membrane phospholipids and precursors of the biologically highly active eicosanoids, neuroprotectins, maresins and resolvins( Reference Serhan, Chiang and Van Dyke 1 , Reference Calder, Dangour and Diekman 2 ). LCP derive from endogenous synthesis from the essential fatty acids linoleic acid (AA) and α-linolenic acid (EPA and DHA) or from diets containing AA, which is abundant in meat, eggs, poultry and (lean) fish, and EPA and DHA, which are notably abundant in (fatty) fish. High DHA contents are found in the retina, cerebral cortex and sperm, while AA is more evenly distributed among the various organs( Reference Arterburn, Hall and Oken 3 ). Low LCP n-3 status may notably be involved in abnormal neurodevelopment, CVD and psychiatric disease, and many trials have been conducted with either purified fish oil or purified EPA for the improvement of neurodevelopment and the primary and secondary prevention of CVD and (neuro)psychiatric disease, including depression( Reference Sinclair, Begg and Mathai 4 ) and Alzheimer's disease( Reference Zhang, Li and Hu 5 ).
Little is known about the interrelationships between maternal erythrocyte-DHA, infant erythrocyte-DHA, maternal adipose tissue (AT)-DHA and milk-DHA contents. For a greater part, the fetus is dependent on the transplacental passage of LCP, notably DHA, because of its limited synthesis capacity in relation to its high needs for growth and development. This transplacental passage may cause maternal LCP n-3 depletion, which is notably related to postpartum depression, while insufficient fetal LCP n-3 accretion is, for example, related to attention deficit disorder( Reference Bloch and Qawasmi 6 ) and diseases at later age( Reference Simopoulos 7 ). At delivery, infants may have higher LCP amounts in plasma lipid fractions and erythrocytes than their mothers, which has been coined biomagnification( Reference Crawford, Hassam and Williams 8 , Reference Demmelmair, Baumheuer and Koletzko 9 ). LCP in erythrocytes are generally accepted as reliable markers of the intermediate-term LCP status( Reference Hodson, Skeaff and Fielding 10 ). The optimal erythrocyte − (EPA+DHA) content, coined the n-3 index, for the prevention of CVD( Reference Harris and Von Schacky 11 ) and major depressive disorders and bipolar depression( Reference Sinclair, Begg and Mathai 4 , Reference McNamara 12 ) has been estimated to be about 8 wt%. We have recently calculated that a maternal erythrocyte-DHA content of about 8 wt% at delivery is likely to prevent (serious) DHA depletion in lactating women( Reference Kuipers, Luxwolda and Sango 13 ). The AT-DHA and milk-DHA contents that correspond with this erythrocyte-DHA content are presently unknown.
The essential fatty acids and LCP present in milk derive either from the diet or from the synthesis of LCP, but mostly from the maternal AT compartment. Dependent on age, sex and race/ethnicity, the body fat percentage of US adults is typically 28·1 % for men and 40 % for women( Reference Li, Ford and Zhao 14 ), of which 2–5 % is essential fat in men and 10–13 % in women( 15 ). This renders the remaining potentially mobilisable storage fat, among the principle sites where LCP are present. Despite high brain-DHA contents, most DHA is present in the AT. We have recently estimated that the distribution of whole-body DHA in a 40-week, 3·5 kg term infant is 50 % in the AT, 23 % in the brain, 21 % in the skeletal muscle and 6·5 % in the liver, while the percentages of DHA in total fatty acids in these organs are (in g/100 g fatty acids; wt%) 7·76 (brain), 4·08 (liver), 3·51 (skeletal muscle) and 0·3 (AT) wt%( Reference Kuipers, Luxwolda and Offringa 16 ).
In the present study, we explored the interrelationships between the following: (1) the erythrocyte-DHA contents of mothers and infants at delivery and 3 months postpartum; (2) the milk-DHA contents at 3 d and 3 months postpartum; (3) the maternal subcutaneous and abdominal (omentum) AT-DHA contents at delivery. Samples were collected from four tribes in Tanzania differing in their lifetime intakes of fish: Maasai (no fish); Pare (two to three times fish/week); Sengerema (four to five times fish/week); Ukerewe (>7 times fish/week). Data on AT and milk-DHA contents are new, which part of the data on erythrocytes have been published previously, although not in relation to the current milk and AT data( Reference Kuipers, Luxwolda and Sango 13 , Reference Luxwolda, Kuipers and Sango 17 ). We were particularly interested in the following: (1) the magnitudes of the intra-uterine and postpartum biomagnifications of DHA as a function of the DHA status; (2) the mature milk-DHA content that is achieved at a maternal erythrocyte-DHA content of 8 wt%; (3) the AT-DHA content at which the erythrocyte-DHA content reaches a plateau; (4) a comparison of the whole-body AT-DHA contents and milk-DHA outputs of the average Tanzanian-Ukerewe woman and the average US woman.
Materials and methods
Subjects, diets and cultural habits
As study groups, we selected women and their infants from four Tanzanian ethnic tribes with different intakes of local freshwater fish, i.e. the Maasai (no or low fish intake, zero times/week), a tribe from the Pare Mountains (intermediate fish intake, two to three times/week), a tribe from Sengerema (high fish intake, four to five times/week), and a tribe from Ukerewe (very high fish intake, >7 times/week). The selected Maasai were Nilotic pastoralists living in ‘bomas’ (villages) in the Maasai Steppe near Ruvu. Their diet mainly consists of curdled milk and meat. They have recently included ugali (maize porridge) in their diet. The consumption of fish is uncommon, since it is considered inedible. The second study group consisted of women and infants from two Bantu tribes, the Pare and the Sambaa, from the Pare Mountains near Same. Their diet mainly consists of vegetables, beans and fruits with ample amounts of ugali, rice and chapati (maize flour pancakes) and some meat and fish. The third study group was the Bantu tribe comprising women and infants from Sengerema (southern shore of Lake Victoria), and the fourth study group was the Bantu population comprising women and infants from Ukerewe, an island in Lake Victoria. Apart from the abundant consumption of fish, the latter two tribes also consume ugali, muhogo (cassava root), beans and plantain (baked banana). Importantly, one of the locally most abundant fish species (a sardine, Rastrineobola argentea) is eaten as butter to bread, but it is not considered as a fish by this people, but as a vegetable.
The ethnicity/tribe of each of the study groups was considered to be homogeneous. Most of the women had a low socio-economic background, meaning low education levels. With regard to feeding practice, they were well nourished, with a low intake of highly refined carbohydrates and regular intakes of fruits, vegetables and unprocessed meat and fish. They earned their incomes from pastoralism (Maasai), agriculture (Pare) or fisheries (Sengerema/Ukerewe). The study populations had neither possibilities of nor interest in changing their cultural habits, including their diets. Interviews with the local hospital staff and the participants confirmed that neither pregnancy nor lactation was associated with any change in dietary habits or the prohibition of consumption of certain foods (F Peters, RS Kuipers, FAJ Muskiet, unpublished results). Therefore, the diets are likely to be representative of the lifelong dietary habits of each of the ethnic groups. The use of tobacco and alcohol is almost non-existent in these populations, especially among women.
Women and infants were included in the study if they were apparently healthy and well nourished, and women were included if they had delivered an apparently healthy term child (37–42 weeks, by estimate) the same day (delivery group) or 10–20 weeks before their visit to the local hospital or dispensary (3 months postpartum group). Anthropometric data and data on fish intake collected using a questionnaire were obtained from the medical records or through interviews in Kiswahili. Apart from the measurement of fundal heights, reliable data on gestational age were not available always, since some women had no recollection of their last menstrual period. Devices for echo imaging were either not available or not operational. Consequently, gestational ages were estimated from the sum of the available data. All the women gave their informed consent. The study was approved by the National Institute for Medical Research in Dar-es-Salaam (NIMR/HQIR.8a/Vol. IX/145, dated 16 June 2003 and NIMR/HQ/R.8a/Vol. IX/800, dated 8 April 2009) and complied with the Declaration of Helsinki of 1975 as revised in 2000.
Sample collection and analyses
We collected about 4 ml of EDTA-anticoagulated venous blood from the mothers and about 4 ml of EDTA-anticoagulated cord blood at delivery (BD Vacutainer). At 3 months postpartum, about 4 ml of EDTA-anticoagulated venous blood were collected from the mothers. About 250 μl of EDTA-anticoagulated blood (250 μl paediatric MiniCollect K3EDTA tubes; Greiner Bio-one) were collected by heel prick from 3-month-old infants. The samples were stored at 4 °C in the dark and processed within 2 h of collection. Erythrocytes were isolated by centrifugation and washed three times with 0·9 % NaCl. After washing, 200 μl of the 50 % haematocrit erythrocyte suspension (mothers) or the entire erythrocyte suspension (infants) was transferred into a Teflon-sealable tube (Sovirel). We collected 5 ml of breast milk shortly after delivery (usually 3 d postpartum) and at 3 months postpartum. Following gentle mixing, 100 μl of milk were transferred into a Teflon-sealable tube (Sovirel). We were able to collect about 1 cm3 of subcutaneous (abdominal wall) and abdominal (omentum) AT from some of the women during emergency Caesarean section. Caesarean section was carried out for various reasons, including fetal distress and obstructed labour. The reasons for carrying out Caesarean section had not influenced the general health of the mothers and their infants and were considered to not have affected the DHA status or the distribution of DHA across the fetomaternal unit. The AT samples were transferred into Teflon-sealable tube (Sovirel).
All the Sovirel tubes contained 2 ml of methanol–6 mol/l HCl (5:1, v/v), 1 mg of butylated hydroxytoluene (antioxidant) and 50 μg of 17:0. They were stored and transported at ambient temperature to the University Medical Center Groningen (The Netherlands) for fatty acid analysis. All the samples were processed and analysed within 9 months of collection. The partly dissolved AT samples were pottered (Potter apparatus), and chloroform–methanol (2:1) was added until a suspension of about 10 ml was obtained. Into a Sovirel tube, 100 μl of this solution were transferred, followed by the addition of 500 μl of chloroform and 2 ml of methanol–HCl (5:1, v/v). All the samples were transmethylated by heating at 90°C for 4 h. Subsequent analysis of fatty acid methyl esters was carried out by capillary GC/flame ionisation detection essentially according to previously described procedures( Reference Muskiet, van Doormaal and Martini 18 ). The long-chain fatty acids were quantified on the basis of the added 17:0. In milk, medium-chain fatty acids (6:0 up to 14:0) were quantified using 5:0–15:0 as the internal quantification standards( Reference Volmer, Meiborg and Muskiet 19 ). Fatty acid compositions are expressed in g/100 g fatty acids (wt%).
Estimations of the whole-body adipose tissue-DHA contents and the milk-DHA outputs
We estimated the total amount of DHA in the mobilisable AT compartment and the milk-DHA outputs of an average Tanzanian-Ukerewe woman with an erythrocyte-DHA content of 8 wt% and compared the outcomes with those of an average US woman, typically having an erythrocyte-DHA content of 3·71 wt%. For the Tanzanian-Ukerewe woman, we used the AT-DHA and mature milk-DHA contents that corresponded with an erythrocyte-DHA content of 8 wt%. Her body fat percentage was calculated using the formula of Deurenberg et al. ( Reference Deurenberg, Weststrate and Seidell 20 ):
 $$\begin{eqnarray} Body\ fat\ percentage = 1\cdot 20\times BMI + 0\cdot 23\times age - 10\cdot 8\times sex - 5\cdot 4, \end{eqnarray}$$
where female sex = 0. Her body fat percentage was also estimated using the formula of Gallagher et al. ( Reference Gallagher, Heymsfield and Heo 21 ): body fat percentage = 76–1097·8/BMI+0·053 × age (for females). The outcomes of the Deurenberg and Gallagher formulas were averaged. We also used the body fat percentage as genuinely measured in 196 well-nourished African women (BMI 22·5 (sd 4·6) kg/m2) living in the pre-urban neighbourhood of Dakar (Senegal, West Africa), who had a mean age of 29·5 years, a mean BMI of 22·5 kg/m2 and a mean body fat percentage of 34·2 %, as determined by air-displacement plethysmography( Reference Dioum, Gartner and Maire 22 ). The essential body fat percentage for women was estimated to be 11·5 % of body weight (mean of 10–13 %( 15 )). These data together with a mean fat percentage in the wet AT of adults( Reference Baker 23 ) allowed us to estimate the percentage and amount of mobilisable storage fat, the amount and percentage of mobilisable wet AT, and the amount of DHA in mobilisable wet AT. For the calculation of the colostrum-DHA and mature milk-DHA outputs, we used the colostrum and mature milk volumes at day 3 and at 3 months, respectively, as reported by Neville et al. ( Reference Neville, Keller and Seacat 24 ), while the colostrum and mature milk fat contents were derived from the studies of Jensen( Reference Jensen 25 , Reference Jensen, Ferris and Lammi-Keefe 26 ).
For the average US woman, we used the data on mean body weight, body length and BMI from the NHANES 2003–6 for the age group 20–39 years( Reference McDowell, Fryar and Ogden 27 ). The body fat percentage was derived from the NHANES 1999–2004( Reference Li, Ford and Zhao 14 ), while the erythrocyte-DHA content was derived from the ‘Nurses' Health Study’( Reference Sun, Ma and Campos 28 ). The women in the latter study were, on average, 60 years old, but this was not considered a confounder because of the major influence of diet on the erythrocyte-DHA content, although fish intake may increase with age. The AT-DHA content was derived from the study of Leaf et al. ( Reference Leaf, Connor and Barstad 29 ). The mature milk-DHA content for the USA was derived from the study of Brenna et al. ( Reference Brenna, Varamini and Jensen 30 ), while the colostrum-DHA content was estimated from other countries that exhibited similar mature milk-DHA contents as the USA( Reference Jensen 31 ).
Statistical analyses
Statistical analyses were carried out with SPSS version 18.0 (SPSS, Inc.). Between-group differences were studied with the Kruskal–Wallis test, followed by analyses with the Mann–Whitney U test (non-parametric) at P <0·05. Analyses of mother–infant pairs were carried out with the Wilcoxon two-related sample tests. Corrections were made for type 1 errors (Bonferroni correction). Equations were derived from curve estimation. We used the coefficient of determination (R 2) to estimate the extent to which a given variable was explained by another; P <0·05 was considered significant.
Results
Study groups
We included ninety mother–infant pairs at delivery (six Maasai, twenty-three Pare, thirty-four Sengerema and twenty-seven Ukerewe) and 125 other mother–infant pairs after about 3 months of exclusive breast-feeding (eight Maasai, thirty-six Pare, sixty-one Sengerema and twenty Ukerewe). Their characteristics are summarised in Table 1. There were no between-tribe differences in anthropometrics for the mothers and infants at delivery, except for a higher BMI in the Pare women than in the other women at delivery. The Ukerewe mothers studied at 3 months postpartum were older than the corresponding Pare and Sengerema mothers and they were also taller than the Pare mothers. The BMI of the Maasai mothers was lower than that of the Sengerema mothers. The Ukerewe mothers who were included at 3 months postpartum had delivered more children than the Pare and Sengerema mothers. The order of fish consumption in the study groups was Ukerewe>Sengerema>Pare>Maasai, both at delivery and at 3 months postpartum.
Characteristics of the mother–infant pairs of four Tanzanian tribes studied at delivery or 3 months postpartum (Number of participants, mean values and standard deviations)

a,b,c,dMean values with unlike superscript letters were significantly different (P <0·05).
Erythrocyte-DHA, milk-DHA and adipose tissue-DHA contents in the mother–infant pairs
Table 2 summarises the medians (ranges) of the erythrocyte-DHA, milk-DHA and AT-DHA contents of the four tribes at delivery/3 d postpartum and at 3 months postpartum. Complete fatty acid compositions are given in Tables S1–S3 (available online). We have previously shown that the erythrocyte-DHA content increases with increasing fish intakes( Reference Kuipers, Luxwolda and Sango 13 ). At delivery, the Sengerema (P <0·05) and Ukerewe (P <0·001) mothers had higher erythrocyte-DHA contents than their infants, whereas the erythrocyte-DHA contents of the Maasai and Pare mothers were insignificantly lower than those of their infants (intra-uterine biomagnification). At 3 months postpartum, all the infants had significantly higher erythrocyte-DHA contents than their mothers, indicating postpartum biomagnification. In the infant groups, the Maasai infants had lower erythrocyte-DHA contents at 3 months postpartum than their counterparts at delivery (P <0·05). The Pare and Ukerewe infants at delivery did not exhibit significant differences in erythrocyte-DHA contents compared with their counterparts at 3 months postpartum, whereas the Sengerema infants had higher erythrocyte-DHA contents at 3 months postpartum than the Sengerema infants at delivery (P <0·05). In all the populations, the maternal erythrocyte-DHA content at 3 months postpartum was lower than that at delivery, indicating maternal postpartum DHA depletion, irrespective of the DHA status at delivery.
DHA contents in erythrocytes, milk and adipose tissue (AT) of four different Tanzanian tribes studied at delivery/3 d postpartum or 3 months postpartum∥ (Number of participants, medians and ranges)
Median value was significantly different from that of maternal erythrocyte-DHA at the same time point: * P< 0·05, *** P< 0·001.
Median value was significantly different from that at 3 months postpartum: † P< 0·05, ††† P< 0·001.
‡ Median value was significantly different from that of the Ukerewe women at 3 months postpartum (P< 0·05).
§§§ Median value was significantly different from that of subcutaneous AT DHA (P< 0·001).
∥ Data for infant and maternal erythrocyte-DHA contents at delivery and 3 months postpartum are according to Kuipers et al. (13).
The mature milk-DHA content of the Sengerema mothers at 3 months postpartum (0·68 wt%) was lower than their colostrum-DHA content (0·81 wt%) (P =0·047). The mature milk-DHA content of the Ukerewe mothers (0·96 wt%) at 3 months postpartum was higher than that of the Sengerema mothers (P =0·001). Subcutaneous and abdominal AT-DHA contents appeared to be dependent on fish intake and increased in the study groups in the order Sengerema>Pare>Maasai, although only the differences between the Pare and the Sengerema mothers reached significance (P< 0·001), possibly because of the small sample size of the Maasai group.
Interrelationships between erythrocyte-DHA, milk-DHA and adipose tissue-DHA contents
Fig. 1 shows the positive relationship of maternal erythrocyte-DHA content at delivery with colostrum-DHA content at 3 d postpartum for women with high fish intakes (Sengerema, n 30; R 2 0·510; P <0·001; Fig. 1(a)), together with the relationship of maternal erythrocyte-DHA content with mature milk-DHA content at 3 months postpartum (Sengerema (n 47) and Ukerewe (n 20); R 2 0·360; P <0·001; Fig. 1(b)). A maternal erythrocyte-DHA content of 8 wt% was found to correspond with 1 wt% DHA in both colostrum (Fig. 1(a)) and mature milk (Fig. 1(b)). Fig. 2 shows the positive, non-linear relationships of the subcutaneous (R 2 0·436; P <0·001; Fig. 2(a)) and abdominal (R 2 0·432; P <0·001; Fig. 2(b)) AT-DHA contents with the maternal erythrocyte-DHA contents at delivery. We estimated that a maternal erythrocyte-DHA content of 8 wt% corresponds with subcutaneous and abdominal AT-DHA contents of 0·39 and 0·52 wt%, respectively.
Relationships between maternal erythrocyte-DHA content at delivery and colostrum-DHA content (a) and between maternal erythrocyte-DHA content at 3 months postpartum (PP) and milk-DHA content at 3 months PP (b). Data obtained for the Sengerema (□; high fish intake; n 30 at delivery and n 47 at 3 months PP) and Ukerewe (●; very high fish intake; n 20 at 3 months PP) groups are shown. (a) y= 0·17e0·22x , R 2 0·510, P< 0·001. (b) y= 0·12e0·27x , R 2 0·324, P< 0·001.

Relationships between DHA contents in the subcutaneous adipose tissue (ScAT) (a) and abdominal adipose tissue (AbdAT) (b) and maternal erythrocyte-DHA content at delivery. Data obtained for the Sengerema (□; high fish intake; n 37), Pare (♦; intermediate fish intake; n 17) and Maasai (Δ; low/no fish intake; n 2) groups are shown. (a) y= 1·54 ln(x)+9·45, R 2 0·436, P< 0·001. (b) y= 1·38 ln(x)+8·89, R 2 0·432, P< 0·001.
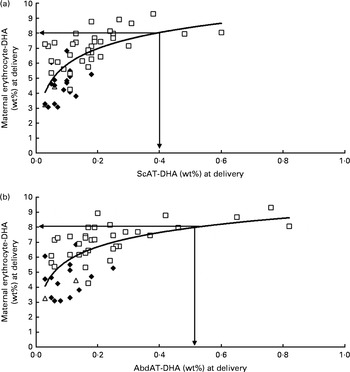
Fig. 3 shows the positive, non-linear relationships of the subcutaneous (R 2 0·193; P =0·015; Fig. 3(a)) and abdominal (R 2 0·255; P <0·004; Fig. 3(b)) AT-DHA contents at delivery with the colostrum-DHA contents at 3 d postpartum. A milk-DHA content of 1 wt% was found to correspond with subcutaneous and abdominal AT-DHA contents of 0·35 and 0·40 wt%, respectively. Fig. 4 shows the positive relationship between the subcutaneous and abdominal AT-DHA contents (R 2 0·690; P <0·001). The abdominal AT-DHA contents proved to be, on average, 29 (sd 50·8) % ( − 50·0 to 133·3) higher than the subcutaneous AT-DHA contents (P< 0·001).
Relationships between DHA contents in the subcutaneous adipose tissue (ScAT) (a) and abdominal adipose tissue (AbdAT) (b) at delivery and colostrum-DHA content. Data obtained for the Sengerema group are shown (□; high fish intake; n 37). * Data point for an average American woman (0·2 wt%( Reference Brenna, Varamini and Jensen 30 )) and her subcutaneous AT-DHA content (0·1 wt%( Reference Leaf, Connor and Barstad 29 )). † Data point for the milk-DHA and corresponding AT-DHA contents of French women at day 5 of lactation (milk-DHA content: 0·53 wt%; AT-DHA content: 0·09 wt%), as reported by Martin et al. ( Reference Martin, Niyongabo and Moreau 71 ). (a) y= 0·18 ln(x)+1·19, R 2 0·193, P= 0·015. (b) y= 0·22 ln(x)+1·20, R 2 0·255, P= 0·004.

Relationship between subcutaneous adipose tissue (ScAT) and abdominal adipose tissue (AbdAT)-DHA contents. Data obtained for the Sengerema (□; high fish intake; n 37), Pare (◆; intermediate fish intake; n 17) and Maasai (△; low/no fish intake; n 2) groups are shown. ![]() , y= x. y= 1·17x+0·01, R
2 0·690, P< 0·001.
, y= x. y= 1·17x+0·01, R
2 0·690, P< 0·001.

Estimated milk-DHA output and whole-body adipose tissue-DHA content
The body fat percentage of the average Tanzanian-Ukerewe woman amounted to 27·2 when calculated according to the formula of Deurenberg et al. ( Reference Deurenberg, Weststrate and Seidell 20 ) and 27·9 % when calculated according to the formula of Gallagher et al. ( Reference Gallagher, Heymsfield and Heo 21 ), which averaged to 27·5 % (Table 3). The body fat percentage of the 196 women living in the pre-urban neighbourhood of Dakar was 34·2 %( Reference Dioum, Gartner and Maire 22 ). Because of the difference when compared with the above calculations, we employed both the values (Table 3) to arrive at the indicated amount of mobilisable storage fat (8·7 and 12·4 kg), percentage of mobilisable wet AT (20·4 and 29·0 %), and amount of DHA in mobilisable wet AT (35 and 50 g). The DHA contents in whole-body fat were 60 and 75 g when differences in the DHA contents between TAG and phospholipids were neglected (data not given in Table 3). The milk-DHA outputs of the average Tanzanian-Ukerewe woman were estimated to be 80 mg/d at day 3 and to be 301 mg/d at 3 months postpartum.
Estimated milk-DHA output and whole-body adipose tissue DHA content for an average Tanzanian-Ukerewe woman compared with an average US woman

FA, fatty acid.
The anthropometric data for the average 20–39-year-old US woman in the 2003–2006 NHANES( Reference McDowell, Fryar and Ogden 27 ) were as follows: body weight 73 kg; body length 163·2 cm; BMI 27·3 kg/m2, while the body fat percentage in the 1999–2004 NHANES was 37·8 %( Reference Li, Ford and Zhao 14 ). With these data, we estimated the amount of mobilisable storage fat to be 19·2 kg, the percentage of mobilisable wet AT to be 33·5 %, and the amount of DHA in mobilisable wet AT to be 19 g. The DHA content in whole-body fat was 28 g when differences in the DHA contents between TAG and phospholipids were neglected (data not given in Table 3). The milk-DHA output of the average US woman was estimated to be 32 mg/d at day 3 and to be 60 mg/d at 3 months postpartum.
Discussion
We investigated DHA contents in the erythrocytes, milk and AT of mother–infant pairs of four Tanzanian tribes having lifetime stable dietary habits that reportedly do not change during pregnancy and lactation. We were interested in the interrelationships of the DHA contents in these compartments and notably what amounts of milk-DHA and AT-DHA are reached at an erythrocyte-DHA content of 8 wt%, which leads to the lowest risk of CVD and mental illness in Western populations( Reference Harris and Von Schacky 11 , Reference McNamara 12 ). We also compared the estimated mobilisable AT-DHA pool size and the milk-DHA outputs of the average Tanzanian-Ukerewe woman and compared the outcomes with those of the average US woman.
Biomagnification
The present erythrocyte-DHA content data of mothers and their children in various Tanzanian tribes confirm our previous observation( Reference Kuipers, Luxwolda and Sango 13 ) that genuine biomagnification of DHA occurs after birth (Table 2). At delivery, only infants with low DHA status (Maasai and Pare) tended to have a higher erythrocyte-DHA content than their mothers, whereas infants with high DHA status (Sengerema and Ukerewe) had a lower erythrocyte-DHA content than their mothers. However, this situation had changed after 3 months of exclusive breast-feeding, when all the infants had a higher erythrocyte-DHA content than their mothers, while all the mothers had a lower erythrocyte-DHA content. Interestingly, the mothers with low DHA status (Maasai) were unable to prevent a decline of their infants' erythrocyte-DHA content from delivery to 3 months, while those with intermediate DHA status (Pare) maintained their infants' erythrocyte-DHA content and those with high DHA status maintained (Ukerewe) or augmented (Sengerema) their infants' erythrocyte-DHA content. These observations are consistent with the following: (1) intra-uterine biomagnification as a sign of low (possibly insufficient) maternal DHA status; (2) the inability to increase postnatal infant erythrocyte-DHA status if the mother has low DHA status; (3) the importance of DHA notably after delivery( Reference Kuipers, Luxwolda and Sango 13 , Reference Makrides, Neumann and Gibson 32 – Reference Martinez 34 ); (4) a deterioration of the maternal DHA status during lactation that is independent of the prepregnancy DHA status. Consistent with the notion that a major proportion of at least linoleic acid (70 %) and AA (90 %) in milk derives from AT stores( Reference Demmelmair, Baumheuer and Koletzko 9 ), we found that mothers who were unable to augment their infants' DHA content during lactation had the lowest AT-DHA contents (Maasai), while those who were able to maintain their infants' erythrocyte-DHA content (Ukerewe) or even augment it (Sengerema) had the highest AT-DHA contents (Table 2).
A drop in infant erythrocyte-DHA content after delivery may obviously be prevented by maternal DHA supplementation, since oral supplementation leads to a rapid dose-dependent response of the milk-DHA( Reference Harris, Connor and Lindsey 35 ). This strategy may, however, be distinct from the lifetime high DHA consumption, as practised by, for example, the Tanzanian-Ukerewe mothers. The difference becomes reflected in the steepness of the DHA dose v. milk-DHA response curves in which the curve for lifetime intake is steeper than the one derived from a 12-week DHA supplementation study( Reference van Goor, Smit and Schaafsma 36 ). The fetomaternal unit has an enormous DHA distribution volume and equilibration of a DHA supplement among the maternal organs and possibly, to a lesser extent, the infant organs, may take a considerable time. The AT compartment exhibits the ‘last-in first-out’ phenomenon( Reference Ekstedt and Olivecrona 37 ), while there is also selective mobilisation of the individual fatty acids from AT, possibly because the (more polar) PUFA in TAG have a tendency to accumulate at the surface of the AT TAG droplet( Reference Raclot 38 ). This implies that notably the infant (via the milk) and the easily accessible organs of the mother would benefit first and also that AT locations with a low turnover (e.g. essential fat) and the maternal brain would benefit last. It has been estimated that the half-life of DHA in the adult human brain approximates 2·5 years( Reference Umhau, Zhou and Carson 39 ), which suggests that more than a decade of supplementation is needed to reach a new equilibrium in the maternal brain( Reference Umhau 40 ).
Milk-DHA content of 1 wt% might be optimal for (Western) infants
We found that a maternal erythrocyte-DHA content of 8 wt% corresponds with a (mature) milk-DHA content of about 1·0 wt% (Fig. 1(a) and (b)) and subcutaneous and abdominal AT-DHA contents of about 0·39 and 0·52 wt%, respectively (Fig. 2(a) and (b)). A colostrum-DHA content of 1 wt% was also found to correspond with subcutaneous and abdominal AT-DHA contents in the same order of magnitude (0·35 and 0·40 wt%, respectively; Fig. 3(a) and (b)). These interrelationships seem valid, since they derive from populations who are at equilibrium because of their lifetime stable dietary habits. They remain, however, no more than mean estimates, since the relationships were subject to considerable inter-individual scatter. It has been shown that an n-3 index (i.e. erythrocyte-(EPA+DHA) content) of 8 % in Western populations is associated with the lowest cardiovascular risk( Reference Harris and Von Schacky 11 ) and lowest psychiatric disease risk( Reference McNamara 12 ). The erythrocyte-DHA content constitutes the major part of this index. One may consequently argue that 1 wt% DHA in human milk is the optimum content for Western infants, which coincides with a maternal AT-DHA contents of about 0·40 wt% DHA. With this combination and continuing maternal dietary habits, infants also achieve an erythrocyte-DHA content of 8 wt% after 3 months of lactation (Table 2), but probably much sooner.
Recommendations have been made previously for adults, pregnant and lactating women, and infants separately, without consideration that these life stages and physiological conditions are intimately connected. The current recommendation for formula-fed infants is at least 0·2 wt% DHA to achieve benefits on functional end points, but no more than 0·5 wt% DHA because systematic evaluation above this level has not been published( Reference Koletzko, Lien and Agostoni 41 ). First of all, this recommendation is not in line with the advisory of 200 mg DHA per d for lactating women, since a maternal dietary intake of 200 mg already corresponds to 0.52 wt% in her milk; so in practice, those two recommendations simply are at odds with each other. Second, it ignores the observation that intakes of up to 1 g DHA by lactating women have been studied without significant adverse effects( Reference van Goor, Smit and Schaafsma 36 ). Third, higher recommendations than the presently encountered are in agreement with our derivation from the water–land ecosystem( Reference Broadhurst, Cunnane and Crawford 42 – Reference Kuipers, Joordens and Muskiet 45 ). Finally, much higher maternal milk contents have been observed in perfectly healthy populations. For instance, milk-DHA levels comparably high as those in Tanzanian-Ukerewe women have been reported to be present in the colostrum of Japanese mothers (1·1 wt%)( Reference Young, Hikita and Kaneko 46 ), while Arctic Canadian (1·4 wt%)( Reference Innis and Kuhnlein 47 ) and Kerewe women in a previous study (1·8 wt%)( Reference Kuipers, Smit and van der Meulen 48 ) have been reported to exhibit even higher mature milk-DHA levels.
That the incidence of atherosclerotic disease in traditionally living Maasai with much lower erythrocyte-DHA status than 8 wt% (Table 2) and a milk-DHA content of only 0·20 wt%( Reference Kuipers, Smit and van der Meulen 48 ) is, nevertheless, low is testimony of a much more complicated risk profile than might emerge from the study of a single nutrient for the prevention of cardiovascular risk. For instance( Reference Egger and Dixon 49 ), the traditionally living Maasai consume healthier diets in general and therefore probably have a less disturbed intestinal flora( Reference De Filippo, Cavalieri and Di Paola 50 ), a high level of physical activity, sufficient sleep and no Western lifestyle-associated stress, while smoking and obesity (Table 2) are rare. Their low DHA intake is accompanied by a low intake of linoleic acid from refined vegetable oils( Reference Kuipers, Luxwolda and Sango 13 ). A high intake of linoleic acid adversely affects the EPA and DHA status( Reference Kuipers, de Graaf and Luxwolda 51 ), while a meta-analysis of randomised controlled trials has shown that the replacement of SFA with linoleic acid leads to a borderline insignificant higher cardiovascular risk( Reference Ramsden, Hibbeln and Majchrzak 52 ). Consequently, milk-DHA content should preferably be in balance with the content of other milk fatty acids, notably EPA, AA and linoleic acid, and we, therefore, suggest taking the milk fatty acids of the Ukerewe women as a combination that reads as follows: 0·96 wt% DHA; 0·55 wt% AA; 0·22 wt% EPA; 9·32 wt% linoleic acid (Table S3, available online).
Interrelationships between DHA contents of erythrocytes, milk, subcutaneous adipose tissue and abdominal adipose tissue
Maternal erythrocyte-DHA (Fig. 2) and milk-DHA (Fig. 3) contents exhibited non-linear relationships with subcutaneous and abdominal AT-DHA contents, suggesting that some degree of DHA saturation takes place in erythrocytes and milk at high AT-DHA levels. When compared with each other, it seems that maternal erythrocyte-DHA saturates at lower DHA status than milk-DHA (Fig. 1), which may be in line with a more important functional role of DHA in erythrocyte membranes, e.g. maintenance of fluidity, flexibility and membrane-bound protein functions. Gibson et al. ( Reference Gibson, Neumann and Makrides 53 ) showed that with increasing maternal DHA intakes, the milk-DHA content continues to increase, but that from about 0·8 wt% DHA in milk, corresponding with an infant erythrocyte-DHA content of approximately 9 wt% (with a maximum of 12 wt%), no appreciable change occurs in the infant erythrocyte-DHA content. Similar apparent saturation of the adult erythrocyte-DHA was observed in the present study, where, with increasing AT-DHA contents in the Maasai, Pare and Sengerema women, maternal erythrocyte-DHA content seemed to reach a plateau of about 9 wt% (Fig. 2), while even higher individual maternal erythrocyte-DHA (up to 11·10 wt%) and infant erythrocyte-DHA (up to 10·98 wt%) contents were reached in the Ukerewe women (Table 2). An individual maximum erythrocyte-DHA content of about 11–12 wt% is also in agreement with our previous study, where the maximum content was 11·2 wt%( Reference Luxwolda, Kuipers and Smit 54 ). It is plausible that the erythrocyte-DHA content levels off with increasing DHA status, while this may be the case for the AT-DHA content to a much lesser extent. A consequence might be that the erythrocyte-DHA content in the high range may become a less reliable proxy for estimating whole-body, notably AT, DHA contents. However, it should be noted that each of the encountered relationships was subject to considerable scatter with few subjects having very high AT-DHA contents, while a more active turnover of AT and de novo fatty acid synthesis in pregnancy may preclude extrapolation to the non-pregnant conditions.
On average, about 17 % higher DHA content in abdominal (omental) AT, compared with that in subcutaneous AT, also resulted from considerable scatter (Fig. 4), with a tendency of higher omental AT-DHA contents notably at high DHA status. Visceral AT, in contrast to subcutaneous AT, drains directly through the portal circulation to the liver and is metabolically more active with, for example, higher lipogenic and lipolytic activities and higher capacity for the generation of NEFA and glucose uptake( Reference Ibrahim 55 , Reference Wronska and Kmiec 56 ). The remarkably small differences between the DHA contents of omental and subcutaneous AT might suggest that the women in the present study with lifetime stable dietary habits are at a high degree of DHA equilibrium, with little influence of dilution by de novo synthesised fatty acids in the more metabolically active omental AT. However, no appreciable differences in DHA contents between omental and subcutaneous AT have also been observed previously in overweight and obese Spanish patients( Reference Garaulet, Perez-Llamas and Perez-Ayala 57 , Reference Garaulet, Hernandez-Morante and Lujan 58 ), but in contrast to subcutaneous AT-DHA content, an inverse relationship of omental AT DHA with waist:hip ratio and visceral abdominal area has been observed( Reference Garaulet, Perez-Llamas and Perez-Ayala 57 ), suggesting that subjects with low central adiposity have a higher omental AT-DHA content, but not a higher subcutaneous AT-DHA content.
The mature milk-DHA content of the average US woman( Reference Brenna, Varamini and Jensen 30 ) and her subcutaneous AT-DHA content( Reference Leaf, Connor and Barstad 29 ) and also the milk-DHA and AT-DHA contents of French women at day 5 of lactation as reported by Martin et al. ( Reference Martin, Bougnoux and Fignon 59 ) fitted reasonably well with the relationships between the milk-DHA and AT-DHA contents observed in the present study (Fig. 3), although each of these data points from the literature was at the lower end of the curve (Table 2). Leaf et al. ( Reference Leaf, Connor and Barstad 29 ) supplemented fifteen men and women, some of them patients with dyslipidaemic disorders, with a minimum of 10 g fish oil containing 1·8 g EPA and 1·0 g DHA/d for 22 months (12–27 months) to achieve a subcutaneous AT-DHA content of 0·7 wt%. This amount is in the high range of the data given in Table 2 and may provide some insights into the amounts of EPA+DHA consumed by the average Tanzanian-Ukerewe woman who has an estimated subcutaneous AT-DHA content half that amount (0·37 wt%). In this context, there might not be a difference between the LCP n-3 bioavailability from fish-oil supplements and that from fish, since the intake of 485 mg EPA+DHA/d from fish or fish oil for 16 weeks was equally effective in increasing the EPA+DHA content in erythrocytes and plasma phospholipids( Reference Harris, Pottala and Sands 60 ). However, the comparison might in reality be much more complex, for example, due to differences between the Tanzanian women and Western women in distribution volumes, body fat percentages, consumption of other fatty acids (e.g. linoleic acid) and the intake of (low-glycaemic index) carbohydrates, which may stimulate de novo fatty acid synthesis.
Estimated milk-DHA output and whole-body adipose tissue-DHA content
We estimated that, when compared with the average US woman, the average Tanzanian-Ukerewe woman has about 2·2 times higher erythrocyte-DHA content, 1·8–2·6 times higher DHA amounts in mobilisable AT (in g), and about 2·5 and 5·0 times higher DHA outputs via colostrum and mature milk, respectively (Table 3). These values correspond with about 1·5–2·2 times higher amounts of mobilisable wet AT (in kg) in the average US woman, which dilutes her AT-DHA content four times, compared with the average Tanzanian-Ukerewe woman. The comparisons of the amounts of AT DHA and AT might be somewhat confounded by racial differences, because, at a given BMI, the Black population has lower fat mass( Reference Deurenberg, Yap and van Staveren 61 ). Nevertheless, the four times higher dilution of DHA in the mobilisable AT of the average US woman might be an important reason for her five times lower mature milk-DHA output and contrasts with her ‘only’ 1·8–2·6 times lower total DHA content in mobilisable AT. Selective mobilisation of DHA from AT has been suggested previously( Reference Raclot 38 , Reference Gavino and Gavino 62 , Reference Raclot 63 ), but in the case of American women, this is apparently of insufficient magnitude to compensate for their relatively lower AT-DHA content.
Because of the seemingly more important influence of dilution, and not due to the total amount of DHA in mobilisable AT, this situation might be considered as a state of ‘DHA starvation in the midst of plenty’, because sizeable stores are present but poorly available for transfer into the milk. Theoretically, the amount of mobilisable DHA in the AT of the average Western woman could support lactation at a level of 1 wt% milk-DHA for 63 d. Insufficient mobilisation, for example, caused by insufficient postpartum loss of the AT that is gained during pregnancy( Reference Chu, Callaghan and Bish 64 ), retained during lactation( Reference Caire-Juvera, Casanueva and Bolanos-Villar 65 ) or already present before conception, might also play a role in Western women. We have recently observed that pregnant Tanzanian women have 55% higher 25-hydroxyvitamin D (25(OH)D) than non-pregnant women and mothers shortly after delivery( Reference Kuipers, Luxwolda and Offringa 16 ). No such increases in 25(OH)D amounts have been reported for Western women, who typically do not change their 25(OH)D intakes during pregnancy or even experience a decrease( Reference Luxwolda, Kuipers and Kema 66 ). Therefore, more intense mobilisation of vitamin D, and also of DHA, from AT during pregnancy of Tanzanian women is conceivable. Also vitamin D becomes stored in AT, vitamin D in serum and AT are correlated( Reference Blum, Dolnikowski and Seyoum 67 ) and fasting causes vitamin D mobilisation in rats( Reference Brouwer, van Beek and Ferwerda 68 ). Circulating 25(OH)D is inversely related to body fat percentage( Reference Snijder, van Dam and Visser 69 ) and overweight and obese persons have lower 25(OH)D amounts. The high degree of AT turnover during pregnancy, where we deal with ‘facilitated anabolism and accelerated starvation’( Reference Hadden and McLaughlin 70 ), might not be continued during lactation in Western women because of insufficient weight loss or the consistent postprandial condition, both of which apply for many mothers in Western countries.
Limitations
It should be noted that, because of local constraints, the data at delivery/3 d postpartum and at 3 months postpartum were collected from different groups. We interpreted the differences in DHA contents between these groups in terms of longitudinal changes, as based on between-group statistical differences. This reasoning seems justified because of the stable dietary habits of each of these groups. The basal data given in Table 3 were derived from various publications, and the outcomes of the estimates may, therefore, be subject to sizeable deviations. It may also not be correct to use whole-body AT percentages of non-pregnant woman for estimates in pregnant and lactating counterparts. We made a distinction between ‘essential’ and ‘non-essential (mobilisable)’ AT in women, which is not supported by hard scientific evidence. Without this distinction, the DHA pool sizes become obviously bigger (see the Results section), but this does not change the conclusion that the average Tanzanian-Ukerewe woman has a higher DHA content and less diluted DHA in many, if not all, body compartments including those that can potentially become mobilised. The low AT-DHA levels also deserve to be mentioned, since low levels are subject to high analytical errors that may add up to sizeable uncertainty when they become multiplied by the large amount of body fat. We also made no distinction between the DHA present in the (mobilisable) TAG in the AT and that present in the phospholipids of its membranes. Another limitation might be that the groups were of different sizes, with the Maasai group being notably smaller. This small sample size resulted from the difficulty in investigating the Maasai in their bomas. Although the numbers were small, we included all the Maasai we could, since we thought their data to be unique.
Conclusions
We conclude that intra-uterine biomagnification is a sign of low maternal DHA status, that genuine biomagnification occurs during lactation, that exclusively breast-feeding mothers with low DHA status are unable to augment their infants' DHA status, and that exclusively breast-feeding mothers lose DHA independent of their DHA status. Maternal DHA supplementation may rapidly correct the maternal and infant DHA status in easily accessible compartments, but it is improbable that all organs of the mother (e.g. AT with low turnover and brain) will benefit at similar rates as those of the infant. We also found that a maternal erythrocyte-DHA content of 8 wt% corresponds with a (mature) milk-DHA content of about 1·0 wt% and subcutaneous and abdominal AT-DHA contents of about 0·39 and 0·52 wt%, respectively. Consequently, a mature milk-DHA content of 1 wt% might be a target for Western human milk and infant formula, since an erythrocyte-DHA content of about 8 wt% leads to the lowest risk of cardiovascular and psychiatric diseases in adults living in Western countries. Concomitant milk AA, EPA and linoleic acid contents were 0·55, 0·22 and 9·32 wt%, respectively. Interrelationships between DHA contents in erythrocytes, milk and AT suggest that with increasing DHA status, the erythrocyte-DHA content plateaus at about 9 wt%, with an upper maximum of about 12 wt%, and it plateaus more readily than the milk-DHA and AT-DHA contents. When compared with the average Tanzanian-Ukerewe woman, the average US woman has four times higher dilution of AT DHA (0·4 v. 0·1 wt%) and five times lower mature milk-DHA output (301 v. 60 mg/d), which contrasts with her ‘only’ 1·8–2·6 times lower total DHA content in the AT (19 v. 35–50 g). This dilution of DHA occurs in conjunction with the insufficient weight loss and the consistent postprandial state that is typical for many Western women might contribute to a state of DHA starvation in the midst of plenty.
Supplementary material
To view supplementary material for this article, please visit http://dx.doi.org/10.1017/S0007114513003255
Acknowledgements
The authors cordially thank J. H. K., S. M. and D. d. G. for their valuable aid in the analysis of the fatty acids.
The VSB-foundation and FrieslandCampina partly funded the fieldtrip of M. F. L. and R. S. K. to Tanzania. The VSB-foundation and FrieslandCampina had no role in the design and analysis of the study or in the writing of this article.
The authors' contributions were as follows: M. F. L. and R. S. K. collected the data; M. F. L. and R. S. K. wrote the initial manuscript; D. A. J. D.-B. and F. A. J. M. supervised the collection and analysis of the data and subsequent writing of the manuscript.
None of the authors has any conflicts of interest to declare.


