
Engagement with variation and change has largely remained marginal in studies of post-colonial varieties of English, due, at least in part, to a widespread assumption of nonnativeness and thus heavy emphasis on language acquisitional (i.e., contact) issues at the expense of speech community-based sociolinguistic approaches (Satyanath & Sharma, Reference Satyanath, Sharma, Singh, Kantara and Cserző2016:193). Likewise, sociophonetic investigations of Indian English are rather scarce. Taking the short vowel system of Delhi uppermiddle class-raised speakers as its focal point of entry, this study intends to show that variation in the present context lends itself to the same empirical analysis, and, therefore, can be considered to be subjected to similar constraints as other, so-called “native,” varieties. It is proposed that the observed apparent-time behavior of the vowels under study, that is, trap, dress, and kit, could be amenable to an analysis in terms of chain shift, with all the implications, especially regarding the issue of language transmission.
There is now a significant amount of literature addressing the question of how local languages have affected the grammar, and in particular the phonology, of Indian English. Implementations of this focus, which is often referred to as “regional variation” and features prominently in Kachru's (Reference Kachru1976, Reference Kachru1983) seminal model of sociolinguistic variation, have been largely worked out contrastively and under the assumption that an “[Indian] accent is normally derived from the L1 speech patterns of the speakers” (Sailaja, Reference Sailaja2012:360). The extent of this interest is understandable considering that there can, in general, be little doubt about the substratal origins of numerous features in Indian English. Barring a few exceptions (e.g., Sharma, Reference Sharma2005), however, claims about contact effects have usually not been backed by research based on sociolinguistically constructed speech corpora, with, for instance, little means to test whether those effects are historical (i.e., language change) rather than individual (i.e., SLA) (Sirsa & Redford, Reference Sirsa and Redford2013). More generally, very little has been done to address the long-acknowledged existence of mixed L1/L2 transmission and use (especially D'souza [Reference D'souza1997, Reference D'souza2001], Kandiah [Reference Kandiah1987, Reference Kandiah and Cheshire1991, Reference Kandiah, Foley, Kandiah, Bao, Gupta, Alsagoff, Ho, Wee, Talib and Bokhorst-Heng1998], and Singh [Reference Singh and Singh2007]), and the systematic patterns of variation that result from them and that are now observed across the board (e.g., see Balasubramanian [Reference Balasubramanian2009], Lange [Reference Lange2012], and Sedlatschek [Reference Sedlatschek2009] for some book-length variationist contributions on various grammatical features of the variety).
Although some empirical studies have started to depart from earlier L1-contrastive accounts (e.g., Cowie, Reference Cowie2016; Cowie & Elliott Slosarova, Reference Cowie and Elliott Slosarova2018; Fuchs, Reference Fuchs2016), to date, only a few (series of) studies on the sound system of Indian English have explicitly relied on community-based corpora (e.g., Coelho, Reference Coelho1997; Khan, Reference Khan and Cheshire1991; Satyanath & Sharma, Reference Satyanath, Sharma, Singh, Kantara and Cserző2016; R. Sharma, Reference Sharma2017). Focusing on Delhi, Agnihotri, and Sahgal (Reference Agnihotri and Sahgal1985), Sahgal and Agnihotri (Reference Sahgal and Agnihotri1988), and Chand (Reference Chand2009b, Reference Chand2010) concentrated on the English-dominant/nativeFootnote 1 populations of the affluent southern neighborhoods of the capital, while examining highly salient or stereotypical consonant variables, including rhoticity, the /w-v/ distinction, and the retroflexion of alveolar stops. While not all the variables suggest ongoing language change (only a strong case was made for nonprevocalic /r/ in both Chand [Reference Chand2010] and Sahgal and Agnihotri [Reference Sahgal and Agnihotri1988]), this body of work has also allowed for identifying long, community-wide patterns of stable variation.
R. Sharma (Reference Sharma2017) broke with earlier sociophonetic studies of the region by investigating variation in the vowels of the variety based on a more socioeconomically diverse sample—derived from middle-class neighborhoods of the old city—as an attempt to offer a less ethnographically selective picture of English use in Delhi than the one projected in previous work. This study suggests structured variability in the alternation between pairs of high and low variants for each of the three variables under consideration (north, goat, and kitFootnote 2), but found only moderate evidence of age-related variation. Studies on vowel changes, particularly those occurring below the level of social awareness, have had critical theoretical importance notably as concerns our understanding of the mechanisms of transmission of regular sound changes across generations. As pointed out by Satyanath and Sharma (Reference Satyanath, Sharma, Singh, Kantara and Cserző2016), it thus appears urgent to integrate this focus to the study of New Englishes.
Variables and research questions
The decision here to focus on the short front vowels was made on the basis of observations made during fieldwork. First, conversely to what had been reported in previous contrastive literature, all speakers appeared to maintain a clear distinction between trap and dress. Quite strikingly, in fact, a low vowel [a] oftentimes located in close perceptual proximity to the frontest elements of the bath class would be noted for trap, most particularly in younger female speakers. A cursory visual inspection of the vowels produced indicated differences in the shape of the overall vowel space of younger and older speakers, suggesting a possible lowering and retraction of /æ/.
Starting out from those observations, the main research question to be taken up is: Is the trap vowel involved in a change in progress in South-Delhi English? In addition, cumulative evidence from the literature suggests that a solid indicator of changes affecting trap resides in the behavior of adjacent vowels in the acoustic space, and in particular dress and sometimes kit. A subquestion is thus, admitting that there is an ongoing change in the trap vowel, are there any indications that the change is also affecting dress and kit? The hypothesis here is that a sizable lowering of trap will be accompanied by a lowering of the rest of the short front vowels, as currently observed in a vast number of locations worldwide: for example, Canada, California, and North America more generally by Clarke, Elms, and Youssef (Reference Clarke, Elms and Youssef1995); Eckert (Reference Eckert2012); Jacewicz, Fox, and Salmons (Reference Jacewicz, Fox and Salmons2011); South Africa by Chevalier (Reference Chevalier2016); Australia by Cox and Palethorpe (Reference Cox and Palethorpe2008); RP and southeast England by Fabricius (Reference Fabricius2007); Torgersen and Kerswill (Reference Torgersen and Kerswill2004); Dublin by Hickey (Reference Hickey and Hickey2016). Beyond the descriptive goal of the present study, the findings: (1) add to the understanding of Indian English, not least “in permitting,” as Kandiah (Reference Kandiah and Cheshire1991:275) argued, “the convincing demonstration of the existence of generalized sociolinguistic patterns and of the speech communities that manifest them” (emphasis in the original)–the speech community being understood here in Labov's (Reference Labov, Fasold and Schiffrin1989) acceptance of the term; (2) provide another report on English short front-vowel lowering as a global phenomenon. The question of whether a connection between these changes (diffusion) can be established will be discussed.
South Delhi
Various challenges have been encountered in previous studies on Delhi, not least as regards the construction of the object of study and its definition. An important one concerns, for instance, the use of the term middle-class, which, as Chand (Reference Chand2011:15) points out, not only fits awkwardly within the Indian context (it is a minority group which, in sheer economic terms, and considered in relation to the rest of the Indian population, is de facto “elite”) but also conceals considerable sociological heterogeneity.
An interesting point to start with is perhaps the difficulty, reported by, for example, Satyanath and Sharma (Reference Satyanath, Sharma, Singh, Kantara and Cserző2016:200) and Chand (Reference Chand2009b:65), of finding English bilinguals from locally born generations prior to 1940. This has to be considered in conjunction with several other factors. As Chand points out, the conditions for the development of an English-speaking middle class in Delhi were initially not as favorable as in other cities such as Lahore or Bombay, which, by the end of the colonial period, were already well-established epicenters of Western culture. Importantly, Delhi only became the seat of the imperial administration in 1911, that is, just a few decades before the independence of the country on 15 August 1947. Although limited in penetration, anglicization proceeded during this period, notably among professionals and contractors in charge of the construction of the bureaucratic complex known as New Delhi (Dasgupta, Reference Dasgupta2014:254). They rapidly formed a small social “aristocracy” that was no doubt instrumental in the development of English in the city, but whose possible influence must be evaluated in the face of later dramatic changes.
As Dasgupta (Reference Dasgupta2014) argued, the modern city of Delhi was, in many ways, shaped out of the tragic events ensuing upon the partition of India. Over the months following India's independence, as millions of refugees moved across the borders between the newly constituted states of Pakistan and India, hundreds of thousands of people coming in large part from what was formerly undivided Punjab streamed into Delhi. The population of the city, which had reached almost a million inhabitants in the last decade of British rule, thus nearly doubled within the space of a few years (1.7 million in 1951, Figure 1) leading to considerable urban expansion. To the south, agricultural lands made way for housing plots given out by the government to military officers (Defence Colony), resettlement colonies for refugees (Lajpat Nagar), or were acquired by the real estate developer DLF (e.g., South extension). The city's rapid urbanization also engulfed numerous villages standing in its way. In 2011, Delhi's population had come close to 17 million inhabitants; new major population hubs which had developed within close distance to the growing urban area—that is, most importantly, Noida, Gurugram, and Faridabad—belong today in the same metropolitan ensemble (Figure 1). The sample of the present study was thus chosen to reflect those recent developments as, ultimately, none of the localities visited during fieldwork existed in 1947, nor had any of the families interviewed lived in Delhi for more than three generations.
Left: Map of Delhi and vicinity (map data © OpenStreetMap) with location of the neighborhoods visited (dashed rectangle). Right: Delhi decadal growth.

METHOD
Speakers
Forty-eight Delhi residents were interviewed in the course of three fieldwork trips lasting several weeks (adding up to six months in total) and carried out by the author between December 2008 and May 2014. Because special efforts were made to ensure that the speakers’ use of English could be observed in a wide range of situations–and, incidentally, to control for language proficiency–the participants were identified through snowball sampling. By asking every new participant to recommend people with whom they would normally communicate in English, the investigation was rapidly directed toward and through a network allowing for observing interactions in informal private settings, and where the choice of the language of interaction between speakers would not be strictly determined by the situation of observation. The present study draws from a sub-selection from the larger corpus, reduced to 22 speakers once balanced for age and sex, and controlled for length and place of residence.Footnote 3
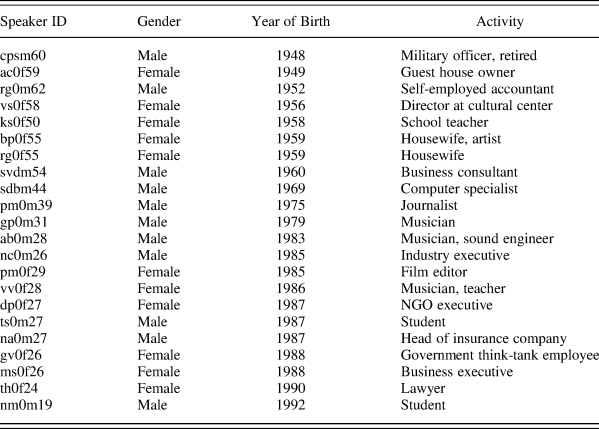
The area of investigation was contained to the neighborhoods located in the south of the capital. About half of the speakers selected lived in the neighborhoods bordering a 10 km section of the Olof Palme Marg–Outer Ring Road line; a major communication axis running east-west across South and South East Delhi administrative districts (see Figure 2). The remaining half lived either in Defence Colony or in Vasant Kunj, respectively north and south-west of this line. Those localities, among the more affluent ones of the city, are distributed across an area of expansive urban landscape with large portions of green spaces. All households visited but one consisted of nuclear families living either in individual houses or in apartments in residential complexes, and the speakers interviewed self-defined as middle or upper middle class. As is often observed in similar social environments (not least in cities with a recent history of massive in-migration [Kerswill & Williams, Reference Kerswill and Williams2000]), the participants had loose-knit networks of relations, with friendship ties usually established between individuals dispersed across relatively distant localities. Although no attempt at matching any pre-established age groups was made, the selection resulted in a higher concentration of speakers born in the mid-1950s and in the mid-1980s (Table 1). This is due to the fact that it was judged neither practical nor profitable to eliminate speakers belonging to the same household if they otherwise corresponded to the sampling requirements.
Location of the South Delhi neighborhoods visited (map data © OpenStreetMap).

Speakers’ Demographic Information (n = 22)
All speakers had received English medium education throughout and had attended higher education institutions in India. Bilingualism at home and within close friendship circles is negotiated primarily between English and Hindi, including in Punjabi families where speakers claimed some knowledge of the Punjabi language but did not report any use of it in daily interactions. The other language backgrounds were Bengali, Tamil, Telugu, and Malayalam; some use of those languages was reported with certain immediate family members if at all. In all cases, and as a result of the method used for recruiting participants, English was presented as the principal medium of communication for most or all purposes. Regarding orientations toward language use, younger speakers would identify as native speakers of English more liberally, while the older cohort was more heterogeneous in this respect. Also, older females stand out for having received convent school education, and many reported being forbidden to use any language other than English as a child.
Materials and annotation
Material collection was conducted using the methods and tools of the PAC projectFootnote 4 (Carr, Durand, & Pukli, Reference Carr, Durand and Pukli2004). The protocol comprises two wordlists covering a wide range of potential phonological oppositions (192 words in total), a reading passage, and guidelines for conducting a formal interview and collecting undirected, “informal,” conversation between two or more participants. Accordingly, speakers were usually met in groups of two, and, whenever possible, at their place of residence. The conversations with the participants were structured around a set of topics, such as growing up in Delhi and perceived changes in the city landscape, but any topics for which the speakers seemed to show interest were also encouraged. Each interview lasted from 45 minutes to two hours and was recorded with a digital recorder and condenser lapel microphones using one channel per speaker. The digital audio files were sampled at 44.1 KHz with a 16-bit resolution. The recordings were then transcribed orthographically in PRAAT (Boersma & Weenink, Reference Boersma and Weenink2016), down-sampled at 11025 Hz, and forced-aligned using the FAVE-align toolkit (Rosenfelder, Fruehwald, Evanini, Seyfarth, Gorman, Prichard, & Yuan, Reference Rosenfelder, Fruehwald, Evanini, Seyfarth, Gorman, Prichard and Yuan2014). All vowel boundaries in the output TextGrids were then corrected manually according to the procedure for duration measurement in Ladefoged (Reference Ladefoged2003:96–98). Due to well-known problems (Baranowski, Reference Baranowski, Bayley, Cameron and Lucas2013), the decision was made to exclude vowels in the environment of a glide consonant. On the other hand, liquid segments /l/ (clear in all positions) and /r/ (often realized as a tap) did not present any particular difficulty. Stressed grammatical words, lexical words with grammatical homonyms or found in discourse-marking constructions (e.g., so, know, mean) were identified separately before vowel formant extraction.
Analysis
The choice was made early on to gather as much information on speakers’ vowel space as possible in order to maximize available anchors. This was as much for selecting an appropriate normalization procedure as for defining a stable point against which the variation of other vowels could be gauged. Measurements for tokens in all monophthong classes were then obtained and examined. F1 and F2 vowel formant extraction was done at the temporal midpoint in PRAAT via the FAVE-extract toolkit (Rosenfelder et al., Reference Rosenfelder, Fruehwald, Evanini, Seyfarth, Gorman, Prichard and Yuan2014) using the Mahalanobis method (Evanini, Reference Evanini2009) with a second pass based on individual speakers’ own systems. The values obtained were screened for outliers caused by measurement errors and those were either re-measured manually in PRAAT, typically by adjusting the number of formants requested of the LPC, or eliminated from further analysis if no clear measurement was possible around the “steady state” of the vowel. All stressed vowels were then recoded according to Wells's (Reference Wells1982) lexical sets, keeping no more than three tokens per lexical item per speaker.
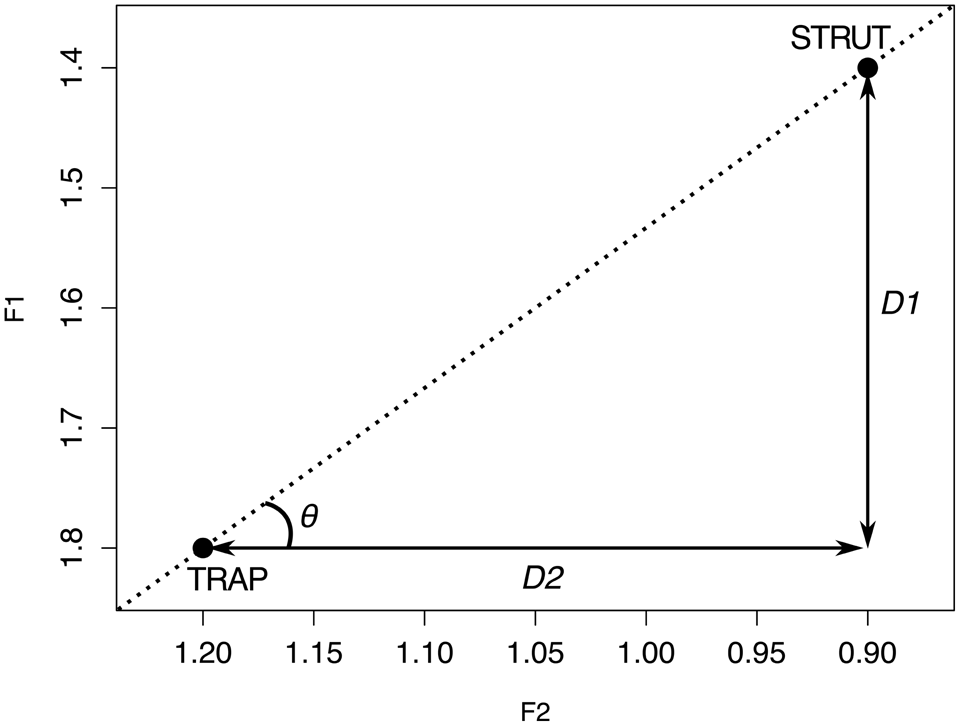
For the analysis, the methodological design outlined in Fabricius (Reference Fabricius2007) was used and, to some extent, furthered. First, raw Hertz values were normalized with the modified S-procedure (Fabricius, Watt, & Johnson, Reference Fabricius, Watt and Johnson2009) using the ‘vowels’ R package (Kendall & Thomas, Reference Kendall and Thomas2015). Second, the relative position of each vowel class was calculated against the anchor, defined as speakers’ individual means for strut.Footnote 5 This relation is quantified via three operational variables per vowel. The first two correspond to F1 and F2 distances between the vowels under study and strut. Those distances (labeled D1 and D2 in Figure 3) correspond to the difference between the normalized values of F1 and F2 of each selected token and the means of the anchor, that is, for each token of trap, D1 = F1trap–MeanF1strut, and D2 = F2trap–MeanF2strut. The third operational variable is the ratio D1/D2 and corresponds to the tangent of the angle θ in Figure 3. The values (in degrees) of the angles formed by the straight lines connecting each token to strut and the horizontal were thus obtained, a measure that allows for quantifying “differences in the relative placements of two vowels […] simultaneously on both the F1 and F2 dimensions” (Fabricius, Reference Fabricius2007:303). Finally, linear mixed-effect models were fitted for each of these variables using R's lme4 package (version 1.1–14) and the lmerTest package (version 2.0–36) in order to obtain p-values. Since the data were collected over a period of five and a half years, models were built using alternatively age and year of birth as a proxy for time. Other external factors (gender and style) as well as internal factors (preceding and following contexts) were included in each initial model as fixed effects, with effects for speakers and wordsFootnote 6 as random slopes. Following Podesva, D'Onofrio, Van Hofwegen, and Kim (Reference Podesva, D'Onofrio, Van Hofwegen and Kim2015), continuous variables (age/year of birth) were centered and discrete variables (all other variables) were coded using sum contrasts. Because age and year of birth yielded near identical results, it was assumed that those variables were measuring the same underlying construct. Results in the following sections are expressed as a function of speakers’ year of birth, as they allow for representing the time period examined more transparently.
Dimensions and operational variables used for the study of trap and dress.
RESULTS
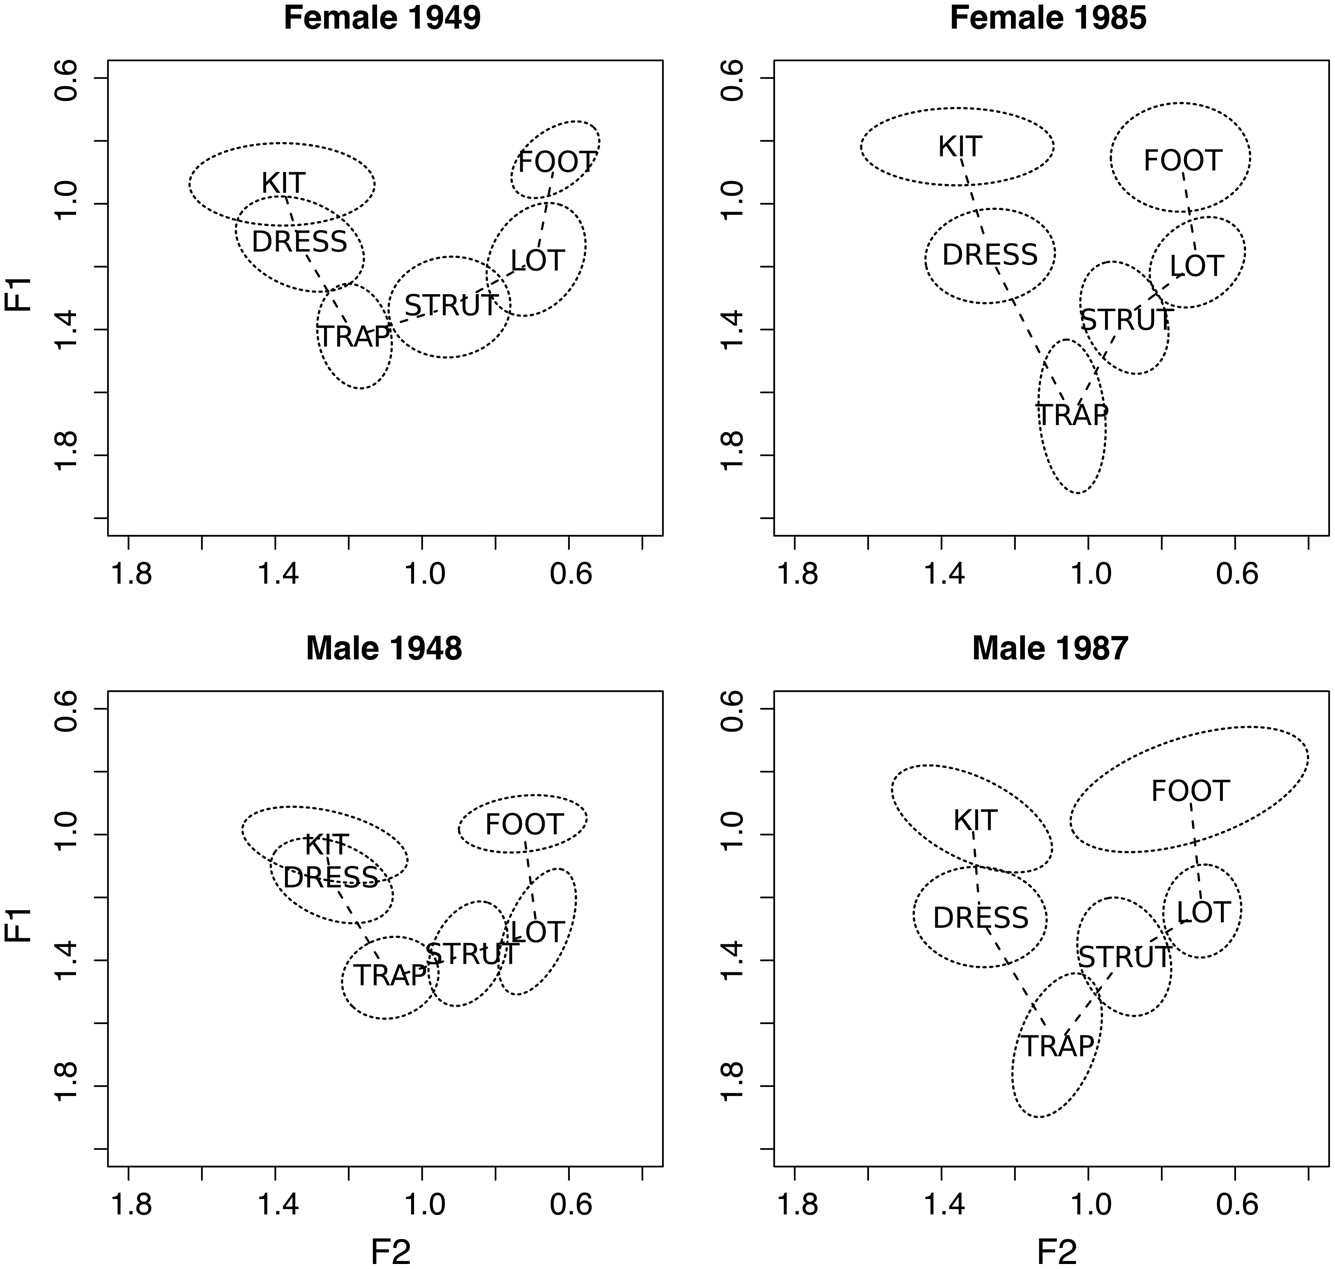
In Figure 4, four speakers from both ends of the age spectrum were chosen to illustrate the maximum range of variation in the distribution of the short vowels. The ellipses are meant to represent bivariate contour plots of the measured data within two standard deviations for each vowel category.Footnote 7 A cursory visual comparison of these data points toward what seems to constitute a definite pattern. First, older and younger speakers seem to differ significantly in the shape of their vowel space. The “triangular” configuration displayed by younger speakers is marked by an appreciably lower and possibly backer trap vowel. This is further enhanced by the long elliptical shape and downward direction of the distribution of trap, which, as pointed out by Labov (Reference Labov1994:457), tend to be symptomatic of vowel changes in progress. Second, and as is widely reported in comparable situations globally, this seems to be accompanied by notable differences in the rest of the short front vowels. This is here manifest from the variation in the degree of separation between the distributions of kit and dress. In the following sections, the results for each vowel variable are reported, starting with trap. The analysis seeks first to establish correspondences between the relevant social factors (style, gender, and year of birth) and the observed variation prior to examining phonetic conditioning.
Vowel plots of short vowels for four speakers: modified S-procedure normalized (Fabricius et al., Reference Fabricius, Watt and Johnson2009). Top left, female speaker (ac0f59), born 1949. Top-right, female speaker (pm0f29), born 1985. Bottom-left, male speaker (cpsm60), born 1948. Bottom-right, male speaker (ts0m27), born 1987. All speakers are Vasant Kunj residents (cf. Figure 2).
TRAP
The regression analysis for trap to strut angles reveals main effects of year or birth (p < 0.001) and style (p < 0.001) as well as a significant interaction between the two factors (p < 0.05). First, remarkable similarities between those results and the statistical model for F1 normalized distances (models for all outcome variables are summarized in the regression Table A1 in the appendix) can be noted, which indicate that trap's angle variation can be mainly explained in terms of trap's movement along the F1-axis. This means that, as previously observed (Figure 4), cross-generational differences in the shape of the short vowel space proceed primarily from a lower position of trap. Figure 5, which represents 95% confidence intervals and regression lines over year of birth (x-axis) by angle from trap to strut (y-axis), illustrates the interaction between age and style. The presence of a significant positive correlation between year of birth and this outcome variable—indicating specifically that values for trap to strut angles tend to increase as age decreases—is suggestive of an ongoing change in apparent-time. It can also be noted that those angles tend to be significantly “flatter” among older speakers in wordlist style, while stylistically marked differences seem to level out as age decreases. Those results, however, are not transparent and will be explained shortly. Finally, no effect of gender emerged for any of the dimensions investigated.
trap to strut angle values (in degrees) by year of birth and style.

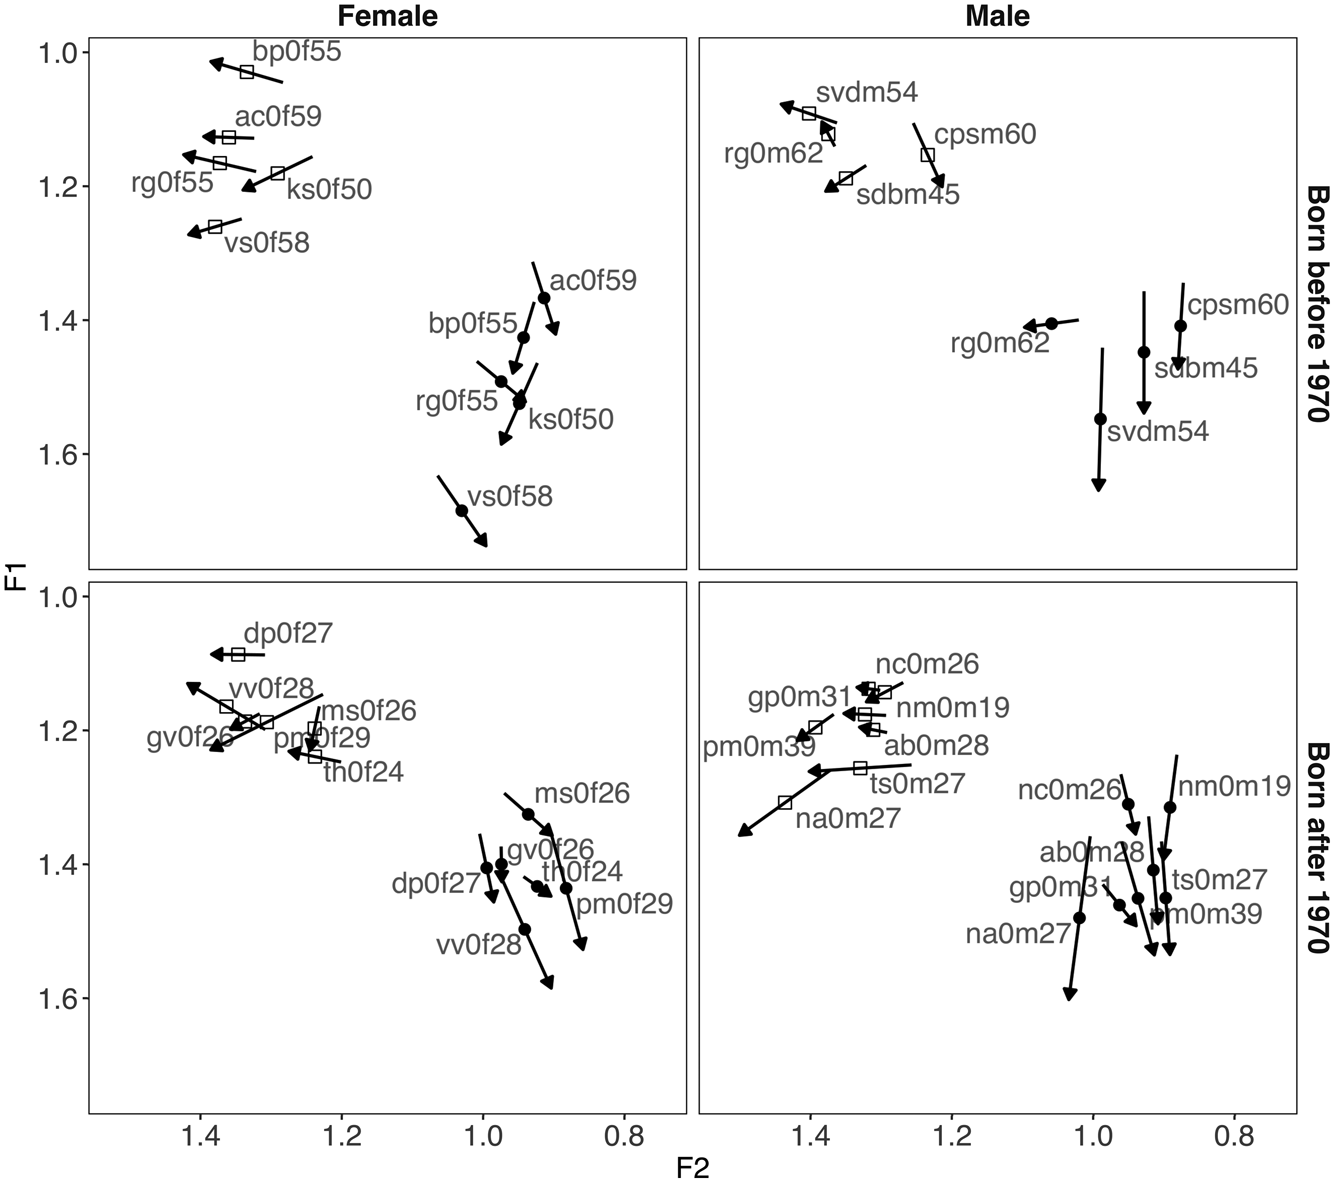
Looking now more closely at style patterns, the contrast between wordlist reading and conversation style stands out as a significant predictor for all dimensions studied. The results are summarized in Figure 6, which combines four graphs representing vowel plots of the means of strut and trap in each style, for all speakers grouped by gender and age (year of birth 1970 as the cut-off point). The arrows symbolize style-shifting from conversation speech to wordlist style for each speaker. Two main indications can be gathered from those graphs, which may appear, at first blush, at odds with the previous angle results. The first one concerns the general directionality of variation across styles: all speakers, with exception of ks0f50 and th0f24, seem to lower (and also front) trap to some extent. The second concerns cross-generational differences in style-shifting and has, therefore, direct relevance for the social structure of variation. Comparing age groups as defined in Figure 6 shows that the magnitude of trap's variation in the direction of the change is characteristically greater in younger speakers than in the older ones. Because these results seem at odds with those presented above, it is important to note that angle measures of style variation for trap are also affected by the variation of the anchor in the same context. Thus, the marked differences across styles observed in older speakers in Figure 5 are attributable to the near absence of movement of trap along the F1-axis combined with the normal peripheralization of strut in citation form (see, for example, Cruttenden, Reference Cruttenden2014:105), which is a constant across all age groups. The key point to keep in mind here, however, is that trap seems to have “acquired” some degree of style-shifting as it lowered. This element will be important when qualifying the phenomenon under study.
Vowel plots representing the variation of trap and strut across styles for four groups of speakers.

The results for the internal factors suggest primarily strong effects of following phonological environments and are for a major part coherent with some of the most widely reported coarticulation effects in the literature. The general constraints presented here are groupings of factors derived post hoc from the results summarized in Table A1 (appendix). It is important to note, at this juncture, that no attempt was made to group variables a priori with respect to voicing, place, or manner of articulation when constructing the models. All following and preceding segments were included with preceding obstruent-liquid clusters as an additional factor, since this environment tends to have a lowering and backing effect on adjacent vowels (see, for example, Baranowski, Reference Baranowski, Bayley, Cameron and Lucas2013; Di Paolo, Yeager-Dror, & Wassink, Reference Di Paolo, Yeager-Dror, Wassink, Di Paolo and Yeager-Dror2011). Because the variables were coded as sum contrasts, the baseline for the comparison for each level is the grand mean of all other levels within the same factor. Three main phonetic constraints were thus identified as having an effect on the lowering and backing of trap: labials, liquids, and nasal consonants. As is usually the case, trap was found to be lower when following /l/ and backer when following obstruent-liquid cluster, that is, both fostering broader trap to strut angles. Quite expectedly also, following nasal consonants were found to have a raising and fronting effect on the outcome variable. In line with Ladefoged and Johnson (Reference Ladefoged and Johnson2014), a gradation was found in the effect of the nasals as a function of their place of articulation: velar nasals strongly inhibit the lowering and backing of trap, followed by apical nasals, while /m/ was found to promote the phenomenon and was thus classified together with following labials. Labial environments seem to constitute overall a favorable context to the backing and lowering of trap. Figure 7 illustrates the effect of both following nasals and labials (respectively, white triangles and black circles) on trap to strut angle values. All remaining factors, chiefly following nonlabial voiced obstruents, were found to inhibit the phenomenon.
trap to strut angles (in degrees) by year of birth, labial and nasal following environments only, n = 595.

Taking the analysis one step further, the two apparent-time age groups defined above were tested for differences in internal constraints by running separate analyses by generation. Briefly, although the vast majority of the estimates in both models went in the same direction, thus showing no major reorganization of the constraints, a substantial increase in the detail of the phonetic controls in the younger speaker group could still be noted: the number of significant (or bordering with significance; that is, p < 0.10) phonetic constraints rose from 11 in the older speaker group to 18 in younger speakers. This increase in the phonetic detail of variation supports my initial observations about the “elliptical” shape of the distribution of trap fitting Labov's (Reference Labov1994:457) description of the “new and vigorous change” profile.
DRESS
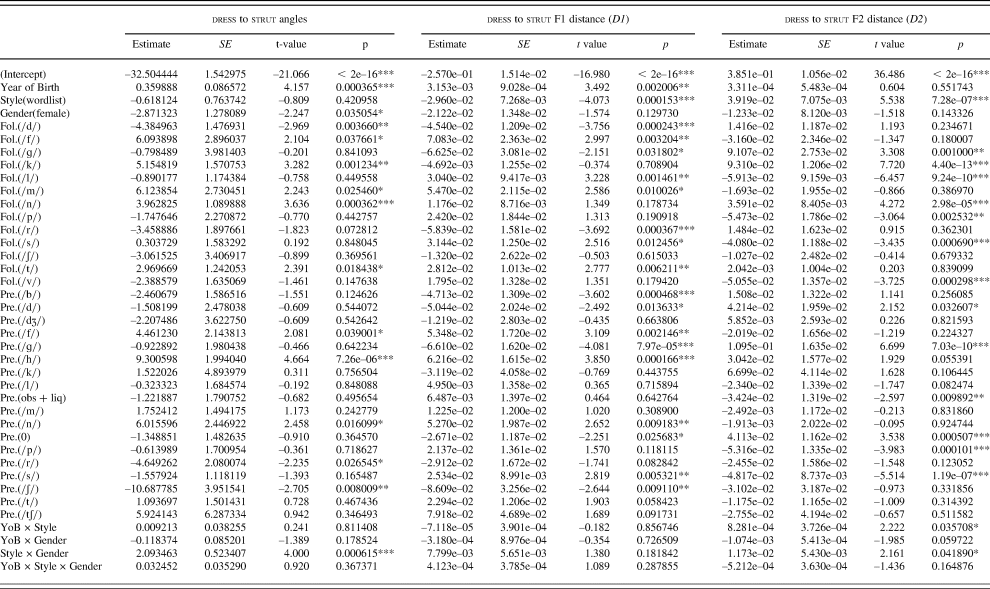
Similarly to trap, differences in the configurations of dress with regards to strut across the age spectrum essentially boil down to variation along the F1-axis (see regression Table A2 in the appendix). Overall, the statistical model for dress to strut angles reveal main effects of year of birth (p < 0.001), gender (p < 0.05), and a significant interaction between style and gender (p < 0.001). All social factors are summarized in Figure 8 below. The information displayed is the same as in Figure 5; note also that the sign of angle values was reversed in order to ease interpretation. As can be seen, there is a significant negative correlation between dress to strut angles and speakers’ year of birth, which indicates that dress tends to be lower as age decreases. A notable difference with trap patterns, however, concerns gender effects. The significant interaction with style reveals that, although age effect on dress lowering is evident for both men and women, the phenomenon under study seems to be more advanced for male speakers, and particularly in conversation style. For female speakers, on the other hand, stylistic differences appear to be absent, although, once again, this point must be looked into more carefully.
dress to strut angle values (in degrees) by year of birth, style and gender.

Devised on the same principles as Figure 6, Figure 9 represents variation across styles for dress and strut. As in previous graphs, the arrows point in the direction of the means of the vowels in wordlist reading style. While trap style-shifted in the direction of the change in younger speakers (i.e., the demographics representing the most advanced stage of the change), here, the general direction observed for dress corresponds to a fronting of the vowel for all speakers. It seems, therefore, that an explanation of style variation in terms of the expected peripheralization of vowels in citation form is warranted. Looking at the broader picture, it appears not only that the lowering of dress across the age spectrum is less substantial than that of trap, but also that the phenomenon lies below the level of social awareness (e.g., Labov, Reference Labov1966). One possible interpretation of these findings is that, admitting that the significant age effects for both variables trap and dress testify to natural language change in progress, the lowering of dress is posterior, and possibly consequential, to that of trap. This solution is supported by the fact that dress's lowering appears to be primarily motivated by internal linguistic factors as will be shown below.
Vowel plots representing the variation of dress and strut across styles for four groups of speakers.
Phonetic constraints on dress-lowering bear striking similarities with previous literature on other dialects, not least including Clarke et al.'s (Reference Clarke, Elms and Youssef1995) description of the Canadian Shift. Overall, the lowering of dress seems to be inhibited by voiced stops including /r/ (in the dress class, following /r/ only occurs intervocalically and is usually realized as a tap [ɾ]) and promoted by voiceless segments (fricatives in particular). Regarding this effect, the articulatory explanation proposed by Clarke et al. (Reference Clarke, Elms and Youssef1995:214) about the fact that “fricatives do not involve total oral closure” and, therefore, “would promote vowel lowering more than stops or affricates” should be retained. As in Clarke et al., again, dress lowering is not inhibited by flanking nasals. Regarding variation on the F2-axis, the results also fit the expected patterns since following velars and apical nasal were found to promote fronter vowels, while following /l/ and preceding obstruent-liquid clusters had a backing effect.
KIT
A marginally significant age effect emerged from the study of kit to strut angles (β = 0.19608, SE = 0.09390, p = 0.048*), which seems at first glance attributable to a slight though somewhat consistent fronting of the vowel. Although the vowel does not seem to follow the general downward movement of trap and dress sketched above, the variation of kit offers some of the more intriguing results of the present study.
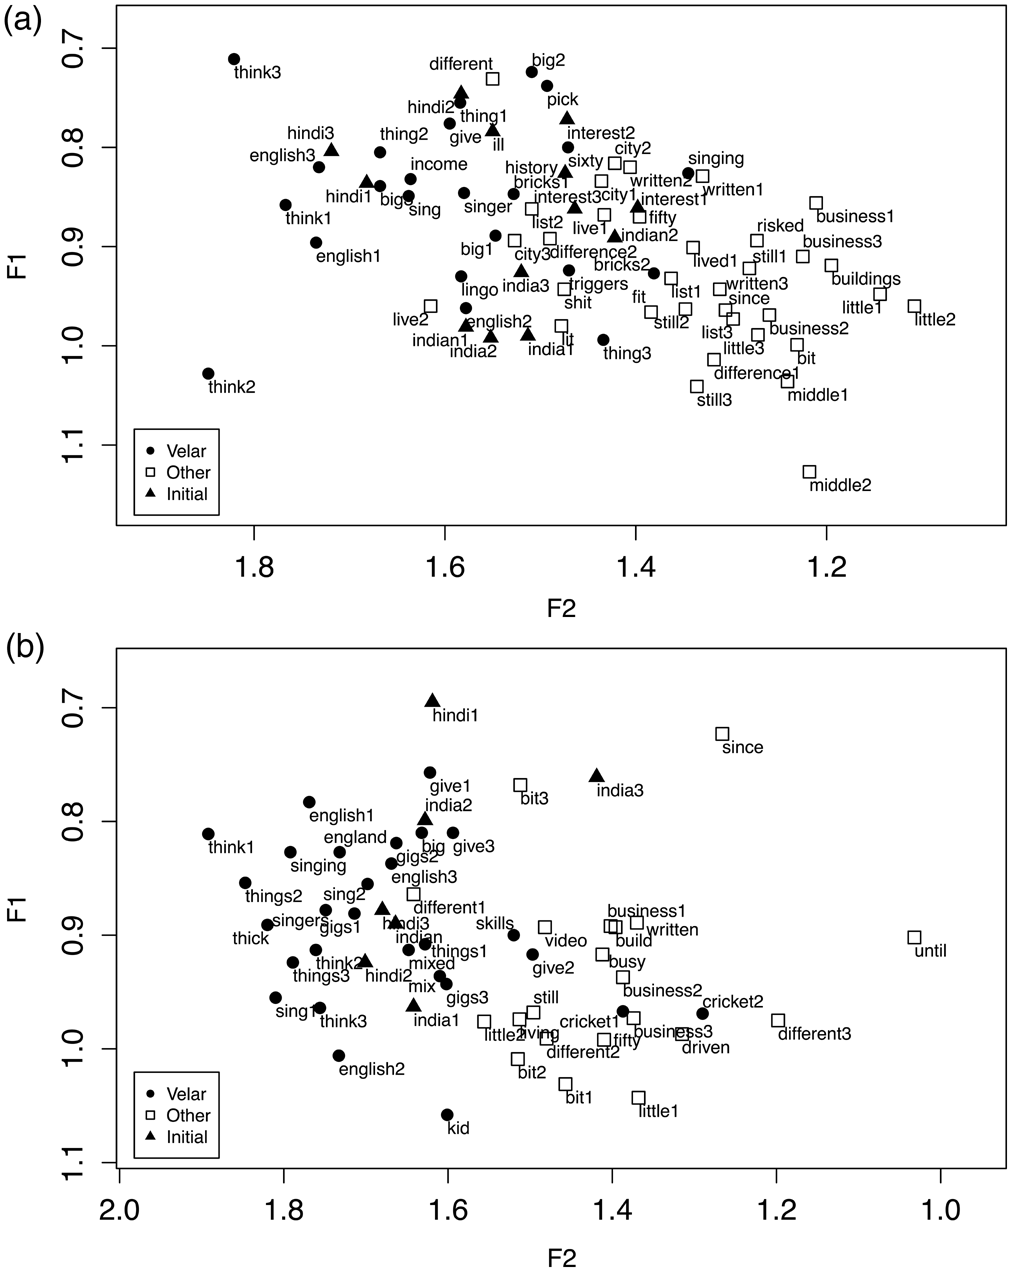
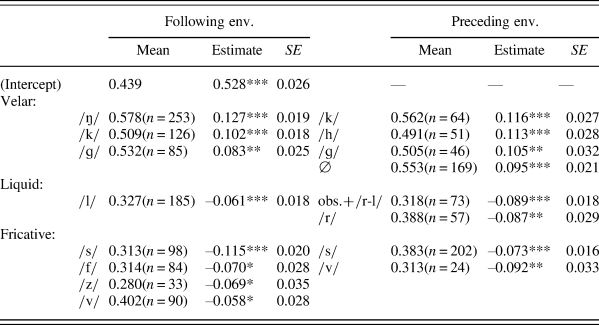
As shown in Figure 4, the kit vowel is generally characterized by a long ellipse whose focal axis aligns with the F2 dimension. The underlying reason for this seems to be the presence of a split distribution of kit's contextual allophones akin to those observed in contemporary South Africa (Bekker, Reference Bekker2014) and intermediate New Zealand English (as a stage in kit's evolution toward a fully centralized vowel [Langstrof, Reference Langstrof2006]). Table 2 summarizes the effects of preceding and following environments of kit tokens on their F2 distance to strut. The analysis revealed a number of effects strongly predicting a front variant of /ɪ/, the most important ones being the presence of a preceding or following velar (particularly /ŋ/) and being in word-initial or post-/h/ position. Conversely, preceding or following liquids and nonpalato-alveolar fricatives foster more centralized variants. It could also be noted that, following palato-alveolar contexts seem to have a certain fronting effect, but, because very few tokens were recorded, only /ʃ/ emerged as significant at p = 0.018 with /tʃ/ bordering with significance at p = 0.0505. Figure 10 illustrates the phenomenon for speakers svdm54 and na0m27 respectively. Except for a few outliers (na0m27's cricket is in the environment of a velar but is also preceded by an obstruent + liquid cluster), two sets of variants emerge quite neatly. The front one has an [ë] quality and overlaps to a large extent with the area of the face vowel, while word-initial or post-/h/ tokens are often the least fronted elements of this group. The second allophone, on the other hand, is distinctively more retracted and has a few sparse tokens preceding /l/ which are fully centralized (e.g., [ɘ] in until Figure 10b).
(a) Speaker svdm54 (male, born 1960).
(b) Speaker na0m27 (male, born 1987).
Vowel plot of kit's split distribution for two male speakers.
Summary of fixed factor effects on kit to strut normalized F2 distances–internal factors only, n = 1576. Significance levels: *** p ≤ 0.001, ** p ≤ 0.01, * p ≤ 0.05
While the South African kit-split is by far the most well-known instance of such cases, the general phenomenon appears to be relatively widespread worldwide, nonetheless. Split distributions of kit around velars have been reported in the diachronic trajectories of all major southern hemisphere varieties as mentioned earlier but also under the Northern California Shift where /ɪ/ is fronted/raised preceding a nasal velar and lowered in all other environments (Eckert, Reference Eckert2012). Clearly, the pervasiveness of this phenomenon leaves no doubt as to the existence of a strong coarticulatory basis for it, such as advanced by Bekker (Reference Bekker2014, citing Taylor, Reference Taylor1991), for instance. But is this the whole story? Two separate analyses were run on the allophonic groups defined earlier in order to test for differences in the factors predicting F2 distances to strut. The results show that, while kit's front allophone does not seem to vary over apparent time (p = 0.37), significant effect of year of birth (β = 1.830e-03, SE = 5.989e-04, p = 0.005**) and interaction with style (β = 1.666e-03, SE = 4.843e-04, p = 0.002**) still exist for the unconstrained variant. It thus appears that, although the older speakers’ system is firmly present in younger speakers, the latter cohort started appreciably fronting unconstrained kit in more formal styles. Of course, central kit fronting being a rather contextually limited phenomenon, it would be premature to tell whether this tendency could lead to actual change. However, this possibility should be evaluated against the variation described earlier, for it seems at least plausible that the degree of separation between kit's contextual variants may be directly affected by changes in dress (in particular, the degree of overlap between the two vowels as illustrated in Figure 4). In fact, this hypothesis would conform with the South African and New Zealand scenarios, where ample evidence also suggests that kit evolved into a split in reaction to the encroachment of dress on its vowel space.Footnote 8
DISCUSSION
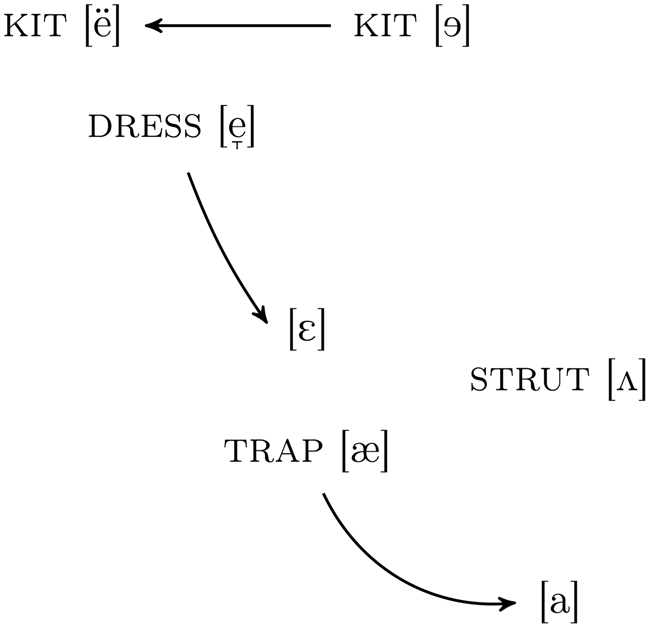
Starting out from the observation of sizable interindividual fluctuations in the height of trap, this study investigated apparent-time variation in the short front vowels of the system. The results point first toward a series of movements within the vowel space captured in Labov's (Reference Labov1994) principle II of vowel chain shifting: year of birth emerged as a significant predictor for the lowering of trap and dress measured in terms of their relative placement with respect to strut (angles). Second, we observe a split distribution of kit's tokens across two well-defined contextual variants: a front allophone in the context of a velar, in word-initial position, and possibly before voiceless palato-alveolars, and an unconstrained allophone that is appreciably centered. A significant effect of speakers’ year of birth was also found for this variable, with some fronting of central kit in wordlist style. Those movements are summarized in Figure 11.
Short vowel changes.
Language change
The main research question addressed in this study is whether the trap vowel is involved in a change in progress in South Delhi English. The fact that trap-lowering correlates with speakers’ year of birth offers a good, yet insufficient element of answer. Several additional elements can be brought forward in support of this hypothesis, however. The first and most important one is that there is prima facie evidence of a causal relationship (Labov, Reference Labov2010:89–119) between the events described in this study. This means that each movement in the vowel space is supported by expected modifications in the neighboring vowels (see subresearch question): that is, dress follows toward the margin of security created by the lowering of trap, and the kit-split resolves as the overlap of its distribution with that of dress recedes. This sequential explanation is also backed by the style-shifting patterns observed. Overall, if both trap and central kit shift in the direction of the supposed change, only the trap variable seems to be the object of some awareness. Although there could be several reasons for this, including the possibility that this social awareness may be the primary driving force of the change (from above), it could also be that style-shifting developed as a consequence of the maturity of trap's lowering (from below [Labov, Reference Labov, Eckert and Rickford2002]). The principal implication in one case as in the other is the antecedence of trap's lowering over that of dress. The last aspect to consider concerns internal factors and the emergence of phonetic factors that were also found to operate in the short front vowel shifts reported in various parts of the English-speaking world. This is a striking result, which, considering the overwhelming importance of phonetic conditioning in chain shifts, lends additional credibility to the language change hypothesis.
Although the array of evidence presented above provides a robust basis for a positive answer to the main research questions, significant challenges arise along the way. One such challenge is the important question of transmission (Labov, Reference Labov2010). As noted throughout, while the present investigation seems to add to an extensive number of studies reporting on similar changes in varieties of English worldwide, the underlying motivations it proposes to explain the phenomenon under study are also strikingly unexceptional. But can this be assumed without question? Labov (Reference Labov2010:307) determined that changes that are found to advance through generational incrementation (as is usually the case in chain shifts) tend to proceed from the “unbroken sequence of native-language acquisition by children.” In this model, each new generation of native speakers not only acquires the system of their caregivers but also “inherit” age vectors associated with certain variable elements of the language to which they later align (notably under social pressures to adhere to peer group norms). The question of whether those conditions are available to the Delhi demographics under study, and, therefore, whether the apparent-time patterns observed convey natural community-based changes, is thus a capital one. In that respect, the heterogeneity of the present mixed L1/L2 context and expected major discontinuities between postindependence Delhi-born speakers and earlier generations (whether in-migrants or part of the pre-existing local context) cannot be easily discounted. Although the results of this study do not allow for answering this question directly—further work will be needed if only to confirm the patterns observed—it is still possible to derive useful insights into this issue. The most important one is probably the evidence of the existence of norms, as well as the speech community that they help define, which can be derived from: the homogeneity of the features investigated, common patterns of variation, including across styles, and apparent continuity over time (with, notably, the maintenance of a complex allophonic split across generations). It thus seems, at the very least, possible to claim that Educated Delhi English forms a relatively well-focused variety.
The diffusion hypothesis
The lowering of trap seems to be at the departure of the chain of events described above. If this analysis is correct, however, the reasons why this vowel lowered in the first place remain to be elucidated. We can first note the presence of structurally favorable conditions with the absence of a short low back vowel. This point is important, since it is the merger of the lot and thought classes which has been identified as setting the stage for the Canadian shift, for instance (Clarke et al., Reference Clarke, Elms and Youssef1995; Labov, Reference Labov2010). Although, as noted in Domange (Reference Domange2015), Delhi speakers seem to have only one (phonotactically) long vowel in this area, there is no documented evidence that lot and thought might have ever been distinct to begin with. Consequently, actual causes for the Delhi short front vowel lowering must be looked for elsewhere.
In response to similar considerations, and to the fact that several of such shifts seem to occur “simultaneously” in various separate locations in the world, Hickey (Reference Hickey2017) recently proposed a change from above scenario where California and Canadian shifts are assumed to constitute natural epicenters of diffusion. While Hickey's argument is compelling provided the status of “social commodity” (Chand, Reference Chand2010) acquired by North American English globally, it should also be noted that this hypothesis remains to be substantiated by independent evidence. Regarding a possible extension of this scenario to the present phenomenon, on the other hand, I see at least two significant challenges to it. First, reports on changes in Delhi, notably those involving features potentially pointing toward the importation of American English norms (e.g., rhoticity, Chand, Reference Chand2010; Cowie, Reference Cowie2016; bath fronting, Cowie & Elliott Slosarova, Reference Cowie and Elliott Slosarova2018), vary and are not unequivocal on this matter. Second, qualitative studies such as Chand's (Reference Chand2009a) account on the rising discourse on “fake accents” in Delhi have demonstrated that avenues for deriving symbolic profits from forms indexing North American English are becoming increasingly limited. This hypothesis should, therefore, be evaluated against other major viable sources of diffusion, including, not least, Standardized Southern British English. I thus proceed here on examining the likelihood of this hypothesis by comparing the results of the present study to available data on the reconfiguration of the trap and strut in London and RP.
In Figure 12, Delhi's trap results are plotted against, alternately, London (left) and RP (right) data. Each graph plots individual speakers’ average trap to strut angles over year of birth, including regression lines for the varieties under consideration and 95% confidence intervals. The London data correspond to the upper middle-class data in Kamata (Reference Kamata2008), while the RP data were taken from Fabricius (Reference Fabricius2007).Footnote 9 As it appears, South Delhi and London upper middle-class patterns exhibit remarkable similarities. A cursory multiple linear regression analysis indicates that, while year of birth (centered) expectedly emerges as a significant predictor (p < 0.01), some of the variation could also be attributable to differences between dialects (p < 0.05), with Delhi angle values being slightly greater than London ones. No such effect emerges for RP, however. Another important indicator is the absence of interaction between speakers’ year of birth and dialects, which confirms the absence of significant difference between the slopes of the regressions. In short, the changes in both locations have evolved at the same pace over the period of time examined. Importantly, the fact that the changes observed in London/RP and South Delhi upper middle-class clearly appear to be concurrent militates against the hypothesis that one could be directly related to the other. Had South Delhi “borrowed,” for instance, London's trap lowering, thereby initiating a process of change from above, one would have expected to find an asynchronous development through the two locations, and the change to be sufficiently established in the source dialect before it could be recognized and used somewhere else for prestige purposes. The question of the relation between Indian English and RP in terms of structure remains a contentious topic, in particular if we consider that so many descriptive studies have unquestioningly represented and/or assumed RP as the default target of Indian acquirers (Agnihotri, Reference Agnihotri and Singh1999). One notable contribution of recent variationist studies to this issue has been to demonstrate that Delhi English is “not an imperfect replica of some British English, but a new variety developing and changing in ways divergent from the external norms” (Satyanath & Sharma, Reference Satyanath, Sharma, Singh, Kantara and Cserző2016:218). It is thus interesting to note that one can arrive at the same general conclusion with evidence of the opposite, namely, that those varieties can also follow similar, yet independent, pathways. This, however, comes with its own set of implications. For instance, Masica (Reference Masica, Agnihotri and Singh2012:92) noted in a discussion on the typological status of Indian English that “a characteristic of ‘native’ English dialects (and of Germanic dialects more generally) seems to be the instability of the vowels, a tendency for them to evolve into something else, via raising, rounding, diphthongization, etc.” and that “pending a thorough description of [Indian English]” this variety would belong in this group according to these criteria. Admitting that the present study confirms Masica's prediction, this should surely open up interesting avenues for future research.
Mean trap to strut angles. Squares, South Delhi; Dots, RP (Fabricius, Reference Fabricius2007), Triangles, London Upper Middle-Class (Kamata, Reference Kamata2008).

APPENDIX
Summary of fixed factor effects on trap to strut angles and distances, n = 1426. Significance levels:*** p ≤ 0.001,** p ≤ 0.01,* p ≤ 0.05, p ≤ 0.10

Summary of fixed factor effects on dress to strut angles and distances, n = 1999. Significance levels:*** p ≤ 0.001,** p ≤ 0.01,* p ≤ 0.05, p ≤ 0.10


 Open access