


Introduction
To assess species conservation status, key biological questions focus on population status, trends and spatio-temporal variability (Sutherland et al., Reference Sutherland, Freckleton, Godfray, Beissinger, Benton and Cameron2013b), knowledge of extinction risk or species loss (Sutherland et al., Reference Sutherland, Bardsley, Clout, Depledge, Dicks and Fellman2013a), as well as how disturbances are altering species distribution and abundance (Parsons et al., Reference Parsons, Favaro, Aguirre, Bauer, Blight and Cigliano2014). To provide an overarching view of the conservation status of species, the IUCN Red List of Threatened Species often relies on specialist groups to provide systematically collated metrics on population sizes and trends in abundance over time (Barnes et al., Reference Barnes, Szabo, Morris and Possingham2015). Aspects of the ecology and habitat of a species can make collecting such data difficult (González-Suárez et al., Reference González-Suárez, Lucas and Revilla2012).
Population size is usually determined using methods that include direct sampling (e.g. mark–recapture through tagging) and indirect sampling (e.g. track or clutch observations) but such data may be difficult to obtain for species in remote or inaccessible habitats (e.g. transboundary migrating birds, Bishop et al., Reference Bishop, Spivey, Hawkes, Batbayar, Chua and Frappell2015; or trans-equatorial migrating basking sharks, Skomal et al., Reference Skomal, Zeeman, Chisholm, Summers, Walsh and McMahon2009). Direct observation is difficult for marine species that are submerged most of the time, range widely or occur at low densities. For some groups, however, aspects of life history provide windows of opportunity to assess their status. For example, species of seabirds and seals may come ashore and congregate to breed, facilitating collection of extended time series of abundance data (Paleczny et al., Reference Paleczny, Hammill, Karpouzi and Pauly2015; Collins et al., Reference Collins, Chilvers, Taylor and Robertson2016; Trillmich et al., Reference Trillmich, Meise, Kalberer, Mueller, Piedrahita and Pőrschman2016). Marine turtles are another group for which population status is often assessed using annual numbers of nesting females or egg clutch production as indicators (Balazs & Chaloupka, Reference Balazs and Chaloupka2004; SWOT Report, 2017).
In this manner, global and regional populations of all marine turtle species have been assessed since 1996. IUCN categorizes green turtles Chelonia mydas as Endangered based on global population declines of 37–61% over the previous three turtle generations (Seminoff, Reference Seminoff2004), and hawksbill turtles Eretmochelys imbricata as Critically Endangered based on a decline of > 80% using the same criteria (Mortimer & Donnelly, Reference Mortimer and Donnelly2008). Fortunately, marine turtle populations respond well to extended periods of protection at nesting beaches, and population recovery has been documented at multiple sites for both hawksbill and green turtles (Mazaris et al., Reference Mazaris, Schofield, Gkazinou, Almpanidou and Hays2017) and several subpopulations of green turtles have been downlisted by the IUCN Species Survival Commission Marine Turtle Specialist Group. On a global scale, the south-west Indian Ocean, which includes the Chagos Archipelago (hereafter occasionally referred to as Chagos), hosts some of the most important national populations of hawksbill (Mortimer & Donnelly, Reference Mortimer and Donnelly2008) and green turtles (Seminoff, Reference Seminoff2004). Genetic studies of both nesting and foraging hawksbill turtles (Mortimer & Broderick, Reference Mortimer, Broderick, Sheppard and Seaward1999; Vargas et al., Reference Vargas, Jensen, Ho, Mobaraki, Broderick and Mortimer2016) and nesting green turtles (Bourjea et al., Reference Bourjea, Mortimer, Garnier, Okemwa, Godley and Hughes2015) demonstrate linkages between Chagos and elsewhere in the south-west Indian Ocean, especially Seychelles.
After almost 2 centuries of permanent human settlement and associated exploitation and trade in green turtle meat, hawksbill shell, oil and eggs (Mortimer, Reference Mortimer2009; Wenban-Smith & Carter, Reference Wenban-Smith and Carter2016), the Chagos islands have been uninhabited since 1973 (except Diego Garcia, site of a joint UK/USA military base). In 2010 one of the largest (640,000 km2) permanent no-take marine protected areas was created within the British Indian Ocean Territory (Koldewey et al., Reference Koldewey, Curnick, Harding, Harrison and Gollock2010). This presented an opportunity to track the status of remnant marine turtle populations that are no longer exploited. In 1970 J. Frazier visited a few of the islands, interviewed inhabitants, and concluded only a few hundred hawksbill and green turtles remained (< 1,000 clutches laid annually by each species; Frazier, Reference Frazier1975). In 1996 the first systematic, territory-wide snapshot survey of turtle nesting in Chagos was conducted (49 islands over 6 weeks; Mortimer & Day, Reference Mortimer, Day, Sheppard and Seaward1999), estimating 300–700 nesting hawksbill (1,200–2,800 clutches) and 400–800 green turtles (2,200–4,400 clutches) annually by using seasonality data from Seychelles (Mortimer, Reference Mortimer1988; Mortimer & Bresson, Reference Mortimer and Bresson1999) to extrapolate from the 1996 rapid-survey data. Long-term monitoring was recommended, to define critical habitats, nesting seasonality and long-term population trends.
Recently updated estimates of turtle nesting activity in the region were summarized in SWOT Report (2017) but did not include information about the Chagos Archipelago. Our study aims to remedy this dearth of knowledge relative to elsewhere in the south-west Indian Ocean region. We examined patterns of spatial and seasonal distribution, and abundance of hawksbill and green turtle nesting activity, in the Chagos Archipelago during 1996–2018 and compared our estimates of annual egg clutch production to those reported for sites elsewhere in the region.
Study area
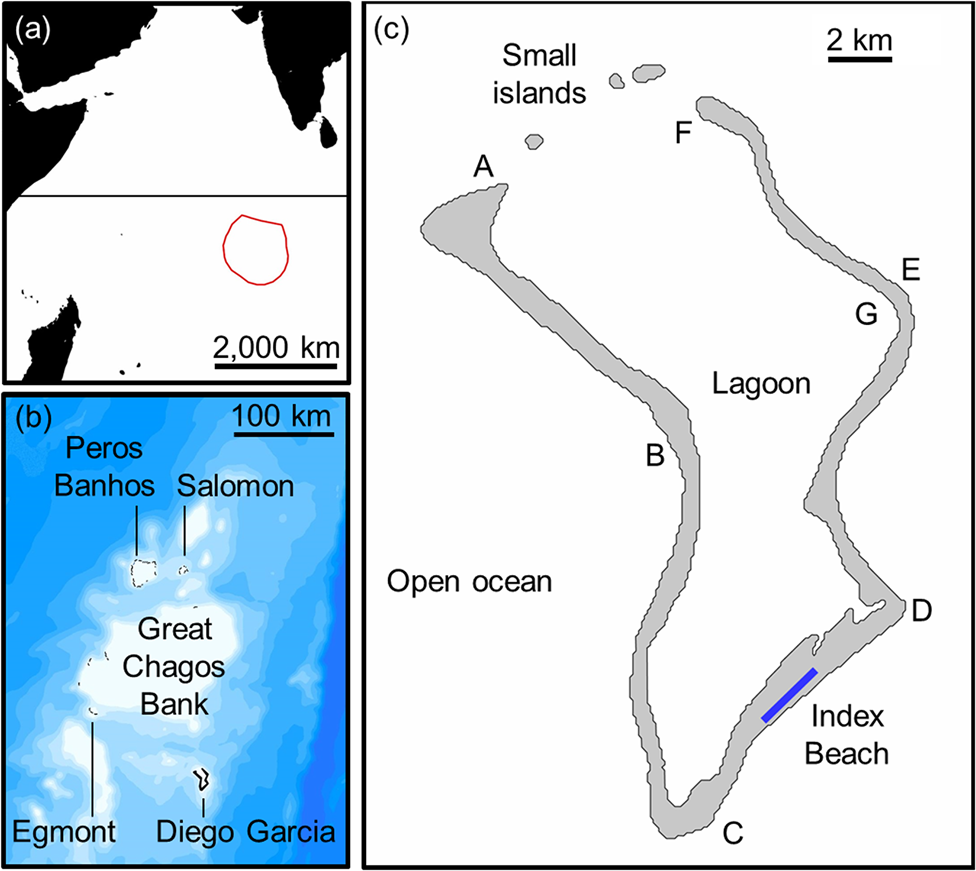
The Chagos Archipelago comprises c. 67 islands and 235 km of oceanic coastline distributed across five atolls (Fig. 1, Supplementary Fig. 1; Mortimer & Day, Reference Mortimer, Day, Sheppard and Seaward1999). These include four groups of outer islands (Table 1): Peros Banhos atoll (36 islands, 80.7 km of coastline), Salomon atoll (11 islands, 26.3 km), Great Chagos Bank (8 islands, 32.9 km), and Egmont atoll (5–8 dynamic sand cay islands, c. 22.8 km). The main atoll, Diego Garcia, comprises 4 islands with 72.1 km of coastline (96% on Diego Garcia island).
(a) The location of the Chagos Archipelago in the south-west Indian Ocean with the boundary of the British Indian Ocean Territory, (b) bathymetry of the Archipelago in 100 m contours (source: GEBCO Compilation Group, 2018), indicating delineation of atolls separated by deep water, and (c) location of 2.8 km index beach and three small islands on Diego Garcia. Six sections of coastline (AB, BC, CD, DE, EF, FG) were surveyed to assess suitable nesting habitat and relative per cent nesting activity by species (Table 2).
Physical features of each of the five islanded atolls of the Chagos Archipelago (Fig. 1, Supplementary Fig. 1), with numbers of islands, total oceanic coastline and oceanic coastline suitable for nesting. For hawksbill and green turtles, indices of nesting activity were calculated from body pit counts conducted during rapid surveys of all five atolls in 1996 and 2006 and at Diego Garcia in 1999. These indices were used to calculate per cent contribution of each atoll to total Chagos nesting activity. Monthly track surveys on the index beach at Diego Garcia facilitated an estimate of mean annual egg clutches produced at that atoll, and from that to estimate mean annual clutch production at all five atolls.

1Mean numbers of body pits counted per km of suitable coastline surveyed in 1996 and 2006.
2Percentages of total egg clutch production contributed per atoll, calculated by averaging the 1996 and 2006 indices for each atoll and using 1999 survey data to extrapolate to total suitable coastline.
3Mean estimated numbers of egg clutches produced annually at Diego Garcia atoll were calculated from monthly track surveys of the Diego Garcia index beach conducted during the 2011–2012 to 2017–2018 nesting seasons.
4Estimated egg clutch production by each species at each of the four outer-island atolls were extrapolated based on calculated spatial distribution of nesting activity.
Distribution of suitable nesting habitat and levels of turtle nesting activity recorded during the 1999 rapid survey of 72.1 km of oceanic coastline, by section, on Diego Garcia (Fig. 1c).
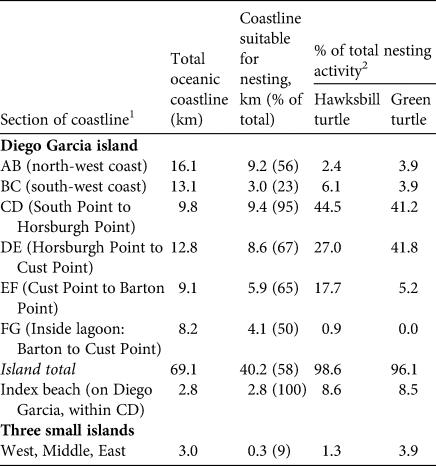
129.1 km along the outer west coast (AB, BC), 31.8 km along the outer east coast (CD, DE, EF; including the 2.8 km Diego Garcia index beach within CD), 8.2 km inside the east coast of the lagoon (FG), and the coastlines of the three small islands at the mouth of the lagoon (Fig. 1c).
2Nesting activity recorded in each section of coastline (based on numbers of body pits) are presented as per cent of total nesting activity on Diego Garcia.
The spatial boundaries of the south-west Indian Ocean regional management units for both green and hawksbill turtles have been defined by the IUCN Marine Turtle Specialist Group based on genetic linkages and documented migratory patterns. They include territorial waters of mainland countries from southern Somalia to South Africa plus the islands of Comoros, Madagascar, Mauritius, Mayotte, Réunion and its scattered islands, Seychelles, and the Chagos Archipelago (Wallace et al., Reference Wallace, DiMatteo, Hurley, Finkbeiner, Bolten and Chaloupka2010).
Methods
Data collection
Habitat assessment
JAM conducted rapid surveys of the five islanded atolls in 1996, 1999 and 2006, and scored all stretches of surveyed coastline in terms of suitability for nesting based on accessibility of adequate beach sand platform to turtles. Four features of the shoreline were each rated on a scale of 1–4, with 1–2 considered accessible, and 3–4 inaccessible: offshore approach, foreshore, high tide line (erosion cliff and associated barriers), and beach platform (see Supplementary Material 1 for detailed criteria). Where any of the four features were scored as 3 or 4, turtles were unlikely to either successfully emerge onto the beach or to lay eggs. The lengths of suitable (i.e. accessible) oceanic coastline were calculated for each island surveyed, including Diego Garcia (Tables 1 & 2, Fig. 1).
Spatial distribution of nesting activity amongst atolls
Four sets of rapid surveys were conducted: by JAM in 1996, 1999 and 2006, and by NE in 2016. To calculate spatial distribution, JAM conducted rapid surveys in February and March of both 1996 and 2006 across the entire archipelago (Mortimer & Day, Reference Mortimer, Day, Sheppard and Seaward1999; Mortimer, Reference Mortimer2007), and in late January and February of 1999 along the entire oceanic coastline of Diego Garcia atoll (Mortimer, Reference Mortimer2000; Table 3, Supplementary Table 1).
Dates and coverage of the four rapid surveys, conducted in 1996, 1999, 2006 and 2016.

Data were collected by walking along the perimeter of each island high on the beach platform and recording the locations and characteristics of all turtle tracks and body pits. A track is defined as the imprint a turtle makes when crawling on the sand, and a body pit is the large bowl-shaped depression a turtle leaves when digging a nest (Mortimer & Day, Reference Mortimer, Day, Sheppard and Seaward1999). Tracks can easily be erased during periods of high tide, but body pits, usually dug above the high tide line, can remain visible for weeks, providing a reliable indicator of spatial habitat use, especially when nesting is sparse. All rapid surveys were conducted outside the peak nesting seasons of both species as defined by the results of the present study. A subsample of the coastline (comprising 34 islands and 80 km) was surveyed in 1996 and again in 2006 (Mortimer, Reference Mortimer2007). During the three rapid surveys conducted in 1996, 1999, and 2006, 211.8 km (90% of the Chagos oceanic coastline) were surveyed at least once, and > 80 km repeatedly (Supplementary Table 1). In 2016 NE surveyed 39 islands (105 km) by foot and helicopter, to confirm general patterns of spatial distribution.
Assessment of annual egg clutch production and nesting seasonality
Along the south-east coast of Diego Garcia island a 2.8 km long index beach was selected that hosted some of the highest densities of nesting activity identified during the 1999 rapid survey (Mortimer, Reference Mortimer2000). Located partially within the Diego Garcia Ramsar Site and adjacent to a paved road, it is easily accessible. Monthly track surveys were conducted by environmental personnel of the US Navy Support Facility and US and UK base personnel volunteers, at 2-week intervals towards the end of neap tides when tracks were least likely to be washed away by high tides. Surveys were during March 2006–April 2007 (14 months), April 2011–May 2013 (26 months) and November 2014–March 2018 (41 months). Monthly survey frequencies were 10 months with 3–4 surveys (12.3%), 45 with 2 (55.6%), 21 with 1 (25.9%), and 5 months without surveys (6.2%). During each survey all tracks were counted, and their widths measured to confirm the species (hawksbill turtle tracks are typically < 95 cm wide and green turtle tracks > 100 cm wide; Pritchard & Mortimer, Reference Pritchard, Mortimer, Eckert, Bjorndal, Abreu-Grobois and Donnelly1999). To estimate longevity of turtle tracks, fresh tracks of both species were marked and monitored during 27 November–9 December 2018.
Data analysis
Suitability of nesting habitats
Using the habitat accessibility data collected during the rapid surveys of 1996, 1999 and 2006, the amount of suitable habitat for nesting turtles was calculated for each island surveyed, and a mean per cent estimate of suitable habitat was calculated for each atoll (Table 1). For atolls where survey coverage was not 100% (Peros Banhos and Egmont) mean figures for each atoll were used to estimate suitable habitat along the 9% (21 km) of oceanic coastline not surveyed.
Spatial distribution of nesting activity amongst atolls
Indices of nesting density were calculated for each species by averaging numbers of body pits per km of suitable coastline surveyed at each of the four outer-island atolls (Peros Banhos, Salomon, Great Chagos Bank, Egmont) during the 1996 and 2006 surveys, which took place on approximately the same dates in both seasons (Table 3). For each atoll, the mean of the 1996 and 2006 indices were then calculated and multiplied by estimated total km of suitable habitat to produce indices of relative levels of nesting activity (Table 1). For Diego Garcia, the 1996 and 2006 surveys alone were not adequate to estimate mean total body pits as only 16 and 4%, respectively, of the 72.1 km coastline were surveyed. In 1999, however, the entire Diego Garcia oceanic coastline was surveyed, and in both 1996 and 2006 the 2.8 km coastline that became the Diego Garcia index beach had been surveyed. Assuming relatively constant spatial distribution of nesting activity from year to year, we used 1999 data to extrapolate total body pits at Diego Garcia atoll in 1996 and 2006 based on body pit counts recorded at the index beach. For both species, using indices of body pit numbers at all five atolls (Table 1), we calculated per cent contribution of each atoll to total Chagos nesting activity (Table 1).
Annual egg clutch production and nesting seasonality
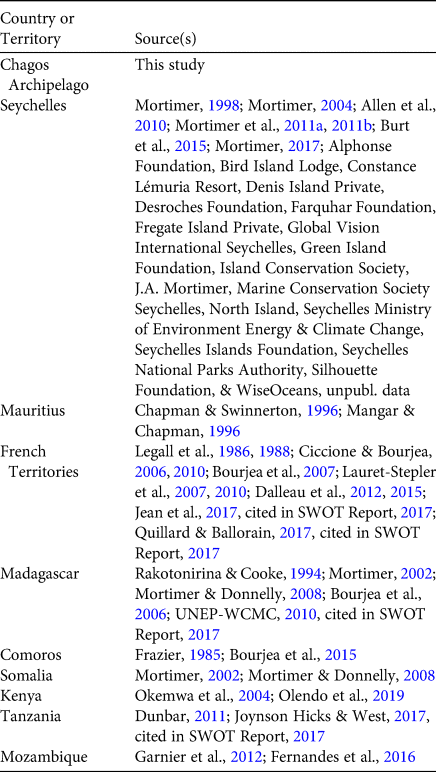
Data from monthly track surveys at the index beach were used to estimate monthly total nesting emergences and egg clutches laid and describe seasonality of nesting activity. For each species mean monthly track counts were calculated. For five unsurveyed months we averaged data from the months before and after. Estimated total numbers of nesting emergences (i.e. turtle tracks) were extrapolated for each month using estimates of track longevity calculated in November–December 2018: for hawksbill turtles 2.8 days (mean 2.79 ± SE 0.2621, range = 1–7, n = 45) and for green turtles 3.9 days (mean 3.94 ± SE 0.4950, range = 1–9, n = 23). To calculate numbers of egg clutches laid each month at the index beach, we then assumed that 55% of total turtle tracks resulted in egg laying, based on data from similar habitats in the Seychelles (Mortimer & Bresson, Reference Mortimer and Bresson1999; Mortimer et al., Reference Mortimer, Camille and Boniface2011a). Estimated egg clutches laid annually by hawksbill and green turtles at the index beach were then calculated for each of the following six 12-month (April–March) periods: 2006–2007, 2011–2012, 2012–2013, 2015–2016, 2016–2017, 2017–2018. These were graphed over time along with an estimate of egg clutches laid annually at the index beach in 1995–1996 based on the mid points of the bracketed estimates derived in 1996 by Mortimer & Day (Reference Mortimer, Day, Sheppard and Seaward1999) and an assumption of consistent spatial distribution of nesting activity over time. Least squares regressions were calculated to provide indications of population trends during 1995–1996 to 2017–2018. As a further indication of population trends, we compared body pit counts made at the same time of year in both 1996 and 2006 along an 80 km section of coastline. We averaged annual egg clutch production recorded at the index beach during five recent seasons between 2011–2012 and 2017–2018 and extrapolated that mean to the entire Diego Garcia atoll using 1999 data indicating that 8.6% of hawksbill and 8.5% of green turtle nesting activity occurred at the index beach (Table 2). Estimated egg clutch production at the four outer atolls was then extrapolated from calculated spatial distribution of body pits (Table 1). To define seasonality and illustrate intra-annual patterns, track counts calculated for each month at the index beach were graphed for each of the six 12-month (April–March) periods along with a graph of the overall monthly means for all six seasons combined. We assessed the relative contribution of Chagos egg clutch production to the south-west Indian Ocean region based on information available in the literature, including SWOT Report (2017). We produced maps of the region indicating estimated annual egg clutch production at each study site included in our review. Exclusive Economic Zone boundary, country border and coastline data (Claus et al., Reference Claus, De Hauwere, Vanhoorne, Souza Dias, Oset García and Schepers2018) were projected with ArcMap 10.5.1 (Esri, Redlands, USA). Data sources for each country (or territory) are presented in Table 4 and estimated clutch numbers for individual sites within each country (or territory) in Supplementary Table 3.
Sources of data used to estimate the mean annual number of egg clutches produced by hawksbill and green turtles at each site in the south-west Indian Ocean (Fig. 4, Supplementary Table 3).
Results
Available habitat and spatial distribution of nesting activity
Suitable turtle nesting habitat occurred along 132 km (58%) of 235 km of oceanic coastline, with 51–76% per atoll (Table 1). For hawksbill turtles per cent of total nesting activity by atoll ranged from 2% on Great Chagos Bank to 48.8% on Diego Garcia, and for green turtles from 3.4% on Salamon to 38.8% on Peros Banhos (Table 1). Per cent total hawksbill and green turtle nesting activity relative to available habitat at each atoll (Table 1) indicated Diego Garcia and Peros Banhos were the most important atolls in all respects. The 1999 rapid survey results show that at Diego Garcia atoll (Fig. 1c) nesting activity was low along the 29.1 km western perimeter, hosting only 8.5% of total hawksbill and 7.8% of total green turtle nesting on the atoll, compared to 89.2% of hawksbill and 88.2% of green turtle nesting along the 31.7 km eastern perimeter (Table 2). No significant nesting was recorded inside the Diego Garcia lagoon, and little, 1.3% of hawksbill and 3.9% of green turtle nesting, at the three small islands.
Annual egg clutch production and population trends
We estimated mean annual egg clutch production in Chagos for the period 2011–2012 to 2017–2018 as 6,308 for hawksbill and 20,487 for green turtles (Table 1). Estimated nesting activity at the index beach between 1995–1996 and 2017–2018 showed marked interannual variation but also changes over time (Fig. 2). For green turtles there was a marked, and highly significant, increase in numbers of clutches, with an order of magnitude increase in numbers of clutches per season over the 23 year time series. This increase was best described by a logarithmic function (F 1,5 = 37.2, P < 0.01, r 2 = 0.88). Hawksbill turtles showed a non-significant increase in numbers of clutches over the time series (for a linear trend F 1,5 = 0.70, r 2 = 0.12, P > 0.05). Comparison of body pit counts along the 80 km of coastline surveyed rapidly in both 1996 and 2006 suggested an increase of 23% for hawksbill (1996, 91 pits; 2006, 112 pits) and 147% for green turtles (1996, 167 pits; 2006, 413 pits; Mortimer, Reference Mortimer2007).
Estimated annual clutch numbers laid by (a) hawksbill turtles Eretmochelys imbricata and (b) green turtles Chelonia mydas at the 2.8 km Diego Garcia index beach (Fig. 1c) during 1995–2017. Closed circles represent estimated clutch numbers derived from monthly track surveys conducted in April–March in six periods (2006–2007, 2011–2012, 2012–2013, 2015–2016, 2016–2017 and 2017–2018). Open circles are derived from midpoints of bracketed estimates for 1995–1996 (Mortimer & Day, Reference Mortimer, Day, Sheppard and Seaward1999). Calculations of least squares regressions showed significant order of magnitude increase in green turtle clutches, as shown by the dashed line in (b).

Seasonality
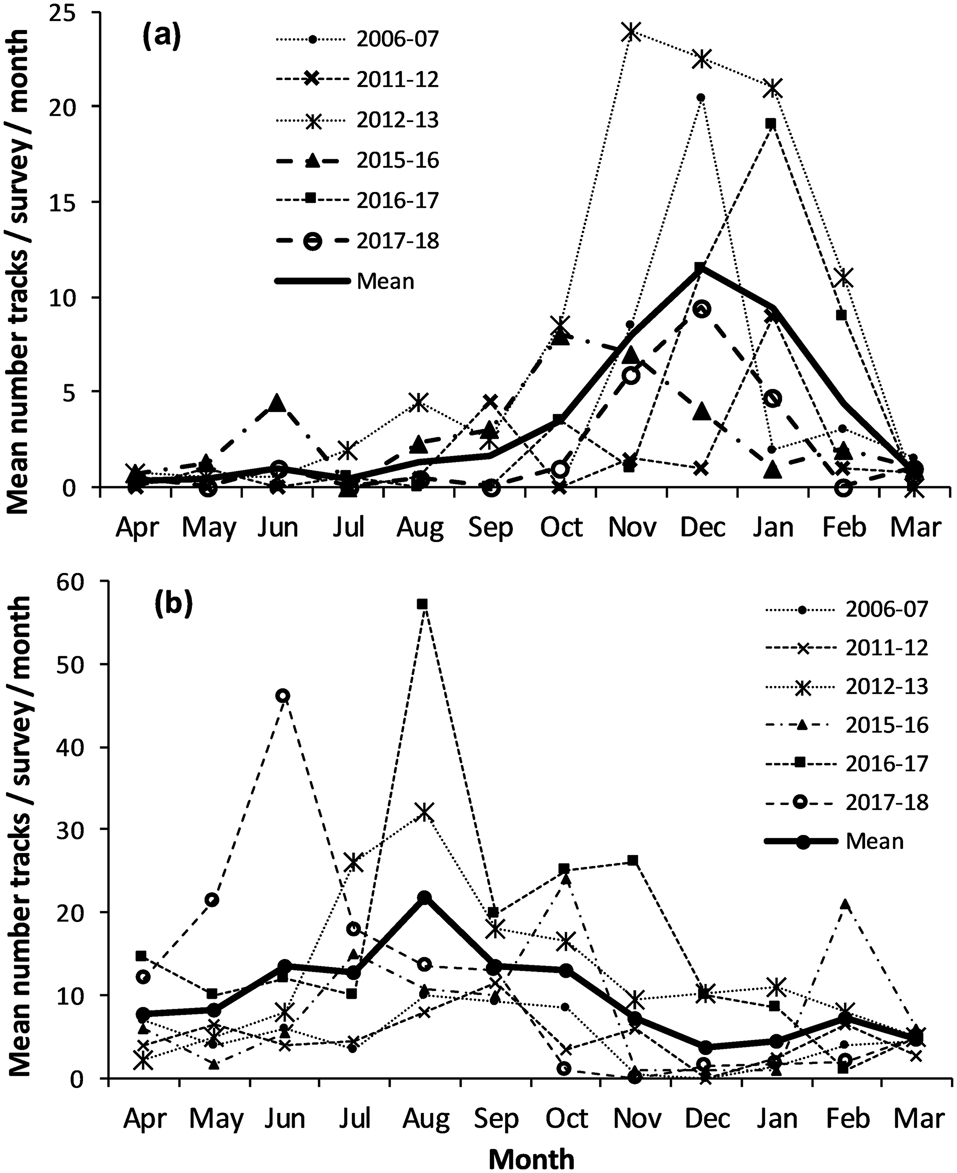
Mean nesting seasonality of Chagos hawksbill turtles indicated 86% occurred in October–February, with a peak of 28% in December. Green turtle nesting was more variable, occurring year-round, with 64% of nesting in June–October, a peak of 19% in August, and 3–7% of annual nesting emergences in other months (Fig. 3).
Monthly distribution of track counts along the 2.8 km Diego Garcia index beach (Fig. 1c). Dashed lines indicate individual seasons, and solid lines overall mean figures for all seasons combined. (a) Hawksbill turtle nesting peaked in October–February. (b) Green turtles nest year-round with a peak during June–October.
Relative importance of the Chagos Archipelago in the south-west Indian Ocean region
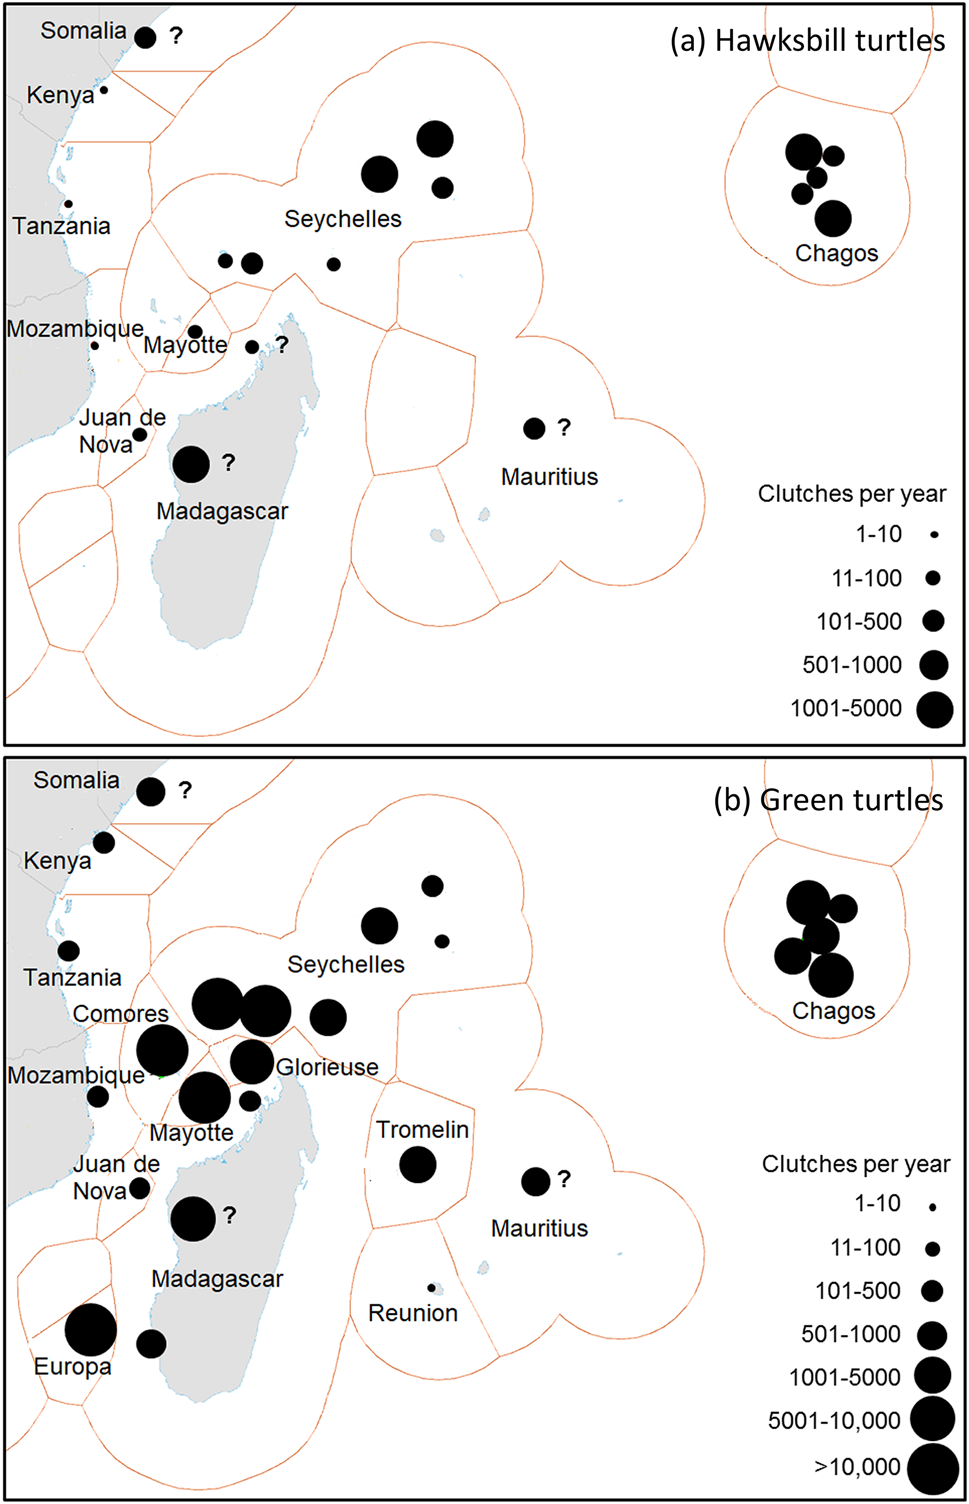
Total estimated mean annual reproductive output in the region, at 20 hawksbill and 26 green turtle sites, are 12,466–16,047 hawksbill and 103,944–143,466 green turtle clutches (Supplementary Table 3). Five sites, in Seychelles (Inner Islands, Amirantes), Madagascar (general), and Chagos (Peros Banhos, Diego Garcia), each produce annually 1,001–5,000 hawksbill clutches. Five sites, in Seychelles (Cosmoledo group, Aldabra group), French islands (Europa, Mayotte), and Comoros, each produce > 10,000 green turtle clutches annually (Fig. 4). The Chagos Archipelago has available nesting habitat (132 km) comparable to that of Seychelles (193 km; Supplementary Table 3).
The most important nesting populations in the south-west Indian Ocean region of (a) hawksbill and (b) green turtles. Circle sizes indicate estimated mean annual egg clutch production. A question mark indicates inadequately surveyed sites. For source data see Table 4 and Supplementary Table 3. The base map is from Claus et al. (Reference Claus, De Hauwere, Vanhoorne, Souza Dias, Oset García and Schepers2018). The shapes around each population indicate Exclusive Economic Zones.
Discussion
Current estimates of 6,300 hawksbill and 20,500 green turtle clutches laid annually in Chagos represent an increase of 225–525% for hawksbill and 465–930% for green turtles since the 1996 surveys, which estimated 1,200–2,800 and 2,200–4,400 clutches, respectively (Mortimer & Day, Reference Mortimer, Day, Sheppard and Seaward1999). The relatively higher increase for green turtles accords with trends documented at the Diego Garcia index beach during 2006–2018.
Differing patterns of nesting density between atolls probably reflect a combination of ecological factors and historical human impact. The Chagos Archipelago was inhabited by 650–1,200 coconut plantation labourers who collected wood and caught fish and turtles, beginning in 1776 at Diego Garcia, 1808 at Egmont, and 1813 at Peros Banhos, Salamon and Great Chagos Bank, and ending in 1935 at Egmont and Great Chagos Bank, and in 1971–1973 at Diego Garcia, Salamon and Peros Banhos (Wenban-Smith & Carter, Reference Wenban-Smith and Carter2016; Supplementary Table 2). Current nesting densities may therefore reflect historical human exploitation, with higher nesting densities now reported on atolls with relatively less accessible islands.
Peros Banhos and Diego Garcia host most of the nesting habitat and the largest populations of nesting turtles in the Chagos Archipelago. Since 1968 and 1970 green and hawksbill turtles, respectively, have been protected by conservation legislation. Since 1973 turtle protection has been reinforced by several Special Nature Reserves that do not have human habitation or artificial lighting. At Peros Banhos topography affords protection, with abundant habitat on 36 small islands along the rim of the 34 km diameter lagoon. At both Peros Banhos and Great Chagos Bank, rough seas and primitive sail and oar-driven boats would have limited the efficiency of historical turtle hunts (Wenban-Smith & Carter, Reference Wenban-Smith and Carter2016). At many Great Chagos Bank islands the high energy beaches, which offer ideal habitat for green turtles but restrict human access, may explain the abundant green turtle nesting. In contrast, Salamon, with 10.6% of total nesting habitat, today hosts < 5% of turtle populations despite reports of abundant turtles in 1786 (Horsburgh, 1809, in Mortimer & Day, Reference Mortimer, Day, Sheppard and Seaward1999) and 1813 (Wenban-Smith & Carter, Reference Wenban-Smith and Carter2016). Salamon comprises a nearly closed island ring, facilitating human access to all nesting beaches regardless of weather. Egmont also has islands easily accessible year-round, but its human population was relatively smaller, and habitation ended 37 years earlier. Today its beaches (13.1% of total) host 16.1% of the green and 5.0% of the hawksbill turtles of the archipelago.
The interannual variability of the Diego Garcia monthly surveys typifies nesting populations globally (Broderick et al., Reference Broderick, Godley and Hays2001) and within the region (Lauret-Stepler et al., Reference Lauret-Stepler, Bourjea, Roos, Pelletier, Ryan, Ciccione and Grizel2007; Mortimer, Reference Mortimer2012), driven by varying remigration intervals (e.g. Hays, Reference Hays2000). Individual turtles experience differing environmental conditions year-to-year at their foraging grounds, which modulate the time females take to achieve breeding body condition. So, in some years relatively higher proportions of the population may attain this body condition and migrate to breed. Remigration intervals vary between individuals and even over time for the same individual (Miller, Reference Miller, Lutz and Musick1997).
The turtle populations of the Chagos Archipelago show signs of recovery after 2 centuries of exploitation. Recovery occurs in two phases. Once protection begins, females that would previously have been killed after only a few nesting attempts now survive the season to produce full complements of clutches and return as re-migrant females in subsequent seasons. This produces an immediate increase in nesting activity and reproductive output even though absolute numbers of adult females have not yet increased (Mortimer, Reference Mortimer1985, Reference Mortimer1988; Balazs & Chaloupka, Reference Balazs and Chaloupka2004). Then, after a lag of 30–40 years, the time estimated for Indo-Pacific hawksbill (Bell & Pike, Reference Bell and Pike2012) and green turtle (Limpus & Chaloupka, Reference Limpus and Chaloupka1997) hatchlings to attain sexual maturity, a second phase of recovery commences once the offspring produced on protected beaches mature and return as reproductive adults (Dutton et al., Reference Dutton, Dutton, Chaloupka and Boulon2005). In Seychelles a 40-year recovery pattern has been documented for both hawksbill (Allen et al., Reference Allen, Shah, Grant, Derand and Bell2010) and green turtles (Mortimer et al., Reference Mortimer, von Brandis, Liljevik, Chapman and Collie2011b), with up to 800% increase in clutches after 4 decades of protection. Such recovery is underway in Chagos and we predict will become more evident with continued protection of the marine protected area (Koldewey et al., Reference Koldewey, Curnick, Harding, Harrison and Gollock2010) and long-term monitoring (Wallace et al., Reference Wallace, DiMatteo, Bolten, Chaloupka, Hutchinson, Abreu-Grobois and Mortimer2011).
The statistically significant increasing trend in the number of green turtles nesting on Chagos is encouraging, and continued monitoring is needed for hawksbill turtles to determine whether the potentially increasing trend is significant or simply reflects interannual variability. The need for long time series to confirm statistical significance of apparent trends in abundance was highlighted by Mazaris et al. (Reference Mazaris, Schofield, Gkazinou, Almpanidou and Hays2017) who reported that, globally, many time series documenting marine turtle abundance remain non-significant because they are too short. Our estimates of nesting numbers could be further improved. For example, we assumed that 55% of total turtle tracks resulted in egg laying based on data from Seychelles, but this assumed value, central to our calculations, could be improved by collecting data on rates of egg-laying success across the Chagos Archipelago. Some of the other values we used in our estimates are probably more robust. For example, our 95% confidence interval of 0.286–0.345 for the proportion of total observed Chagos green turtle body pits occurring on Diego Garcia enables us to conclude confidently that Diego Garcia hosts a large proportion of all green turtle clutches across the archipelago. Future status assessments may be improved by new methodologies, such as ongoing research on the archipelago deploying cameras to photograph daily tracks on beaches. Any inaccuracies our sampling imposed on estimates of nesting activity would probably add noise and so dampen any real trends, rather than generate spurious trends. Hence, we are confident that our calculated increase in numbers of green turtle clutches since 1996 is real, a pattern mirrored in other rookeries elsewhere (e.g. Mazaris et al., Reference Mazaris, Schofield, Gkazinou, Almpanidou and Hays2017).
Another threat to turtle rookeries is the presence of non-native rats Rattus spp., which prey on hatchlings (Caut et al., Reference Caut, Angulo and Courchamp2008) and embryos (JAM, unpubl. data from Diego Garcia) and disrupt both terrestrial and marine ecosystems (Graham et al., Reference Graham, Wilson, Carr, Hoey, Jennings and MacNeil2018). Ongoing and planned rat eradication in the Chagos Archipelago (Hilton & Cuthbert, Reference Hilton and Cuthbert2010) will most likely accelerate turtle recovery.
Our study is the first to document nesting seasonality at Chagos, following earlier snapshot surveys (Frazier, Reference Frazier1975; Mortimer & Day, Reference Mortimer, Day, Sheppard and Seaward1999; Mortimer, Reference Mortimer2000, Reference Mortimer2007). The October–February nesting peak exhibited by hawksbill turtles on Diego Garcia corresponds to that in Seychelles, where 94 and 98% of annual nesting occurs during October–February in the inner islands (Mortimer & Bresson, Reference Mortimer and Bresson1999) and Amirantes (Mortimer et al., Reference Mortimer, Camille and Boniface2011a), respectively, coincident with high north-west monsoon precipitation (Mortimer & Bresson, Reference Mortimer and Bresson1999). Green turtles typically nest year-round throughout the region (Dalleau et al., Reference Dalleau, Ciccione, Mortimer, Garnier, Benhamou and Bourjea2012), with patterns of high intra- and interannual variation (Mortimer et al., Reference Mortimer, Camille and Boniface2011a; Mortimer, Reference Mortimer2012). The June–October (austral winter) nesting peak on Diego Garcia accords with comparative data from the region, suggesting a tendency for lower latitude nesting to peak in the austral autumn and winter, and higher latitude nesting in the austral summer, a pattern indicating that temperature may be moderating seasonality (Dalleau et al., Reference Dalleau, Ciccione, Mortimer, Garnier, Benhamou and Bourjea2012; Mortimer, Reference Mortimer2012). Across species and ocean basins the slope of the relationship between temperature and date of first breeding is steeper at higher latitudes (Mazaris et al., Reference Mazaris, Kallimanis, Pantis and Hays2013). Variations in environmental parameters (e.g. sea surface temperature) forming part of global climate change (IPCC, Reference Pachauri and Meyer2014) are associated with shifts in timing of seasonal events for a range of organisms (Walther et al., Reference Walther, Post, Convey, Menzel, Parmesan and Beebee2002; Ramp et al., Reference Ramp, Delarue, Palsbøll, Sears and Hammond2015), including earlier onset of nesting in loggerhead turtles Caretta caretta (Hawkes et al., Reference Hawkes, Broderick, Coyne, Godfrey and Godley2007). Further investigation of seasonality in the Chagos Archipelago may also reveal variations in peak nesting amongst the five atolls.
Our review of mean annual egg clutch production in the south-west Indian Ocean indicates that the Chagos Archipelago accounts for 39–51% of hawksbill and 14–20% of green turtle reproduction in the region. The Red List assessment criteria focus on annual numbers of nesting females, but we suggest egg clutch production is a more meaningful statistic given lack of consensus amongst turtle researchers regarding within season clutch frequency. Estimates of 3–5 clutches for hawksbill turtles (Mortimer & Donnelly, Reference Mortimer and Donnelly2008) accord with data from Seychelles (Mortimer & Bresson, Reference Mortimer and Bresson1999) but an estimate of 3 clutches for green turtles (Seminoff, Reference Seminoff2004) is probably an underestimate. Esteban et al. (Reference Esteban, Mortimer and Hays2017) recorded a minimum mean of 6.0 clutches per turtle by satellite tracking inter-nesting female green turtles at Diego Garcia. It follows that although green turtle populations in the region produce almost 10 times more egg clutches than hawksbill turtle populations, there may be only five times as many female green turtles nesting annually. The Seychelles–Chagos hawksbill turtle population, identified by genetics as a separate regional management unit (Vargas et al., Reference Vargas, Jensen, Ho, Mobaraki, Broderick and Mortimer2016), accounts for 97% of known hawksbill turtle nesting in the region. Linkage of the Chagos Archipelago to the region is also supported by migrations of most satellite-tracked post-nesting Chagos green turtles to Seychelles, Madagascar and eastern Africa (Hays et al., Reference Hays, Mortimer, Ierodiaconou and Esteban2014). The Chagos Archipelago is, however, situated at the interface of the south-west Indian Ocean region and the IUCN Marine Turtle Specialist Group-designated north-west Indian Ocean regional management unit (Wallace et al., Reference Wallace, DiMatteo, Hurley, Finkbeiner, Bolten and Chaloupka2010). Evidence of a Chagos/north-west Indian Ocean linkage is therefore expected. Three of eight post-nesting Chagos green turtles migrated to the north-west Indian Ocean sites of Maldives and northern Somalia (Hays et al., Reference Hays, Mortimer, Ierodiaconou and Esteban2014), and the possibility that some immature hawksbill turtles foraging in Chagos have genetic links with the Arabian Peninsula (Mortimer & Broderick, Reference Mortimer, Broderick, Sheppard and Seaward1999) warrants further investigation. Our understanding of marine turtle populations in the wider western Indian Ocean region is improving, and conservation managers need to use these findings to work across international boundaries to protect marine turtles at nesting habitats and foraging sites. Our findings demonstrate the importance of the Chagos Archipelago to nesting turtles at both a regional and global scale. The marine protected area can be expected to help ensure long-term protection of these resources.
Acknowledgements
This work was supported by the Bertarelli Foundation as part of the Bertarelli Programme in Marine Science. We are grateful to C.R.C. Sheppard and members of the 1996 and 2006 Chagos Research Expeditions, both funded by the UK Foreign & Commonwealth Office with contributions from the Fauna & Flora International 100% Fund in 1996, and the U.S. Fish & Wildlife Service Multinational Species Conservation Fund (98210-6-G073) in 2006. The 1999 Diego Garcia survey was implemented in collaboration with Fauna & Flora International, funded by the UK Overseas Territories Programme. The Bertarelli Foundation facilitated the 2016 rapid surveys. Monthly track counts on the Diego Garcia index beach during 2006–2018 were assisted by K. Dunn, K. Corson and many volunteers. Travel and logistical support were provided by a Darwin Initiative Challenge Fund grant (EIDCF008), the UK Department of the Environment Food and Rural Affairs, the UK Foreign & Commonwealth Office, College of Science of Swansea University, and the British Indian Ocean Territory Scientific Advisory Group of the Foreign & Commonwealth Office. The authors acknowledge use of Maptool (seaturtle.org) for production of Fig. 1.
Author contributions
Study design: JAM, NE, GCH; rapid-survey fieldwork: JAM in 1996, 1999, 2006, NE in 2016; design and inception of index beach monthly surveys: JAM; implementation of monthly surveys: ANG; data compilation, analysis and writing: JAM, NE, with contributions from all authors.
Conflicts of interest
None.
Ethical standards
This research abided by the Oryx guidelines on ethical standards, was non-intrusive, and approved by Swansea University Ethics Committee and the British Indian Ocean Territory Administration of the UK Foreign and Commonwealth Office. All necessary permits were obtained for conducting research in British Indian Ocean Territory.


