


1 Introduction
1.1 Intrinsic f0
Intrinsic vowel f0 or vowel pitch (henceforth If0) refers to the tendency of high vowels such as /i/ and /u/ to have a higher fundamental frequency than low vowels such as /a/ and /ɑ/. Associated findings (summarized in e.g. Whalen & Levitt Reference Whalen and Levitt1995) include that neither the front vs. back dimension of the vowel space nor the size of vowel inventory have any significant influence on If0 (but see Van Hoof & Verhoeven Reference Van Hoof and Verhoeven2011). One curious aspect of these findings concerns gender, in that a significant difference was found between male and female speakers, but whether males or females showed greater If0 depended on whether results were reported in semitones (larger If0 for males) or Hz (larger If0 for females). While the semitone result is taken as the valid measure, in their discussion Whalen & Levitt caution that it is based on the mean of several experimental studies and that the lack of individual variability may have exaggerated the effect.
1.2 Tone languages and If0 reduction
A further finding advanced in Whalen & Levitt is an apparent interaction between tone and If0. They report that for nine of the ten tone languages in their survey, ‘If0 disappears’ (1995: 357), i.e. while high tones show If0, low tones did so to a lesser degree or did not show If0 at all. Very little research has directly addressed this question, but the implication is that there is a cline in If0, correlating with f0 height in tone. Tone languages broadly fall into two groups, conventionally labelled ‘register’ and ‘contour’ languages (Pike Reference Pike1947). In register tone languages tones are essentially level in the absence of contextual effects, while in contour tone languages f0 is dynamic, changing across the syllable. Register tone languages mainly occur in Africa and the Americas, while Asian tone languages are almost exclusively of the contour type. A straightforward way of investigating a possible cline in If0 would thus be to study register tone languages where If0 would be expected to be greater for high tones and smaller or non-existent for low tones. It would also be possible to investigate this in contour languages; in this case If0 at the beginning of a falling tone would be higher than at the end, or smaller at the beginning of a rising tone than it its end. This in fact is the case for most of the tone languages included in Whalen & Levitt’s survey, which were contour tone languages.
Few of the studies which report a possible correlation between tone and If0 focus directly on this question. The effect is not as clear cut as the phenomenon of If0 itself and the range of variability found in these studies is large. The one language Whalen & Levitt suggest in their survey that does not show this effect is Kammu, spoken in Laos. Kammu has high and low level tones. Svantessen (Reference Svantesson1988) reports that If0 is greater for the high than the low tone, being 20 Hz on average for high tones and 11.5 Hz for low tones. However, If0 for low tones is well within the range of variability found in other studies. A possible explanation for this anomaly suggested by Whalen & Levitt is that the low tone of Kammu may actually be realized in the mid portion of the speaker’s pitch range.
A number of studies have examined tone in Shanghai Chinese, the most detailed being Zhu (Reference Zhu1999). Zhu investigated If0 in Shanghai Wu Chinese, using citation forms of the five Shanghai tones as produced in multiple repetitions by 11 speakers (six male, five female). Zhu indicates that overall not all speakers individually demonstrated If0 and this was particularly true of male participants. More relevant to the present work is that If0 appears to be reduced in the lower portion of tone 1 (high–low falling) and of tone 3 (low concave). A comparison of tone 2 (mid concave) and tone 3 shows that If0 is larger for tone 2 than tone 3 (as might be expected) in males, but similar in both tones in females. However, If0 remains present throughout the realization of both tones. For the short low–rising tone, tone 5, except at onset, If0 exists throughout the rising contour and increases until offset. That is, a gradient effect is also present.
The question of a correlation between pitch height (tone) and If0 in Mandarin Chinese was addressed directly in Shi & Zhang (Reference Shi and Jialu1986). They note that, ‘the IP [intrinsic pitch, If0] is more marked in the high frequency region of the tonal register than in the lower one’ (1986: 180), and that this is suggestive of an If0 gradient.
Rose (Reference Rose and Abramson1997) investigated Pakphanang, a seven-tone variety of Thai. The two tones of greatest interest to the question of If0 neutralisation in the lower pitch range are tones 1 and 3. Both tones have a rising–falling f0 contour, although tone 1 is described as being a super-high tone often produced in falsetto voice and with the falling portion being more salient. Tone 3 is produced in the lower portion of the pitch range, with a longer and more prominent rise. If0 appears as expected in tones other than these two. However, due to duration differences across vowels ([a] is longer for all tones but tone 5), If0 of tones with substantial f0 movement importantly depends on where f0 is compared across different vowels. Taking this into account, the expected If0 relationship appears to hold. Rose reports that the magnitude of If0 correlates with where in the speaker’s pitch range a given tone occurs; i.e. a gradient effect is observed, as noted for both Mandarin and Shanghai Wu.
Another experimental study (Zee Reference Zee1980) investigated Taiwanese, mainly focusing on a possible interaction of tone and vowel quality. Zee included two tones in the study, i.e. high and low, with the latter described as low falling. Zee reports that If0 correlates with pitch height in the high tone, but not in the low tone.
Connell (Reference Connell2002) presents data on and a discussion of nine African tone languages, including four for which the data are original. Not all the data were specifically designed to investigate If0 and several used just one or two speakers. These included an investigation of Hausa (Pilszczikowa-Chodak Reference Pilszczikowa-Chodak1972), which contrasts high and low tones, but for which the data only allowed comment on high tones. While it was not possible to ascertain whether If0 was neutralized in low tones, it was present in high tones.
Ladefoged (Reference Ladefoged1968) examined Ikiri high, mid, and low tones on /i u/, comparing f0 of these vowels to the mean f0 of a sentence frame. F0 of high-toned /i u/ was on average 5 Hz greater than the surrounding frame, whereas f0 of mid and low-toned /i u/ was 4 Hz greater, a difference of only 1 Hz between high tones on the one hand, and mid and low tones on the other. While Ladefoged’s interest was in testing the tongue-pull hypothesis, and in showing some support for it, at the same time these results show little or no support for the claim that If0 is reduced or neutralized for low tones, or that there is an If0 gradient for tone in Ikiri.
Several studies of Yoruba (Hombert Reference Hombert and Fromkin1978, Laniran Reference Laniran1992, Bakare Reference Bakare and Owolabi1995, Alo Reference Alo1990, allow the assessment of If0 effects, also across a three-way high, mid, low tonal contrast. While there are differences across the studies when f0 values are looked at in Hz, combining and converting the results to semitones (ST), pitch differences of 1.6 ST, 1.1 ST, and 0.8 ST were found for high, mid, and low tones respectively, with an average If0 across tones of 1.2 ST. This confirms the existence of both If0 reduction in the the lower pitch range and of a gradient from high to low.
For Defaka, the study by Shryock, Ladefoged & Williamson (Reference Shryock, Ladefoged and Williamson1996/97) tests for the presence of If0, but only used low-toned vowels. They report a ‘tendency to conform’ (p. 8) but only the difference between /o/ and /a/ is significant. The lack of significance suggests either If0 is reduced in low tones relative to high, mid, or that it simply is not present in the language.
Snider (Reference Snider2001) reports an experimental study of If0 in Chumburung, which has a two-way high–low tone contrast. He finds If0 for both [+ATR] and [−ATR] vowels, but reports no significant differences in f0 across high and low tones, challenging the notion that If0 is reduced in the lower pitch range.
Of the original investigations reported in Connell (Reference Connell2002), for Ibibio (which contrasts high, downstepped high, low), three of the four speakers demonstrated statistically significant If0 with high tones when combined high vowels /i u/ were compared to /a/, with an average difference of 1 ST compared to 0.5 ST; the fourth speaker also showed significant If0 across vowels with the low tone. For Kumana (contrasting high, mid, low tones), Connell reports that all speakers demonstrated If0 with high tones, though beyond that there were differences across speakers with only two of the four speakers showing a significant reduction in If0 for low tones. Overall, If0 was only somewhat reduced for low tones and no strong evidence exists for an If0 gradient by tone: If0 expressed in semitones was 1.1 ST for both high and mid and 0.8 ST for low. For Dschang, which contrasts four tone levels, high, downstepped high, low, downstepped low, the data clearly demonstrate If0. Significant differences in f0 exist between high and low vowels (with one exception) for all speakers on the three higher tones. For the lowest tone, downstepped low, just one of four speakers showed a significant difference. It is difficult, however, to claim a clear gradient effect in Dschang as If0 expressed in semitones for the four tones was 1.3 ST, 1.1 ST, 1.0 ST and 0.5 ST; a considerably larger gap between low and downstepped low than was found between the other three tones. Finally, for Mambila, a statistically significant If0 effect across vowels was reported to be absent, and so too across tones. However, the differences between high and low vowels that do exist, are smallest with low tones, where If0 is expected to be reduced or neutralized.
In summary, it appears that If0 is reduced in low tones or in the lower pitch range, but this finding doesn’t appear to be as consistent as the main effect of If0 itself. It is interesting to note though that the effect appears to be more prominent or to occur more reliably when f0 is continuously modulating, as in contour tones, than when relatively unvarying as in register tones.
Not only tone languages, but all languages employ different pitch ranges to a similar effect, i.e. reduced or disappearing If0 in the lower end of the pitch range should be expected. Whalen & Levitt (Reference Whalen and Levitt1995) discuss this, referencing Ladd & Silverman’s (Reference Ladd and Silverman1984) work on German and Shadle’s (Reference Shadle1985) work on English. However, they draw attention to the importance of taking into account relative frequency as opposed to absolute f0 of a speaker’s range.
From the discussion above, it can be concluded that there is some evidence for If0 reduction in the lower pitch range. It is not clear, however, to what extent If0 reduction is a real effect, or whether it is related to methodological choices made or the type of prosodic system involved. Therefore, the aim of the present study is to investigate If0 reduction in Hamont Dutch, a Belgian Dutch dialect which has variously been described as a tonal or pitch accent variety of Dutch that contrasts two pitch accents which are realized phonologically as pitch contours.
2 The phonetic realisation of tones and vowels in Hamont
This study investigates intrinsic vowel f0 in Hamont, which is a Belgian Limburg dialect of Dutch spoken by approximately 15,000 speakers in the town of Hamont (Verhoeven Reference Verhoeven2007). Many speakers in this area are bi-dialectal in Belgian Standard Dutch (Verhoeven Reference Verhoeven2005) and the Hamont dialect. Although it is our impression that Hamont Dutch in 2022 is still quite strong in everyday social interaction, there is little quantitative information on its use. Veldeke (2021) investigated fluency of the Limburg population in one or more Limburg dialects and (unsurprisingly) it was found that there was a strong correlation with age: in younger speakers between 18–34 years of age, only 52 $\%$
reported fluent command of a Limburg dialect. Highest fluency was found for the age group of 65 and above, with fluency rates above 74
$\%$
reported fluent command of a Limburg dialect. Highest fluency was found for the age group of 65 and above, with fluency rates above 74 $\%$
(Veldeke 2021). Although these figures are not specific to the Hamont dialect, it is reasonable to assume that this general Limburg trend applies to Hamont too.
$\%$
(Veldeke 2021). Although these figures are not specific to the Hamont dialect, it is reasonable to assume that this general Limburg trend applies to Hamont too.
Hamont is situated on the northern edge of the province of Belgian Limburg on the international border between Belgium and the Netherlands. This dialect has a pitch accent distinction similar to many other Limburg dialects in the area such as those of Roermond (Gussenhoven Reference Gussenhoven and Horne2000), Venlo (Gussenhoven & Van der Vliet Reference Gussenhoven and Van der Vliet1998), Maastricht (Gussenhoven & Aarts Reference Gussenhoven and Aarts1999), Hasselt (Peters Reference Peters2006) and Neerpelt (Peters Reference Peters2007). These dialects distinguish between two pitch accents in which f0 differences may differentiate word pairs to signal lexical or grammatical distinctions. In Hamont, the lexical distinction is exemplified by the word pair [hus1] ‘(record) sleeve’ and [huːs2] ‘house’. An example of a grammatical distinction is the plural of certain nouns such as [knin1] ‘rabbits’ vs. [kniːn2] ‘rabbit’. In line with the convention established in the papers on the Limburg pitch accent distinction mentioned above accent 1 is indicated as [1] while accent 2 is transcribed as [2]. It should be emphasized that the pitch accent distinction only applies to a limited set of words in the lexicon and some singular/plural distinctions. In other respects, the Hamont prosodic system is intonational.
Although in several dialects in the Hamont neighbourhood the pitch accent distinction is no longer marked by means of f0 (Schouten & Peeters Reference Schouten and Peeters1996), research reported in Verhoeven (Reference Verhoeven2006) has shown that the Hamont dialect has retained the distinction. Verhoeven investigated the phonetic characteristics of the two accents by having speakers participate in a series of mini-conversations in which they had to insert a target word in a carrier sentence which was read as an answer to a context-setting question. The questions were intended to elicit the target words in different prosodic contexts. The prosodic contexts were [+Focus] and [−Focus] and for both, [+Final] and [−Final] utterance position. Further details are available in Verhoeven (Reference Verhoeven2006).
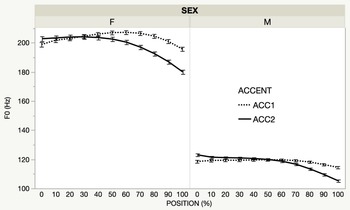
The present study focuses on the context [+Focus, −Final]. The results of f0 measurements of the vowels in target words differing in pitch accent in this context are illustrated in Figure 1. In order to normalize for vowel duration differences between the two pitch accents, f0 was measured at 11 equally spaced points across the vowel. Each point in the f0 traces in Figure 1 is an average of 300 measurements. The contours in Figure 1 indicate that there are clear differences in the dynamics of f0 between accent 1 and accent 2 in the Hamont dialect. For both pitch accents, the f0 course rises to a peak, after which f0 drops, quite dramatically in the case of accent 2, relatively little in accent 1. Both f0 contours are similar in overall shape, only the alignment in the vowel nucleus differs. From figure 1 it also appears that this applies to the contours in both men and women.
Mean f0 course of target vowels of Hamont accent 1 and accent 2 in the context [+Focus, −Final]. The data are separated for female (F) and male (M) speakers. Each datapoint represents the mean of 300 f0 measurements. Standard error bars were constructed using 1 standard error from the mean.

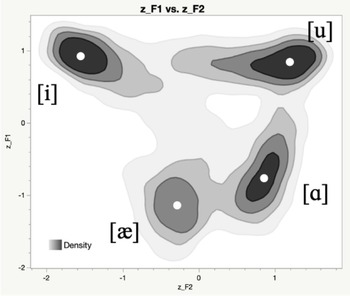
It was mentioned above that the Hamont tones do not only differ in pitch configuration, but also in the duration of the tone-bearing vowel: like in many of the West-Limburg dialects, the vowels in accent 1 (mean durationː 94 ms) are on average 64 ms shorter than in accent 2 (mean durationː 158 ms). As a result it was necessary to measure f0 in different locations of the vowels which were proportionally defined rather than expressed in absolute terms. The spectral characteristics of these vowels are illustrated in Figure 2.
Density chart of the formant values for the high and low vowels in Hamont Dutch. The values are based on recordings of five male and five female speakers. The total number of observations for each vowel is 6,600. The white dots represent the overall mean of the formants. The F1 and F2 values are for the vowels recorded in this experiment. The values were normalized by means of a within subjects Lobanov transformation.

Formant values in the above-mentioned analysis were measuredFootnote 1 in the same 11 sections of the target vowels as f0. If we take F1 as an indication of the degree of vowel opening, it is clear that the high vowels in this study have the same degree of opening: mean F1 in the front and back vowels is identical at 296 Hz. Of the low vowels, [æ] has a mean F1 of 668 Hz and [ɑ] has a mean F1 of 597 Hz. This means that in this study, the difference in the degree of opening in the front vowels is somewhat larger (71 Hz) than in the back vowels.
3 Materials and method
As mentioned previously, the aim of this study is to investigate whether the magnitude of If0 in Hamont Dutch correlates with f0 range in the two pitch accents. This is approached in two steps. First the general If0 characteristics of Hamont Dutch are investigated in order to ascertain whether If0 exists and whether it behaves according to expectations. We then directly investigate the relation between If0 and f0. The speech data for the study were collected by involving 10 speakers in a production task in which they were asked to repeat an aurally presented list of monosyllabic words by embedding them in a carrier phrase which placed the target word in non-final focus position.
3.1 Selection of target words
All target words were meaningful monosyllables from the Hamont dialect. In total there were two sets of 20 word pairs. The first set consisted of 20 (near-)minimal pairs differing in the degree of opening of the front vowels: they contrasted the highest unrounded front vowel in the Hamont system [i] with the lowest unrounded front vowel [æ]. Within this set, 10 word pairs had accent 1, while 10 word pairs carried accent 2. Thus, minimal pairs were obtained such as [li1p] ‘ran’ vs. [læ1p] ‘cloths’ and [viː2ʀ] ‘four’ vs. [væː2ʀ] ‘far’.
The second set consisted of 20 (near-)minimal pairs differing in the degree of opening of the back vowels: they contrasted the highest rounded back vowel [u] with the lowest unrounded back vowel [ɑ]. Within this set 10 word pairs had accent 1, while the remaining 10 pairs had accent 2. This gave rise to (near-)minimal pairs like [plu1x] ‘plough’ vs. [vlɑ1x] ‘flag’ and [vuː2l] ‘dirty’ vs. [vɑː2ls] ‘dishonest’. It is important to emphasize that all the vowels in the target words were monophthongs. The target words and their English glosses are given in the appendix.
3.2 Participants
The participants were 10 native speakers of the Hamont dialect, five male and five female, ranging in age between 50 and 85, with an average age of 70.5. All participants were born and raised in Hamont and they used the dialect in most of their daily social encounters as well as at home. Although participants were not instrumentally assessed for hearing impairment, they did not report hearing problems and they did not have any difficulties in hearing/understanding the instructions. Although it cannot be excluded that some of the participants may have suffered from mild age-related hearing loss, such loss is normally found in the upper part of the frequency range, so the effect on vowel perception and production should be minimal in the range up to 5,000 Hz.
3.3 Procedure
One problem in eliciting natural pronunciations of the target words was that the Hamont dialect does not have a standardized orthography: as a result it was not possible to use a reading task. Therefore, it was decided to have informants participate in a repetition task in which the target words were auditorily presented to them; each word was followed by the question [wɑ hɛt i ɣəzɛɪt] ‘What did he say?’. Informants were asked to answer the question, thus repeating each target word as part of the carrier phrase [hɛj hɛt __ ɣəzɛɪt], literally, ‘He has ___ said’. This time lapse and intervening speech was intended to ensure that direct comparison and imitation were effectively ruled out. In terms of prosodic context, the target words were placed in non-final focus position. Non-final position was preferred over utterance final position in order to avoid possible truncation of the f0 contour and creak associated with low pitch, as well as a possible final lowering effect.
The target words presented to the participants were recorded on an earlier occasion by a male native speaker of the Hamont dialect. The context-setting question was read by a female native speaker of the dialect.
Recordings were digitized at a sampling rate of 44,100 Hz and were played back one by one in iTunes on a Macintosh PowerBookG4 via good quality external loudspeakers. The speaker who provided the auditory stimuli did not participate in the repetition task itself and his speech was excluded from any analyses in this paper. The target words were randomized in three different lists. Each list started and ended with five fillers to avoid beginning and end-of-list effects. All recordings in the repetition task were made in the same quiet room without any disturbing background noise. The recording equipment consisted of a Marantz PC-card recorder (Model PMD 690) and an AKG head mounted microphone (CL444).
3.4 Analysis procedures
In order to measure f0, F1 and F2, the utterances with the vowels of the target words were displayed on a broadband spectrogram in Praat (Boersma & Weeninck Reference Boersma and Weeninck2006) and the target vowels were identified by an experienced phonetician on the basis of visual inspection of the waveform and the spectrogram. Measuring vowel f0 can be done in different ways. One option is to make a single measurement at a specific location in the vowel. This point can be the middle portion of the vowel, where it can be assumed that any effects of preceding obstruents on f0 are minimal. The measuring point has also been taken as the point with maximal intensity (Ladd & Silverman Reference Ladd and Silverman1984), a point two/thirds in time from vowel onset (Fischer-Jørgensen Reference Fischer-Jørgensen1990) or an f0 plateau, maximum, or minimum associated with the realisation of a specific phonological tonal target (Connell Reference Connell2002). The latter has provided reliable results for register tone languages. Since the production of the pitch accents investigated in this study, like contour tones, involves dynamic pitch, it was decided to determine 11 measurement points in each vowel whereby each point was defined as a fixed percentage of the total vowel duration (ranging from 0 $\%$
to 100
$\%$
to 100 $\%$
). Such a proportional approach was necessary since there are considerable length differences between the vowels with accent 1 and those with accent 2 (as mentioned, accent 2 vowels are on average 65 ms longer than those with accent 1). Moreover, this approach also normalizes for differences in speaking rate across speakers.
$\%$
). Such a proportional approach was necessary since there are considerable length differences between the vowels with accent 1 and those with accent 2 (as mentioned, accent 2 vowels are on average 65 ms longer than those with accent 1). Moreover, this approach also normalizes for differences in speaking rate across speakers.
After selecting a vowel, the acoustic measurements were carried out by running a Praat script which measured total vowel duration as well as f0, F1 and F2 at 0 $\%$
, 10
$\%$
, 10 $\%$
, 20
$\%$
, 20 $\%$
, 30
$\%$
, 30 $\%$
, 40
$\%$
, 40 $\%$
, 50
$\%$
, 50 $\%$
, 60
$\%$
, 60 $\%$
, 70
$\%$
, 70 $\%$
, 80
$\%$
, 80 $\%$
, 90
$\%$
, 90 $\%$
and 100
$\%$
and 100 $\%$
of the total vowel duration. F0 was determined by means of the autocorrelation algorithm in Praat according to the following analysis conditionsː Time step (automatic), Pitch floor = 60 Hz (men) or 100 Hz (women), Maximum number of candidates = 15, Silence threshold = 0.03, Voicing threshold = 0.45, Octave cost = 0.01, Octave-jump cost = 0.35, Voiced/unvoiced cost = 0.14, Pitch ceiling (Hz) = 200 Hz (men) or 300 Hz (women). In order to ensure the reliability of the obtained f0 measurements, the pitch contours of all the recorded utterances were inspected visually for all speakers during the measurement process by displaying the pitch contours on the spectrograms in Praat. It was found that all the pitch contours were within the specified range and that there were no octave jumps in the contours associated with the target words. However, it should be mentioned that in a small number of instances the pitch tracking algorithm was not able to determine the f0 and returned an ‘undefined’ value. This was the case in 259 cases out of 26,400. This typically happened in segmental transitions from a voiceless prevocalic consonant to the vowel nucleus. These instances were included in the (statistical) analyses as missing values.
$\%$
of the total vowel duration. F0 was determined by means of the autocorrelation algorithm in Praat according to the following analysis conditionsː Time step (automatic), Pitch floor = 60 Hz (men) or 100 Hz (women), Maximum number of candidates = 15, Silence threshold = 0.03, Voicing threshold = 0.45, Octave cost = 0.01, Octave-jump cost = 0.35, Voiced/unvoiced cost = 0.14, Pitch ceiling (Hz) = 200 Hz (men) or 300 Hz (women). In order to ensure the reliability of the obtained f0 measurements, the pitch contours of all the recorded utterances were inspected visually for all speakers during the measurement process by displaying the pitch contours on the spectrograms in Praat. It was found that all the pitch contours were within the specified range and that there were no octave jumps in the contours associated with the target words. However, it should be mentioned that in a small number of instances the pitch tracking algorithm was not able to determine the f0 and returned an ‘undefined’ value. This was the case in 259 cases out of 26,400. This typically happened in segmental transitions from a voiceless prevocalic consonant to the vowel nucleus. These instances were included in the (statistical) analyses as missing values.
A total of 26,400 observations were obtained: 80 target words × 3 repetitions of each word × 11 measurement points × 10 speakers.
Statistical tests were carried out by means of JMP (2022) and consisted of analyses of variance and contrast tests to compare f0 values for the high and low vowels in the two tones. The primary claim for If0 involves high vs. low vowels and secondarily front vs. back vowels. These are the first comparisons. Then If0 is assessed in terms of the variable of gender. These analyses were intended to establish the basic characteristics of If0 in Hamont. Then a possible effect of pitch accent was tested, i.e. whether there is an overall If0 difference between the two pitch accents. Finally, it was investigated whether there is a relationship between If0 and pitch range.
4 Results
4.1 Basic facts of If0 in Hamont Dutch
4.1.1 F0 of high and low vowels
Before considering the specific question of whether there is a correlation between pitch range and If0, the basic facts of If0 in Hamont were established to ascertain that it exists as has been found in other languages. These characteristics are briefly summarized here. It is well known that the essence of intrinsic vowel f0 is that high vowels have a higher f0 than low vowels. In the present analysis of If0 we have been guided by the principles and analysis conditions laid out in Whalen & Levitt (Reference Whalen and Levitt1995) in order to be able to meaningfully compare the present results for Hamont with previous research. This means that in the statistical analysis we have taken f0 as the dependent variable. One analysis used f0 as expressed on an Hz scale, the other used f0 expressed on a semi-tone scale.
Table 1 compares the f0 values for the high vowels [i u] (H) to those for low the vowels [æ ɑ] (L) expressed in both Hertz and semitones.
F0 means for the effect of vowel height. If0 is the f0 difference between high (H) and low (L) vowels. The semitones (ST) have been calculated with 1 Hz as a reference value.

The first statistical analysis that was carried out was an analysis of variance with f0 (measured in Hz) as the dependent variable and vowel height (high vs. low), sex (male vs. female), accent (accent 1 vs. accent 2) and vowel dimension (front vs. back) as the independent variables. The analysis was a full factorial design with all the interactions between the main effects included. Before statistical analysis the f0 data for the vowels in the target words had been averaged across repetitions and measurement points. This means that each speaker was represented by 80 f0 values in the analysis.
The analysis of variance showed a significant effect of vowel height (F(1,79) = 23.9650, p < .0001) and sex (F(1,79) = 500.7614, p < .0001) only. The effects of accent and vowel dimension were not significant, nor were any of the interactions. The fact that there is a significant effect of vowel height on f0 confirms that If0 is a feature of Hamont Dutch.
If0 means for male (M) and female (F) speakers.

4.1.2 If0 and gender
The meta-analysis of Whalen & Levitt (Reference Whalen and Levitt1995) suggests a difference in If0 between male and female speakers, both when If0 is expressed on a Hz scale or on a semitone scale. On a Hz scale, If0 was somewhat larger for females (15.4 Hz) than for males (13.9 Hz), whereas on a semitone scale the opposite was true: males had a larger If0 (1.84 ST) than females (1.34 ST). While they do not say whether this finding was significant, they do point out that it should be treated with caution. Therefore, the present study also investigated the relationship between If0 and gender. For the purpose of quantification, If0 was defined in this study as the f0 difference between a high vowel and its corresponding low vowel in a minimal pair of target words. If0 was expressed in Hz and in semi-tones and the results from these measurements are summarized in Table 2.
In order to analyse a possible relationship between If0 and the independent variables, an analysis of variance was carried out with sex (male vs. female), accent (accent 1 vs. accent 2) and vowel dimension (front vs. back) as the independent variables and with If0 expressed in Hz as the dependent variable. The analysis was a full factorial design with all the interactions between the main effects included. Before statistical analysis the f0 difference in Hz between the high vowel and the low vowel in each pair of target words was calculated (If0). This means that each speaker was represented by 40 If0 values in the analysis. This analysis revealed a significant effect of sex on If0 (1, 39) = 2,9749; p < .0014). The other variables in the analysis were not significant.
A similar analysis of variance was carried out, but this time with If0 expressed on a semi-tone scale as the dependent variable. In this analysis, none of the variables was significant, nor were any of the interactions.
4.2 If0 and fundamental frequency
Having confirmed that If0 exists in Hamont Dutch and conforms to the main characteristics observed in other languages, it was examined whether there is an influence on If0 related to accent. If0 values for accent 1 and accent 2 are presented in Table 3 in both Hz and ST, averaged across the whole vowel of the accents for all speakers.
If0 means for accent 1 and accent 2.

These values confirm, first, that If0 is present in both accents. This finding is expected, since If0 was earlier found to exist in the language. However, it is interesting that a comparison of If0 in the two accents indicates that it is smaller in accent 2 on both a Hz and semitone scale. Although these differences did not come out significant in the Anovas reported earlier, recalling from Figure 1 that overall accent 2 is lower in the pitch range than accent 1, may be seen as a first indication that If0 follows the trend attested in some other languages to be reduced in the lower pitch range.
4.3 The relationship between If0 and f0
This section turns to the main aim of this study, i.e. to test the hypothesis that If0 is neutralized or reduced in the lower pitch range of speakers. Stating this more generally in statistical terms, this asks whether f0 predicts If0. To test this, the relation between f0 and If0 was plotted against the different measurement points in the vowel as a function of the two accents. Male and female speakers are presented separately in Figure 3 and Figure 4. In each, the f0 curve is in the lower panel of the figure and the If0 plot in the upper panel. The relation between f0 and If0 for each accent can be seen by comparing the curves in both panels.
F0 and If0 as a function of position in the two accents for the men. Standard error bars were constructed using 1 standard error from the mean.

F0 and If0 as a function of position in the two accents for the women. Standard error bars were constructed using 1 standard error from the mean.

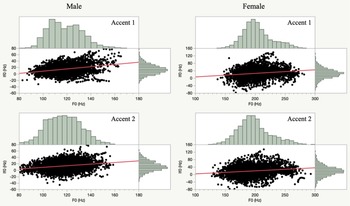
These comparisons suggest a good correlation between f0 and If0 in the general shape of the curves. In order to investigate this more formally, the data were split up for accent 1 and accent 2 for both male and female speakers. For the four combinations, a bivariate fit was carried out to test whether f0 (in Hz) significantly predicted If0 (in Hz). If0 in the regression analysis was defined as the f0 difference between a high and a low vowel in a minimal pair. f0 was entered as the mean f0 in the high and low vowel of the minimal pair. The results are summarized in Figure 5.
Regression lines showing a positive correlation between f0 and If0 for accent 1 (top) and accent 2 (bottom) in the male and female speakers.

For the male speakers, the fitted regression model for accent 1 was: $\textrm{If}0 = -26.68923 + 0.3495692$
* f0. The overall regression was statistically significant (R2 = 0.0933, F(1,3212) = 330,5181, p < .0001)Footnote 2. For accent 2, the fitted regression model was: If0 = −16.48116 + 0.2517072 * f0. The overall regression was also statistically significant (R2 = 0.054924, F(1,3244) = 188.5277, p < .0001).
$\textrm{If}0 = -26.68923 + 0.3495692$
* f0. The overall regression was statistically significant (R2 = 0.0933, F(1,3212) = 330,5181, p < .0001)Footnote 2. For accent 2, the fitted regression model was: If0 = −16.48116 + 0.2517072 * f0. The overall regression was also statistically significant (R2 = 0.054924, F(1,3244) = 188.5277, p < .0001).
For the female speakers, the fitted regression model for accent 1 was: If0 = −12.94064 + 0.1907677 * f0 and this was significant (R2 = 0.026421, F(1,3222) = 87.4373, p < .0001). The fitted regression model for accent 2 was: If0 = −13.60253 + 0.1631556 * f0, which was also significant (R2 = 0.02355, F(1,3255) = 78.5028, p < .0001).
On the basis of these analyses, it can be concluded that f0 significantly predicts If0: lower levels of f0 are associated with lower levels of If0 and higher levels of If0 correlate with higher levels of If0: If0 is thus reduced in the lower f0 range.
5 Discussion
5.1 If0 in Hamont Dutch and other languages
The main objective of this paper was to investigate whether If0 is reduced in the lower pitch range. This was investigated in Hamont Dutch, a Limburg variety of Belgian Dutch which has two contrastive pitch accents (Verhoeven Reference Verhoeven2007). Before investigating whether If0 undergoes a reduction in the lower portion of the pitch range of Hamont Dutch speakers, it was first tested whether If0 occurs in the language just as it does in other languages. This proved to be the case: the observed difference in f0 between high and low vowels of 18.11 Hz, or 1.94 ST, was found to be statistically significant. These values are somewhat larger than the means calculated by Whalen & Levitt (Reference Whalen and Levitt1995), 15.3 Hz, or 1.65 ST, in their meta-study of 31 languages, and considerably larger than the mean of 0.8 ST across four tone languages in Connell (Reference Connell2002), or 0.9 ST when the other languages reviewed in that study for which sufficient comparable data were available were included. The If0 range in Whalen & Levitt’s survey goes from 0.11 ST (‘Chinese’, male speaker) to 3.07 ST (Hindi, female speaker). Among the languages included, there are quite a number that have average values close to those of the present study, notably Standard Dutch, at 1.79 ST (17.33 Hz). We also calculated the average If0 for contour tone languages in Whalen & Levitt’s survey as opposed to register tone languages, with results of 1.14 ST and 0.86 ST, respectively. So whereas If0 in tone languages appears reduced compared to that of non-tone languages, in Hamont it is slightly larger than the average for non-tone languages; from a general perspective, then, it can be observed that the Hamont dialect patterns more like non-tone languages with its If0 of 1.94 ST.
The fact that Hamont patterns more like non-tone languages, despite maintaining a pitch accent contrast, is interesting. While we do not have an entirely satisfactory explanation for this difference, we do note that If0 values in Hamont are similar to those reported for Standard Dutch (Koopmans-Van Beinum Reference Koopmans-Van Beinum1980: 2.26 ST; Van Hoof & Verhoeven Reference Van Hoof and Verhoeven2011: 2.28 ST), which is a second language for all of the participants in this study.
It also deserves mention that not all the tone languages in Whalen & Levitt’s survey showed lower mean If0ː in particular, the studies of Chinese – a contour tone language – showed a relatively large If0, though typically only in the higher pitch range.
5.2 Differences in If0 as a function of vowel backness
In all previous studies of If0 no significant differences have been reported in If0 according to frontness or backness of vowels. The results reported in Section 4.1 showed no significant f0 according to backness. There was only a very small, non-significant, difference in average f0 between [i] and [u], with the f0 of [u] being slightly higher. Whalen & Levitt (Reference Whalen and Levitt1995) also report differences between high front and back vowels [i] and [u] (e.g. in English and German), and like the findings in the present study these are always non-significant. The difference in average f0 between [æ] and [ɑ], however, amounted to 0.30 ST, with the back vowel being the higher of the two, and this difference is statistically significant. This is in contrast to Chen, Whalen & Tiede (Reference Chen, Whalen and Tiede2021), which compares f0 in [æ] and [ɑ]ː however, a direct comparison with this paper is not possible since the relationship between [æ] and [ɑ] in English is different than in Hamont, i.e. the front vowel is higher than the back vowel in English (Hillenbrand, Getty, Clark & Wheeler Reference Hillenbrand, Getty, Clark and Wheeler1995) while it is lower in our Hamont data (Figure 2). Generally, it can thus be said that the average f0 in back vowels is slightly higher than that of front vowels with the same degree of opening.
Other studies also seem not to have systematically compared If0 (i.e. as opposed to mean f0) in front vowels to that found in back vowels. In this study we found a small but non-significant difference between the front and back dimension: average If0 for front vowels was 2.03 ST, while the back vowels had a mean If0 of 1.87 ST. This slight difference may be due to the fact that the distance between [i] and [æ] is slightly greater than that between [u] and [ɑ] as reflected in the spectrographic analysis of these vowels (recall Figure 2): F1 in [æ] is 71 Hz higher than in [ɑ], which indicates that it is more open.
In contrast to this, a separate study comparing vowels of Standard Dutch with those of Arabic (Van Hoof & Verhoeven Reference Van Hoof and Verhoeven2011), shows differences in If0 between front and back vowels in Dutch that are significant for both male and female speakers, with greater If0 being demonstrated in the back vowels (male: front = 2.59 ST, back = 3.06 ST; female: front = 2.54 ST, back = 3.01 ST). This, then would seem to be an aspect of If0 which would bear further inspection from the perspective introduced here, i.e. comparing If0 in front vowels to that in back vowels, rather than mean f0 of front and back vowels.
5.3 If0 and gender
The present study revealed no significant difference in If0 between male and female participants on a semitone scale, though average If0 is a little larger in men than in women (2.05 ST vs. 1.89 ST). Whalen & Levitt, however, draw attention to a difference between males and females overall in their survey, an If0 of 1.84 ST for males and 1.34 ST for females. While the If0 measurements for males and females are noticeably larger in the present study, they are in keeping with the mean If0 value reported above in Section 4.1, and the difference between males and females here (0.16 ST) is somewhat smaller than the one reported in the Whalen & Levitt meta-study (0.4 ST). In neither case is the difference significant and it is noted that the individual studies survey in Whalen & Levitt (Reference Whalen and Levitt1995), using a large number of subjects, revealed a sizable cross-gender difference, in this case females over male, but reported in Hz. In contrast Peterson & Barney (Reference Peterson and Barney1952), also a relatively large study, showed little difference between males and females (again, in terms of Hz). The present results are based on fewer speakers, but show a similar trend (larger If0 for males). Connell’s (Reference Connell2002) results for Ibibio support this, as do Van Hoof & Verhoeven (Reference Van Hoof and Verhoeven2011) for both Dutch and Arabic. This confirms that there is effectively no difference in If0 between males and females.
5.4 If0 and f0 range
The main objective of this paper was to investigate the potential relationship between f0 range and If0. The results indicate that there is a significant positive correlation between f0 and If0: lower f0 is associated with smaller If0 values and higher f0 is associated with bigger If0. This correlation applies to both accents and is seen in both men and women, so it can be regarded as a consistent effect. To put this more concretely into figures, this relationship means for example that If0 amounts 7 Hz at f0 = 82 Hz, 12 Hz at f0 = 126 Hz, 18 Hz at f0 = 150 Hz, 19 Hz at f0 = 173 Hz, 27 Hz at f0 = 223 Hz and 33 Hz at f0 = 271 Hz. This is clearly illustrative of the positive correlation between f0 range and If0.
In terms of the reduction of If0 as a function of pitch range, it can be concluded that Hamont Dutch fits neatly with the contour tone languages which were discussed in the introduction. This finding of a gradient effect in If0 associated with f0 range is consistent with the literature discussed in Section 1, which indicates that this association exists in contour tone languages but less strongly in register tone languages. All the investigated contour tone languages (Mandarin, Shanghai Wu, and Thai) show a gradient effect of If0 across the pitch range. Zee’s (Reference Zee1980) study of Taiwanese, shows reduced If0 in the low tone relative to the high, but since only these two tones are examined the evidence regarding a gradient effect across the pitch range is inconclusive.
Among the register tone languages examined, only Yoruba showed a progressive reduction in If0 across its high, mid and low tones. For Ibibio, the effect was true of high compared to low for three of the four speakers, though with just two tones, it is not possible to comment on the presence of a gradient effect. For Ikiri (high, mid, low) there is no gradient from high to low, indeed If0, if it can be said to exist at all, is severely reduced. Both Kunama (high, mid, low) and Dschang (high, downstepped high, low, downstepped low) showed reduced If0 in the lowest tone, but without a gradient effect across the pitch range. Results for Hausa (high, low) and Defaka, (high, low) are inconclusive, while Chumburung showed no If0 reduction across its two tones, high, low. Finally, Mambila showed a tendency for a reduced effect with the low tone, though this was not significantː If0 generally was found to be non-significant in this language.
The question arises then, why should this difference in If0 reduction exist between contour tone and register tone languages. One possibility would be that in a language like Kunama, where high and mid tones showed similar If0 compared to low, the mid tone is realized in the upper part of the pitch range, whereas in Yoruba the three tones may be equally spaced. Data are not available to permit comment on the spacing of the tones in Yoruba, but Connell’s (Reference Connell2002) data do allow comment on the spacing of Kunama tones, and mid actually is realized much closer to low than to high for all speakers.
In trying to understand the apparent difference between contour and register tones, we might also speculate on differences in production resulting from the experimental setting. Contour tones are obviously produced with continuously varying f0, while register tones are not, and to some extent, at least, deliberately not, depending on the specific experimental task. Ways to explore this would be to include test items which feature compound tones, e.g. in Ibibio falling and rising tones which phonologically are combinations of high+low and low+high. Yet another possibility would be to examine If0 across stretches of speech that systematically include downstepped high tones giving the well-known terracing effect associated with downstepping in register tone languages. Ultimately, exploring If0 in spontaneous speech, with its well-known difficulties, may lead to insight into this apparent If0 difference between contour and register tones.
Finally, it should be mentioned that If0 reduction has not only been reported in tone languages and pitch accent languages, but also in languages like English (Shadle Reference Shadle1985 and German (Ladd & Silverman Reference Ladd and Silverman1984). Ladd & Silverman (Reference Ladd and Silverman1984) report that If0 is smaller in a low-pitch prosodic environment.
From the above, it can be concluded that the phenomenon of If0 reduction in the lower pitch range in Hamont Dutch as a pitch accent language is similar to what is observed in contour tone languages that have been examined for this. In addition, there are indications that a similar tendency exists in register tone languages and intonation languages. Although the cause of progressive reduction of If0 is not entirely clear, its wide distribution across prosodic systems seems to point towards a universal tendency that has largely been ignored in studies on If0 and that may well deserve more systematic attention.
6 Conclusion
In this study we investigated intrinsic vowel pitch in the Belgian Limburg dialect of Hamont, which has a lexical tone distinction between accent 1 and accent 2. The specific realisation of each tone depends on prosodic context; in the particular context examined here (+Focus, –Final), accent 1 and accent 2 have different pitch configurations.
Four vowels in Hamont were examined to establish the facts of If0 in this Dutch dialect, two high ([i u]) and two low ([æ ɑ]). The results of this study show that Hamont follows the main trends seen in other languages with respect to the presence of If0. Reliable f0 differences were found between high and low vowels, establishing that If0 exists in this language. No statistical difference was found between front and back vowels, also confirming previous studies, though unlike earlier work we compared If0 (rather than mean f0s) of front vowels to that of back vowels. This analysis has not been available to most other studies as these have typically included only one low vowel, thus not permitting a front pairing vs. back pairing. Though nonsignificant, our results did show a tendency for a larger If0 in front vowels. Also in agreement with previous studies, we found a tendency for males to have larger If0 than females, though the difference between male and female participants was not significant.
The primary aim of this work was to investigate previous suggestions of a correlation between If0 and pitch range. The results of the present study found support for this claim, as If0 was significantly correlated with f0: If0 values were not only significantly smaller in the lower pitch range than in the higher pitch range but If0 decreases as f0 decreases. This finding is consistent with previous research on tone languages and non-tonal languages and may point towards a universal that cuts across different ways in which prosodic systems are organised.
Acknowledgements
This work was carried out in the context of the International Francqui Professorship 2021–2022, promoted by Jo Verhoeven and awarded to Bruce Connell at Antwerp University. The authors are grateful to the Francqui Foundation for their support. We would also like to thank the reviewers for their suggestions and comments, and the informants from Hamont for their participation.
Appendix. Target words in the Hamont dialect used for recording the speech samples


 Open access