

I. INTRODUCTION
During the last few years, the echo reduction in antenna measurements has been an important issue to validate the antenna measurements. This echo reduction is mostly achieved by improving the environment conditions (e.g. taking the measurement in an anechoic chamber). As sometimes fully anechoic conditions are not available, different techniques are applied to obtain the correct radiation patterns by removing or compensating the undesired effects.
The number of approaches to analyze and cancel the effects of unwanted contributions has increased in recent years. Methods such as time domain characterization, frequency decomposition, and compensation techniques have been employed and studied [Reference Clouston, Langsford and Evans1–Reference Adve, Sarkar, Pereira-Filho and Rao8]. Other techniques consist in spatial filtering or diagnostic techniques [Reference Gregson, Newell and Hindman9–Reference Foged18]. Last but not least, time-gating techniques are employed to remove reflected contributions. Time-domain transforms such as Fourier transform (FT) and inverse FT (IFT) are used to separate the direct signal from the echoes [Reference Young, Svoboda and Burnside19–Reference Aubin, Winebrand, Soerens and Vinogradov21].
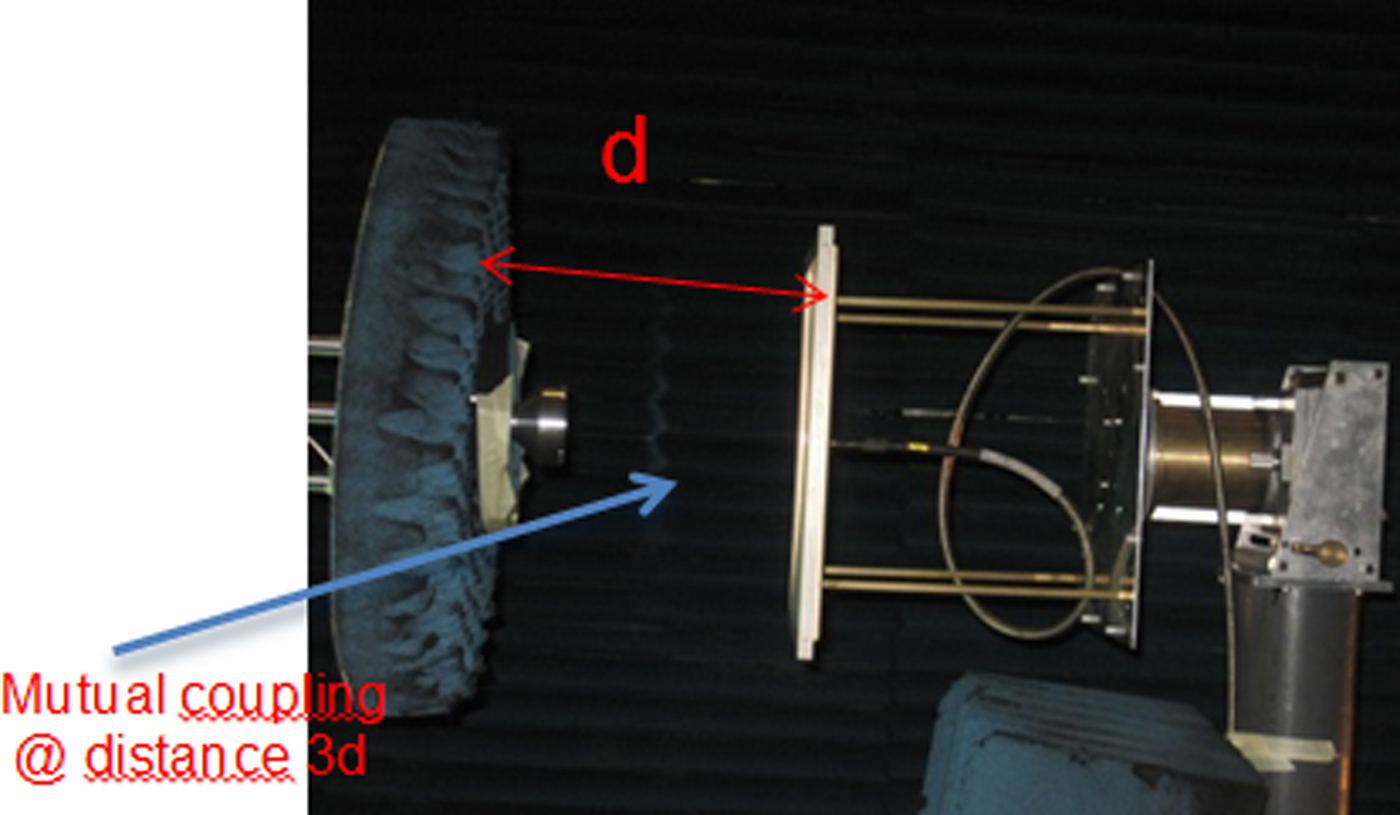
In this paper, two efficient echo reduction techniques (time gating and Matrix Pencil) are used and compared. In Section II, we provide a theoretical introduction of the methods and carry out and compare some simulations. The simulations show aliasing due to the mutual couplings existing between a metallic Antenna Under Test (AUT) and the probe (Fig. 1), which could not be separated using spatial filtering because all the reflections are originated in the same direction. In Section III, a practical implementation is presented using both methods in different setups, filtering out diverse echoes, such as environment reflections. To conclude, in Section IV, we present some conclusions and final remarks.
Mutual coupling effect.
II. FFT AND MATRIX PENCIL METHODS
A) Theoretical introduction to the methods
The first approach we are presenting is the use of a fast Fourier transform (FFT) to pass from the frequency domain to the time domain. First, the samples measured at different frequencies are transformed to the time domain, via an inverse FFT. The echoes are then effectively filtered out in the time domain, and finally a new FFT is applied to reconstruct the field [Reference Aubin, Winebrand, Soerens and Vinogradov21–Reference González-Blanco and Sierra-Castañer25]. The time filtering principle is shown in Fig. 2.
FFT time filtering.
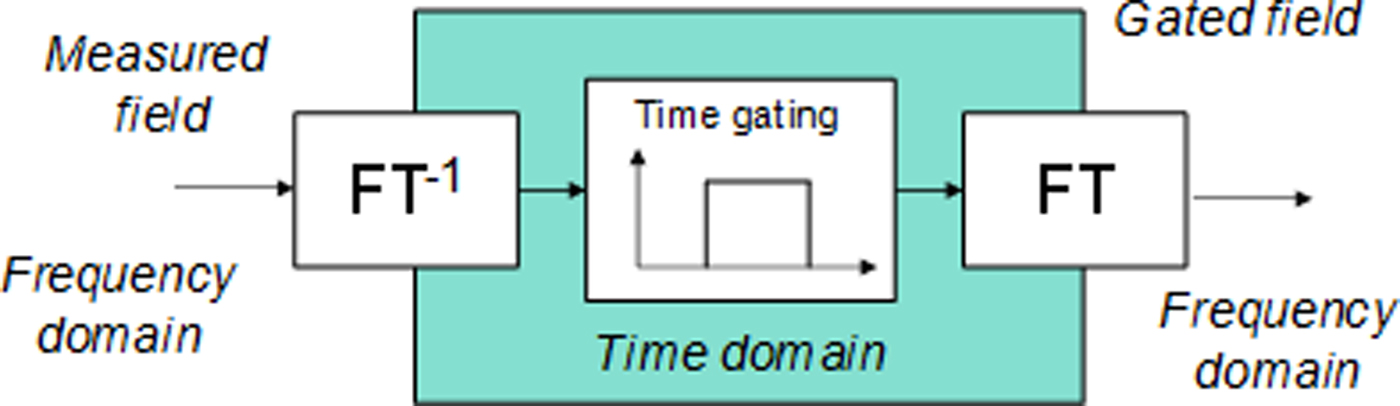
This method requires a multifrequency measurement. The main drawback is that the fast algorithms used to compute the FT and IFT need a constant frequency step. Thus, when there are high-frequency regions where the field varies quickly, a small step has to be employed throughout the entire bandwidth to obtain a good characterization in those regions. This drawback can make the measurement time increase considerably.
A second approach for time filtering is based on the Matrix Pencil algorithm. The Matrix Pencil is a linear method to approach the problem of finding the best estimates of a signal from the noise-contaminated data. This method works quite well both with uniform and non-uniform frequency samples [Reference Sarkar, Nebat, Weiner and Jain5–Reference Adve, Sarkar, Pereira-Filho and Rao8, Reference Loredo, Pino, Las-Heras and Sarkar22, Reference Fourestié, Altman, Wiart and Azoulay26]. The measured field is represented as a sum of complex exponentials multiplied by a residue. The Matrix Pencil gives the sharp values for the parameters of the problem: M (the number of exponentials), R i (residues), and z i (exponential factors). These complex exponentials can be directly related to the different contributions of the signal measured at the probe (direct, reflected, and diffracted components):
 $$y(kT_s) = x(kT_s) + n(kT_s) \approx \mathop \sum \limits_{i = 1}^M R_i\!\cdot\! z^k + n(t),$$
where z i = esiTs = e(−αi+jωi)Ti for i = 1, 2… M.
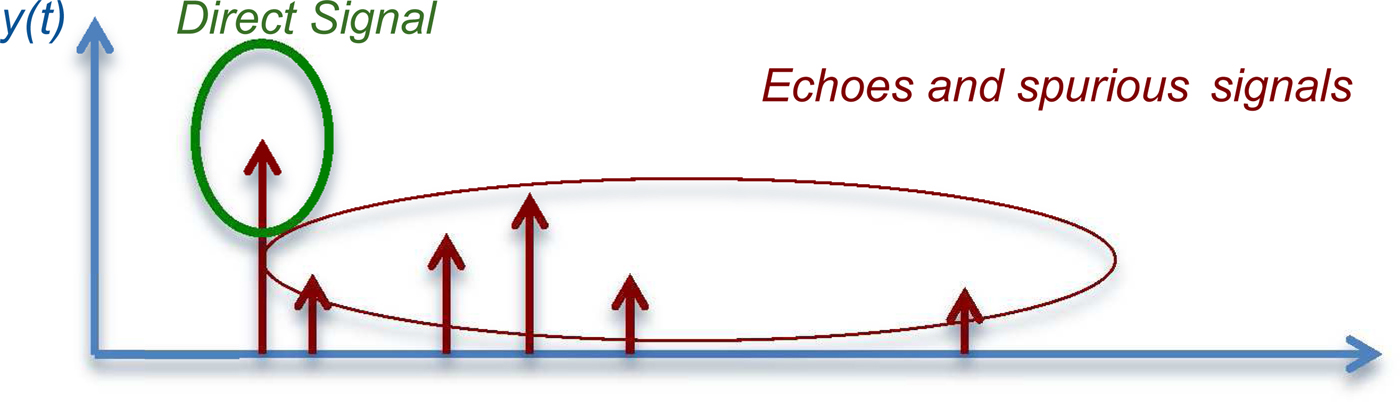
Once the measured signal is fitted as a combination of exponentials, the next step is to determine which term corresponds to the direct contribution, so the other contributions (reflections and diffractions) can be removed from the measured data, as shown in Fig. 3.
Echoes to be suppressed with Matrix Pencil method.
B) Effect of aliasing
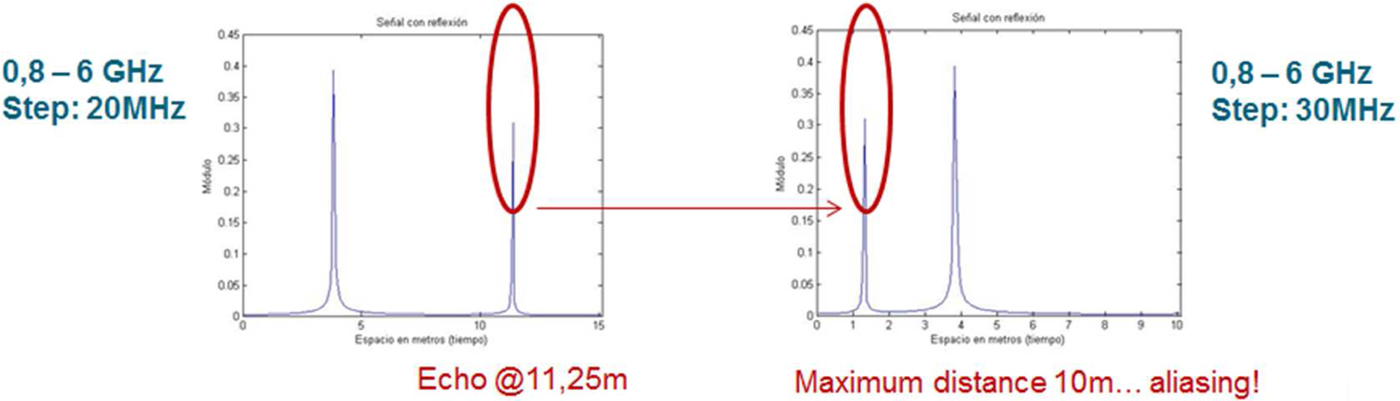
While simulating a signal and its echo, there will be a maximal distance at which the peaks coming from direct and reflected ray can be detected. This distance depends on the total bandwidth and the number of samples. This maximal distance is bounded by c·Δt·N, N being the number of samples. If the bandwidth (BW) is very narrow, the different echoes cannot be distinguished, since Δt = 1/BW; if the signal or the echoes are present at a greater distance, they will be received in the next sweep, presenting an aliasing effect. Hence, for the simulation, the number of samples must be appropriately chosen in order to avoid aliasing.
Next we present a simulation in the range from 0.8 to 6 GHz, where the distance between the AUT and the probe has been set, so that the signal appears at 3.75 m and the echo at 11.25 m as shown in Fig. 4. As c*Δt*N > 3*dist and Δf < c/(3*dist), taking dist = 3.75, Δf should be at most 26.67 MHz.
Simulated signal and echo.

As discussed above, a minimal step of 26.67 MHz is needed to avoid aliasing. This can be seen in the first simulation in Fig. 5. The echo appears correctly taking a step of 20 MHz. However, choosing 30 MHz, the echo appears in the next sweep.
Aliasing.
C) Comparison between FFT and Matrix Pencil method
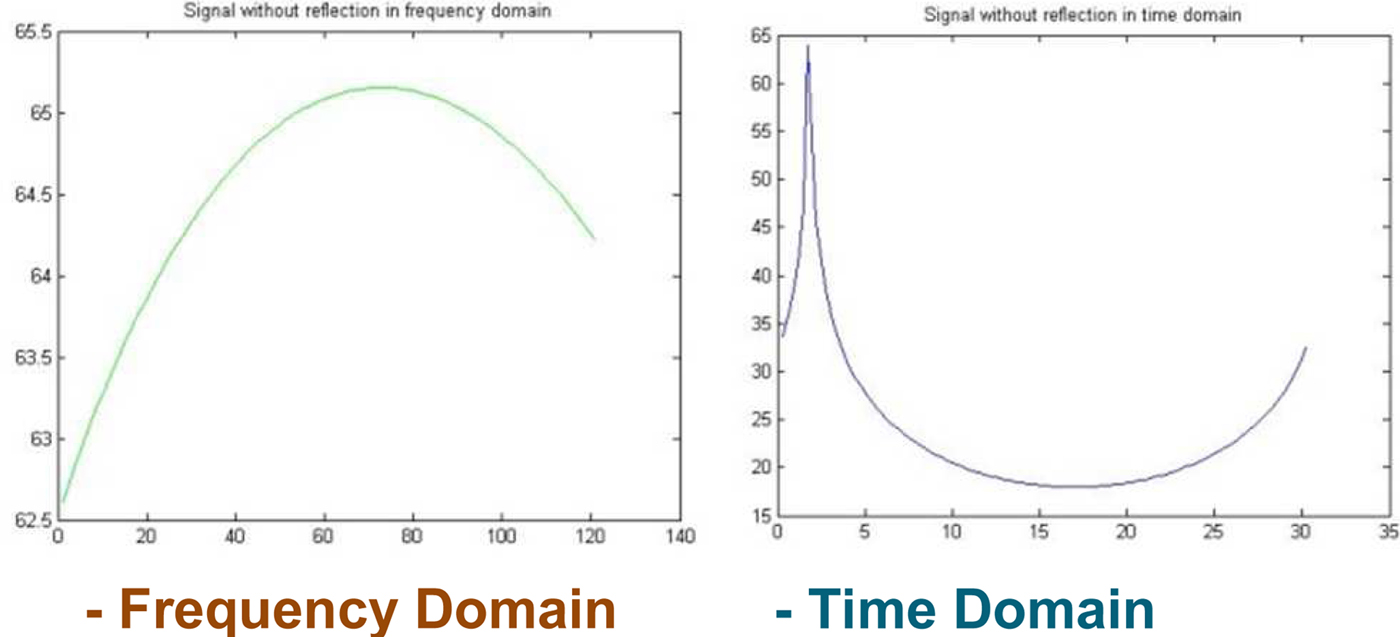
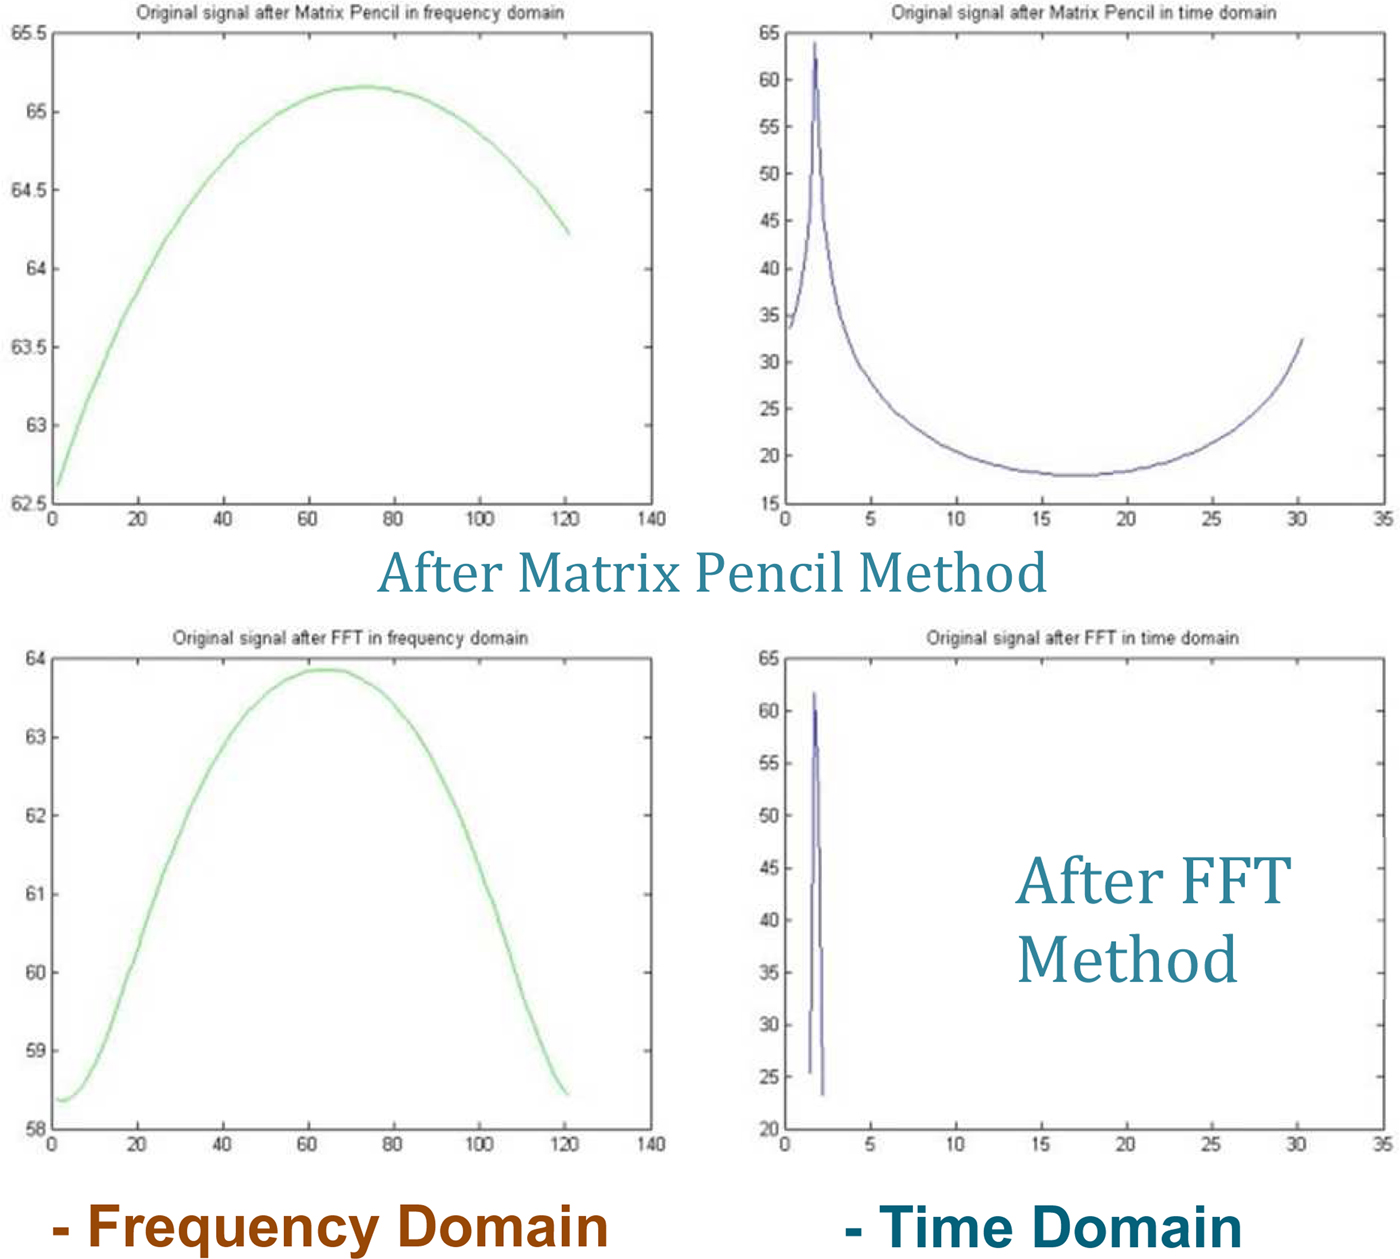
The performance of both methods has been compared by simulating a signal (Fig. 6), the same signal with an echo (Fig. 7), filtering it with both methods (Fig. 8) and comparing with the simulated original signal without reflection (Fig. 6). In this simulation, the Matrix Pencil method has shown a better performance due to the distortion present in FFT method as a consequence of the windowing. In this direction, let us mention that, in stark contrast, in the real-life measurements presented in Section III, the FFT will prove to be a more reliable method.
Original signal without echo.
Original simulated signal with reflection.

Filtered signals with both methods.
III. PRACTICAL ASPECTS TO BE CONSIDERED IN THE MEASUREMENTS
When the algorithms shown in previous section are applied to antenna measurements, some other difficulties appear. The main problem is the need for multifrequency measurements. This introduces serious complications in some cases as in the classical near-field (NF) acquisition the measurement time can be very large. Of course, another aspect is the presence of noise. However, this is not often very serious because the signal-to-noise ratio in the main lobes is large.
In order to check the validity of the echo reduction techniques exposed in the previous section, different tests have been performed using different antenna measurement systems. First, a multiprobe system is used: in this case, the AUT is placed on the azimuth positioner, centered in the antenna system. Therefore, for each angle of arrival, the echoes and the signal get the receiver with the same time delay. In the second measurement system, an azimuth positioner is used for a single-cut measurement, but the phase center of the AUT is displaced and the offset has to be corrected during the process. Moreover, in this case another problem appears, as the distance between AUT and probe is different for each measurement point. This implies that the time gating has to be adjusted for each measurement point.
One advantage is that, since both the processes of NF to far-field (FF) transformation and time gating are linear, this time gating can be applied to the FFs. This simplifies the method and makes it independent of the antenna measurement system. These considerations will be discussed in detail in a future contribution.
Finally, one other important aspect that must be taken into account is that the filtering must be done using similar window widths for each sweep. Otherwise the received power would be different for each point and the result would be rather poor.
In this section, we will show some measurements and their time gating using different algorithms and methods.
A) First setup: time gating without window adjusting
First of all, a Microwave Vision Group (MVG) multiprobe system has been used to measure a dipole featuring a reflection due to a metallic plate that was added to the setup. As the dipole has cylindrical symmetry with the same axis as the positioner and the dipole phase center coincides with the center of rotation, the same gating window can be used for all the measurements (see Fig. 9). This makes it unnecessary to adjust it in post-processing, making the filtering less involved. The setup of the measurement can be observed in Fig. 10. The measurements have taken place between 1.7 and 2.2 GHz with a 10 MHz step.
Fictitious signals generated.
Satimo multiprobe system.

1) MEASUREMENTS AFTER FFT TIME GATING
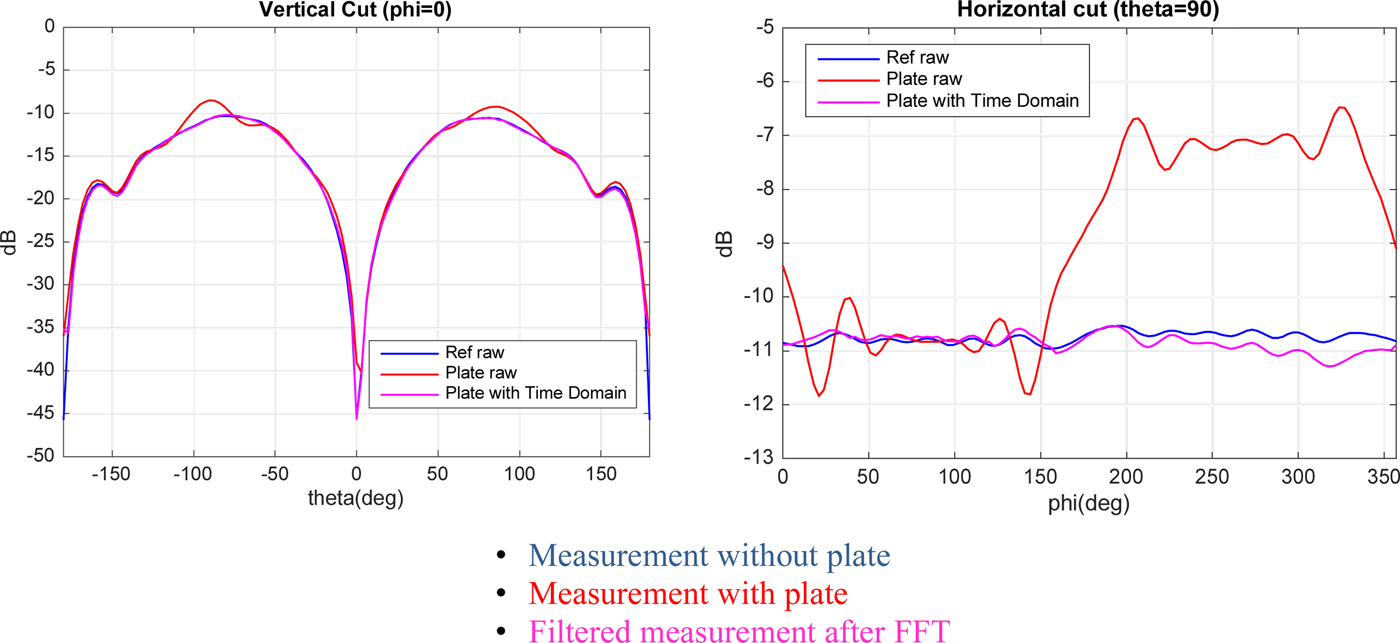
After filtering the measures with FFT method, the results are very satisfactory, as shown in Fig. 11. Especially in the horizontal cut, the reflection is almost perfectly eliminated.
Filtered signal with FFT method.
2) MEASUREMENTS AFTER MATRIX PENCIL
In this case, the performance of the Matrix Pencil method is much worse than that of the FFT method. The number of exponentials that we must take for the Matrix Pencil method varies dramatically in quite similar measurements. We have not found a rule of thumb to choose the optimal number of exponentials that should be taken when the reflection is large. The results are shown in Fig. 12 and the approximation with three exponentials of S21 component in Fig. 13.
Vertical dipole cut after Matrix Pencil method.

S21 after Matrix Pencil method.
B) Second setup: time gating with window adjusting
A quadridge horn SH2000 was measured in a single-cut system in the facilities of the MVG in Italy (Fig. 14)
Spherical near field setup.

The measurement was carried out in the range from 6 to 10 GHz every 10 MHz. Measurements were performed in NF, in the range from 6 to 10 GHz every 10 MHz; the transformation to FF was carried out before and after the time gating, to compare results.
One difficulty of this system is that the antenna phase center is not the center of rotation. Therefore, one needs to shift the gating window for each measurement to correct the deviation. As there is a small difference between direct ray and reflection, zero-padding is applied in the FFT transformation
1) SHIFT PROCESS IN FF
Although the measurements have been made in NF, in this example we obtained FF data through a NF to FF transformation before filtering.
The phase shifting is corrected by aligning the maximum to the same point after the FFT transformation. As the reflection is sometimes greater than direct ray, the correction should be made by taking into account the effect of the distance between the antenna phase center (O) and the measurement point (P), as shown in Fig. 15.
Measurement correction.
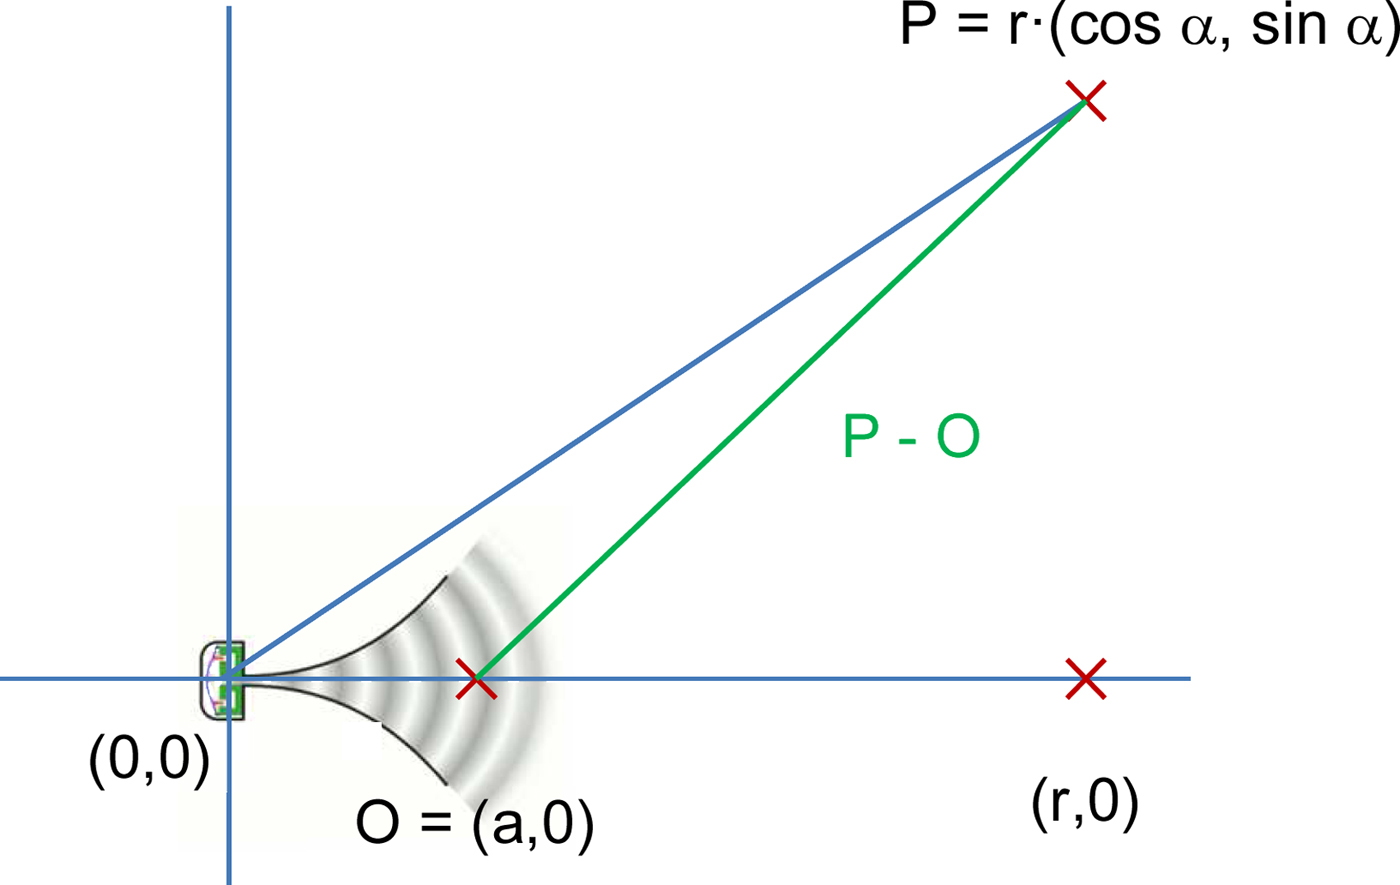
This distance is given in FF by the expression:
 $$\eqalign{\vert \vec P - \vec O \vert - r & \approx \sqrt {r^2 - 2\,{\rm arcos}\,\alpha} - r \cr & = r\left( {\sqrt {1 - \displaystyle{{2\,{\rm acos}\,\alpha} \over r}} - 1} \right) \approx - {\rm acos}\,\alpha.}$$
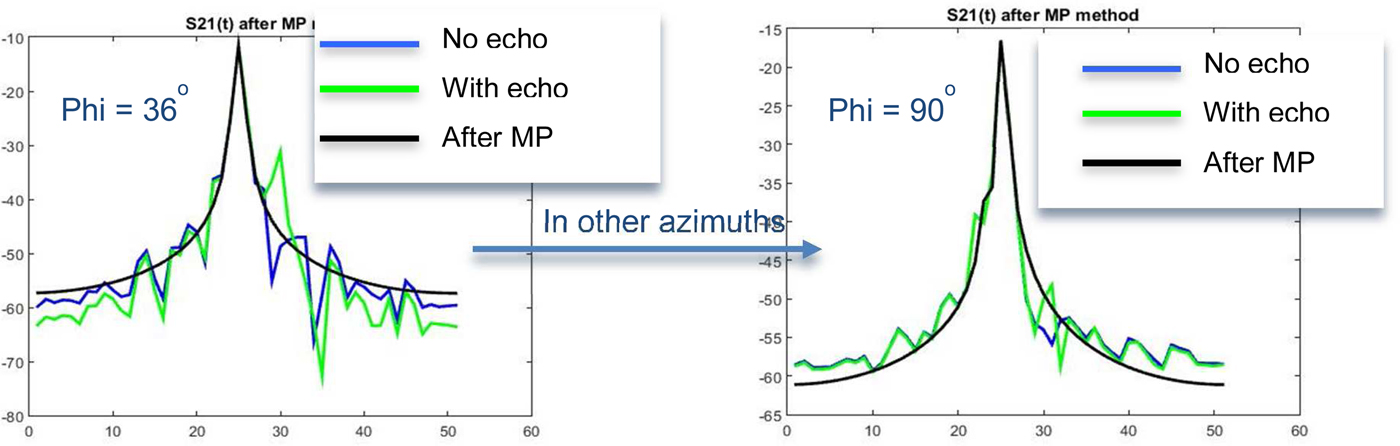
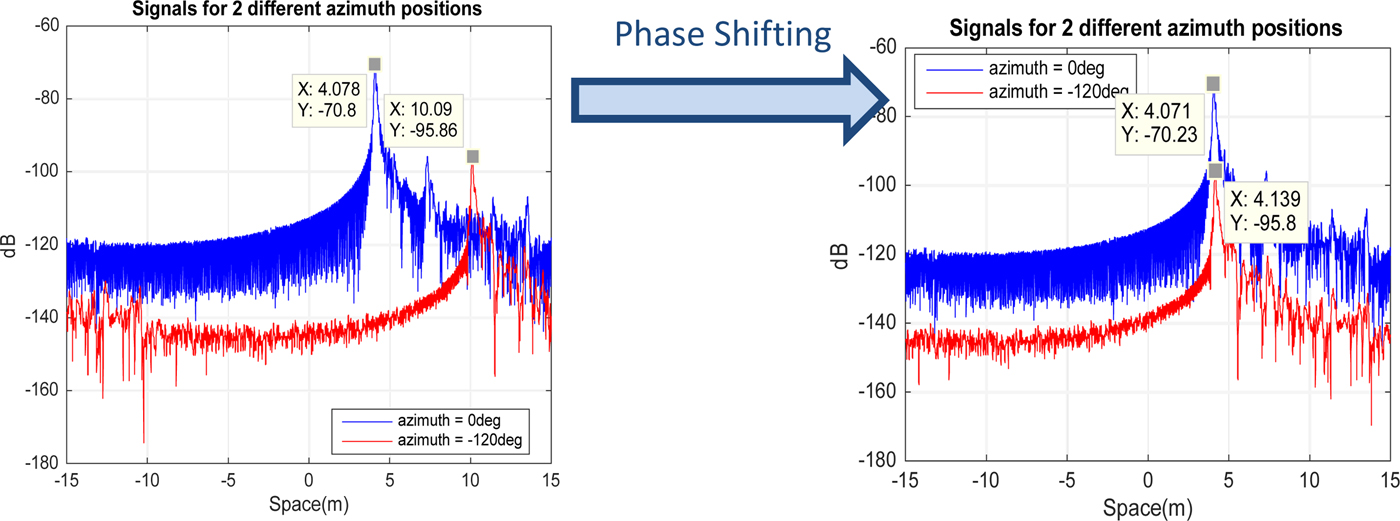
With this correction, the phase shifting works fine (Fig. 16) and then the filtering can be carried out in a satisfactory way for all frequencies. Results are shown in Fig. 17 for 6, 8, and 10 GHz.
Phase shifting for two different azimuth positions.
Filtered measurements and comparison with no-echo measurements for 6, 8, and 10 GHz.

2) SHIFT PROCESS IN NF
In NF, the same algorithm as in FF has been applied. The distance cannot be approximated by a Taylor expansion, so the window alignment must be achieved using the formula
 $$\Delta s = \sqrt {r^2 - 2r{\rm acos}\,\alpha + a^2} - (r - a),$$
where Δs is the difference between direct and reflected path for NF. If we want to calculate the difference in the number of samples, we can use the equation
 $$\Delta n = (\Delta s\!\cdot\! BW)/c,$$
where BW is the bandwidth of the measurement and c the speed of light.
The alignment in NF is shown in Fig. 18 and the filtered signal in Fig. 19.
Alignment of signals for different azimuths positions.

Original signal, filtered signal, and reference.

3) SHIFT USING MATRIX PENCIL
The Matrix Pencil method has also been applied to filter the measurements. Again the number of exponentials in the decomposition has been manually adjusted in each case, as we have not been able to find a general way to choose this number a priori in the filtering. The shift process using Matrix Pencil has to be performed the same way with the FFT method.
In this case, we have chosen a 20 exponential decomposition and a range of 0,43 in the phase of the exponentials. The validation was done in the transform domain (see Fig. 20), and the result is shown in Fig. 21. This result is clearly less satisfactory than that of the FFT method.
Twenty exponentials for Matrix Pencil method.
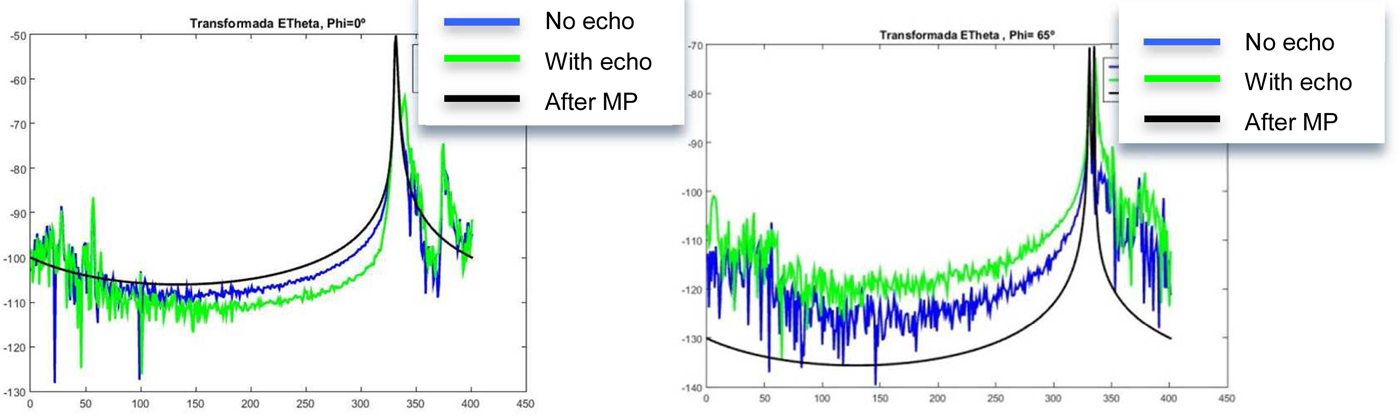
Result after Matrix Pencil method.

IV. CONCLUSION
Time-gating techniques have proved to be efficient methods to eliminate noise in an antenna measurement, if the geometry of the system and of the AUT is appropriate. Comparing these techniques to the Matrix Pencil method, both advantages and disadvantages has been found. Matrix Pencil has shown much better performance for simulations and in the cases where the signal was significantly bigger than the noise and the reflections.
In the examples that we have considered, we have also introduced large reflection to analyze their effect. For these setups, the FFT method has proved to be the best and easiest way to filter a signal with echo and has the additional advantage that it can be performed either in NF or after the transformation to FF.
ACKNOWLEDGEMENTS
This work is related with different research projects: the authors want to acknowledge the Madrid Region Government project for financing the project Space Debris Radar (S2013/ICE-3000 SPADERADAR-CM) and the Spanish Government, for the support of the project ENABLING5G “Enabling Innovative Radio Technologies for 5G networks” (TEC2014-55735-C3-1-R). This is also part of collaboration between MVG and UPM. The authors want to acknowledge the MVG engineers Lars J. Foged and Francesco Saccardi and UPM students Manuel José López Morales, Javier García-Gasco Trujillo, and Rubén Tena Sánchez for their fruitful contributions to the results of this paper and the measurements involved on them.
 Pilar González-Blanco was born in 1982 in Murcia (Spain). She obtained her degree in Telecommunication Engineering in 2005 from the Technical University of Madrid (UPM). She worked for the company Alava Ingenieros from 2005 to 2007 and in 2007 she joined INTA (National Institute for Aerospace Technique) as a senior engineer. From 2011 to 2016, she worked at Spanish Prime Minister's Office as Deputy Director for Telecommunications, carrying out part of her work for the Spanish Ministry of Finance and Public Administration. Since 2016 she occupies an analogous position at Ministry of Defence.
 Manuel Sierra Castañer was born in 1970 in Zaragoza (Spain). He obtained the degree of Telecommunication Engineering in 1994 and the Ph.D. in 2000, both from the Technical University of Madrid (UPM) in Spain. He worked for the cellular company Airtel from 1995 to 1997. Since 1997, he worked in the University “Alfonso X” as assistant, and since 1998 at the Technical University of Madrid as research assistant, assistant, and associate professor. He has been director of several research projects, has published 40 papers in scientific journals and he has directed seven Ph.D. Thesis. He has been visitor researcher in Tokyo Tech (September to December 1998) and EPFL (September to December 1999) during his Ph.D. and visitor Professor in Tokyo Tech during the summers of 2012 and 2013. Currently, he is senior member of the IEEE and AMTA Societies. His current research interests are in planar antennas and antenna measurement systems. Dr. Sierra-Castañer obtained the IEEE APS 2007 Schelkunoff Prize paper Award for the paper “Dual-Polarization Dual-Coverage Reflectarray for Space Applications” in 2007 and other awards for papers in conferences. Manuel Sierra Castañer has been the leader of the EurAAP WG5 “Measurements” since April 2012 until April 2015. He has been elected as EurAAP regional delegate for Portugal, Spain, and Andorra. Manuel Sierra Castañer represents UPM (Universidad Politécnica de Madrid) in the Board of the European School of Antennas. Since January 2015 he is the AMTA Europe liaison, and since January 2016 he is a member of the EurAAP Board of Directors. Manuel Sierra is Director of International Cooperation of Universidad Politécnica de Madrid since October 2010–2016.


