


1. Introduction
Plain Language (PL) and Easy/Simple Language (SL) are clearly distinguished in literature and serve different target groups and communicative purposes. Plain Language focuses on clear, accurate and comprehensible communication, primarily in legal and administrative texts, where the aim is to ensure accessibility for a broad audience while preserving precision. By contrast, Easy Language applies stronger simplification and is intended for readers with lower literacy or limited language skills, for example, people with intellectual disabilities (Vecchiato, Reference Vecchiato2022). Thus, the two registers are fundamental tools for tailoring communication to audiences with different goals and competencies. Both PL and SL can be viewed as Text Simplification registers, making SL a natural candidate for cross-domain augmentation. Although the international literature clearly distinguishes PL and SL as tailored language varieties (Bhatia, Reference Bhatia, Wagner and Matulewska2023; Leskelä et al., Reference Leskelä, Mustajoki and Piehl2022), systematic, feature-based, corpus-driven comparisons are still lacking for Hungarian. To our knowledge, this is the first study to analyze Hungarian PL and SL as distinct registers through unified, feature-guided comparison grounded in authentic, real-world corpus data. Using the only two publicly available, high-quality Hungarian resources for PL and SL, a legal-administrative PL corpus and a news-based SL corpus, we examine their stylistic, morphosyntactic and discourse-level characteristics. This pairing reflects the current state of publicly available Hungarian resources for PL and SL. Accordingly, we note that differences in text type and specialization may introduce domain effects beyond accessibility, and we address this in our analysis. The PL corpus consists of legal and administrative documents rewritten by linguists for general audiences, whereas the SL corpus contains news texts adapted for readers with low literacy or limited proficiency. Both datasets were created for real-world use, enabling practical insights beyond experimental settings.
Our primary objective is sentence-level PL detection with a Machine Learning model that flags sentences where expert intervention may be needed during PL-oriented rewriting. Sentence-level granularity is useful in editorial workflows and is well-suited to low-resource settings where only small, high-quality PL corpora are available. Because sentences far outnumber paragraphs, it typically yields enough training instances to meet minimum sample requirements for supervised classifiers, whereas paragraph-level detection may be infeasible in small corpora. While some PL properties are realized at the discourse or text level, sentence-level instances nonetheless provide sufficient signal for models to learn the features needed for PL detection.
Methodologically, we combine a feature-based descriptive comparison with a selective augmentation experiment. First, we extract handcrafted linguistic features at the surface and morphosyntactic levels and compute sentence-level statistics on automated HuSpaCy annotations (e.g., surface metrics, morphosyntactic richness and discourse connective usage), linking these features to PL guideline concepts. Second, we derive a PL-likeness score from a logistic-regression model trained on PL data and use the score, based on top-ranked coefficients, to identify SL sentences most similar to PL. We then train and evaluate a supervised, sentence-level PL detector on PL-only data and on PL plus the selected SL instances.
The study asks three questions:
-
(i) Which linguistic features distinguish Hungarian PL from SL in actual use?
-
(ii) Can selectively chosen SL sentences improve PL detection under data scarcity?
-
(iii) How sensitive are PL classification results to source provenance and to the selectivity of augmentation?
Our experimental workflow consisted of seven major steps, as follows.
-
1. Handcrafted sentence-level surface and morphosyntactic features were extracted from HuSpaCy automatic annotations (Orosz et al., Reference Orosz, Szántó, Berkecz, Szabó and Farkas2022) and were linked to PL guideline concepts.
-
2. A descriptive comparison of Hungarian PL and SL was provided along these features.
-
3. A logistic regression model was fitted on the PL data, and a PL-likeness score was computed for SL sentences based on the top-ranked coefficients.
-
4. The highest-scoring SL sentences were selected for data augmentation.
-
5. A PL-only baseline model was trained for supervised sentence-level PL detection.
-
6. The detector was retrained on PL plus selected SL sentences and was evaluated against the PL-only baseline.
-
7. Performance differences were reported, and robustness checks were conducted, including sensitivity to the selection threshold and to source provenance.
We test whether measurable sentence-level differences between PL and SL can support supervised PL detection and whether feature-guided, low-proportion augmentation with SL sentences improves performance without degrading precision.
The remainder of the paper is organized as follows: Section 2 outlines the theoretical foundations and situates PL and SL in the Hungarian context, Section 3 introduces the data and preprocessing, including source provenance and limitations, Section 4 provides a quantitative profiling of linguistic features across the PL and SL corpora, Section 5 details the methods, that is the feature set and PL-likeness scoring as well as the supervised detection setup with augmentation experiments, Section 6 presents results and discusses implications, and Section 7 concludes and outlines future work.
2. Theoretical foundations
2.1. Conceptual and empirical perspectives on plain and simple language
Text simplification is a well-established subfield of Natural Language Processing that seeks to improve the accessibility of written texts without altering their intended meaning (Kim et al., Reference Kim, Leijnen and Beinborn2024). A key conceptual distinction exists between PL and SL. In practice, however, widely used sentence-aligned simplification benchmarks, for example, work built around Simple Wikipedia (Yasseri et al., Reference Yasseri, Kornai and Kertész2012) often reflect SL-style objectives, which may blur the distinction in computational settings (Stodden, Reference Stodden2024). Our contribution in this regard is empirical: we use corpus evidence to examine how PL and SL are realized in Hungarian. In this section, we synthesize prior work on PL and SL to derive the linguistic dimensions and features that later guide our corpus-based analysis.
2.1.1. Simple language vs plain language
SL is designed for individuals with limited literacy, non-native speakers, or those with cognitive impairments. It prioritizes basic vocabulary and simplified syntactic structures, often at the expense of semantic richness and precision (Yasseri et al., Reference Yasseri, Kornai and Kertész2012). Its guiding principles include short and simple sentences, active voice, overt textual scaffolding and explicit discourse markers (Alarcon et al., Reference Alarcon, Moreno and Martínez2023; Madina et al., Reference Madina, Gonzalez-Dios and Siegel2023; Yaneva et al., Reference Yaneva, Temnikova, Mitkov, Calzolari, Choukri, Declerck, Goggi, Grobelnik, Maegaard, Mariani, Mazo, Moreno, Odijk and Piperidis2016), aligning SL closely with literacy accessibility and second-language acquisition (Martínez et al., Reference Martínez, Moreno and Ramos2024).
In contrast, PL enhances comprehensibility for the average reader while maintaining legal or administrative accuracy in official settings (Fernández-Silva & Núñez Cortés, Reference Fernández-Silva and Núñez Cortés2025; Masson & Waldron, Reference Masson and Waldron1994). In German linguistic literature, this contrast appears as Leichte Sprache (SL) versus Einfache Sprache (PL) (Pottmann, Reference Pottmann2020; Radünzel, Reference Radünzel2017).
Much of the computational simplification literature has centered on sentence-level simplification using resources with SL-like targets (e.g., Simple Wikipedia), whereas PL imposes domain-specific constraints that permit fewer transformations and require preserving normative content while improving syntactic, lexical and discourse-level accessibility (Bhatia, Reference Bhatia2010; Plain Language Action and Information Network, 2011b; Trosborg, Reference Trosborg1997). In legal and administrative contexts, PL revisions aim to improve clarity without altering the document’s legal effect (International Organization for Standardization, 2023; Office of the Parliamentary Counsel, Drafting Techniques Group, 2014; Plain Language Action and Information Network, 2011a). By contrast, SL/Easy-to-Read permits stronger adaptations, such as re-ordering information or omitting non-essential content, to meet cognitive-accessibility needs (Inclusion Europe, 2009; Maaß, Reference Maaß2020; Netzwerk Leichte Sprache e.V., 2022). Because legal effect must be preserved, PL rewriting cannot materially change sentence semantics, omit information, or alter legally relevant orderings – editing is therefore more constrained than in SL, even though SL’s linguistic prescriptions are often stricter.
2.1.2. From definition to features
The Plain Language Movement has evolved into a multidisciplinary research field spanning linguistics (Lutz, Reference Lutz2019), law (Williams, Reference Williams2015) and cognitive science (Cheung, Reference Cheung2017). The International Plain Language Federation (2023)Footnote 1 defines a document as plain if its intended audience can find what they need, understand what they find and use that information effectively. This is codified in ISO 24495-1:2023 (International Organization for Standardization, 2023).
These definitions imply linguistic properties that support comprehension and reduce cognitive load, including shorter sentences (Matthews & Folivi, Reference Matthews and Folivi2023), active voice (Olson & Filby, Reference Olson and Filby1972) and a reduced syntactic complexity (Eslami, Reference Eslami2014). These tendencies accord with psycholinguistic findings on working memory capacity limitations and incremental parsing (Just & Carpenter, Reference Just and Carpenter1992; Van Dyke & McElree, Reference Van Dyke and McElree2006). For SL/Easy-to-Read, European and national guidance similarly articulate purposes, target audiences and drafting principles (Inclusion Europe, 2009), and peer-reviewed work frames SL and PL within register/variety perspectives and reports empirical effects and evaluations (Hennig, Reference Hennig2022; Leskelä et al., Reference Leskelä, Mustajoki and Piehl2022; Vanhatalo et al., Reference Vanhatalo, Lindholm and Onikki-Rantajääskö2022).
Lexically, PL favors high-frequency, familiar, concrete vocabulary (Kimble, Reference Kimble2023) and discourages nominalizations (Wydick, Reference Wydick2005). Syntactically, complex structures such as center-embedding, multiple negation, Light Verb Constructions and overused passives increase processing demands (M. Butt, Reference Butt, Amberber, Baker and Harvey2010; Gibson, Reference Gibson1998; Liu & Cui, Reference Liu and Cui2025). Maintaining canonical word order and limiting sentence length aids readers across proficiency levels (R. P. Charrow & Charrow, Reference Charrow and Charrow1979; Pléh, Reference Pléh1981), consistent with broader evidence that syntactic complexity and hierarchical embedding impair comprehension (Friederici, Reference Friederici2011; Levy, Reference Levy2008).
In SL, lexical choice is constrained toward basic, high-frequency vocabulary with explicit explanations where needed, while syntax favors short sentences, limited embedding, and canonical order; sentence splitting and overt cohesion devices are common (Madina et al., Reference Madina, Gonzalez-Dios and Siegel2023; Paetzold & Specia, Reference Paetzold and Specia2016; Sulem et al., Reference Sulem, Abend and Rappoport2018; Yaneva et al., Reference Yaneva, Temnikova, Mitkov, Calzolari, Choukri, Declerck, Goggi, Grobelnik, Maegaard, Mariani, Mazo, Moreno, Odijk and Piperidis2016).
Structural layout and document design can further support overall comprehensibility. The Federal Plain Language Guidelines emphasize short paragraphs, topic sentences and presenting complex information in lists or tables (Plain Language Action and Information Network, 2011a). Redundant modifiers, exceptions to exceptions and unexplained cross-references should be avoided (V. R. Charrow et al., Reference Charrow, Erhardt and Charrow2007). Neurocognitive and eye-tracking research indicates that such layout principles reduce cognitive load and facilitate both global and local processing (Rayner, Reference Rayner1978). SL guidelines likewise prescribe overt textual scaffolding, such as descriptive headings, increased white space and supportive visuals to facilitate comprehension (Inclusion Europe, 2009; Netzwerk Leichte Sprache e.V., 2022).
Corpus-based studies show that legal and administrative texts characteristically employ passives, nominalizations and embedded clauses, which reduce readability (Bhatia, Reference Bhatia2010; Tiersma, Reference Tiersma1999). A comparative analysis in Hungarian (Vincze, Reference Vincze, Szabó and Vinnai2018) confirms similar tendencies and variation across legal subgenres, suggesting that simplification strategies must be tailored to genre-specific conventions. In Hungary, the Miskolc Legal Corpus program (Szabó & Vinnai, Reference Szabó and Vinnai2018) reports corpus-linguistic analyses of subject and predicate structures (Balogh, Reference Balogh, Szabó and Vinnai2018; Dobos, Reference Dobos, Szabó and Vinnai2018), subordination and coordination (Kurtán, Reference Kurtán, Szabó and Vinnai2018; Sajgál, Reference Sajgál, Szabó and Vinnai2018) and punctuation patterns (Kurtán, Reference Kurtán, Szabó and Vinnai2018). Stereotypes about legalese (pervasive nominalization, function-word overload and impersonal constructions) were only partially confirmed (Vincze, Reference Vincze, Szabó and Vinnai2018), while comprehension barriers were associated with more frequent departures from canonical word order (e.g., object fronting to clause-initial position) and increased distances between the verb and its dependents. In SL-oriented corpora and evaluations, simplification often increases the explicitness of discourse relations and global cohesion.
Finally, ISO 24495-1:2023 organizes PL principles around relevance of content, navigability, comprehensibility and usability. Although developed for English-language documents, its core principles have been adapted for legal and administrative domains more broadly, including in Hungary. This framing positions PL not merely as a normative ideal but as an approach aligned with cognitive constraints on language processing (Hagoort, Reference Hagoort2019; Johnson-Laird, Reference Johnson-Laird1995; Kintsch, Reference Kintsch, Alvermann, Unrau, Sailors and Ruddell2018).
2.2. Plain and simple language: register perspectives
PL and SL are key registers in accessibility-focused communication. Following register-oriented accounts, PL and SL are treated here as language varieties distinguished by target audiences, communicative purposes and constraints (Fuchs et al., Reference Fuchs, Bock and Pappert2023; Maaß, Reference Maaß2020). In this framework, PL is constrained by fidelity to institutional intent and legal/administrative accuracy, whereas SL is constrained by maximizing comprehensibility for readers with limited linguistic resources. This register perspective clarifies the functional profile of both PL and SL and guides the operationalization used later.
Functionally, PL emphasizes clarity for intended users while preserving legal/administrative effect and content; surface simplification and transparent structure are pursued without semantic loss. SL allows stronger simplification for low-literacy or cognitively diverse readers, favoring basic/high-frequency lexicon, short sentences, and explicit scaffolding and cohesion, and allowing explanatory additions or selective omission of non-essential details where appropriate. This contrast implies different error tolerances in modeling (e.g., lower tolerance for meaning shift in PL than in SL).
Differences in lexical, syntactic and discourse constraints have consequences for corpus design, annotation standards and computational modeling. Register-aware datasets and labels are needed so that features reflect register constraints rather than only genre or topic. Clarifying how PL and SL operate within and across domains is critical for aligning empirical methods with theoretical definitions and for advancing computational text simplification.
Due to the limited parallel data, most simplification research has focused on sentence-level methods, especially for low-resource, morphologically rich languages (Nisioi et al., Reference Nisioi, Štajner, Ponzetto and Dinu2017; Sulem et al., Reference Sulem, Abend and Rappoport2018; Xu et al., Reference Xu, Callison-Burch and Napoles2015). Sentence-level alignment can be automated with tools that match similar sentences across text variants (Alva-Manchego et al., Reference Alva-Manchego, Martin, Bordes, Scarton, Sagot and Specia2020). However, recent studies highlight the limitations of sentence-only simplification, emphasizing discourse context and information structure. Sentence deletion depends on discourse factors (Zhong et al., Reference Zhong, Jiang, Xu and Li2020), and iterative sentence-level edits can degrade document coherence (Cripwell et al., Reference Cripwell, Legrand and Gardent2023), which motivates register-aware document-level evaluation.
Although multilingual corpora like MultiSimV2 (Ryan et al., Reference Ryan, Naous and Xu2023) have advanced the field, Hungarian remains underrepresented. The huPWKP corpus (Prótár et al., Reference Prótár, Nemeskey and Digital Humanities2023), based on English Simple Wikipedia, offers aligned data but reflects SL-style and is machine-translated into Hungarian, reducing target-language authenticity. The HunSimpleNews corpus (Prótár & Nemeskey, Reference Prótár and Nemeskey2025) provides manually aligned standard and simple Hungarian news articles, focusing also on SL.
There is only one dedicated Hungarian PL corpus (Üveges, Reference Üveges2022). It contains aligned legal-administrative texts (the originals paired with PL rewrites by trained linguists to preserve normative content), but its modest size constrains data-intensive models. Together, these resources motivate a register-aware, feature-based comparison and sentence-level PL detection with selective SL augmentation, tested explicitly to avoid register conflation.
3. Data
Our investigation uses two Hungarian corpora: the legal–administrative Plain Language (PL) corpus introduced by Üveges (Reference Üveges2022) and the news-based Simple/Easy Language (SL) corpus HunSimpleNews (Prótár & Nemeskey, Reference Prótár and Nemeskey2025). These are, to our knowledge, the only publicly available, high-quality Hungarian resources for PL and SL. The pairing thus reflects data availability rather than a claim of domain comparability; source provenance (legal-administrative versus journalistic) is treated as a limitation throughout, and comparisons are interpreted as register-aware and descriptive. Both resources comprise documents produced for practical use, and both can be re-cast into sentence-level instances suitable for supervised model training and evaluation.
Compared with the original studies introducing the PL corpus (Üveges, Reference Üveges2022) and HunSimpleNews (Prótár & Nemeskey, Reference Prótár and Nemeskey2025), we made preprocessing changes to ensure cross-dataset consistency. First, all texts were re-segmented at the sentence level using huSpaCy’s transformer model (Orosz et al., Reference Orosz, Szántó, Berkecz, Szabó and Farkas2022) to standardize sentence boundaries. The original PL corpus relied on a heuristic toolFootnote 2 and HunSimpleNews did not specify segmentation. Second, lead paragraphs were removed from HunSimpleNews, retaining only article bodies. For the PL corpus, section headers, tables of contents, document titles and tables were excluded, keeping only the main text bodies.
3.1. Plain language corpus: description and annotation
The PL corpus (hereinafter: Plain Language Corpus – PLC) was introduced by Üveges (Reference Üveges2022). It comprises official texts from the National Tax and Customs Administration, Hungary (Nemzeti Adó- és Vámhivatal, NAV). These are functional informational texts intended to inform the authority’s clients; the primary addressees are lay readers rather than legal professionals, and the materials are not legislative acts but citizen-facing guidance. Documents originally drafted in complex, legalistic Hungarian were rewritten by linguistic professionals to conform to institutional PL guidance, resulting in two versions per document.
Internal NAV drafting notes document the transformation principles. Although these predate ISO 24495-1, they are consistent with it (e.g., reducing passive constructions, avoiding light-verb constructions, avoiding multiply embedded clauses, preferring active voice, foregrounding reader needs and front-loading the main message). The rewriting targets clarity, navigability and audience-appropriate terminology while preserving legal/administrative effect.
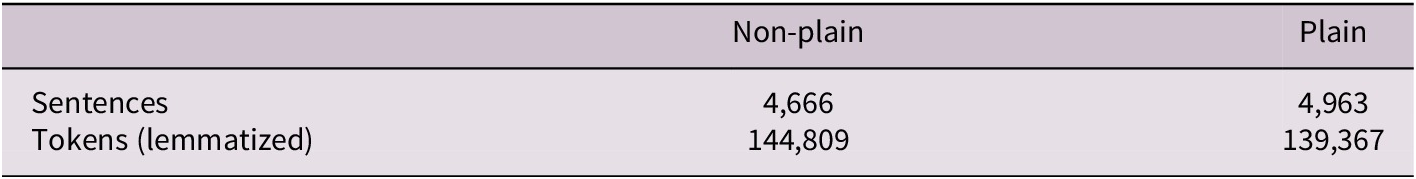
The corpus spans administrative genres such as informational brochures, guidance documents and public announcements. Each source text is paired with a PL rewrite (document-level pairing). Following Üveges (Reference Üveges2022), during sentence-level corpus preparation, sentences identical across versions were excluded. The remaining sentences were divided into sub-corpora based on presence: those found only in the PL version were labeled ‘plain’, and those appearing only in the original version were labeled ‘non-plain’. After preprocessing, the corpus contains 4,666 sentences in the non-plain variant and 4,963 in the plain variant (Table 1).
Sentence and token count in the PL corpus

Examples (1)–(2) are an illustrative minimal sentence pair from the PLC, where example (1) is the non-plain original, and example (2) is a plain rewrite of the same sentence.


In this example, (1) employs a deverbal noun koppintás (‘tapping’) combined with the effect-marking postposition hatására (‘as a result of’, lit. ‘on the effect of’), and it uses a periphrastic passive (nem kerül felülírásra – ‘is not overwritten’), which increases nominalization and reduces transparency. By contrast, (2) replaces these with a verbal adverbial (koppintva, ‘by tapping’) and an active predicate (nem írja felül, ‘does not overwrite’), yielding a more linear, sentence-level realization associated in our corpus with PL instances.
3.2. HunSimpleNews corpus: description and annotation
HunSimpleNews (HSN) is a publicly available resource for Hungarian text simplification.Footnote 3 It comprises 2,833 article pairs manually identified as true simplification matches from the PannonRTV news portal, where simplified versions were written according to Easy-to-Read principles for readers with low literacy or limited language proficiency.
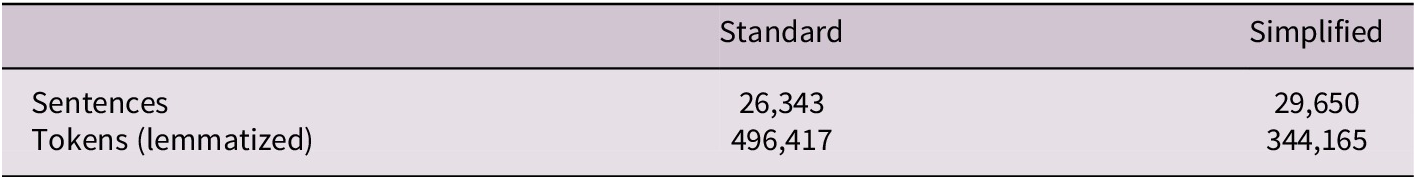
After preprocessing (lead removal and huSpaCy sentence segmentation), the corpus contains 26,343 sentences in the standard language variant and 29,650 in the simplified variant (Table 2). As a journalistic resource mediated by professional writers, HSN operationalizes SL constraints (short sentences, basic lexicon, explicit scaffolding); therefore, its communicative goals and genre conventions differ from those of legal-administrative PL.
Sentence and token counts in the HunSimpleNews corpus

The simplifications found in the corpus are illustrated by examples (3)–(4), where (3) is the standard and (4) is the simple version of the same statement.
Taken together, the corpora enable an initial, register-aware exploration of PL versus SL in Hungarian under real-world constraints. We explicitly test whether selective cross-register augmentation can support sentence-level PL detection. A full qualitative account of specialized versus journalistic style is beyond the scope of this section; we flag provenance as a limitation and interpret quantitative differences accordingly.
4. Quantitative profiling of linguistic features across corpora
This section reports descriptive, sentence-level profiles of lexical, morphosyntactic and discourse-related metrics for the two corpora (PLC and HSN). The measures – covering sentence length, structural complexity and compositional patterns – outline how the datasets vary and provide a compact statistical portrait of each. Overall, the profiles jointly quantify within-register variation (PL: plain versus non-plain in official documents; SL: simple versus original in news) as well as the broader cross-register contrast between official-document PL and news-based SL.
4.1. Sentence length
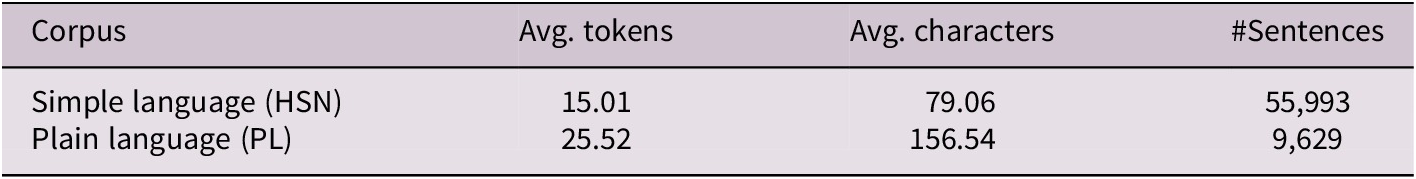
One of the most salient differences between PL and SL is sentence length. As Table 3 shows, PLC sentences average 25.52 tokens and 156.54 characters, while HSN sentences are significantly shorter, averaging 15.01 tokens and 79.06 characters. Thus, PL sentences are approximately 70% longer than SL sentences in both token and character count.
Base corpus statistics. (Avg. tokens = average number of tokens per sentence, Avg. characters = average number of characters per sentence, # Sentences = total number of sentences)

This difference reflects distinct functional goals. SL texts minimize cognitive load for non-prototypical readers, such as those with cognitive or linguistic impairments. In contrast, PL texts aim to preserve legal and administrative precision while enhancing clarity for general audiences without specialized legal knowledge (P. Butt & Castle, Reference Butt and Castle2006). In addition, the contrast is compounded by the baseline tendency of official documents to contain longer sentences.
4.2. Lexical diversity and repetition
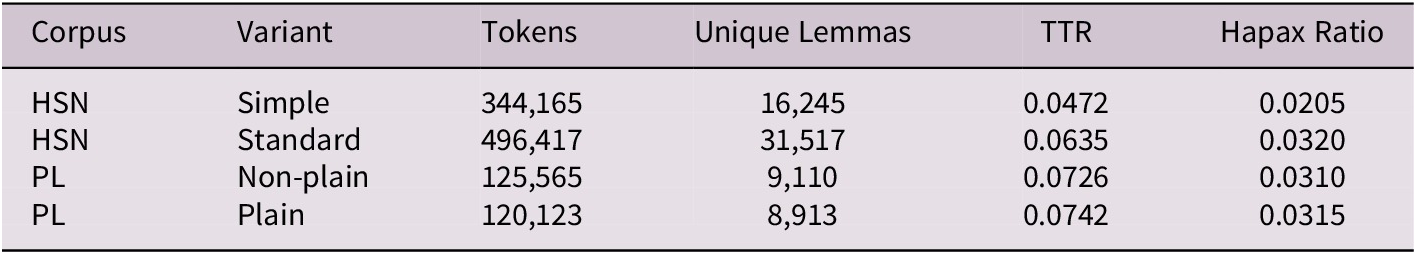
Lexical diversity also reveals striking differences between PL and SL. Type–Token Ratio (TTR), the proportion of unique words (types) to total words (tokens) measures lexical richness (Baayen, Reference Baayen2001). Table 4 shows TTR and hapax legomena rates (words occurring only once), calculated from lemmatized text (inflected forms reduced to their base lemma).
Lexical diversity and hapax legomena ratio across corpus and variant. (Tokens = total number of tokens, Unique Lemmas = total number of unique lemmas, TTR = type–token ratio, Hapax Ratio = proportion of words occurring only once – hapax legomena)

The PL corpus exhibits slightly higher lexical diversity: non-plain TTR is 0.0726, plain TTR is 0.0742. In contrast, SH corpus TTR is 0.0635 for standard and only 0.0472 for simple variants. Hapax legomena ratios are stable in PL (3.1% both variants) but lower in HSN/simple (2.0%) compared to HSN/standard (3.2%).
4.3. Part-of-speech distributions
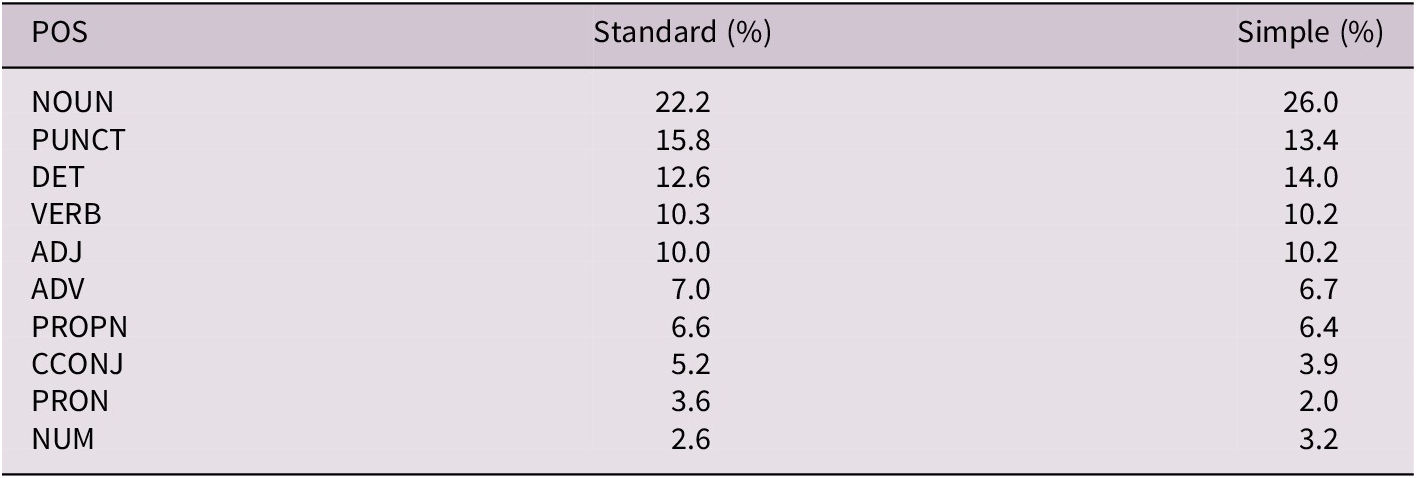
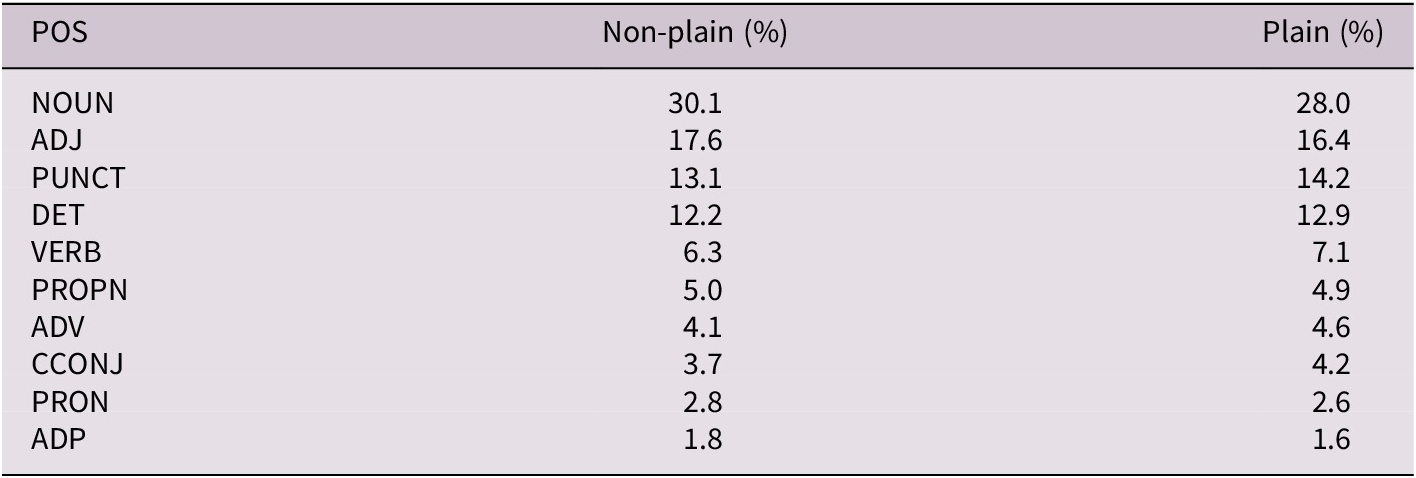
Differences in Part-of-Speech (POS) distributions reveal structural divergences between PL and SL. As Tables 5 and 6 show, nouns (NOUN) dominate PL: they account for 30.1% of tokens in non-plain and 28.0% in plain variants, exceeding HSN noun ratios (22.2% standard, 26.0% simple).
The top 10 POS categories in the HunSimpleNews corpus (HSN), expressed as percentages. (NOUN = Nouns, ADJ = Adjectives, PUNCT = Punctuation, DET = Determiners, VERB = Verbs, PROPN = Proper Nouns, ADV = Adverbs, CCONJ = Coordinating Conjunctions, PRON = Pronouns, ADP = Adpositions)

The top 10 POS categories in the Plain Language corpus (PLC), expressed as percentages. (NOUN = Nouns, ADJ = Adjectives, PUNCT = Punctuation, DET = Determiners, VERB = Verbs, PROPN = Proper Nouns, ADV = Adverbs, CCONJ = Coordinating Conjunctions, PRON = Pronouns, ADP = Adpositions)

This noun overrepresentation reflects the nominalization-heavy style typical of legal-administrative texts (Mattila, Reference Mattila2016), indicating a conceptual rather than action-oriented mode. In contrast, HSN corpus shows higher verb usage (~10.2%), usually associated with clear, event-based communication. Adjectives (ADJ) are also more frequent in PL (17.6% / 16.4%) than SL (10.2%). SL places greater emphasis on determiners (DET) and pronouns (PRON); DET ratio in SL/simple reaches 14.0% versus 12.6% in SL/standard. Conversely, PRON usage declines from 3.6% in SL/standard to 2.0% in SL/simple, suggesting a preference for explicit noun repetition over coreference chains for easier reference resolution. Proper nouns (PROPN) also vary: SL news articles include more Named Entities (6.4% simple, 6.6% standard) than the PLC’s more abstract, institutional content (4.9% plain, 5.0% non-plain).
4.4. Morphological variety and type richness
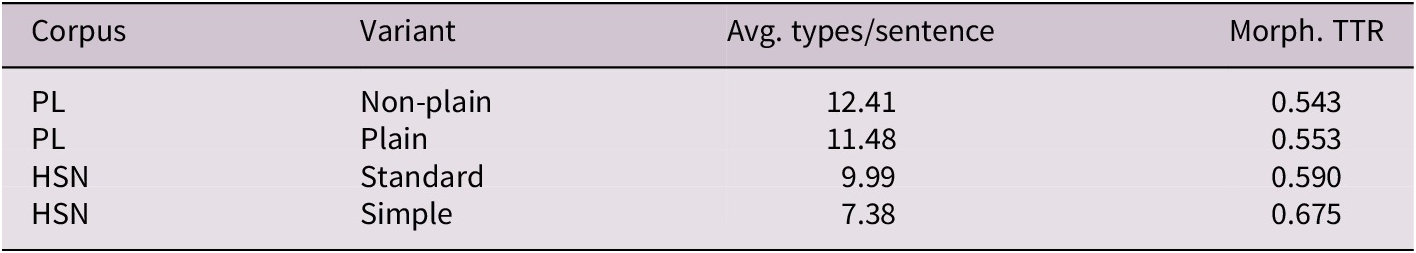
Morphological features were analyzed at the sentence level using two metrics: the average number of distinct morphological types per sentence and morphological TTR (type–token ratio), capturing variation in inflectional forms, case markers, verb tenses and agreement features (Table 7).
Morphological type richness across corpus and variant. (Avg. types/sentence = average number of unique word forms per sentence, Morph. TTR = morphological type–token ratio)

Morphological TTR is notably higher in HSN. Although HSN/simple texts have fewer morphological types per sentence (7.38) than PL/plain texts (11.48), their relative diversity (TTR = 0.675) exceeds that of PL/plain (0.553) and PL/non-plain (0.543). Thus, SL texts, despite syntactic simplicity, show surprising morphological variation within short sentences.
This reflects morphologically rich but structurally simple constructions, such as varied verb inflections, case-marked noun phrases and explicit adpositional expressions, enhancing referential clarity and accessibility. SL seems to prioritize clarity through morphological explicitness (e.g., pronouns, spatial adpositions) rather than syntactic embedding.
4.5. Syntactic complexity and embedding
Syntactic complexity was assessed using two metrics from huSpaCy dependency-parsed annotations:
-
• the dependency tree depth per sentence,
-
• the ratio of tokens labeled as embedded clause dependents (csubj, ccomp, xcomp, acl).
Tree depth was computed by mapping token indices to syntactic heads and measuring the longest path to the root per sentence. The embedded clause ratio was calculated as the proportion of such tokens relative to total sentence tokens. Sentence-level values were aggregated by corpus and variant to yield average syntactic depth, embedded clause ratio and sentence counts.
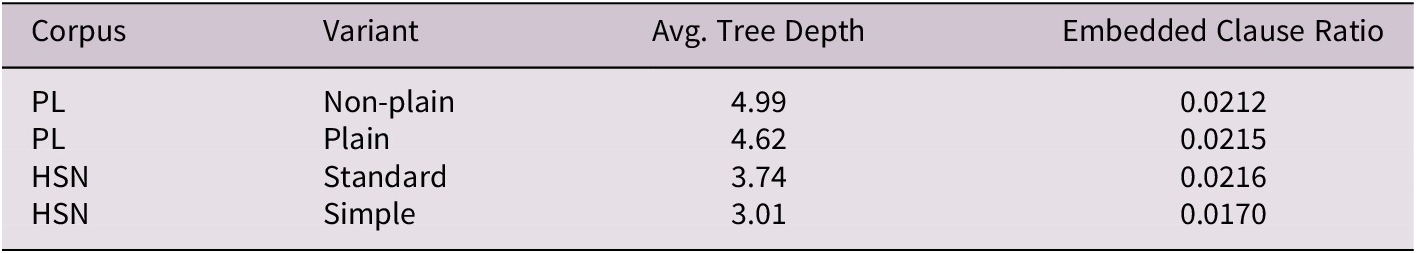
Table 8 summarizes the results, confirming that PLC texts are syntactically more complex than HSN. PL/non-plain has an average parse depth of 4.99, with a slight reduction in PL/plain (4.62). HSN/standard averages 3.74, while HSN/simple is flatter at 3.01.
Syntactic complexity measures by corpus and variant. (Avg. Tree Depth = average depth of the syntactic parse tree per sentence, Embedded Clause Ratio = proportion of clauses embedded within sentences)

Embedded-clause proportions are broadly stable across registers (~2.1%), with only HSN/simple showing a lower value (0.0170). Consistent with this, PL complexity likely reflects other sources (e.g., internal NP modifiers, participial constructions, legal-adverbial phrases, such as ‘within 8 days from receipt of the notification’) rather than more frequent subordination.
The minimal depth reduction from PL/non-plain to PL/plain suggests simplification focuses on clarity (improved word order, reduced redundant modifiers, enhanced thematic salience) rather than flattening clause structure. Such restructuring maintains syntactic depth while improving linearization and prosodic clarity. By contrast, SL actively minimizes embedding. HSN/simple exhibits shallow parse trees and favors linear, one- or two-clause structures with low configurational complexity, aligning with its short sentences and high morphological TTR.
In summary, syntactic complexity differentiates between PL and SL. PL preserves hierarchical structure even under simplification, while SL reduces it to minimize cognitive processing demands.
4.6. Discourse connectives and cohesion strategies
Discourse connectives reveal finer-grained cohesion and coherence differences across registers. We categorized these connectives into five types:
-
• contrastive (e.g., but, although, however),
-
• explanatory (e.g., because, since, therefore),
-
• amplifying (e.g., moreover, in addition),
-
• temporal (e.g., when, after, then), and
-
• exemplifying (e.g., for example),
as these markers guide readers in navigating logical structures and inferring discourse relations.
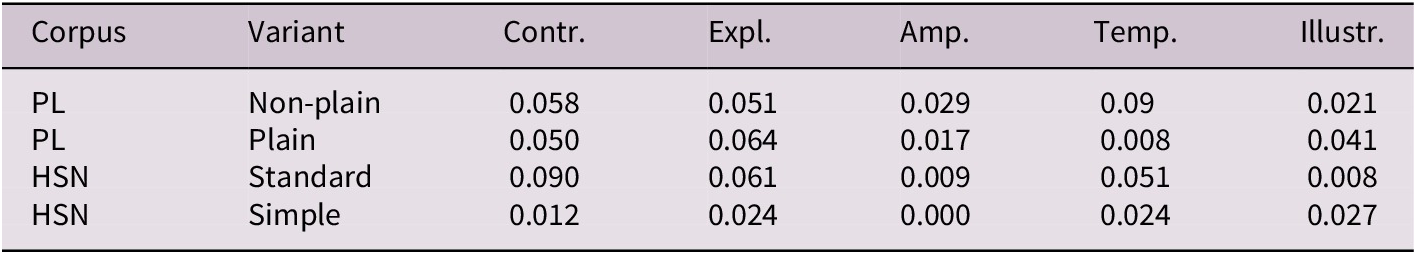
Table 9 shows average connective counts per sentence (in the lemmatized texts). The PL corpus shows moderate usage across categories, higher than SH/simple but lower than HSN/standard. For example, contrastive connectives occur at 0.058 per sentence in PL/non-plain and 0.050 in PL/plain, while HSN/simple has a much lower rate (0.012). HSN/standard employs them more frequently (0.090).
Average number of discourse connectives per sentence across corpora and variants

Note: The columns show the mean frequency of contrastive (Contr.), explanatory (Expl.), amplifying (Amp.), temporal (Temp.) and illustrative (Illustr.) markers per sentence.
Notably, explanatory connectives are more frequent in PL/plain than in PL/non-plain (0.064 versus 0.051), reflecting a strategy that favors explicit marking of logical relations rather than structural flattening. Explanatory connectives (e.g., ‘because’, ‘namely’, ‘therefore’) guide readers through causal, conditional or deductive relations, aligning with PL’s goal of enhancing clarity. In contrast, HSN/simple shows substantial connective reduction. Amplifying, temporal and contrastive markers occur minimally, often below 0.03 per sentence.
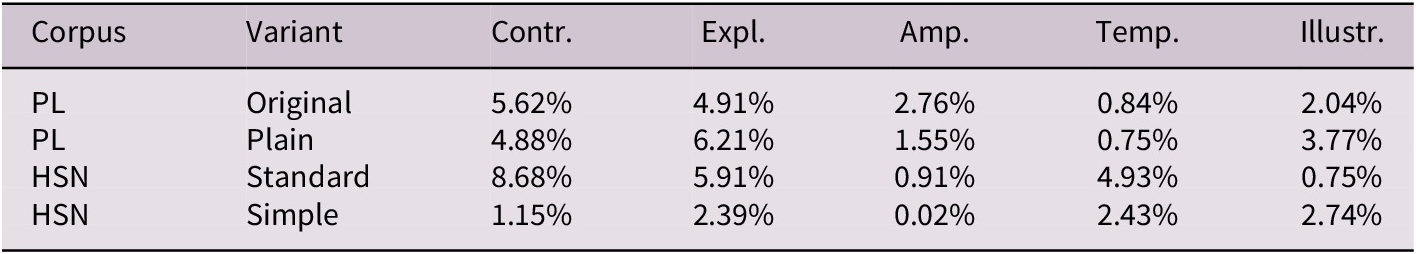
Table 10 shows the percentage of sentences containing at least one connective per type. In PLC, about 5% of sentences contain contrastive connectives, while in HSN/simple, this is just above 1%.
Percentage of sentences containing discourse connectives across corpora

Note: The columns show the proportion of sentences including contrastive (Contr.), explanatory (Expl.), amplifying (Amp.), temporal (Temp.) and illustrative (Illustr.) markers.
In summary, PL sentences increase the visibility of logical structure through explanatory connectives, while SL sentences minimize connective use, favoring structural simplicity and reducing inferential demands.
4.7. Readability and register functionality
Despite their serious limitations (Benjamin, Reference Benjamin2012; Crossley et al., Reference Crossley, Greenfield and McNamara2008), readability metrics provide an additional lens to contrast. Table 11 presents the results of a Flesch-style readability index adapted for Hungarian, based on average sentence length and syllables per word. Higher scores (closer to 100) indicate greater ease of comprehension.
Flesch readability scores and surface text characteristics across corpus and variant

HSN/simple achieves a high average Flesch score of 79.93, categorizing it as ‘very easy to read’ and HSN/standard also scores relatively high (67.79).
In contrast, PL texts show lower general readability. The non-plain variant averages 34.67, with the plain version improving slightly to 41.21. Although sentence length and syllable density decrease (2.41–2.35), PL texts remain in the ‘difficult’ band. This can reflect both PL’s functional constraints (clarifying legally complex content without sacrificing interpretative precision) and register differences between corpora (news versus official texts).
5. Methods
5.1. Feature extraction and selection
Feature selection builds on a targeted literature review and the corpus characteristics described earlier (Sections 2–4). We aim to capture surface, morphosyntactic and discourse-related properties characteristic of PL and SL, aligning feature engineering with prior theoretical distinctions with what our corpora make observable. Crucially, the feature set is designed not only to separate PL and SL but also to identify SL sentences that are proximate to PL because PL training data are scarce and augmentation with linguistically compatible SL instances may improve sentence-level PL detection without conflating registers.
To capture structural and stylistic characteristics of PL and SL sentences, we compute a broad set of linguistic features derived from huSpaCy’s transformer model annotations, supplemented by custom lexical and discourse heuristics. Where relevant, features operationalize PL principles as discussed in Section 2 (e.g., shorter sentences, controlled syntax, transparent cohesion) and SL constraints (e.g., basic vocabulary, explicit scaffolding). The feature set covers the following dimensions:
Surface features
-
• n_tokens: Total number of tokens (words and punctuation) in a sentence.
-
• n_chars: Total number of characters in the sentence.
-
• n_syllables: Estimated total number of syllables (proxy for phonotactic difficulty/processing load).
-
• mean_token_length: Average word length (characters), indicating lexical complexity.
-
• ttr: Type–token ratio, proportion of unique words to total words (lexical diversity).
-
• n_repeats: Number of lemma repetitions (referential consistency/redundancy).
-
• flesch: Adapted Hungarian Flesch readability score (Flesch, Reference Flesch1948).
Morphosyntactic and syntactic features
-
• depth: Maximum depth of the dependency tree (hierarchical complexity).
-
• n_subordinate_clauses: Count of embedded clauses (advcl, ccomp, acl dependencies).
-
• embedded_clause_ratio: Proportion of tokens in embedded clauses.
-
• n_conjunctions: Coordinating conjunctions or conjunct relations.
-
• subj_type: Grammatical category of the main subject (e.g., PRON, NOUN).
-
• n_function_words: Number of function words (pronouns, determiners, auxiliaries).
-
• lexical_density: Proportion of content words (nouns, verbs, adjectives, adverbs) relative to total tokens (information load).
-
• n_topical_nouns: Number of domain-specific (legal or administrative) nouns, representing thematic density.
-
• n_modal_verbs: Number of modal verbs (e.g., must, may, should).
-
• n_nominalizations: Count of deverbal noun forms, indicating abstract or formal expression level.
Discourse and referential features
-
• n_anaphora: Number of anaphoric pronouns (e.g., this, that, they; POS=PRON).
-
• n_lists: Number of enumerative structures (typically after a colon).
-
• starts_with_connective: Binary indicator of sentence-initial connectives.
Connective features (by rhetorical function)
For each connective type, three variables were computed:
-
• n_X: raw frequency
-
• ratio_X: relative frequency (normalized by sentence length)
-
• sent_X: binary presence flag
Here, X stands for the following connective categories:
-
• contrastive: e.g., but, although, however
-
• explanatory: e.g., because, since, therefore
-
• amplifying: e.g., moreover, in addition
-
• temporal: e.g., when, after, then
-
• illustrative: e.g., for example
This feature set supports interpretable machine learning models and quantitative corpus analyses, enabling precise measurement of PL–SL stylistic and structural differences. The same features underpin a PL-likeness score (Section 5.2) used to select SL candidates for augmentation. This targets data efficiency under PL scarcity and tests whether proximity-based augmentation helps detection while avoiding naïve register mixing.
5.2. Classification models and training setup
With the feature space established, we next investigated how these characteristics enable automated differentiation between PL and SL. This section describes the classification framework, including the choice of model architecture, training setup and evaluation protocols. By aligning model design with the linguistic features introduced earlier, we ensured that classifiers captured the structural and stylistic dimensions of PL in a transparent way.
5.2.1. Linguistic predictors of plain language rewriting
Logistic regression estimates statistical associations between input features and a binary target class, making it a valuable tool for interpretability in text classification (Hastie et al., Reference Hastie, Tibshirani and Friedman2009; James et al., Reference James, Witten, Hastie and Tibshirani2021). Positive coefficients indicate features more common in one class (e.g., PL), while negative coefficients indicate the opposing class (e.g., non-PL). We use this coefficient profile operationally to define a PL-likeness score that ranks HSN sentences by their proximity to the PLC ‘plain’ sub-corpus. Together with the analogous HSN model (Section 5.2.2) and the comparison in Section 5.2.3, this enables the motivated cross-register augmentation strategy evaluated later.
We trained a logistic regression model on the PLC (Section 3.1). The model achieved F1 = 0.58 (accuracy: 0.58). Despite moderate predictive performance, the coefficient profile is useful for the interpretation of feature associations.
According to the results (Figure 1), PL sentences are associated with:
-
• Higher type-token ratio (ttr: β = 0.55).
-
• More illustrative markers and lists (n_illustrative: β = 0.49, sent_illustrative: β = 0.13, n_lists: β = 0.009).
-
• More modal verbs (n_modal_verbs: β = 0.26).
-
• Higher counts of explanatory connectives (n_explanatory: β = 0.12, sent_explanatory: β = 0.08, ratio_explanatory: β = 0.08).
-
• More coordinating conjunctions (n_conjunctions: β = 0.08).
Coefficients from logistic regression trained on PL sentences only. Positive values (blue) indicate greater likelihood of ‘plain’ classification, whereas negative values (red) indicate greater likelihood of ‘non-plain’ classification.

In contrast, negative associations include:
-
• Lower lexical density (lexical_density: β = −1.23).
-
• Fewer anaphora and embedded clauses (n_anaphora: β = −0.27, embedded_clause_ratio: β = −0.26).
-
• Reduced intensification and contrastive discourse markers (sent_amplifying: β = −0.26, n_contrastive: β = −0.25).
-
• Fewer intensifiers, abstract markers and nominalizations (n_amplifying: β = −0.19, n_nominalizations: β = −0.06).
We note that ttr is length-sensitive; sentence-level results should be read with this caveat.
5.2.2. Linguistic predictors of simple language
We trained an analogous logistic-regression model to distinguish simple versus standard sentences in HSN. Figure 2 shows the distinct coefficient profile for SL. The strongest positive coefficients are:
-
• lexical_density (β = 1.41),
-
• n_lists (β = 0.943),
-
• sent_illustrative (β = 0.897) and n_illustrative (β = 0.895),
-
• n_modal_verbs (β = 0.331) and
-
• ttr (β = 0.212).
Coefficients from logistic regression trained on simple versus standard HSN sentences. Positive values (blue) indicate associations with the ‘simple’ label, whereas negative values (red) indicate associations with the ‘standard’ label.

Negative coefficients are observed for:
-
• n_amplifying (β = −1.456) and sent_amplifying (β = −1.450),
-
• n_contrastive (β = −0.689) and sent_contrastive (β = −0.658),
-
• n_explanatory (β = −0.261),
-
• n_topical_nouns (β = −0.817) and
-
• n_subordinate_clauses (β = −0.357).
5.2.3. Comparing plain and simple language registers
Building on the two models, we compared signs and magnitudes of selected coefficients (see Table 12). We observe overlaps (e.g., some positive association of ttr in both PLC and HSN) and divergences (e.g., lexical_density negatively associated with PLC ‘plain’ but positively with HSN ‘simple’; fewer embedded clauses in both datasets but stronger list/illustrative associations in HSN). The ttr observation should be interpreted cautiously because ttr is sensitive to sentence length. Regarding ‘n_topical_nouns’ versus lexical_density, the former indexes domain-specific terminology, whereas the latter is the ratio of content to function words; these metrics capture different dimensions and can move in opposite directions.
Comparison of logistic regression coefficients for selected linguistic features

Note: Positive values indicate association with the plain or simple label, respectively.
This coefficient profile later underpins a PL-likeness score to rank HSN sentences by proximity to PLC ‘plain’ sentences. From a modeling perspective, direct cross-register transfer is likely limited. A model trained on PLC may underrepresent patterns prominent in HSN and vice versa. Accordingly, augmentation should avoid naive mixing; instead, selection is guided by proximity in the feature space (see next section).
5.2.4. Scoring-based selection of SL sentences for PL augmentation
To augment PLC with HSN instances, we implemented a coefficient-weighted scoring to identify simple sentences most similar to PLC ‘plain’ along the selected features. The aim is to test whether proximity-based augmentation benefits PL detection under scarcity. HSN simple sentences were ranked by a PL-likeness score computed as a weighted sum of standardized features (top-k features by absolute PLC coefficients, for details, see Appendix A):
 $$ {\mathrm{Score}}_{\mathrm{i}}=\sum \limits_{j=1}^n{w}_j\times {z}_{ij} $$
Here, Score i is the PL-likeness score of sentence i, n is the number of selected features, wj is the coefficient of feature j (derived from the PL classification model), and zij is the z-score normalized value of feature j in sentence i.
This approach allowed us to isolate high-confidence PL-like instances from HSN in a controlled, interpretable manner. To ensure a proportional contribution of features to the score, we standardized them using z-score normalization (Izenman, Reference Izenman2008), as features are measured on different scales (e.g., number of tokens versus lexical ratios). The z-score was computed in the standard way as follows:
 $$ {z}_{ij}=\frac{x_{ij}-{\mu}_j}{\sigma_j} $$
Here, xij is the raw value of feature j for sentence i, and $ {\mu}_j $
and
$ {\mu}_j $
and $ {\sigma}_j $
are the mean and standard deviation of feature j computed over all sentences under consideration.
$ {\sigma}_j $
are the mean and standard deviation of feature j computed over all sentences under consideration.
Standardization was applied to HSN only, since PLC sentences were not scored. Candidates were sorted by Score i and the top-k% were selected (k ∈ {5, 10, 25, 100}). This procedure is interpretable and controllable; however, it does not guarantee gains and is evaluated empirically in Section 6.
5.3. Data augmentation techniques
As a first step, we established a baseline for PL classification and then augmented it with selected instances from the HSN corpus. Evaluation uses the same held-out PLC subset across conditions, with only training/validation composition varying.
5.3.1. Augmentation methodology
Two settings were compared:
-
• PL-only model (trained exclusively on PLC), and.
-
• PLC + HSN-k%: (PLC plus top-k% HSN simple sentences by PL-likeness).
All comparisons are on the same, fixed PLC test set.
5.3.2. Creation of augmented training sets
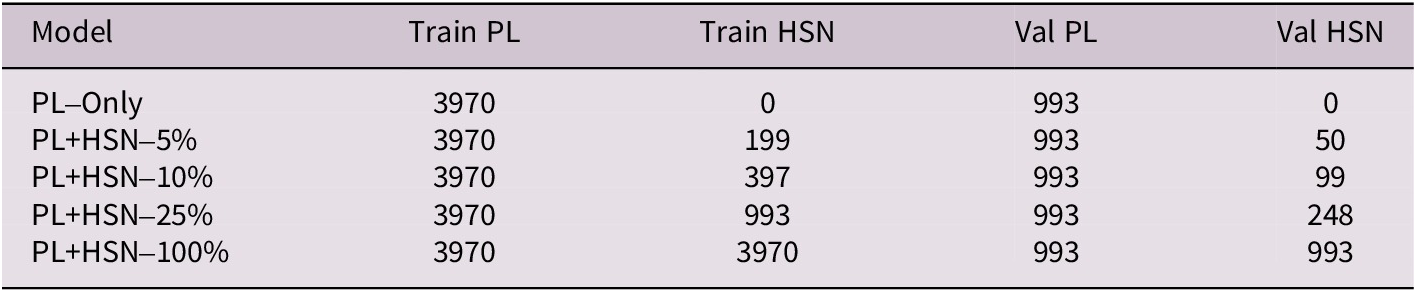
The original (PLC) training set contained 4,963 ‘plain’ sentences. Four augmented sets were created by adding HSN simple sentences at 5%, 10%, 25% and 100% of the plain-class size (cf. Table 13). Only positively scored candidates were considered; in practice, this did not constrain the larger settings. All augmented sets were shuffled before training. The non-plain class remained unchanged.
Baseline and augmented training/validation compositions

Note: PLC-only uses only PLC instances; PLC + HSN-100% adds an equal number of HSN sentences to the corpus.
5.4. Implementation details
We used XLM-RoBERTa-large (Conneau et al., Reference Conneau, Khandelwal, Goyal, Chaudhary, Wenzek, Guzmán, Grave, Ott, Zettlemoyer and Stoyanov2020) as the backbone for sentence-level classification. In a recent comparative evaluation of Transformer-based models for PL classification in Hungarian (Anonymous, 2025), XLM-RoBERTa-large achieved the highest performance among all tested architectures, including the first Hungarian BERT model, huBERT (Nemeskey et al., Reference Nemeskey, Váradi and Sass2021), XLM-RoBERTa-base and proprietary LLMs such as Gemini 1.0 Pro (Google, 2023) and GPT-4o-mini (OpenAI, 2024). Its advantage was particularly evident in cross-domain evaluation and low-resource settings, where other models tended to overfit or underperform. We attribute this result to XLM-R’s robust subword tokenization, strong multilingual pretraining (including substantial Hungarian coverage) and deep representational capacity, which enable it to capture register-sensitive characteristics beyond surface-level syntax or token frequency.
6. Results and discussion
6.1. Evaluation of the baseline model
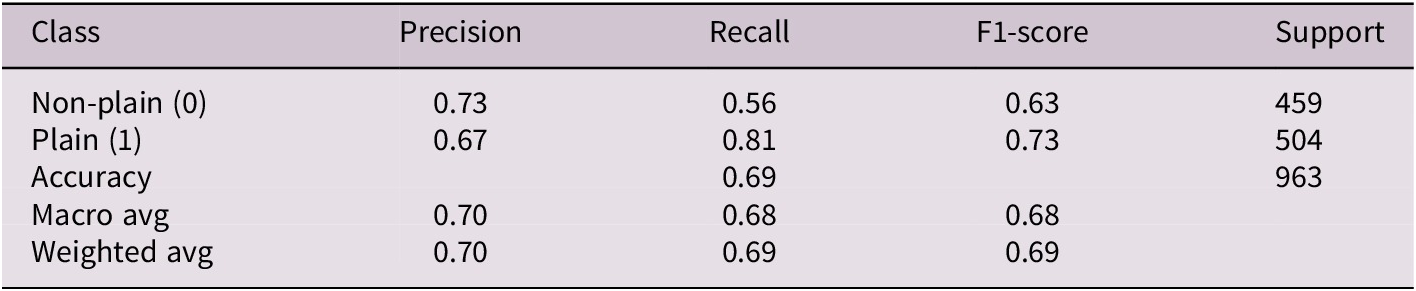
As a baseline, we fine-tuned the XLM-RoBERTa-large model using only the sentence pairs labeled as changed in the Plain Language corpus (cf. Section 3.1). The model was trained as a binary classifier, distinguishing plain (label 1) from non-plain (label 0) sentences. The evaluation was performed on a held-out test set comprising 963 stratified examples.
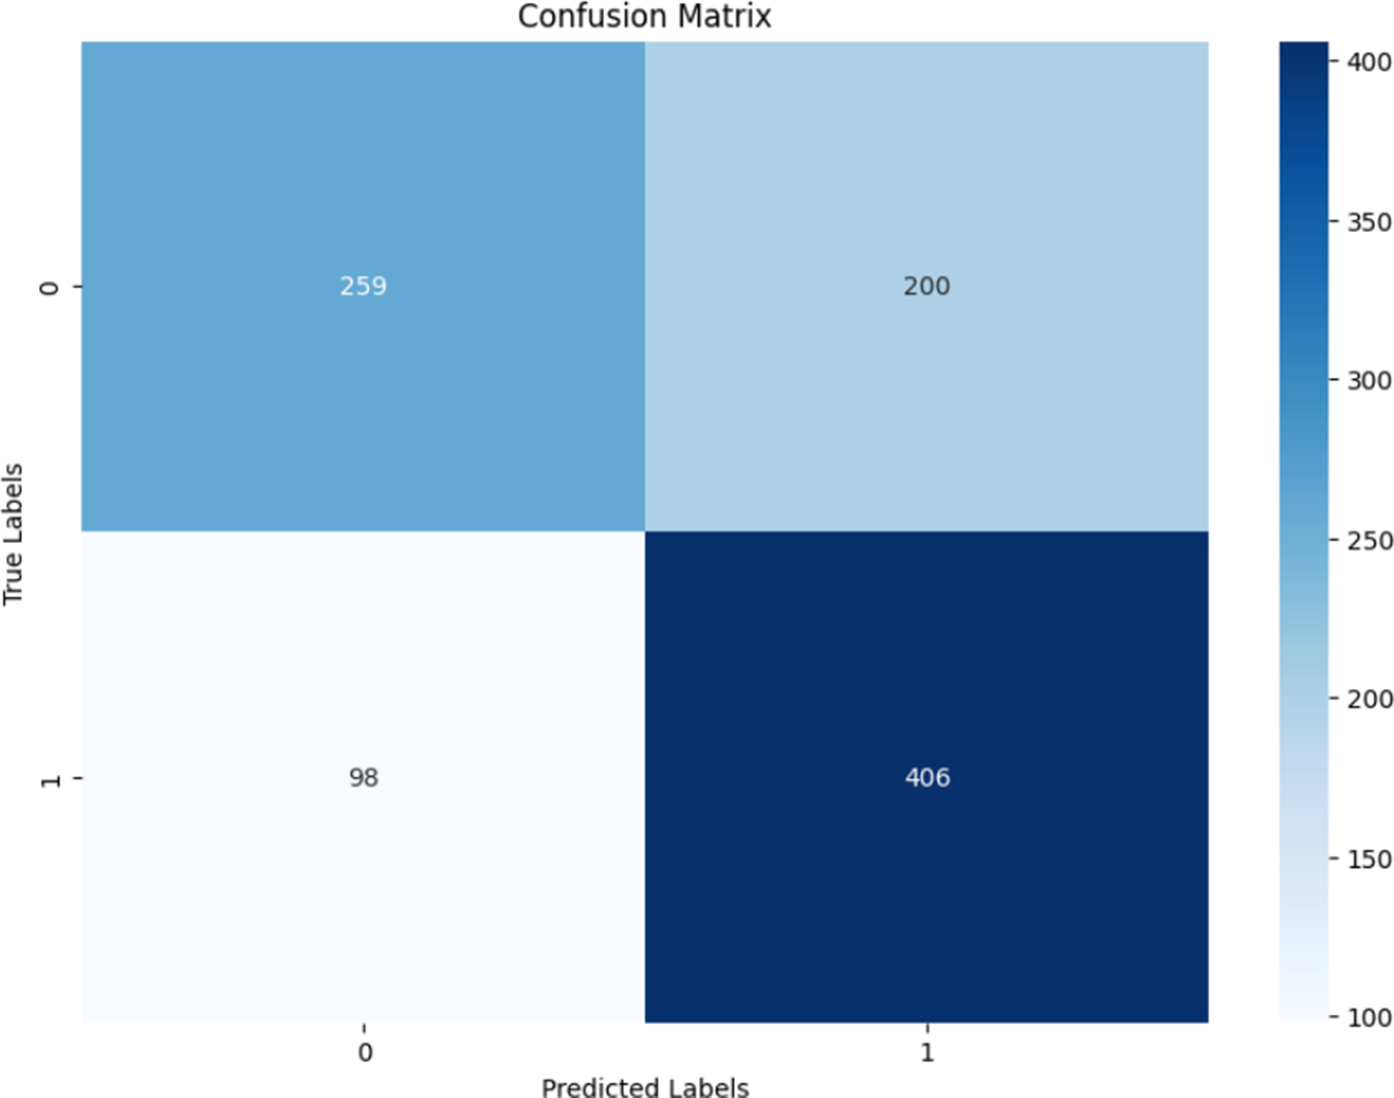
Table 14 summarizes the performance metrics. The model achieved an overall accuracy of 69%, with an F1 score of 0.73 for the plain class and 0.63 for the non-plain. Precision and recall were reasonably balanced, although the classifier tended to favor plain labels, as shown in the confusion matrix in Figure 3.
Classification metrics (precision, recall, F1) for the PL-only model, evaluated on the held-out PL test set (non-plain versus plain instances)

Confusion matrix for the PL-only model. Label 1 = plain; label 0 = non-plain.

The results suggest that the model captures important stylistic and structural features of PL sentences but struggles with ambiguous or borderline cases, particularly in identifying non-plain constructions. These limitations motivate the exploration of augmentation strategies, which are discussed in the next section.
6.2. Evaluating the effectiveness of SL-based augmentation for PL classification
This section interprets the experimental results on augmenting the PLC/plain class with systematically selected HSN sentences. The central goal was to assess whether HSN sentences with high PL-likeness can improve classifier performance for legal–administrative texts.
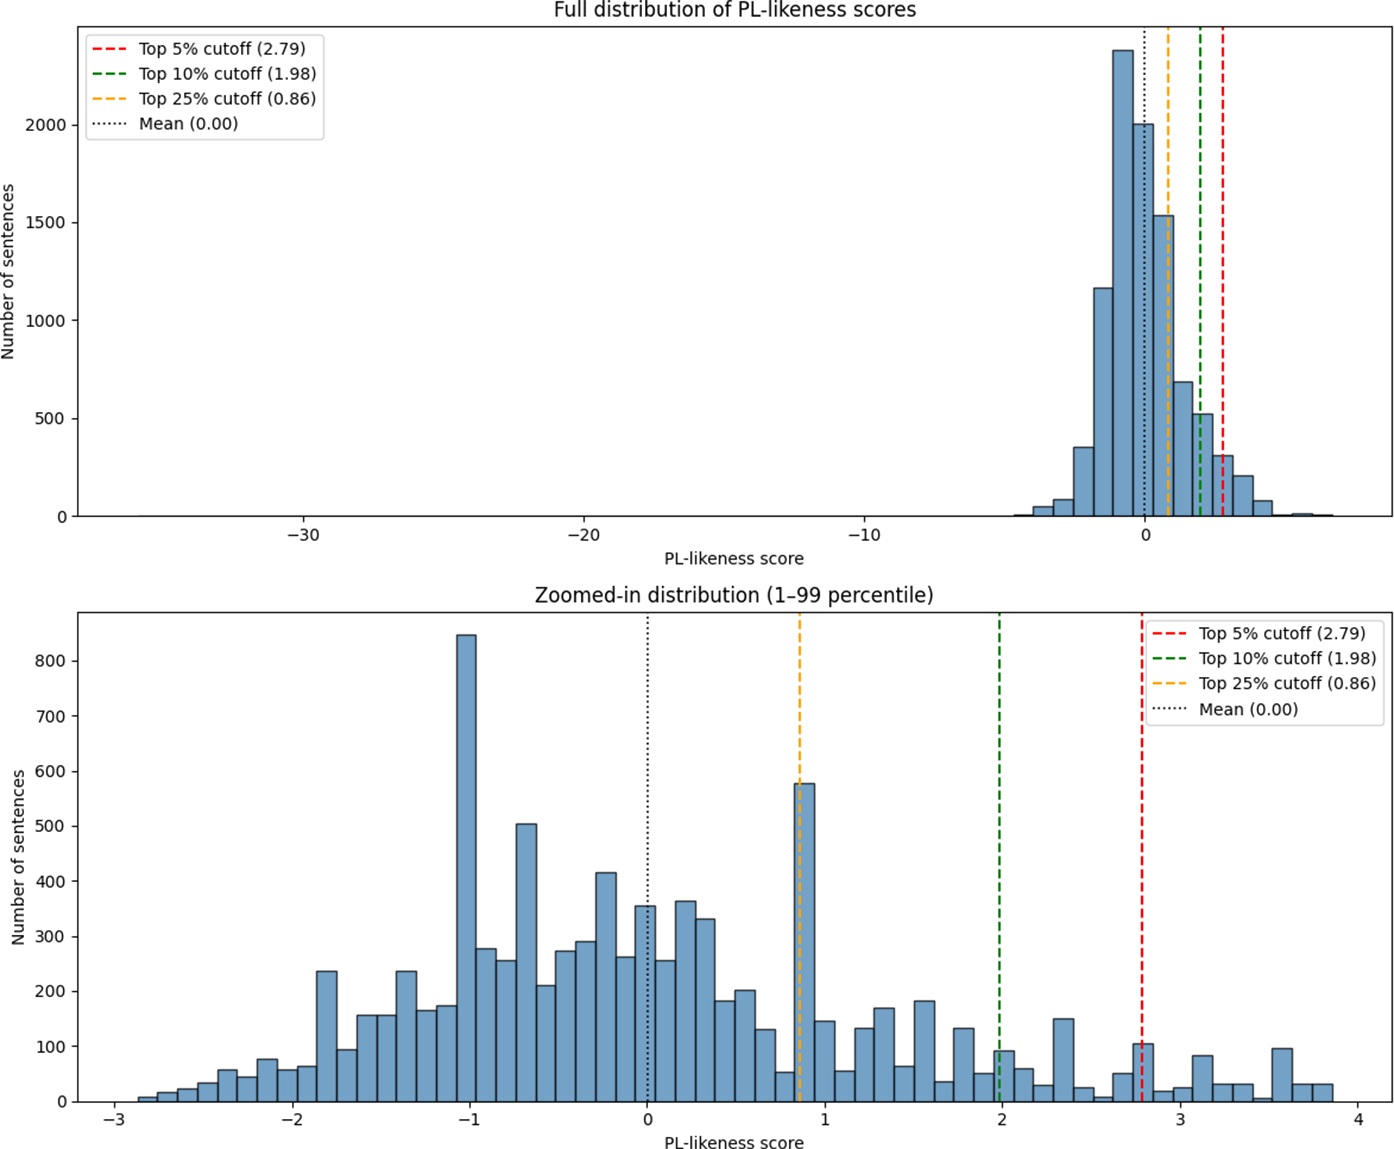
The measured PL-likeness scores (Figure 4) for HSN/simple sentences show that most instances cluster near zero due to z-score normalization. However, a subset falls within the top 5%–10%, suggesting that these sentences share characteristics with PL, including simplified syntax, accessible vocabulary and lower structural complexity, making them promising augmentation candidates.
Distribution of PL-likeness scores for HSN/simple sentences. The top chart shows the full range, the bottom chart zooms into the 1st to 99th percentiles. Vertical lines indicate cutoffs for the top 5%, 10% and 25% of scores.

However, augmentation benefits were not consistently monotonic. As shown in Figure 5, modest augmentation (5%) improved all metrics except plain class precision, which remained unchanged from the baseline. At 10%, precision increased slightly but recall and F1 declined. This suggests that the model became more conservative in assigning the plain label (fewer false positives), but missed more true positives, as indicated by lower recall and F1. Overall performance (macro and weighted averages, Table 15) remained stable between 5% and 10%, indicating augmentation offers limited benefits beyond a narrow range.
Effect of PL-likeness-based augmentation with HSN data on classification performance across F1-score, precision and recall for both classes.

Classification results across augmentation levels

When the augmentation rate increases to 25%, performance gains plateau. At 100%, when all HSN sentences with PL-likeness scores are added as plain examples, model discrimination deteriorates. Precision and recall for the non-PL class drop, while PL class recall rises sharply, indicating overgeneralization as the model increasingly predicts PL labels for structurally or semantically inappropriate inputs.
A critical concern is class imbalance. High augmentation rates can cause the training data to be dominated by plain-labeled sentences, as all HSN examples are assigned to this label. This shift may affect optimization dynamics, with the loss function overly influenced by the dominant class. As a result, the model becomes prone to plain class predictions, reducing sensitivity to the complex syntax and formal terminology of non-plain texts. However, balanced performance remains achievable with appropriate regularization, weighting or resampling strategies when sufficient training data are available (Buda et al., Reference Buda, Maki and Mazurowski2018).
Interestingly, overall recall improves with more augmentation (reaching 0.84 for full HSN inclusion) but at the cost of precision, which drops to 0.67, indicating more false positives for the plain class. The 5% and 25% augmentation levels yield similar accuracy (0.70) and F1-scores (0.74 and 0.70), differing mainly in recall and precision balance. This reflects a classic trade-off: increased permissiveness captures more true positives but misclassifies more non-plain inputs.
Notably, while including all HSN sentences yields the highest recall and F1-score (0.75), this improvement warrants caution. It may result from overfitting to superficially simple but functionally misaligned patterns rather than genuine domain alignment with legal-administrative plainness. Thus, the performance boost masks degraded semantic fidelity.
This raises a second concern: the functional and register-level fidelity of the non-plain class. While augmenting it with standard HSN sentences could correct class imbalance, this strategy neglects the linguistic specificity of non-plain data. Standard HSN sentences, though not plain, are less complex than legal–administrative texts. Adding them creates a heterogeneous training signal that may impair the model’s ability to learn bureaucratic and legal–administrative language characteristics defining both PLC classes. Consequently, the classifier risks learning an impoverished decision boundary. Instead of distinguishing legally normative, citizen-facing plainness from formal institutional legalese, it may only differentiate based on syntactic complexity, confounding generalization across registers and reducing utility where legal clarity is critical.
Overall, these findings highlight that augmentation success depends not just on syntactic similarity but also on pragmatic and register alignment. PL is not merely structural simplification but a functional mode of legal communication. Augmenting PL with non-legal but structurally similar examples risks introducing noise. Similarly, augmenting the non-plain class with general language fails to reinforce features defining bureaucratic or juridical complexity.
In sum, SL-based augmentation in PL contexts is viable only under carefully constrained, linguistically informed conditions. The top 5%–10% of HSN sentences with high PL-likeness scores offer measurable improvements and are relatively safe. Beyond this, gains are illusory, and representational fidelity of both classes is compromised.
7. Conclusion
Our corpus-based analysis indicates that Hungarian Plain Language (PL) and Simple Language (SL) are related but distinct as instantiated in the two available resources we study. At the sentence level, we observe consistent differences in length, lexical diversity, syntactic depth, part-of-speech distributions and discourse connective usage. In our data, PL sentences are longer and structurally deeper on average, whereas SL sentences are shorter and achieve higher scores on a Hungarian Flesch-style index. PL/plain sentences use explanatory connectives more often than PL/non-plain, while SL/simple reduces connective use overall. At the same time, some tendencies converge across registers when comparing each simplified variant to its own original: both PL/plain and SL/simple show fewer embedded clauses than their respective counterparts. It should be noted, however, that these statements summarize observed distributions in the two corpora rather than effects outside them.
Within this empirical setting, selective inclusion of SL sentences offers limited support for sentence-level PL detection. Adding the top 5%–10% of HSN/simple sentences ranked by PL-likeness yields small, measurable gains. Beyond this range (e.g., 25%), improvements plateau, and at full inclusion model discrimination deteriorates, with increased overprediction of the plain label. These outcomes are sensitive to the augmentation threshold and reflect interactions with class composition and source provenance.
Taken together, the results support a register-aware approach to corpus design and model training for PL detection. Feature-guided selection can identify SL instances that are structurally compatible with PL and can be used in low proportions under data scarcity, but gains remain modest and depend on alignment with the target register.
Future work should expand legal-administrative PL resources and examine document-level context to test whether sentence-level tendencies persist when discourse organization is modeled directly. Given that data scarcity persists, it is also worth exploring alternative augmentation strategies, such as Easy Data Augmentation, Large Language Model-based synthetic example generation, or machine translation and multilingual models. While these are less linguistically motivated, they could exploit language models’ capacity for controllable paraphrastic variation, lexical and syntactic perturbations, and class-conditioned sampling if register alignment and source provenance are monitored and evaluation remains strictly corpus-based.
Appendix A. Feature Weights Used in HSN Sentence Ranking
To identify HSN sentences suitable for augmenting the PL classification model, we ranked all HSN items using a scoring function based on the ten most influential linguistic features from the logistic regression model trained on changed PL sentence pairs. These features were selected based on the absolute value of their coefficients, indicating their predictive strength. Each HSN sentence received a composite compatibility score computed as a weighted sum of its normalized (z-scored) feature values, using the PL model’s coefficients as weights.
Table A1 lists the features used in this scoring procedure along with their respective weights.
Top 10 linguistic features and coefficients from the PL (logistic regression) model used for scoring HSN sentences

Note: Positive weights indicate alignment with plain language characteristics; negative weights suggest divergence.
Each feature was standardized across the HSN dataset using z-score normalization:
 $$ {z}_i=\frac{x_i-{\mu}_j}{\sigma_j} $$
where xi is the raw value of feature i for a given sentence, $ {\mu}_j $
is the mean and
$ {\mu}_j $
is the mean and $ {\sigma}_j $
is the standard deviation of feature i across all HSN sentences.
$ {\sigma}_j $
is the standard deviation of feature i across all HSN sentences.
The final sentence score was computed as follows:
 $$ \mathrm{score}=\sum \limits_{i=1}^{10}{\beta}_i{z}_i $$
where $ {\beta}_i $
denotes the logistic regression coefficient for feature i in the PL model. Sentences with higher scores are considered more stylistically compatible with the plain register and were prioritized during data augmentation.
$ {\beta}_i $
denotes the logistic regression coefficient for feature i in the PL model. Sentences with higher scores are considered more stylistically compatible with the plain register and were prioritized during data augmentation.


 Open access