
The study of wealth in the Vesuvian cities, as in the Roman world more generally, has been dominated by analyses of the property and liquid savings of elite families and of the activities of freedmen-bankers/moneylenders like Caecilius Iucundus or the Sulpicii.Footnote 1 Non-elite savings have been relegated to footnotes in works on the expansion of monetization and credit, or considered peripherally in studies on artisans, merchants, or freedmen and their efforts toward and capacity for social mobility.Footnote 2 The evidence for non-elite savings is nowhere near as consolidated as the tablets of the Vesuvian banking/moneylending families or the self-declared sums in euergetistic inscriptions. Aside from a handful of graffiti describing loans and collateral, the most numerically significant source consists of the coins and other valuables owned by the cities’ non-elite denizens – evidence which, until recently, was published only as case studies and thus eluded quantitative study.
This article uses the recent publication of Pompeiian coin finds (the Rinvenimenti monetali a Pompei, hereafter RMP) to provide some estimates for liquid savings owned by a cross section of the city's population.Footnote 3 The quantitative possibilities presented by these exacting, if still incomplete, new publications make it possible to estimate both the savings carried by individual victims of the eruption and the savings stored in cash boxes abandoned in houses and shops. There are, as will be readily imagined, many problems with these data, and, as will be discussed below, they provide some of the starkest evidence to date against the so-called Pompeii Premise. Indeed, the biases in the finds provide some suggestions about the identity of those left behind during the eruption, who may have constituted a particular subset of the city's population and thus a particularly skewed profile of its liquid savings. In both their biases and their quantity, however, the data reveal something of the nature and distribution of liquid savings in the city at the time. When set against data for non-elite consumption, which I presented in an earlier article, these finds describe the particular challenges faced by non-elites in a city with high consumption levels.Footnote 4
Savings and non-elites
Savings are what remains from income after expenses are met. They may constitute not only surplus wages but also surplus crops, seeds reserved for future plantings, and other reserved raw materials. A broader definition might also include those assets into which savings from income are converted – work animals, slaves, real estate, tools, etc. – assets that are typically considered under the separate rubric of “capital” but that, for poorer people, are often thought of and used in similar ways as other kinds of savings.Footnote 5 Indeed, in Piketty's unusually broad definition, savings are simply a particular subset of capital, and capital is any asset that can be owned and traded on any kind of market.Footnote 6
This broader definition of savings also overlaps with definitions of wealth. Wealth is typically defined as the sum total of all assets – liquid and illiquid – minus debts, and thus includes savings, along with other property not typically classed as savings – real estate and movable objects of value. The terms “wealth” and “savings” are biased in their usage: “wealth” is not a term typically used to describe the assets of the non-wealthy, just as the term “savings” is rarely used to describe the reserves of the rich. A principal component of wealth is land, and for the ancient world land is assumed to have constituted the most significant container of wealth, in terms of both value and status.Footnote 7 For non-elite urban populations like those under analysis here, landownership is poorly documented and thus often assumed to be infrequent and an insignificant part of total wealth.Footnote 8 As I will discuss below, however, there are reasons to believe that at least some non-elite Pompeiians owned their own houses, and thus real estate will need to be considered as a fixed asset into which savings were converted.
This study is concerned above all with liquid savings, principally but not exclusively coins. As has become increasingly clear in recent decades, the Roman urban world of the 1st c. CE and the Vesuvian cities in particular were relatively highly monetized in two senses: not only was money abundant and the most common unit of exchange but, just as importantly, it was the principal unit of account.Footnote 9 Even in-kind or credit transactions were accounted and tracked in monetary units, and those habits seem to have been common to all classes of society, particularly in cities, where coin supply and coin use was particularly concentrated. Liquidity is defined as the ease with which an asset can be exchanged on a market for a predictable price. Coins, through both their bullion and their fiduciary value, were thus among the most liquid of Roman savings vehicles, although, as discussed below, they shared that property with other objects of bullion value.
For the poor or for non-elites more generally, savings of all kinds served two major functions. First and most importantly, they buffered and smoothed out erratic incomes and provided a monetary safeguard against catastrophe – the death of a labor- or income-producing family member, a bad harvest, a house fire. The importance of these kinds of savings has long been recognized in studies of the ancient peasantry.Footnote 10 Crop and seed storage, food preservation, and other “risk-reducing” strategies have been widely documented among agricultural populations, but their monetary equivalent is rarely discussed, in part because peasants have been assumed to form part of a “coinless” countryside.Footnote 11 In monetized societies, particularly urban monetized societies, savings as a risk-mitigation tool can take monetary form, as well as non-liquid forms like real estate and crop storage. Indeed, the ability of many modern populations, even in industrialized countries, to accrue enough savings of various kinds to withstand economic volatility is now thought key to the escape from poverty traps.Footnote 12
Second, when properly applied, savings act as a lever, pulling a family out of contexts of risk into more secure economic settings. Typically, this leverage is applied by converting savings to capital – equipment or stock animals, extra labor or more raw materials, a new house to boost one's status and expand one's social network – in short, by investment in greater future earnings, and thus greater savings and more capital. These kinds of “capital investments” are typically beyond the earning capacities of poorer people, and earlier studies assumed that this kind of “investment” mentality simply did not pertain to ancient people generally and to non-elites specifically.Footnote 13 However, from a female woolworker who assembled enough savings to leave behind a complex will, to an Egyptian woman who bought up more wool than she could spin herself and outsourced it to other spinners, to soldiers on the frontier buying up commodities for processing and further resale, it is clear that at least some Roman non-elites invested their savings, even if small in scale, in opportunities to improve their future incomes.Footnote 14
The data: problems and methods
For the last two decades, a collaborative project between the Centro Internazionale di Studi Numismatici in Naples and the numismatists at the major central Italian universities, together with the (originally termed) Soprintendenza Archeologica di Napoli e di Pompei, has undertaken a systematic and rigorous study of the coins from Pompeii, using both published and unpublished historical excavation documentation, as well as the actual coins stored in the Medagliere del Museo di Napoli and at the site itself.Footnote 15 Beginning in 2005, the project has published the coin finds by region of the city in the RMP catalogs and, most significantly for any study of the distribution of savings, has included careful notes on the context of each find.Footnote 16 Thus, not only are all the numismatic details of each coin given when possible, but also the building number and room, details about the find context, and information about other objects found with the coins.
Coins in these catalogs are thus distinguished as accompanying skeletons (gruzzoli), found in savings boxes (ripostigli), or loose finds (sporadico).Footnote 17 “Skeletal hoards” are defined as spatially concentrated hoards or single coins plus other valuables found alongside one or more skeletons or body cavities, occasionally with remnants of the bag or other container in which they were carried. “Savings-box hoards” are defined as hoards found in a container – a box, moneybox, dolium, etc. Only hoards containing coins were included in these catalogs; hoards composed solely of other valuables were not included.Footnote 18 For the present study, I examined only those hoards for which contextual information was available, that could be identified with a person or a savings box, and that contained at least one coin. Thus, this study focuses exclusively on coins in use in 79 CE and attributed to a person or a savings cache.Footnote 19 To the skeletal hoard data were added some 72 examples published in the 2004 Storie da un'eruzione exhibition catalog from regions not yet published by the RMP catalogs.Footnote 20
The problems with this information as a data set on savings are legion and worth elaborating in some detail.Footnote 21 Most significant are questions about the formation processes by which these coins entered the archaeological record. As is now clear, the majority of Pompeii's population was able to escape the city during the more than 17 hours between the eruption's start and the pyroclastic density currents that killed those who remained.Footnote 22 As is evidenced by those who remained and were burdened by both coins and other valuables, the escapees would have carried with them their most immediately portable valuables.Footnote 23 Thus, an unknown percentage of liquid savings left the city, while the savings that remained, as described by the skeletal hoards and other valuables, are strongly skewed by the particular socio-demographics of those who remained and died. While the skeletal evidence has suggested that these victims comprised an even cross section of the city's population, there are reasons to be skeptical of this, as will be discussed in detail below.Footnote 24 Further savings, albeit a much smaller percentage, will have left the city through the “rescue” excavations carried out in the immediate aftermath of the eruption: the most intrusive of these, it has been suggested, may have been carried out by the state, but individuals also returned to search for missing valuables.Footnote 25 Finally, the degree to which Pompeiian savings even resided principally in portable, liquid form, versus in immovables like real estate or credit instruments, is unknown: the degree to which coins, and the coins from skeletal and savings-box hoards in particular, are actually a proxy for savings is a question, not a given, and one to which I will return throughout this article.
The liquid savings remaining in the city can only cautiously be related to the spaces in which they were found. Many of the coin boxes were found empty; some, containing only a coin or two, may represent the remains of what had been larger savings.Footnote 26 Victims may not have died in their normal places of residence; attempts to move to places of greater safety or to band together with other refugees may have resulted in abnormal spatial distribution patterns for skeletal hoards.Footnote 27 While this is most obvious in the case of victims found in streets or public spaces, other spaces like houses may also be subject to this flight bias.
The excavated coins themselves display significant biases and problems. Still awaiting publication are Regions II, III, IV, V, and VIII. Of these, only Region VIII was largely excavated and contains significant domestic and commercial space; its absence from the corpus is thus a significant lacuna, although some of the skeletal hoards from this region were included in the 2004 exhibition catalog. As is well known, the quality of the excavation documentation from Pompeii is uneven, and the treatment of the numismatic data is subject to additional irregularities during the site's more than 250 years of excavation. In some instances, the findspot of a hoard is unclear and cannot be attributed to a known space. In many cases, coin groups were classified as “sporadic” finds in the absence of documentation, although they may well have been skeletal or savings-box hoards. More common, although not frequent, is the absence of a detailed list of coins – particularly low-denomination bronze coins – when hoards are listed as simply as an “ammasso.” This problem was particularly acute in the 72 skeletal hoard entries culled from the Storia da un'eruzione exhibition catalog.Footnote 28 Finally, and as will be argued below, other valuable objects besides coins are a critical component of liquid savings. While some of those objects – jewelry and plate – were particularly well documented in the 2004 exhibition catalog, and the RMP catalogers often made a valiant effort to include this information alongside the numismatic data, it was also unevenly noted, particularly for Region VII. Other objects of stored savings, particularly textiles, are generally not well preserved nor noted in the reports, and I will again return to this issue below.
Each of the RMP catalogs includes a series of exacting analyses of the coin data, and a recent dissertation also presents some examination of these data sets.Footnote 29 For a variety of reasons, none of these analyses could be fully utilized for this study. First, because the database on which the regional catalogs were based is not publicly available, it was impossible to easily aggregate the data from individual regions.Footnote 30 As part of the present study, I therefore rebuilt this database using the printed catalogs so as to both aggregate data across regions and to perform different calculations. Second, the catalogs do not specifically address value in context – the specific topic of the present study – but rather are concerned with other, allied subjects, particularly the diffusion and location of different denominations and issues. The two published articles that analyze value across some of the published regions seem to have agglomerated all three find contexts (skeletons, savings boxes, and “sporadic” finds), and they perform other calculations not directly applicable to the present study.Footnote 31 While important for understanding the overall quantities of money in circulation in the city, this bulk information is contextually too imprecise to be used to study individual or household liquid savings, although it contains other important observations. Finally, while some of these analyses provide some interesting data on coin finds in specific types of locations – i.e., houses and their specific parts, shops, and streets – more precise information on house/shop size was included in the present study.Footnote 32 Insofar as findspots might be indicative of socioeconomic or occupational status, this more granular spatial data was important for parsing the savings of different segments of the population, and it produced significant, if unexpected results. Spatial differences at the neighborhood level are so well studied in these catalogs, however, that they are not considered here.
The resulting database used for this study was thus composed of 431 hoards: 206 skeletal hoards and 225 savings-box hoards, for a total of some 25,430 individual coins. Finds classed as sporadico (“loose”) were not included in the study, nor was the handful of hoards for which no coin quantities were given. In order to capture any possible differences in liquid savings carried on victims versus left behind in houses or residences, the skeletal and savings-box contexts were analyzed separately. Many savings boxes found in the excavations were empty, suggesting that victims took most of their liquid wealth with them, and thus it was important to test the possibility that wealth left in houses might be different in value or character from that carried by victims.Footnote 33 For all hoards in each contextual category, the following were recorded: address, room (where known), functional type of the space in question (house, commercial, street, public building), and size of that space – both in square meters and by Wallace-Hadrill's size quartiles.Footnote 34
The value in sesterces for each hoard was computed using the denomination equivalencies introduced by the Augustan reforms.Footnote 35 In many instances duopondi and asses were classed in the catalogs simply as “medium” denominations. As asses outnumbered duopondi among known denominations approximately four to one, these unclassed “medium” bronzes were valued at 0.26 HS.Footnote 36 Similarly, bronzes classed as “small” were valued as quadrantes, as these were the most common fraction. Bronzes with no known denomination were valued at 0.33 HS. Denomination groups (usually bronze) from hoards with no number given but described as an “ammasso” (large quantity), only some 10 cases in total, were assigned an arbitrary number of 10. Finally, multiple savings boxes from a single space, typically a house or shop, were agglomerated into a single entry to produce a savings figure for that space.
The resulting data sets for skeletal hoards and savings boxes were then grouped into the value ranges adopted by the RMP catalogs: 1–10 HS, 11–50 HS, 51–150 HS, 151–300 HS, 301–600 HS, 601–1,000 HS; and 1,000+ HS. Not only did the adoption of these ranges make the findings of the present study comparable with the RMP catalogs, but, as will become clear below, calculations performed on the data set as a whole were heavily impacted by its highly unequal distribution. For this reason, range-based analyses were far more revealing than gross averages.
Finally, I also recorded other valuables either carried with the deceased or found in the savings boxes. These consisted principally of objects made of precious metal, the most common being gold earrings, bracelets, and rings but also gems, silver and bronze vessels, silver mirrors, and even occasionally iron tools. A number of victims also carried keys, while the saving boxes often included household objects such as lamps and metal tools, as well as small objects of seemingly sentimental value: shells, tiny statuettes, amulets, and the like.Footnote 37 As will be discussed, all but the last of these objects were clearly considered as savings alongside coins and thus constituted an important element of overall liquid savings.
Results: a low and unequal liquid savings environment
Of the roughly 1,150 victims found to date at Pompeii, only some 200 are currently documented as carrying coins.Footnote 38 Most bodies either carried no coins or were not recorded as having carried them. This overall impression of low and unequally distributed levels of coined savings characterizes both those victims who did carry coins and the savings boxes found in various houses and shops.
As has been evidenced in the individual regional analyses, coin wealth in both skeletal hoards and savings boxes across the city was dominated by hoards of under 10 HS in value (Fig. 1).Footnote 39 Some 49% of skeletal hoards and 41% of savings-box hoards from the published regions were composed of 1–10 HS. Some 33% of skeletal hoards and 36% of savings boxes contained more middling amounts, of 11–150 HS. Only small numbers of victims or savings boxes carried middle-to-high values of 151–1,000 HS. The very highest-value hoards increased somewhat as a percentage of the overall cases compared with these middle- to high-value hoards, with some 8% of both skeletal hoards and savings boxes containing over 1,000 HS.
Skeletal and savings-box hoards, percent of cases by value range. (Graph by K. Bowes.)

The distribution of savings from both the skeletal and savings-box contexts was thus highly unequal. The very similar profiles of skeletal hoards and savings boxes did not suggest that the coined wealth carried in flight was of different value or distribution than stored savings left behind, although the distribution in savings boxes, particularly at the middle levels, was somewhat more equal than for hoards carried by victims. The Gini coefficients for skeletal hoards and savings boxes were 0.89 and 0.83 respectively, confirming a highly unequal distribution overall, with a very slightly more equal distribution among savings boxes. By way of comparison, the better-excavated contexts from Villa B at Oplontis point to a similarly unequal distribution of savings, there in the context of a commercial wine estate where victims sheltered in a storage room. Of the 54 victims found in Room 10 of that villa, only 14 carried coins: 8 carried 10 HS or less, while 5 persons carried around or more than 1,000 HS. Only one victim carried a middling amount, of 64 HS.Footnote 40
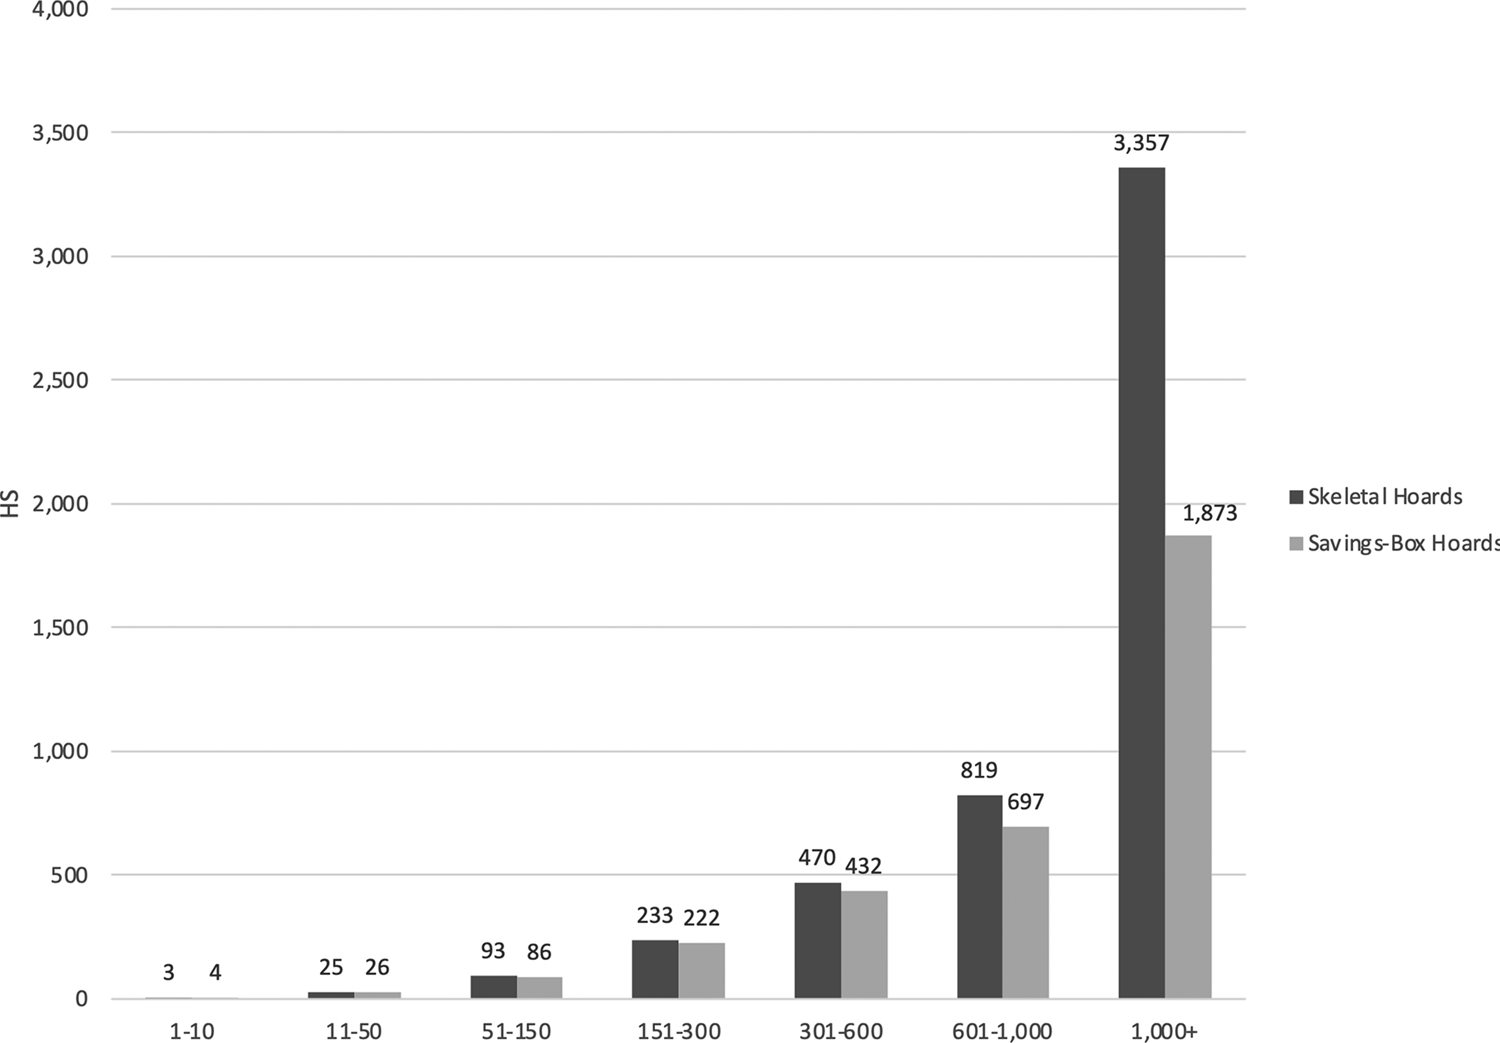
Not only were the hoard data highly unequal but the quantities of coined savings held by the majority were very low (Fig. 2). The average value of the smallest-value hoards was some 3 HS for skeletal hoards and 4 HS for savings boxes: that is, toward the lower middle of the 1–10 HS range. The middling- and middle-to-high-value ranges had averages at or below the median for their range: e.g., 25–26 HS for the 11–50 HS range, 430–70 for the 301–600 HS range. The very large hoards contained on average considerably more than 1,000 HS of coined value and demonstrated one of the few real disparities between skeletal and savings-box hoards: the average value of the largest skeletal hoards (17 in number) was 3,357 HS, while that of the savings-box hoards (13 in number) was only 1,873 HS.
Skeletal and savings-box hoards, average value (HS) per value range. (Graph by K. Bowes.)
The low average values of the smallest hoards – 3–4 HS – deserves some comment, as this average is considerably lower than that presented by Taliercio Mensitieri – 6–7 HS – in an overview of the coin finds from Pompeii and Oplontis.Footnote 41 As this latter sum was presented in the context of a survey, the specific data used were not stated. It appears that she drew on the currently published regions (I, VI, VII, IX) and perhaps also Region VIII, but included all hoards, including the “sporadic” finds excluded from the present study.Footnote 42 Her very different calculation highlights the different results obtained from agglomerated versus contextually specific data, and also, potentially, the difference that additional data might make to savings estimates, particularly at the low end of the spectrum.
Turning to the highest-value hoards, even these are unexpectedly modest, in both value and frequency. While much attention has been paid to a handful of spectacular, high-value hoards, such as the Boscoreale treasure from the rural Villa Pisanella with its 1,350 gold aurei and large collection of silverware, it is important to note how rare such hoards actually are in the region, either on victims or in savings boxes.Footnote 43 Not only do hoards above 1,000 HS constitute only around 8% of both classes of hoards in the present study, but truly large liquid-savings caches like the one from Villa Pisanella are practically non-existent in the city itself. Only one hoard from the city exceeded 10,000 HS in coin value (that from VIII.2.27, Casa del Cinghiale, with 66 gold aurei, 987 denarii, and abundant silver and gold objects), and only six skeletal hoards and one savings-box hoard exceeded 4,000 HS. As I will discuss shortly, even these largest savings are modest when compared to the prices for large capital investments like slaves, land, or agricultural improvements. Thus, even the richest hoards show the same relatively low levels of coined savings characteristic of the data set as a whole.
The nature of savings
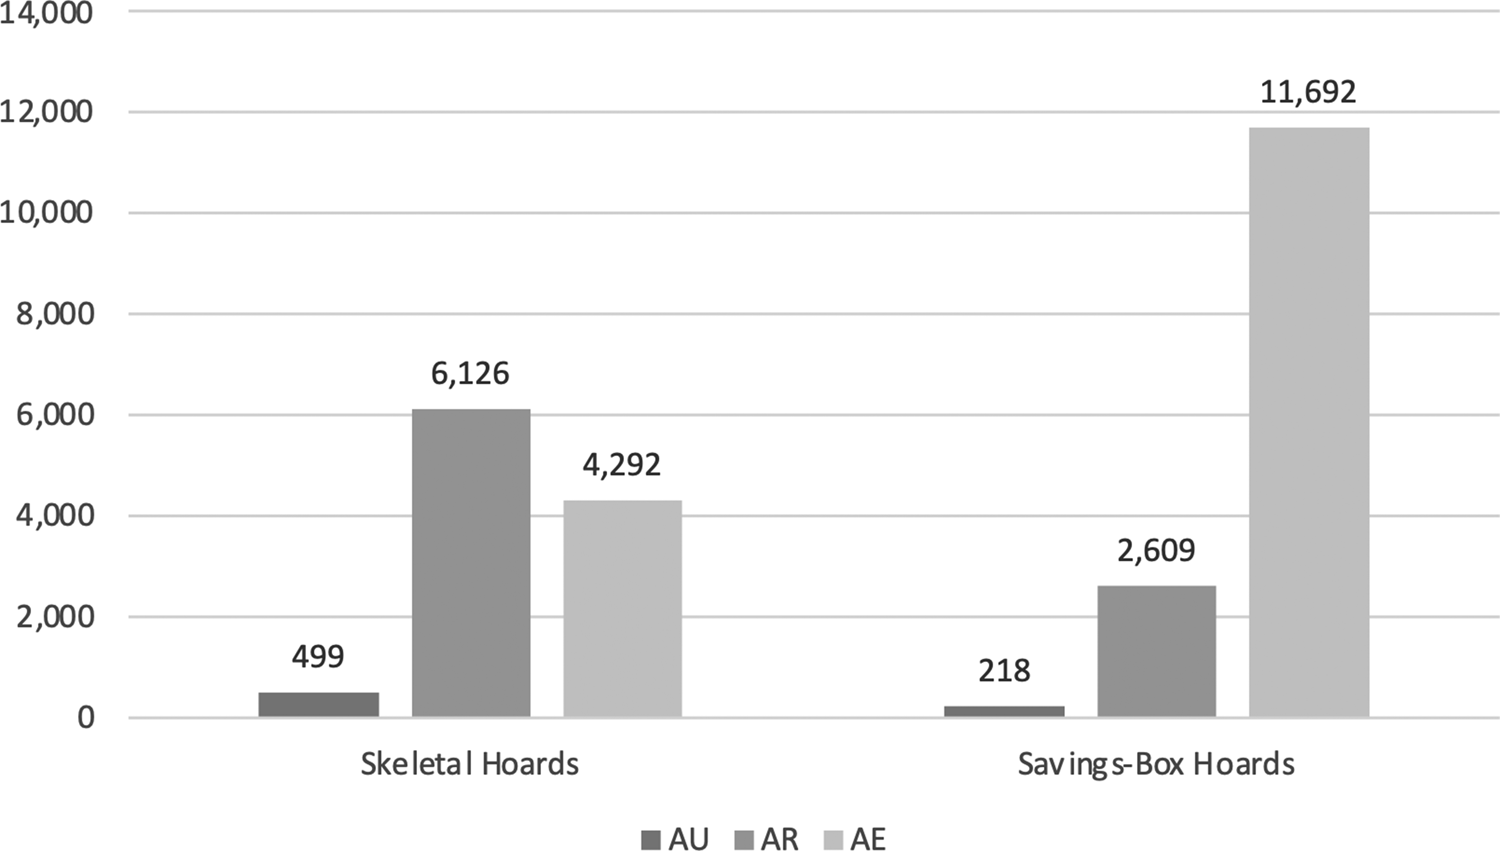
Despite the low levels of savings and their highly unequal distribution, these data support the broadening consensus that the city was highly monetized, including, presumably, a significant portion of its non-elite majority. In addition, the data are characterized by a surprisingly distributed presence of all denominations throughout the different value ranges (Figs. 3 and 4).Footnote 44 Both silver and gold were found in the lowest-value ranges, and even high-value hoards included the lower-value bronze denominations, while the vast majority of hoards were composed of a variety of denominations.Footnote 45 Some interesting differences characterize the distribution of metals in the skeletal versus savings-box hoards. In general, victims more frequently carried gold, while bronze was more frequent in the savings-box hoards (Fig. 3). This was true throughout the various value ranges, such that in victims’ hoards, silver and gold appeared more frequently in the lowest-value ranges while bronze became less frequent in higher-value hoards, while the opposite was true in the savings boxes (Fig. 4a–b).
Distribution of gold, silver, and bronze (total coin counts). (Graph by K. Bowes.)
Relative presence of gold, silver, and bronze (percent of cases), per value range: (a) skeletal hoards; (b) savings-box hoards. (Graphs by K. Bowes.)

Thus, while the overall distribution of value was similar between skeletal and savings-box hoards, the higher-value metals were more frequently carried by victims, while bronze was the most frequent component of savings boxes. This makes sense given that some 40% of these savings boxes were from commercial establishments for which bronze was the daily medium of exchange. This is further reassurance that these hoards preserve at least something of the original character of coined savings in the city. While the presence of gold coins in savings-box or skeletal hoards is not an indicator of their use in normal daily transactions, as neither of these contexts can be described as “normal” in character, their frequent presence in some 67–76% of hoards over 100 HS, including shop savings boxes, suggests that gold served as something more than a unit of stored or hereditary wealth, as has often been suggested.Footnote 46 Conversely, the ubiquity of the as and dupondius even in high-value hoards is further proof that bronze was not only the basic unit of daily exchange but also an important component of coined savings, particularly in commercial savings boxes.Footnote 47
Despite these indications of relatively high and well-distributed monetization, the data present equally strong indicators that coins were not the only, or perhaps even the principal, form of savings.Footnote 48 Textiles, which we know from loans, wills, and dowry agreements were also used as wealth storage, are unfortunately only occasionally and briefly noted in the excavation diaries and are poorly preserved.Footnote 49 The most commonly preserved alternative to coins as savings instruments were jewelry and precious-metal plate and vessels. Some 53% of victims in the present study carried such objects of value.Footnote 50 Even the lowest-value 1–10 HS hoards (carried by 49% of victims) also included such objects. Some 200 victims from the excavations carried objects but no coins.Footnote 51 The majority of these objects were made of precious metal – gold and silver jewelry above all – and thus other forms of bullion seem to have been used alongside coinage as containers of wealth. Coins, in short, were the most common but by no means the only form in which liquid savings were stored.
Calculating the value of these objects is a challenging if not impossible task: while valuables were probably included in skeletal hoards for their bullion value by weight – hence the preponderance of gold and silver objects and the occasional markers of weight on the objects themselves – their actual market value would have also depended on their workmanship, the availability or demand for similar objects, and the social context.Footnote 52 By modern definitions, then, these objects would have been somewhat less liquid than coins themselves. Furthermore, their value might also be actualized as collateral for loans: a graffito from a workshop in Region I, for instance, describes a pair of gold earrings being used as surety for a loan of 2 denarii (8 HS).Footnote 53
As an exercise in gauging the minimum impact that these other valuables might have on total savings, if we add this collateral value of a set of earrings (8 HS) to the 49% of the poorest victims who were also carrying valuables, the average value of these 1–10 HS hoards increases by almost 50% to 5.7 HS. Even this increase is probably too low, both because I have used a surety value and because most victims carrying non-coined objects possessed multiples of such objects, even if those objects did not all have the collateral value of earrings.Footnote 54 The increase in value to the large coin hoards found on victims would be substantially higher: in the case of a woman found in the House of the Faun carrying gold bracelets each weighing a pound, or the couple who collapsed in the Via Stabia carrying some 28 pieces of gold and silver jewelry, the value of non-coin objects might outstrip that of the coins.Footnote 55 Any greater precision on the value of coined versus non-coined wealth is probably not possible, but, at a minimum, the exercise reveals both the multiple forms that portable liquid capital might take and the quantitative importance of such wealth in estimating overall savings.
Spatial indicators
The hoards’ spatial distribution, particularly the distribution of the skeletal hoards, provides additional contextual information, as well as clues to the identity of many of the people whose savings it charts. While the regional catalogs analyzed the coin finds in terms of general categories of house, commercial/artisanal space, or public space, the present study further broke down the house category into the size quartiles proposed by Wallace-Hadrill, and distinguished public building contexts (e.g., baths, the Grand Palestra, the forum) from street contexts.
Both skeletal hoards (65%) and saving boxes (92%) were principally found in houses or commercial spaces (Fig. 5).Footnote 56 Outside this commonality, however, there are considerable differences between the two data sets. A significant number (22%) of victims with coins were found in streets, seemingly fleeing when they were struck by projectiles or overcome by the final pyroclastic density currents. Unsurprisingly, very few savings boxes were found in streets (1%), the occasional box probably dropped by fugitives or looters in their flight. Somewhat more surprising are the relatively few victims with coins found in commercial spaces (17%), either because the smaller, less robust shop structures represented poor refuges or because shopkeepers and their families escaped in greater numbers. Nonetheless, some 40% of savings boxes containing coins were found in commercial spaces, suggesting that if shopkeepers were among those who escaped, they did not manage to carry away all their wealth. As many commercial spaces contained more than one savings box – a combination of cash boxes found on or beneath the counter, in back rooms, etc. – this may have been either oversight or the sacrifice of lower-value saving boxes in lieu of grabbing their most valuable cash hoards.
Location of skeletal and savings-box hoards (percent of cases). Q = house-size quartile, following Wallace-Hadrill 2004, 118. (Graph by K. Bowes.)

If we examine the value of victims’ hoards found in different kinds of spaces, the results echo many of these patterns (Fig. 6). Most spaces – commercial establishments, small and large houses, and outdoor/public spaces – display a version of the pattern noted above: namely, a predominance of small-value hoards in all spaces, with higher-value hoards less common. A few exceptions to this trend are worth noting. The smallest houses (Q2) would seem to have a greater number of medium-value and medium-high-value hoards (11–50 and 301–600 HS): however, the very small number of these houses in the sample (only four) suggests that this is probably an anomaly. I have already noted that there are many reasons to believe that some victims died outside their habitually occupied spaces: the 22% of coin-carrying victims found in streets and 12% found in public buildings are evidence of this (Fig. 5). These fleeing victims also appear to have been carrying some of the higher-value hoards: some 43% of the two highest-value hoard categories (601–1,000 and 1,000+ HS) were found in streets or public spaces (Fig. 7). This points not only to capital on the move, but is another indicator that important sums of liquid wealth were being carried out of the city.
Skeletal hoards: distribution (percent of cases) of value ranges by location. (Graph by K. Bowes.)

Skeletal hoards: location of 601–1,000+ HS hoards. (Graph by K. Bowes.)

The majority of victims found in houses or commercial spaces constitute our best chance of examining savings in something like what might have been their “home” context. If we consider only the victims found in a house or commercial space (that is, in a possible home context), 26% were found in shops, while 57% were found inside the largest, Quartile 4, houses. This disparity might be owed to a combination of natural demographics and flight behavior: large houses presumably had large populations and occasionally had robust structures – like vaulted cryptoporticus or cellars – which might have held out the hope of shelter from collapsing roofs and projectiles.
Examining the relative levels of savings held only by victims found in houses is more revealing (Fig. 8). Of the poorest (1–10 HS) victims who died in a house, some 80% were found in the largest, Quartile 4, houses. In other words, most of the very low-savings majority, when found in what was possibly their home environment, were discovered in the largest homes. This raises important questions not only about who they were but about what biases characterized the coin-carrying population generally.
Location of 1–10 HS skeletal hoards, houses only (percent of cases). (Graph by K. Bowes.)

During the more than 17 hours during which pumice and ash fell on Pompeii, perhaps some 80% of the estimated 8–12,000 residents had time to escape before the final hellish pyroclastic density currents that killed all those who remained.Footnote 57 Who, then, was left behind? As the skeletal data can only rarely be associated with the original findspots and the skeletons themselves are mostly disarticulated, it not possible to reunite most individual victims’ skeletons with the coins and other valuables cataloged here. These challenges have also made it difficult to gauge the socio-demographic character of the ca. 1,150 individuals left behind, although it has been argued that the victims represent an equitable cross section of the ancient population.Footnote 58
The strong association documented here between low-savings individuals and high-status houses may indicate that many of those who failed to escape were slaves. Were this the case, the small sums amounting on average to some 5.7 HS in total savings would have constituted their peculium. The very low average levels of savings documented by this study might, therefore, be a product of the particular demographic left behind during the eruption, rather than a more normative distribution.
Some contextual evidence exists in support of this argument. Requiring the least valuable members of the slave familia to remain and guard the family's possessions would have been well within both the expectations of a master and the responsibilities of the enslaved. Indeed, some 60% of the better-excavated and preserved skeletons from Villa B at Oplontis are thought to be slaves, largely for the same reasons adduced here, namely the low value of the coins/valuables they carried compared to their companions, and the fact that the low- and high-coin persons were huddled in separate groups.Footnote 59 There is also reason to believe that the slave/freedperson population of the Vesuvian cities was particularly high. Garnsey and de Ligt's reconstruction of Herculaneum's demographics based on the Herculaneum Album posits a slave population of some 40–45%.Footnote 60 No such numbers are available from Pompeii, but the Herculaneum data present an important local comparandum showing much higher numbers than those generally estimated for Roman Italy.Footnote 61
While this is suggestive, and certainly one possible explanation for the disproportionate numbers of victims with low savings associated with large houses, there are also counterindications and alternative explanations. Everything from small-find analysis to skeletal positions has demonstrated the ways in which objects and people were often not in their normal places but moved around as panic struck the city.Footnote 62 Individuals thus may very well not have died in the houses of which they were members but may have joined other fugitives in perceived places of safety. Lazer's analysis of a sample of the disarticulated and decontextualized victims, some of whom probably overlapped with our coin-carrying population, suggests a reasonably well-nourished and relatively homogenous population, with no marked sex or age bias – not something one would expect were there a significant number of slaves.Footnote 63 The coin data itself is also a counter indicator: 61% of the lowest-value savings boxes were also found in the largest houses.Footnote 64 While we might argue that these, too, represent the hoarded peculia of slaves, they might suggest an alternative explanation for the small amounts carried by victims. We have assumed that, whenever possible, people sheltering or fleeing from the eruption carried all their readily available savings, but it is also possible that these small-value hoards found on people and in boxes represent coinage for daily use rather than life savings. However, the fact that at least 50% of victims with coins also carried other valuables, less negotiable for daily use and more probably used as long-term wealth storage, make this less likely.
Finally, we should be cautious about assuming that all slaves were necessarily lacking in liquid wealth. The legal corpora describe large slave peculia, and, closer to home, the Sulpicii archive records one Hesychus, slave of an imperial freedman, lending sums of 10,000 HS or more, seemingly from his peculium.Footnote 65 More informal means of accruing large-value peculia outside the banking world are evidenced by the Pompeii victims themselves. Discovered just outside the city, a woman who died wearing a gold bracelet inscribed dom(i)nus ancillae suae has been identified as a slave, and the bracelet, together with her other gold jewelry and the 204 HS in coins she carried, was presumed to be a gift from her owner.Footnote 66 Peculia, then, might vary widely in value, as the opportunities for savings accumulation available to the enslaved also varied widely. Thus, while suggestive, the identification of low-savings-carrying victims with slaves can only be a hypothesis still not fully supported by the data. Nevertheless, it will be an important point to note as we consider the relations between savings and consumption.
Savings and consumption
Liquid savings are only a meaningful metric for economic well-being when laid against information on household consumption. Not only do consumption costs provide a horizon for costs of living, but consumption practices describe the historically specific parameters of necessity and luxury, as well as the all-important costs and character of social inclusion – what Adam Smith described as the cost of a linen shirt.Footnote 67 Liquid savings are a portion of what is left over after these consumption expenses are met, but they also, as described above, augment consumption at moments of low income. In short, consumption costs and expectations are what define the utility of liquid savings, while savings help to support consumption either at moments of scarcity or as capital investment.
Recent qualitative work on the Vesuvian cities has posited an environment with high levels of consumption, of both food and consumer goods.Footnote 68 My own effort to quantify food consumption in the Vesuvian cities supports this consensus: the graffiti expense lists that formed the basis of those estimates averaged 11–19 asses (2.8–4.8 HS) per day per person, with a minimum of 8 asses (2 HS) and a maximum of 27 (6.75 HS).Footnote 69 Minimum levels of slave food consumption were 1.5 asses per day per person. As discussed, these lists are largely comprised of food expenses and do not include other major expenses such as rent, although they often include support for different kinds of dependents.
This impression of high levels of consumption may also have included real estate. Miko Flohr has calculated that some 70% of the population may have lived in an atrium house of some kind, while only 30% lived in the back rooms of shops or upper-floor spaces.Footnote 70 Flohr's categorization of commercial space versus houses might be contested, and the calculation of upper-floor space is, as he notes, fraught with problems. Notwithstanding these difficulties, he argues that most Pompeiians rented or owned a house. House and rental prices in Pompeii are poorly attested. Some guesses based on Ostian and Roman data suggest a nightly room rate for cheap accommodation of around 1–1.5 HS/night; a fullonica was rented at 1,652 HS/year; a long-term lease on a farm, possibly of 10 ha, might cost 6,000 HS/year; while the outright purchase of farmland, perhaps on Mount Vesuvius, cost 295,000 HS.Footnote 71 House prices for Pompeii are unknown: most of the comparative data come from literary sources and are rhetorically canted toward extremes of high and low prices. Cicero's claim that Rabirius's townhouse in Naples sold for 130,000 HS might provide some indication of regional prices for elite houses.Footnote 72 Thus, while some rental accommodations may have been reasonably cheap, other real estate, whether rented or purchased, may have been another component of high consumption in the Vesuvian cities.
If non-elite Pompeiians were, in fact, at least occasional owners of their own homes, these real-estate consumption expenses may have been converted into fixed savings. In other words, what I described above as an element of high consumption could more properly be counted as savings converted into capital investment. As has long been noted, the Roman house was a machine for status articulation and expansion. To invest one's savings in a house was, in effect, to make a capital investment that would bear fruit through an expanded and enriched patronage network and increased social capital. Below, I will come back to this possibility and the different ways of accounting for real estate, as well as for credit.
Other kinds of capital expenses are poorly documented at Pompeii and its surroundings, although a few specifics from the transactions of Caecilius Iucundus and tablets from the baths at VIII.2.23 are revealing: a mule was sold for 520 HS; slave prices range from 1,450 to 6,525 HS.Footnote 73 All these costs are an order of magnitude lower than those cited in the literary sources, an indication not necessarily of the cheapness of such goods in Pompeii but of the stylized function of “price” in a literary context.Footnote 74
The average of 5.7 HS of total liquid savings (cash and valuables) found in the majority 1–10 HS hoards would thus be adequate to meet a day or two of food expenses as calculated from the graffiti lists, or two weeks of subsistence food costs for a slave. At the other end, the average of 3,324 HS in savings in the highest-value skeletal hoards, or some 5,000 HS if we include the non-coin multiplier used above, would have supported this level of food consumption for three to four years, or a slave's minimum food costs for the better part of his or her lifetime. However, while this wealthier population might have had a more robust risk buffer for basic needs, these high-value savings hoards would still have been barely enough to buy a slave or two and wholly insufficient to rent anything but a small plot of land, or to pay Cicero's cited price for a townhouse.
We have no way of knowing if the persons whose capital we have measured with the coin data were consuming at the same levels as those registered in the graffiti or banking records. There are several reasons to think that these are not the same populations: the graffiti lists appear to have been made by transient persons who were of modest means but not destitute, while, as noted above, some or even many of the poorest people carrying coins may have been slaves. The largest savings caches may have left the city with their owners. Regardless, 5–7 HS of value would not have provided more than a week or two of food, let alone other expenses, even at subsistence levels, and probably only the top 11% of hoards included enough total liquid capital (coins and valuables) to support food consumption for a year at the level recorded in the graffiti lists, while even they did not carry enough capital to buy land. Thus, in terms of coined wealth alone, both the risk-buffering and the capital investment capabilities of most of the attested population were very limited. In short, while the consumption data for Pompeii describes relatively high levels of consumption, whether for food or property, in the majority of cases captured by the coin data, liquid savings seem to have been very low. Whether or not this lack of liquidity translated into lack of savings in all forms will be considered below.
Retail and savings
Pompeii has been characterized as a commercial town, the shops, food establishments, workshops, bakeries, and fulleries that line its streets and cluster in “retail districts” epitomizing a bustling population of more-than-subsistence means.Footnote 75 Some of the most spectacular and best-known coin hoards from the city come from tabernae like that of Lucius Vetutius Placidus, with its counter dolia overflowing with asses and denarii, and the sheer numbers of coins from retail and artisanal spaces make up a significant percentage of coin finds from the city as a whole.Footnote 76 At the same time, recent work on the social world of artisans and merchants has emphasized the volatility of their lives, the challenges of seasonal supply and labor, and the importance of risk buffering.Footnote 77 The coin data from shops provide some support for both images, but perhaps more for the latter than the former.
As noted above, only 17% of the ca. 200 victims carrying coins were found in commercial spaces, a bias that can be attributed either to the particular ways in which shopkeepers fled or to a sense that commercial spaces constituted more precarious refuges. Savings boxes were more common in commercial spaces than skeletal hoards were, and some 40% of these savings were found in some kind of commercial establishment. Nonetheless, the distribution of value in savings boxes found in commercial spaces showed few differences from those found in the city as a whole. The majority (43%) of commercial savings-box hoards were low value (1–10 HS); those smallest hoards were low in average value (ca. 4 HS); and all commercial hoards exhibited highly unequal distribution between low- and high-value hoards (Gini coefficient = 0.81).
There are some particular caveats attached to the commercial data: as discussed above, many of the savings-box hoards had been cleared out, and some contained only one or two asses, perhaps the remains of larger hoards that had been hurriedly emptied. These data, combined with the low numbers of victims in shops, may suggest that most commercial savings left the city and that these numbers may be particularly unrepresentative.Footnote 78 Commercial savings – whether found on possible shopkeepers or in commercial cash boxes – had the same low-savings, highly skewed distribution as the rest of the data. If these data are representative of pre-flight savings patterns, they suggest that most shops also found it hard to accumulate significant amounts of liquid capital and thus waged a hard-fought struggle between income and expenditure, without the possibility of accumulating major savings.Footnote 79
What of the few spectacular hoards like that from the bar of Lucius Vetutius? Of the 10 largest coin counts, six were in commercial establishments, but they consisted mostly of low-denomination bronzes and thus had a far smaller value than their coin quantities would indicate. The 1,450 coins from the various savings boxes in Lucius Vetutius's caupona (I.8.8), for instance, only amounted to just over 600 HS. A handful of shops, however, boasted very large hoards valued at over 1,000 HS, including important quantities of gold and silver alongside the typical mass of bronze: indeed, three of the six highest-value savings-box hoards were in shops, with amounts ranging from 1,500 to 2,000 HS.Footnote 80 All three were located near the forum; two sold hot food, among other things; and all had enough in the kitty to support a single person's food consumption for a year at the consumption levels indicated in the graffiti lists. These were the shop owners of the “retail revolution,” those who seem to have capitalized on prime real estate to accumulate sufficient liquid savings not only to weather volatile income, but also potentially to invest in extra labor, space, or materials.Footnote 81 Even these sums, however, are only barely enough to buy land or other property.
The exceptionality of these few examples, however, is driven home by the Gini coefficients (0.81), which are not much more distributed for retail than they are for savings in the city generally, suggesting a world dominated by small, unprofitable shops with a few notable exceptions. The exceptions show that, just as Martial or Juvenal feared, the occasional person in trade might amass the capital that eluded others, but it may have been the exceptionality, not the normality, of those circumstances which attracted elite – and poetic – rancor.Footnote 82
Conclusions: explaining low savings
Above, I explored the possibility that the low savings held by the majority of the coin-carrying population may have been a product both of the flight of most savings out of the city and of slaves constituting a significant portion of the population left behind during the eruption. Thus, the relationship between low savings and high consumption may simply be a result of comparing the saving and spending capabilities of two very different moments or two different sorts of people. If many of the coin-carrying victims were slaves, they themselves constituted the “savings” – or, better, the capital – of their owners who escaped, further complicating the situation. Nonetheless, the low-savings profile of the data as a whole is so marked, even for the highest-value hoards, that it behooves us to consider other reasons why coined savings were so low, and why savings and consumption might exhibit an inverse relationship.
As the role of savings in poor economics becomes clearer, the seemingly contradictory scenario of high consumption and low savings has been frequently noted among both historical and modern populations. In later 17th-c. England, for instance, working people consumed large caloric and monetary quantities of food, leaving them with very low savings or even negative household balances.Footnote 83 In part these relationships were driven by increasing food costs in the later part of that century, but even under lower price scenarios, high consumption at the expense of savings was produced by dietary practices and workloads requiring high-calorie foods, as well as the availability and desirability of higher-quality consumer goods. The result was a well-fed population with little risk-buffering capacity. Similarly, some poor modern populations in both the industrialized and developing worlds spend the majority of their income on both higher-status foods and, just as importantly, consumer goods, leaving little for savings and emergency needs, while other modern populations, particularly those at the very bottom of earnings, regularly save small sums for both “rainy day” funds and small-scale capital investments.Footnote 84 The relationship between consumption and savings is thus heavily contextually determined – by caloric needs, by the availability and desirability of consumer goods, and by cultural attitudes to saving versus spending. In some of these configurations, high levels of consumption seem to drive low levels of savings when food prices are high, and/or caloric needs are great, and/or consumer goods are plentiful and desirable. While the first reason does not seem to accrue to the Vesuvian cities, where food prices were generally low, the latter two are possible: previous studies have demonstrated both a high-calorie diet and frequent consumption of non-food consumer goods, from staples to luxuries.Footnote 85
The double role of real estate as both savings and expense may be more relevant here. Insofar as Flohr's study hints at frequent property ownership even among non-elites, liquid savings may have often been converted into the purchase of houses and shops. In other words, the low levels of liquid savings documented here may have been offset by non-liquid assets like property. If so, liquid savings such as coins and valuables would provide a poor measurement of overall savings, while actual levels of overall wealth may have been much higher. Equally importantly, this would also suggest that liquidity in coins or valuables was not prioritized and that less liquid, more fixed property assets were more prized. This would fit with what we know of Roman attitudes to land generally and would further suggest that high levels of monetization were used principally for quotidian exchange, not wealth storage.
Perhaps the most intriguing reason for low liquid savings might be additional sums stored as non-coined instruments and/or credit. Historically, during periods of low supply of low-denomination coins (such as the later Middle Ages or the early modern period), non-elites had broad recourse to credit or in-kind payments, thus producing low cash savings but additional, often hidden, overall wealth.Footnote 86 These circumstances would seem not to accrue in 79 CE Pompeii, where low-denomination bronzes seem to have been in plentiful supply. Rathbone, Harris, and others have argued for a major expansion of the monetary supply through credit, beginning in the 2nd c. BCE., and have described the large sums which must have moved through various non-coined instruments.Footnote 87 This argument for the frequent and expansive use of credit has been almost entirely based on relatively high-value transactions, although Verboven has argued that account credit was commonly used by soldiers, while Rathbone and Lerouxel have revealed the use of credit by farmers in rural Egypt.Footnote 88 Indeed, had our majority low-value hoards come from an Egyptian village, we would almost certainly attribute the phenomenon to the use of credit accounts, managed by large estates, village banks, even local grain warehouses, which obviated the need for coined money in many daily transactions.Footnote 89 In a contemporary Egyptian context, then, low coined savings probably concealed important savings, even a majority, held in credit.
The extent to which laboring urbanites like those in the Vesuvian cities would have stored part of their overall wealth as credit instruments remains tantalizingly vague. The banking records of Caecilius Iucundus or the Sulpicii are mostly for deposits and loans of relatively large sums – the Iucundus records average some 5,767 HS – several orders of magnitude larger than the majority of savings documented in this study.Footnote 90 The Herculaneum tablets record private lending which is less complex and smaller in scale, but loans still average some 3,918 HS.Footnote 91 Only five graffiti from Pompeii attest to lending practices for poorer borrowers; these are recorded in more informal contexts (graffiti) than the credit archives (wax tablets) dominated by freedman moneylending families. The graffiti describe sums from 2 to 50 denarii that were lent at a monthly interest rate of ca. 3–6%, with surety sometimes provided in the form of jewelry or cloth. Two of these loans were made by one Faustilla with surety and were recorded on the walls of a modest workshop-cum-house (I. 8.13): 2 denarii with 1 as interest guaranteed by the aforementioned set of earrings, and 50 HS (?) with 13.5 asses interest guaranteed by two cloaks.Footnote 92 Faustilla, then, had at least 50 HS in savings to lend out, which she converted to 3–4 HS/month of income. While these data, together with the other graffiti, suggest that poorer non-elites had access to credit and that other non-elites were converting their savings into loans to meet these needs, five graffiti are insufficient to determine the extent of that borrowing and thus to know whether the liquid savings documented in this study were regularly inflated (by borrowing) or reduced (by lending).
While we cannot be certain of the cause, a possible inverse relationship between consumption and liquid savings in Pompeii allows us to see the economic portfolios of the poorer and non-elite population in a more nuanced light than is possible through consumption or income alone. Indeed, the Pompeiian economic universe was characterized by the particular circumstances of a highly saturated consumer world, with its dietary variety and consumer goods, relatively high levels of monetization, possible significant investment in real estate, use of credit, and absence of meaningful liquid sums. In other words, it may be that many of the stories told about the Vesuvian economies – above-subsistence versus at-subsistence, highly commercialized versus elite-dominated, simple versus complex – can all be said to be true, and that both their truth and their contradictions are embodied by the consumption/savings paradox suggested by these data.
Acknowledgments
I thank Steve Ellis and Alessia Rovelli for bibliographic help. The article was immeasurably improved by the comments of the two anonymous JRA reviewers; any errors remain my own.


 Open access