

In the fight against gerrymandering, “change” is a red flag. Dramatic shifts in district shape, partisanship, and racial composition are taken as signs of foul play—“blatant,” “aggressive,” or “extreme” gerrymanders (Ingraham Reference Ingraham2018; Kilgore Reference Kilgore2022; Li and Lo Reference Li and Lo2019). Courts scrutinize altered maps; journalists highlight jarring before-and-after comparisons; political scientists model shifts in district compactness and jurisdictional reach (Ansolabehere and Palmer Reference Ansolabehere and Palmer2016; Durst et al. Reference Durst, Cai, Tillison-Love, Huang and Henry2023; Fan et al. Reference Fan, Li, Wolf and Myint2015). As a result, “least-change” redistricting—plans that preserve existing boundaries with minimal disruption—has come to represent a kind of neutral ground: restrained, legally prudent, and respectful of existing political subdivisions (Gordon Reference Gordon2021; Kondik and Coleman Reference Kondik and Coleman2021a).Footnote 1 Least-change maps serve several ends: they can protect incumbents and communities of interest, limit competition, entrench partisan advantage, or preserve the status quo more broadly. These effects are important and documented (Bickel Reference Bickel1961; Carson, Engstrom, and Roberts Reference Carson, Engstrom and Roberts2006; Yablon Reference Yablon2022). This paper, however, focuses specifically on the racial consequences of least-change maps, which remain comparatively underexplored despite being central to ongoing litigation and debates about democratic fairness.
As America’s racial demographics change, maps that stay largely the same can quietly produce significant representational disparities. When communities of color grow and the white population shrinks, some maps generate racial representational imbalances if increases in communities of color are not matched by greater political opportunity. Minimal-change maps can also reproduce existing patterns of racial underrepresentation by freezing racially gerrymandered boundaries from previous cycles. This paper introduces the concept of dilutive drift: vote dilution that results when minimal-change maps confront demographic shifts. Dilutive drift requires three ingredients: (1) low-change maps, (2) concentrated nonwhite populations with high levels of racially polarized voting, and (3) high-change demographics. Each is necessary, and together they create conditions sufficient for vote dilution. When district boundaries remain static amid shifting racial dynamics, nonwhite voters can be passively packed into a few majority-minority districts, or passively cracked across many majority-white ones.
Although Black and Latino representation has improved in some places, communities of color remain measurably underrepresented in congressional and state legislative maps (Warshaw, McGhee, and Migurski Reference Warshaw, McGhee and Migurski2022). Dilutive drift limits the ability of communities of color to achieve equitable opportunities for influence. Regular map revision forces mapmakers to rethink existing boundaries and account for population dynamics (Born Reference Born1985; Gelman and King Reference Gelman and King1994; La Raja Reference La Raja2009). When mapmakers persistently limit redistricting changes amid population shifts, their inaction can reinforce existing racial disparities in representation. Dilutive drift is not incidental, but a predictable byproduct of redistricting inertia, one with important implications for scholars, courts, and reformers.
Civil rights organizations litigate redistricting legislation that erodes or fails to increase the number of majority-minority districts on grounds of vote dilution. This paper adopts their definition of vote dilution: the denial to voters of color of an equal opportunity to elect preferred candidates. Drawing upon original measures of spatial change—MAPS scores measuring changes to each district’s margin, alignment, position, and size—I argue that limiting district change consistently protects incumbents and is associated with stagnation in Black representation (Hackett Reference Hackett2025b). Some states have diluted the vote of communities of color by making fewer district changes than other states, even as their nonwhite population grew. Lack of change can be just as consequential as change, even if it is not always recognized as such.
This paper makes four claims about dilutive drift: it exists, is consequential, derives from low-change maps, and can be described systematically. These four claims stand as a corrective to the propensity to overlook or underestimate the importance of minimal-change maps among the public, the courts, and the scholarly literature, respectively.
For the public and media, dilutive drift is easily overlooked because it is a subtle form of dilution; mapmakers do not make major changes to existing arrangements. Inaction, particularly when its effects unfold over multiple cycles, is inherently less newsworthy than “aggressive” gerrymanders occurring within or between cycles. Not all minimal-change maps have negative consequences for minority representation, but any such consequences are less obviously attributable to mapmakers than active forms of gerrymandering.
For courts, minimal-change principles often affirm the status quo. Traditional districting principles of contiguity, compactness, and the preservation of local jurisdictional boundaries act as spatial constraints upon mapmakers’ ability to redistrict (Gordon Reference Gordon2021). In court, litigants adduce the principle of incumbent protection—an inherently low-change principle—to promote minimal-change maps.Footnote 2 Nonretrogression principles in the Voting Rights Act (VRA) rigidify existing majority-minority districts. Institutionally predisposed to respect precedent, courts can signal their reluctance to intervene in the redistricting thicket by minimizing changes to existing maps (Backstrom Reference Backstrom, Hardy, Heslop and Anderson1981; Hackett Reference Hackett2025a).Footnote 3
For scholars, attention has focused on active gerrymandering, either utilizing comparative statics (such as the efficiency gap, partisan vote-seat bias, etc.) or measuring changes over time, such as rapid declines in compactness or alterations to jurisdictional boundaries (Ansolabehere and Palmer Reference Ansolabehere and Palmer2016; Durst et al. Reference Durst, Cai, Tillison-Love, Huang and Henry2023; Fan et al. Reference Fan, Li, Wolf and Myint2015; Stephanopoulos and McGhee Reference Stephanopoulos and McGhee2015; Warrington Reference Warrington2019). There has been far less attention to a lack of redistricting change over time. The “silent gerrymander” literature of the 1960s described growing malapportionment prior to Baker v. Carr—before the VRA and the modern era of vote-dilution litigation (Edwards Reference Edwards1961; Orr Reference Orr1969; Schubert and Press Reference Schubert and Press1964). For those few scholars who have examined low-change sequences post-VRA, there is the challenge of determining what counts as “low change” (Becker and Gold Reference Becker and Gold2022).
The first part of this paper uses innovative MAPS measures of spatial change to identify stagnant maps and demonstrate that some districts are persistently less changeable than others. The second part introduces the concept of dilutive drift and shows how passive packing and cracking result from demographic change, even absent active gerrymandering. The third part analyzes real court cases alleging dilutive drift in Alabama, Louisiana, and other states to reveal how the concept plays out in litigation and practice. Mapmakers in the Deep South have allowed Black and Latino voters to be dispersed among majority-white districts instead of creating new majority-minority ones. My evidence underscores the disproportionate effects of minimal-change maps across racial groups.
Measuring Low-Change Maps
Although they do not attract as much attention as creative gerrymanders, such as the 2025 mid-cycle redistricting wars in Texas and other states, incumbent-protecting minimal-change maps are common. Even the 2010 cycle—dubbed “the Great Gerrymander of 2012” (Wang Reference Wang2013)—nevertheless saw little change to maps in states such as Oklahoma, New Mexico, Washington, and Connecticut. Alabama produced “one of the nation’s most understatedly durable gerrymanders” (Kondik and Coleman Reference Kondik and Coleman2021b). In West Virginia, Democrats “considered some creative plans … [but] ultimately took a minimal change approach.” Mississippi’s 2010 and 2020 redistricting cycles were likewise “uneventful” and “straightforward”: whether drawn by a court (as in 2010), or legislature (as in 2020), the new plans strongly resembled the existing map (Kondik and Coleman Reference Kondik and Coleman2021b).
The concept of a “low-change map” is intuitive, but we have far fewer empirical measures of low-change sequences than we do indicators of high-change sequences, such as those measuring possible gerrymandering (Ansolabehere and Palmer Reference Ansolabehere and Palmer2016; Bowen Reference Bowen2014; Crespin Reference Crespin2005; Gaynor and Gimpel Reference Gaynor and Gimpel2021; Krasno et al. Reference Krasno, Magleby, McDonald, Donahue and Best2019). Minimal-change maps have been described in court as a “standardless morass.”Footnote 4 Hence, measures of spatial change are required to identify maps that change least from cycle to cycle. To pinpoint minimal-change maps, I utilize the MAPS measures, which overlay district boundaries from each pair of successive congresses and quantify the magnitude of changes to district margin (boundary change), alignment (overlap between old and new districts), position (moving location), and size (growth or shrinkage). MAPS measures enable us to compare and calibrate the precise extent of spatial change to every district along these dimensions, within and between states, and within and between redistricting cycles (Hackett Reference Hackett2025).
My analysis prioritizes spatial measures of district change, focusing on the placement and movement of geographic boundaries when districts are redrawn. This emphasis stems from the inherently spatial nature of redistricting, which is fundamentally about manipulating map lines to define political representation. Unlike population-based metrics, spatial changes can be visualized directly, making them intuitive tools for comparison and evaluation. Citizens, legislators, and courts often rely on visual assessments to gauge the fairness or continuity of redistricting plans (Kaufman, King, and Komisarchik Reference Kaufman, King and Komisarchik2021). Courts, in particular, frequently employ what has been termed an “eyeball test” to assess the geographic coherence of district maps, reflecting the importance of spatial features in legal discourse (Gopalan et al. Reference Gopalan, Hachadoorian, Kimbrough and Murphy2024). Additionally, spatial measures provide a foundation for identifying patterns of change without the assumptions or inferences required to estimate population shifts, such as demographic forecasts or voter behavior. By focusing on the geographical qualities of districts, spatial metrics enable an evaluation of redistricting outcomes that aligns with how maps are frequently judged in practice.
To measure change, or lack of change, the first empirical challenge is to identify which district to designate as the “successor” to each district that previously existed. For each district, p, at t1, I take the coordinates (latitude and longitude) of the geographic centroid (
$ {\phi}_1 $
 ,
$ {\lambda}_1 $
,
$ {\lambda}_1 $
 ) and measure the Haversine distance in meters between that point and the geographic centroids (
$ {\phi}_2 $
) and measure the Haversine distance in meters between that point and the geographic centroids (
$ {\phi}_2 $
 ,
$ {\lambda}_2 $
,
$ {\lambda}_2 $
 ) of each of the districts in the set of all districts, {s}, at t2, whose geometries overlap in any way with p.
Footnote
5 I consider p’s successor district to be the district, s, that has at least some spatial overlap with p and the shortest distance between centroids. Table 1 provides details on the four MAPS measures.
) of each of the districts in the set of all districts, {s}, at t2, whose geometries overlap in any way with p.
Footnote
5 I consider p’s successor district to be the district, s, that has at least some spatial overlap with p and the shortest distance between centroids. Table 1 provides details on the four MAPS measures.
MAPS Measures of District Change

Table 1 Long description
The table consists of three columns: Type of change, Measure, and How calculated.
* Row 1: Margin. Measure is the length of overlapping boundaries between predecessor and successor district as a percentage of the combined length of the boundaries (reversed). Formula: 1 minus open parenthesis numerator O sub s p plus O sub p s all over denominator B open parenthesis p comma t sub 1 close parenthesis plus B open parenthesis s comma t sub 2 close parenthesis close parenthesis.
* Row 2: Alignment. Measure is effective districts: weighted measure of the number of successor districts with which the predecessor district overlaps. Formula: 1 all over the summation from i equals 1 to n of open parenthesis I open parenthesis p comma s close parenthesis sub i all over D open parenthesis p comma s close parenthesis close parenthesis squared.
* Row 3: Position. Measure is distance between geographical centroids of predecessor and successor districts in meters. Formula: Haversine open parenthesis phi sub 1 comma phi sub 2 comma lambda sub 1 comma lambda sub 2 close parenthesis.
* Row 4: Size. Measure is the log of the ratio of the area of the successor district to the area of the original district in absolute terms. Formula: log of the absolute value of numerator A open parenthesis s close parenthesis all over denominator A open parenthesis p close parenthesis.
Source: Hackett (Reference Hackett2025).
Note:
$ p $
 is the original district;
$ s $
is the original district;
$ s $
 the successor district;
$ D\left(p,s\right) $
the successor district;
$ D\left(p,s\right) $
 is the combined area of the original district
$ p $
is the combined area of the original district
$ p $
 and the successor district
$ s $
and the successor district
$ s $
 ;
$ I\left(p,s\right) $
;
$ I\left(p,s\right) $
 is the intersections between
$ p $
is the intersections between
$ p $
 and
$ s $
and
$ s $
 ;
$ A(s) $
;
$ A(s) $
 is the successor district area;
$ A(p) $
is the successor district area;
$ A(p) $
 is the predecessor district area;
$ \left({\varphi}_1,{\lambda}_1\right) $
is the predecessor district area;
$ \left({\varphi}_1,{\lambda}_1\right) $
 are the coordinates of the internal point of
$ p $
are the coordinates of the internal point of
$ p $
 ;
$ \left({\varphi}_2,{\lambda}_2\right) $
;
$ \left({\varphi}_2,{\lambda}_2\right) $
 are the coordinates of the internal point of
$ s $
are the coordinates of the internal point of
$ s $
 ;
$ {O}_{sp} $
;
$ {O}_{sp} $
 is the overlap length of the successor district’s boundary
$ s $
is the overlap length of the successor district’s boundary
$ s $
 within the predecessor districts’ boundaries
$ p $
within the predecessor districts’ boundaries
$ p $
 ;
$ {O}_{ps} $
;
$ {O}_{ps} $
 is the overlap length of the predecessor district’s boundary
$ p $
is the overlap length of the predecessor district’s boundary
$ p $
 within the successor districts’ boundaries
$ s $
within the successor districts’ boundaries
$ s $
 ;
$ B\left(p,{t}_1\right) $
;
$ B\left(p,{t}_1\right) $
 is the length of the predecessor boundary at t1, and
$ B\left(s,{t}_2\right) $
is the length of the predecessor boundary at t1, and
$ B\left(s,{t}_2\right) $
 is the length of the successor boundary at t2.
The MAPS Measures
Margin
To capture boundary shifts, I calculate the length of each district’s boundary, p, at t1 and the boundary of its successor district, s, at t2. The shared segments of p’s boundary with s are identified and summed to determine the total length of overlapping boundaries. This overlap is then expressed as a proportion of the combined boundary lengths of p and s. To create a metric that reflects boundary change, I invert the scale so that less overlap corresponds to higher boundary-change scores, highlighting greater shifts in district boundaries.
Alignment
I assess the degree of overlap between districts across redistricting cycles using a weighted metric I term “effective districts,” inspired by Laakso and Taagepera’s (Reference Laakso and Taagepera1979) index for political parties. This metric adjusts for the extent of overlap, distinguishing between cases with extensive overlaps and those with minor ones. Higher values occur when overlaps are spread evenly across multiple successor districts (e.g., a district split evenly into four parts would score four), while lower values occur when overlap is concentrated in a single district (e.g., a district with 95% overlap in one successor and minimal overlap in others would score slightly above one). Higher values indicate greater change in district alignments.
Position
Location shifts in districts are measured by calculating the Haversine distance (in meters) between the centroids of districts at t1 and t2. Larger centroid distances represent greater positional changes.
Size
District size changes are quantified by comparing the area of a district at t1 to its successor at t2. The relative growth or shrinkage is captured by taking the logarithm of the ratio of the successor district’s area (s) to the predecessor district’s area (p). To focus on the magnitude of size change, I use the absolute value of this logarithmic ratio, which captures deviations from zero (indicating no size change), regardless of whether the district grew or shrank.
MAPS and Spatial Change
MAPS scores quantify the extent of spatial change between maps with a precision unavailable from visual inspection alone. Figure 1 shows Alabama’s congressional districts in the 2000 (left), 2010 (center), and 2020 (right) cycles. We can see that the maps look similar, but we do not know exactly how similar. MAPS scores show just how limited Alabama’s redistricting change was: in the 2010 cycle, the average change across its seven districts was 0.76 standard deviations below the national mean, and in 2020 it was nearly a full standard deviation below average. Some districts experienced particularly minimal change; the First and Second Districts were almost 1.5 standard deviations below the national average in both cycles.
Minimal-Change Maps in Alabama, 2000, 2010, and 2020 Cycles

Figure 1 Long description
The three maps display the outline of Alabama with internal lines representing seven congressional districts.
* The first map on the left represents the 2000 cycle. It features a highly irregular, jagged district boundary stretching from the West-Central region toward the Northeast. The southern districts are divided by a vertical line that jogs East then South toward the coast.
* The second map in the center represents the 2010 cycle. The central district boundary is modified, appearing slightly more compact in the North-Central area while maintaining a jagged corridor toward the East. The boundary in the Southwest corner shows a more pronounced inward curve compared to the 2000 map.
* The third map on the right represents the 2020 cycle. The boundaries remain largely similar to the 2010 version, with the most complex, interlocking borders concentrated in the central and West-Central regions of the state.
Across all three maps, the northernmost district and the southernmost coastal district maintain the most stable outer perimeters, while the most significant shifts in line placement occur in the central ‘Black Belt’ and urban-adjacent regions.
MAPS scores are standardized according to the maximum and minimum value they could possibly assume in a given district and state (see the online appendix for details), both to aid interpretation and to allow the scores to be combined into an average-change index for each district, for each pair of successive congresses. The overall change score for a district is a composite of the four MAPS measures: the average of the four standardized MAPS measures for that district for each pair of successive congresses. This means that the resulting scores are not strictly bounded between zero and one. So an average MAPS score is not an absolute metric with natural units (such as the percentage of land area moved) but a relative index that allows us to calibrate and compare the magnitude of change across districts, states, and congresses. Higher scores mean more change; lower scores mean more continuity.
MAPS scores are calculated for every pair of successive congresses so they capture spatial change and continuity between as well as within cycles, including mid-cycle redistricting in states such as Texas or Pennsylvania. Mid-cycle redistricting was a common occurrence prior to the institutionalization of decadal post-Census redistricting in the mid-twentieth century (Engstrom Reference Engstrom2013); today, most states confine redistricting to the post-Census period, which makes the 2025 redistricting changes in Texas, North Carolina, Missouri, and California so striking. A low-change state is one that minimizes redistricting change even during these redistricting windows. To calculate these overall scores by cycle, I extract only on-cycle pairs of congresses (those ending in a two or a seven), and find the average of all the MAPS scores for all districts in each cycle.
MAPS scores are standardized within each state so that higher values correspond to greater changes in district boundaries on each of the four dimensions. While this scaling typically produces scores between zero and four, scores can fall below zero or rise above four when observed changes are exceptionally low or high. For example, Montana’s 2020-cycle redistricting, following the dissolution of the state’s at-large district and the gaining of a second seat, generated scores above seven, reflecting an unusually dramatic disruption to district continuity. In general, however, most scores fall within the zero-to-four range, making the scale straightforwardly comparable across districts and time. Negative MAPS scores arise from standardization: because each component is normalized relative to its observed or theoretical range, districts with exceptionally low values on all components can fall slightly below zero. These negative values indicate effectively no spatial change, not change in the opposite direction.
Roughly speaking, MAPS scores typically correspond to the following scenarios: scores above three or four are extreme values indicating major redistricting events, such as the elimination of districted elections or of an at-large district (e.g., Alabama’s 1962 dissolution of all districts to elect its eight representatives at-large). Numbers above two or three indicate very substantial reorganization of districts, often when states lose one or even several seats in reapportionment (e.g., Connecticut’s 2000 cycle). Scores above one typically indicate active redistricting that includes gerrymanders, such as North Carolina’s 2010 cycle or the “Hochulmander” in New York’s 2020 cycle. Several (though by no means all) MAPS scores in this one-to-two range involve states gaining a seat during reapportionment (e.g., Florida’s 2010 cycle). MAPS scores under one indicate more moderate levels of redistricting change, often when states retain the same number of districts during reapportionment. Numbers under 0.5 indicate minimal levels of redistricting change, where mapmakers make very few changes to existing maps, such as Mississippi’s and Alabama’s maps in the 2020 cycle. The very lowest, negative scores indicate no change. These scenarios are merely indicative, however, and should not be treated as rigid categories, because individual districts are assigned their own MAPS scores for each pair of successive congresses; mapmakers could reconfigure districts in one part of a state while leaving other districts intact.
In the first part of the twentieth century, prior to the one-person-one-vote era, many states minimized or even ignored their duty to redistrict, and Congress itself failed to reapportion the House between 1911 and 1930. These stagnant districts—and the necessary correction in 1932—can be seen by examining the average combined MAPS scores by cycle as shown in figure 2.
Average MAPS Scores by Cycle, 1900–2020

Figure 2 Long description
The horizontal X-axis is labeled Cycle and ranges from 1900 to 2020 in 10-year increments. The vertical Y-axis is labeled Average M A P S Scores and ranges from 0.0 to 1.0 with grid lines extending to approximately 1.3.
Data values by decade are as follows:
* 1900: approximately 0.45
* 1910: approximately 0.25
* 1920: negative value, approximately -0.2
* 1930: sharp increase to approximately 1.1
* 1940: slight negative value, approximately -0.05
* 1950: approximately 0.2
* 1960: approximately 0.45
* 1970: significant increase to approximately 1.05
* 1980: approximately 1.15
* 1990: peak value at approximately 1.3
* 2000: approximately 1.05
* 2010: approximately 1.25
* 2020: approximately 1.05
The chart shows high volatility between 1900 and 1960, followed by a sustained period of higher scores above 1.0 from 1970 through 2020.
MAPS scores in 1920 averaged well below zero, with a standard deviation of just 0.25; when long-overdue reapportionment finally came in the 1930s, MAPS scores averaged over one (but with a standard deviation above three). In the modern era, redistricting change is higher (above one, with standard deviations of around 0.8) than it had been before the 1960s, but there are still noticeable peaks in the 1990 cycle (with the push for majority-minority districts) and the 2010 “great gerrymander” cycle (figure 2).
Yet figure 2 conceals wide variation in the extent to which different states alter or retain existing maps in the modern era. Some states had one or two cycles of limited change to existing maps while others are persistently low-change. Table 2 displays the 10 states with the lowest levels of change in each cycle according to MAPS scores since redistricting was first regularized at decennial intervals, arranged from lowest to highest levels of change, with average MAPS scores across all districts in that state and cycle in parentheses.
States with the Lowest Mean Change in Each Redistricting Cycle, 1960–2020

Table 2 Long description
The table consists of two columns: Cycle and Least-change states.
* 2020: Connecticut -0.05, Alabama 0.24, Wisconsin 0.27, South Carolina 0.33, Louisiana 0.34, Mississippi 0.47, Oklahoma 0.51, Kentucky 0.57, Minnesota 0.57, Pennsylvania 0.66.
* 2010: Oklahoma -0.05, Connecticut 0.03, Oregon 0.15, Minnesota 0.58, Mississippi 0.59, Alabama 0.63, Virginia 0.73, Arkansas 0.77, Kentucky 0.94, Kansas 0.96.
* 2000: Oregon 0.07, Louisiana 0.23, Arkansas 0.26, South Carolina 0.43, Kansas 0.43, Washington 0.56, Kentucky 0.57, Alabama 0.60, Texas 0.64, Massachusetts 0.67.
* 1990: Wisconsin 0.34, Mississippi 0.39, Connecticut 0.41, Oklahoma 0.48, Arkansas 0.60, Tennessee 0.62, Missouri 0.70, Alabama 0.88, Minnesota 0.98, Indiana 1.10.
* 1980: Alabama 0.00, Louisiana 0.16, West Virginia 0.27, North Carolina 0.47, Connecticut 0.56, Kentucky 0.71, Oregon 0.72, Virginia 0.73, South Carolina 0.74, Wisconsin 0.79.
* 1970: Mississippi 0.12, South Carolina 0.31, Oregon 0.33, North Carolina 0.40, Kentucky 0.52, Oklahoma 0.58, Kansas 0.58, Pennsylvania 0.69, Texas 0.85, California 0.94.
* 1960: Texas, Oklahoma, Georgia, South Carolina, Tennessee, Indiana, Virginia, Washington, Oregon, and Wisconsin all share a value of -0.26.
Alabama, Kentucky, Oklahoma, Oregon, and South Carolina each had five cycles of low change since 1960. Connecticut and Mississippi had four such cycles. Other states, such as North Carolina or Pennsylvania, had one or two low-change cycles as shown in table 2 but otherwise redistrict radically, sometimes out of cycle, as mapmakers attempt to inject their priorities into the redistricting process through gerrymandering. Persistent low-change maps are those that remain low-change for multiple cycles. Southern states are overrepresented among low-change maps, although table 2 shows that low-change maps are not confined to that region: many states have produced at least one recent “minimal change” redistricting cycle, including Minnesota and Kansas.
Courts applying traditional districting principles of compactness, contiguity, and respect for existing jurisdictional boundaries—and signaling their reluctance to enter the political thicket of redistricting—have incentives to pursue minimal-change maps. Of the last three cycles shown in table 2, minimal-change maps were drawn by state or federal courts in Oregon, Minnesota, Texas, and South Carolina (2000 cycle); Connecticut, Minnesota, and Mississippi (2010 cycle); and Minnesota and Connecticut (2020 cycle). It is striking that, apart from Washington’s map in the 2000 cycle, none of the minimal-change maps in table 2 were drawn by an independent redistricting commission.
Maps are typically drawn by legislators. Does minimizing spatial change help to protect incumbents? We know that incumbents derive electoral advantages from media exposure and various resources (Cox and Katz Reference Cox and Katz1996; Mayhew Reference Mayhew1974), and that a candidate-oriented politics increases the value of incumbency status (Ferejohn Reference Ferejohn1977). The redistricting revolution of the 1960s broke geographical links between districts and local party organizations, increasing the importance of candidate experience, which would associate incumbency advantage with high levels of spatial change (Carson, Engstrom, and Roberts Reference Carson, Engstrom and Roberts2007; Cox and Katz Reference Cox and Katz2002). Yet minimal-change maps offer stability and predictability, allowing reelection-focused incumbents to maintain existing campaign infrastructure and increase voter recognition (Hood and McKee Reference Hood and McKee2010). MAPS scores allow us to examine whether and how redistricting change correlates with patterns of incumbency.
I match individual members of Congress who held each seat in the congress immediately prior to a redistricting cycle (congresses ending in a two or a seven) and immediately after it (congresses ending in a three or an eight) for all redistricting cycles from 1960 to 2020. Incumbency rates are high, though not as high as elections taking place outside the redistricting cycle over this period (an 82% incumbency rate). During these redistricting cycles, 2,110 seats (69% of the total) retained their incumbent legislator, and 954 changed hands (31%). There is a close relationship between the extent of spatial change and whether a seat retains an incumbent. The mean MAPS score is 1.48 for districts that changed hands; it is 0.859 for districts that retained their incumbent. Since the mean MAPS score overall is 1.05 and the standard deviation is 0.88, the difference in MAPS scores between districts that changed hands or retained an incumbent corresponds to 0.7 standard deviations—a moderately large effect, indicating a substantial increase in the chances that an incumbent retains his or her seat under minimal redistricting change conditions. This descriptive evidence suggests that since the 1960s, incumbents have been more likely to retain their seats in districts with low levels of spatial change, though a systematic analysis of incumbency effects lies beyond the scope of this paper.Footnote 6
Redistricting change also corresponds with patterns of racial representation. States that experience the least spatial change in a given cycle—those with the lowest average MAPS scores—are the least likely to increase the number of Black representatives. Conversely, gains in Black congressional representation tend to occur in states and cycles with the highest levels of spatial change. To illustrate, I divide state-cycle combinations into three categories—low, mid, and high change—based on the average MAPS scores across all districts in a state for that cycle (for example, the 2010 cycle in Arizona or the 1980 cycle in Massachusetts). I then count how the number of Black representatives changes between the predecessor congress (ending in a two or a seven) and its immediate successor.Footnote 7 The 1990 redistricting cycle brought notable increases in Black representation across Southern states, including Florida, North Carolina, and Georgia, among others. Gains also occurred in other regions in earlier and later cycles: California in the 1960 and 1970 cycles, Indiana in 1980, and Ohio in 2010 and 2020. While losses of Black representatives have been rarer in the post–civil rights era, they do occasionally occur; for example, after J. C. Watts retired from Oklahoma’s Fourth District (107th Congress) and Tim Scott left South Carolina’s First District for the Senate (112th Congress), their House seats were subsequently won by white representatives.
Figure 3 shows the number of state-cycle combinations that saw gains, losses, or no change in the number of Black representatives, split according to the average MAPS score for that state-cycle combination. I count any gain as a gain, of whatever magnitude (likewise losses), to avoid skewing the results in favor of larger states.
Change in Black Representatives by Low, Mid, or High MAPS Scores

Figure 3 Long description
The y-axis is labeled Number of State-Cycle Combinations with a scale from 0 to 100 in increments of 25. The x-axis categorizes data into Low Change, Mid Change, and High Change. A legend to the right identifies three bar types: Gains (black), Loses (dark gray), and No change (light gray).
* Low Change: The No change bar is the highest at approximately 97. Gains are very low at approximately 4, and Loses are the lowest at approximately 2.
* Mid Change: The No change bar is approximately 60. Gains increase slightly to approximately 6, while Loses decrease to approximately 1.
* High Change: The No change bar is approximately 50. Gains show a notable increase to approximately 13, and Loses increase slightly to approximately 3.
Overall, the No change category dominates all groups but decreases as the degree of change increases, while Gains are highest in the High Change category.
The “no change” bar in figure 3 shows a clear gradient: low levels of spatial change are associated with no change in the number of Black representatives, but the number of high-change state-cycle combinations that saw gains in Black representation is more than triple the number of low-change state-cycle combinations that saw gains in Black representation (and double that of the mid-change category). By comparison, consider the number of state-cycle combinations that saw changes in female representation as shown in figure 4.
Change in Female Representatives by Low, Mid, or High MAPS Scores

Figure 4 Long description
The Y-axis is labeled Number of State-Cycle Combinations with a scale from 0 to 100 in increments of 25. The X-axis is categorized into three groups: Low Change, Mid Change, and High Change. A legend to the right identifies three bar types: Gains (black), Loses (dark gray), and No change (light gray).
* In the Low Change category, No change is the dominant outcome at approximately 87 units, while Gains and Loses are both low, under 10 units.
* In the Mid Change category, No change drops to approximately 44 units. Gains increase to approximately 15 units, and Loses remain low at approximately 8 units.
* In the High Change category, No change is at approximately 41 units. Gains are at their highest at approximately 16 units, and Loses are at approximately 9 units.
Overall, the No change outcome is most frequent across all categories but decreases significantly as the M A P S score change moves from Low to Mid or High.
As in figure 3, state-cycle combinations with the lowest levels of spatial change are far more likely to have no change in the number of female representatives, but unlike figure 3, there is little difference between state-cycle combinations experiencing medium or high levels of change in terms of gains or losses of female representation, or no change at all. These figures suggest that racial representation is particularly sensitive to levels of spatial continuity or change—more so than gender representation. These broad-brush patterns do not establish a direct causal relationship between spatial change and minority representation, but they highlight a systematic association that motivates closer examination through case evidence, presented in the second and third parts of this paper.
This pattern—that racial representation is highly sensitive to levels of spatial redistricting change—cannot be reduced to population growth alone. While diverse urban districts and some high-growth suburbs create favorable conditions for women and nonwhite candidates (Kaufman Reference Kaufman2021; Ondercin Reference Ondercin2022), population growth by itself does not determine whether boundaries are revised. What matters for redistricting is the distribution of growth across the state: a district may grow rapidly, but if the state as a whole grows at a similar pace, its lines may remain unchanged (Kondik and Coleman Reference Kondik and Coleman2021b). Conversely, a district with a stagnant or declining population may trigger more extensive revisions if surrounding areas are booming. MAPS scores capture these spatial adjustments—or their absence—rather than simply reflecting raw demographic expansion.
MAPS scores allow us to drill down to district-level patterns of spatial change and continuity. I calculate the lowest 5% of all districts for spatial change in each redistricting cycle, excluding from this calculation those whole-state at-large districts, such as Delaware and Wyoming, that did not change during this period. The scores for Wisconsin provide quantitative support for Robert Yablon’s (Reference Yablon2022) argument that Wisconsin Republicans strategically froze the map in the subsequent cycle to preserve their partisan gains after a radical gerrymandering cycle in 2010. My MAPS scores confirm that the state’s Third, Sixth, Seventh, and Eighth Districts were among the lowest 5% of districts for spatial change in the 2020 cycle.
One of the most visually obvious instances of minimal change after a gerrymandering cycle is Wisconsin’s Third District (figure 5), which became dramatically less compact between the 2000 cycle (left-hand side), and the 2010 gerrymandering cycle (center). Its 2020-cycle iteration (right-hand side) was an almost exact replica of the previous version, preserving the benefits for Republicans gained in the previous cycle. MAPS scores show that Wisconsin’s Third District was in the lowest 5% of districts for spatial change during the 2020 cycle.
Gerrylaundering in Wisconsin’s Third District, 2000, 2010, and 2020 Cycles

Figure 5 Long description
A three-panel series of black-and-white line maps showing the evolution of a political district boundary.
* The first map on the left represents the 2000 cycle. It shows a relatively compact shape with a jagged western border following a river and a mostly straight eastern border.
* The second map in the center represents the 2010 cycle. The shape has become significantly more irregular. A large section has been removed from the North, and a long, narrow corridor extends East and then North, creating a hook-like shape on the right side of the map.
* The third map on the right represents the 2020 cycle. It is nearly identical to the 2010 map, maintaining the irregular hook-shaped extension on the eastern side and the jagged river border on the West, with only minor adjustments to the perimeter lines.
Table 2 also supports the proposition that Mississippi engaged in racial gerrymandering in the aftermath of the passage of the VRA in 1965 and then froze those racially gerrymandered districts to minimize Black representation; the state had the lowest overall MAPS scores in the 1970 cycle, and two of its horizontally oriented districts cracking Black Delta-region voters—the Second and Third Districts—were in the lowest 5% of districts for spatial change in that cycle.
At least 10 of the lowest 5% of districts for change are majority-minority districts, including Black-majority districts (Louisiana’s Second and Mississippi’s Second); Asian-majority districts (California’s Seventeenth and Hawaii’s First); and Latino-majority districts (California’s Sixteenth and Twenty-Ninth, Florida’s Twenty-Sixth, and Texas’s Fifteenth, Sixteenth, and Twenty-Third). Since majority-minority districts are protected under the VRA, mapmakers are wary of dismantling them for fear of litigation. Yet efforts to minimize change to such districts have also provoked lawsuits in some states. For instance, Florida’s majority-Latino Twenty-Sixth District (the successor to which was named the Twenty-Eighth District) was one of the least-changed districts in the 2020 cycle. The American Civil Liberties Union and other plaintiffs in a 2024 lawsuit, Cubanos Pa’Lante v. Florida House, argued that in preserving the district the Florida legislature ignored the diversity of south Florida’s Latino voters. Their complaint alleged racial gerrymandering on the grounds that legislators had admitted that the districts were race based and protected as such, treating diverse communities as a monolith even as the Latino vote became less cohesive. In comments cited in the complaint, House Redistricting Committee Chair Tom Leek asserted that the top-tier goal of mapmakers was to “preserve” and “protect” these districts as majority-minority Hispanic districts.Footnote 8
In South Carolina’s 2020 cycle, legislators “waited months to pass any maps at all,” an “unreasonable postponement of their constitutional duties” that drew a court challenge.Footnote 9 They finally approved a map on party lines to “keep a lock on the status quo” (Collins Reference Collins2022a), minimizing changes to the existing map except for the movement of many Black voters out of the First District, a move challenged on racial gerrymandering grounds but ultimately affirmed by the US Supreme Court in Alexander v. South Carolina State Conference of the NAACP. Footnote 10 “Don’t fix what isn’t broken,” said one Republican legislator; “this plan is a minimal change plan,” said another (Collins Reference Collins2022b). South Carolina’s reliably Republican Seventh District, unaffected by the boundary changes that moved voters between the First and Sixth Districts, was one of the 5% least-changed districts nationwide according to my MAPS scores.
The MAPS analysis shows that minimal changes to district boundaries are far from neutral or technocratic decisions: they consistently protect incumbents and are associated with stagnation in Black representation. For example, districts in Mississippi with some of the lowest MAPS scores were effectively frozen in place across the 1970 and 1980 redistricting cycles, preserving gerrymandered configurations. By contrast, states with higher spatial change are more likely to see gains in Black representation. These findings are suggestive of the possibility that low-change maps not only stabilize political advantage but can also entrench representational inequalities. The next section develops a theoretical account of this phenomenon—dilutive drift—to describe how demographic change collides with institutional inertia in ways that can systematically undercut political representation for growing communities of color.
Dilutive Drift and Gerrylaundering
Recent population growth has been driven by communities of color. Latino people account for 53% of the total US population growth between 2010 and 2022, Asian people 20%, Black people 8%, and two or more races 34% (Krogstad et al. Reference Krogstad, Passel, Moslimani and Noe-Bustamante2023). By contrast, the share identifying as “white alone” has decreased substantially. In many states—including Alabama, Kentucky, Louisiana, Minnesota, Nebraska, Oklahoma, and Wisconsin—the white population has shrunk while the total population has grown. Racially polarized voting remains high across the South, with districts in states such as Louisiana, Mississippi, and Alabama exhibiting racial gaps exceeding 60 percentage points (Kuriwaki et al. Reference Kuriwaki, Ansolabehere, Dagonel and Yamauchi2023). In the most polarized states, the white-alone, non-Latino share fell by over 10 points in Arkansas and eight in Alabama and Louisiana between 2000 and 2020, while the Latino population increased by 30–70%.
In redistricting, representative democracies confront the tension between societal flux and institutional persistence. Minimizing change to district maps might seem normatively preferable: a cautious approach that protects district cores, communities of interest, and incumbents—principles specified in some state laws. The VRA also deters disruption to existing majority-minority districts. Yet rigid adherence to minimal change can generate serious inequities. The famous cases of the 1960s—Baker v. Carr, Reynolds v. Sims, and Wesberry v. Sanders—involved extreme malapportionment caused by demographic shifts colliding with frozen maps,Footnote 11 producing racial and rural–urban imbalances (Emerson Reference Emerson1962; Goldberg Reference Goldberg1962; Hames Reference Hames1961).
Public policies can change their effects when policy makers fail to adapt them to new conditions—in other words, they drift (Hacker Reference Hacker2004; Hacker, Pierson, and Thelen Reference Hacker, Pierson, Thelen, Mahoney and Thelen2015; Rocco and Thurston Reference Rocco and Thurston2014). Drift stems from both interval freezing (rigid numerical thresholds) and categorical freezing (rigid category boundaries) (Hackett Reference Hackett2023). Categorically frozen maps drift when boundaries do not adjust to where and how different groups live.
Population shifts after a map’s enactment continually render districts malapportioned, but these inconsistencies only become legally and politically significant when they grow large. To take an extreme example, the US Senate’s fixed apportionment has produced one of the most malapportioned legislative bodies in the world (Archer et al. Reference Archer, Brunn, Martis and Webster2024), overrepresenting small, rural, whiter states (Johnson and Miller Reference Johnson and Miller2023). Before the 1960s, malapportionment drift plagued the House and state legislatures, favoring white, Protestant, and rural interests (Argersinger Reference Argersinger2012). Post Baker, districts must have equal populations, but equipopulous districts can still become racially dilutive if they fail to offer communities of color equal opportunity: “[P]opulation equality guarantees almost no form of fairness beyond numerical equality of population” (Gelman and King Reference Gelman and King1994, 553).
Historically, minimizing changes to district maps has helped to preserve racial hierarchies—either by maintaining earlier racial gerrymanders (a form of gerrylaundering [Yablon Reference Yablon2022]), or by failing to update maps in response to demographic change, a process I call dilutive drift.
Racial Gerrylaundering
After cracking and packing Black voters to dilute their influence, mapmakers may choose to preserve those boundaries in subsequent redistricting cycles. This process—racial gerrylaundering—was evident in Alabama’s and Georgia’s refusal to alter dilutive multimember districts, which preserved white incumbents in the 1960 and 1970 cycles (Billingsley Reference Billingsley, Hardy, Heslop and Anderson1981; Stewart et al. Reference Stewart, Dauer, Magiotto, Koven, Billingsley, Singleton and Weber1981). It also occurred in Mississippi during the 1970 and 1980 cycles, as the MAPS scores from the previous section indicate. In 1966, as Black voter registration surged following decades of disenfranchisement, the Mississippi legislature redrew its congressional districts to dismantle the historic Delta-region district, splitting its Black population across five majority-white districts. This effort to reduce Black political influence was then entrenched through minimal-change maps in the following decades, preserving the boundaries of the original racial gerrymander. A similar pattern occurred in Virginia’s Third District, which was drawn in the 1990 redistricting cycle and later ruled an unconstitutional racial gerrymander by a district court. Despite this ruling, the state legislature preserved the same problematic district in both the 2000 and 2010 cycles.Footnote 12 After the district was struck down again in 2014 and the state was ordered to implement a remedy by 2015, the Virginia General Assembly failed to act. Ultimately, the court appointed a special master to redraw the map, ending decades of racial gerrylaundering.Footnote 13
Dilutive Drift
Mapmakers can also fail to increase the number of majority-minority or minority-opportunity districts as the nonwhite population expands, thereby diluting their votes.Footnote 14 For example, there is a long history of Latino underrepresentation in Texas, a state where incumbents pressed to retain existing district configurations and limit change for decades (Bickerstaff Reference Bickerstaff and Robert Heath2020). During the 1980 redistricting cycle, extensive population growth driven by Latin Americans brought calls for a third majority-Latino congressional district, but the legislature refused to create it. This dilutive drift was remedied only by a district court judgment ordering the creation of three new districts with substantial Latino majorities (Parker Reference Parker and Davidson1989). The minimal-change map reduced the electoral influence of minority voters. In the 2000 cycle, plaintiffs again attacked mapmakers’ failure to create additional Latino-majority districts in south Texas and in Dallas and Tarrant Counties, and to create new “minority-influence” districts in Dallas, Harris, Tarrant, and Jefferson Counties, but these complaints were dismissed.Footnote 15 Mapmakers’ focus on incumbent protection has often limited adjustments that might address dilutive drift. For example, in New York, Black and Latino residents lobbied for new majority-minority districts and filed multiple lawsuits after the state gained many Latino residents during the 1980s, but the state’s legislators deadlocked on the creation of a new map that would have threatened incumbents (Monmonier Reference Monmonier2001).Footnote 16
Least-change maps do not always reduce minority representation, but certain conditions make vote dilution more likely. Although MAPS scores do not test for vote dilution directly, they do systematically detect minimal-change maps that are vulnerable to dilutive drift.Footnote 17 Maps drift if they do not change sufficiently to accommodate changing racial demographics. Minimizing changes to district boundaries can entrench partisan or racial advantages, limiting opportunities for minority representation. However, the effects of low spatial change on political representation are not determined by geography alone. The impact of such boundary preservation is magnified in contexts where voting patterns are deeply divided along racial lines. Racially polarized voting amplifies the consequences of these minimal-change redistricting strategies.
Some states are more vulnerable to vote dilution than others. We would only expect dilutive drift in states with substantial nonwhite populations and racially polarized voting (Hood, Morrison, and Bryan Reference Hood, Morrison and Bryan2018), when minimal-change maps and demographic shifts collide. Many states in the Deep South meet the conditions for dilutive drift: they have a large and politically cohesive nonwhite population (most US House representatives from these states are conservative white Republicans); like many other states, their white population has shrunk rapidly in recent decades; and MAPS scores show that, since redistricting became regularized in the 1960s, maps in states such as Alabama and Louisiana have persistently ranked among the least changeable in the nation. Of the five Deep South states with high levels of racially polarized voting, shrinking white populations, and frequently low-change maps—Louisiana, Alabama, South Carolina, Mississippi, and Arkansas—a congressional delegation that reflected the Black population would collectively more than double the number of seats represented by Black individuals.
Dilutive drift is characteristic of any districted system—not only congressional districts—where categorically frozen district maps collide with demographic change. For instance, Mississippi’s Supreme Court is elected from districts that have been redistricted just once since their creation in 1892. After almost a century of stasis, a group of Black plaintiffs challenged the state’s frozen lines as unconstitutionally malapportioned.Footnote 18 The state legislature redrew the districts in 1987, but dilutive drift continued. By 2024, plaintiffs alleged, the 37-year-old district lines were diluting the vote of Black Mississippians worse than ever: “[T]he number of Black Supreme Court justices has not changed in decades, even though the population of the State has shifted, and … racial polarization in voting has worsened in the [past] 30 years” (italics in original).Footnote 19 Drift occurred because the demographics shifted while the lines did not. The complaint pointed to demographic analysis showing that Mississippi experienced “decades of statewide Black population growth and White population decline.”Footnote 20 Moreover, plaintiffs alleged that this dilutive drift was the product of deliberate and strategic [in]action by mapmakers. In a state 40% Black, they noted, “there has never been more than a single Black justice on the state’s nine-member Supreme Court, and no Black person has ever been elected to the State Supreme Court without first being appointed by the Governor. This is not mere happenstance.”Footnote 21
But how does dilutive drift operate on the ground? That depends on how much communities of color have grown, and where the population growth is distributed in space. In the next section I introduce the processes of passive packing and passive cracking: two mechanisms by which dilutive drift diminishes the electoral influence of communities of color.
Passive Packing and Passive Cracking
Low-change maps do not necessarily lead to racial imbalances between districts, but where there is racially polarized voting and the majority party usually defeats the minority’s preference, population growth that adds to existing nonwhite supermajorities, or population growth that is distributed across several white-majority districts where a new majority-minority district could have been drawn, low-change maps can reduce the likelihood that racial-minority voters are able to elect their preferred candidates. Fundamentally, vote dilution cannot occur when minority population growth is so evenly distributed that it is impossible to draw a new majority-minority or minority-opportunity district, because in this situation the effectiveness of the minority-group members’ votes is already low, or at least will not be made lower by any particular map configuration.
Dilutive drift subtly reduces the effectiveness of minority-group members’ votes rather than denying the ballot outright (Stephanopoulos Reference Stephanopoulos2021). The concept of vote dilution is contested and eludes simple operationalization (Elmendorf, Quinn, and Abrajano Reference Elmendorf, Quinn and Abrajano2016; Grofman, Handley, and Niemi Reference Grofman, Handley and Niemi1992; Scarrow Reference Scarrow1999). Measuring vote dilution is difficult because it can involve either packing or cracking, or both: concentrating communities of color in a small number of districts to minimize their influence elsewhere, or dispersing communities of color across a variety of districts to prevent them forming a majority in any district. Vote dilution occurs because of the propensity of an identifiable group to vote as a bloc (Davidson Reference Davidson and Davidson1989). In Thornburg v. Gingles, the Supreme Court laid out conditions for analyzing vote dilution claims.Footnote 22 No evidence of discriminatory intent is required, since requiring such proof would substantially increase the difficulty and cost of pursuing litigation.
The subtlety of vote dilution presents one analytical obstacle; another is disagreement about the underlying theory of representation. Majority-minority districts privilege descriptive representation—the election of nonwhite representatives that reflect racially diverse populations—over substantive representation—the enactment of legislation that furthers the interests of nonwhite communities (Cameron, Epstein, and O’Halloran Reference Cameron, Epstein and O’Halloran1996; Overby and Cosgrove Reference Overby and Cosgrove1996). We know that citizens value descriptive representation independently of substantive representation (Hayes and Hibbing Reference Hayes and Hibbing2017). Courts have rejected some majority-minority districts on equal protection grounds,Footnote 23 and explicitly rejected strict descriptive proportionality between representatives and population demographics,Footnote 24 yet majority-minority districts are a clear, visible standard for judging progress or retrogression in minority representation; may foster shared identity between representatives and constituents (Mansbridge Reference Mansbridge1999); and have been an effective means of diversifying the House.
Depending on where population growth occurs, dilutive drift takes different forms. If minority population growth is concentrated spatially in areas near existing communities of color, a minimal-change map risks passive packing: failure to prevent existing majority-minority districts becoming supermajority-minority districts. Passive packing reduces the electoral effectiveness of racial-minority votes by concentrating them into a smaller number of districts. If minority population growth is more geographically dispersed, the minimal-change map risks passive cracking: failure to create new majority-minority districts that offer opportunities for political voice commensurate with size of the minority population. The slow decline in residential segregation in metropolitan areas over the last 30 years might make passive cracking more likely than passive packing in certain areas because the nonwhite population has become more dispersed, although spatial assimilation is also accompanied in some areas by increasing racial concentration (Lichter, Parisi, and Taquino Reference Lichter, Parisi and Taquino2015; Wright et al. Reference Wright, Ellis, Holloway and Wong2014).
To illustrate, consider a stylized four-district state with one majority-minority district and three majority-white districts (figure 6). The state is 37.5% nonwhite. There are 16 people, divided equally into districts of four.
One Majority-Minority District and Three White Districts

The census shows that the population expanded from 16 to 20 people, but the state kept pace with nationwide population growth and is again apportioned four seats. The new ideal district size is five. All of the population growth comes from communities of color—the state is now 50% nonwhite—and that population growth is concentrated, located close to the original communities of color. One minimal-change map, shown in panel A of figure 7, passively packs the nonwhite population into a supermajority-minority district 1, leaving the other districts majority white. This map limits changes to the existing district margin, alignment, position, and size to the minimum required to incorporate the new population. An alternative approach, shown in panel B of figure 7 (active response), reshapes districts more comprehensively to create two majority-minority districts, districts 1 and 2.Footnote 25
Passive Packing with Concentrated Population Growth

Figure 7 Long description
The diagram consists of two panels, Panel A and Panel B, each containing a grid of 24 circles divided into four irregular zones by blue lines.
Panel A, titled Passive Packing, shows:
* Zone 1 (Top-Left): Contains five black circles.
* Zone 2 (Bottom-Left): Contains two black circles on top and three white circles on the bottom.
* Zone 3 (Top-Right): Contains one black circle and four white circles.
* Zone 4 (Bottom-Right): Contains three black circles and three white circles.
Panel B, titled Active Response, shows a shift in the blue boundaries and circle occupancy:
* Zone 1 (Top-Left): Now contains five black circles and one white circle.
* Zone 2 (Center-Left): Contains two black circles and four white circles.
* Zone 3 (Top-Right): Contains one black circle and three white circles.
* Zone 4 (Bottom-Right): Contains two black circles and three white circles.
In both panels, the black circles represent concentrated growth, while the white circles represent empty or less dense areas, illustrating how the boundaries of the four zones adapt to the population distribution.
If nonwhite population growth is more dispersed (as shown in figure 8), but not so dispersed as to render a new majority-minority district impossible, then a minimal-change map might passively crack the nonwhite population across multiple majority-white districts. Figure 8 retains the status quo in panel A and makes minimal changes to the locations and shape of the four previous districts: one majority-minority district, three majority-white districts—exactly the same configuration as in panel A of figure 7. In this scenario, the mapmakers again limit changes to district margin, alignment, position, and size to the minimum required to add the new voters. In panel B of figure 8, however, mapmakers take a more active approach, distributing the nonwhite population more efficiently so that two districts (districts 1 and 2) become majority-minority (active response).
Passive Cracking with Dispersed Population Growth

Figure 8 Long description
Panel A is titled Passive Cracking. It shows a 6 by 4 grid of circles divided into four regions by blue lines. Region 1 at the top left contains two black circles on top and one black and one white circle on the bottom. Region 2 at the bottom left contains one white and one black circle. Region 3 at the top right contains one white, one black, and one white circle on top, and one black, one white, and one black circle on the bottom. Region 4 at the bottom right contains three white circles and two black circles.
Panel B is titled Active Response. It shows the same 6 by 4 grid but with different blue boundary lines. Region 1 is now an L-shape on the left containing three black and two white circles. Region 2 is a horizontal strip at the bottom containing two black and three white circles. Region 3 is a smaller block at the top right with one white, one black, and one white circle on top, and one white and one black circle below. Region 4 is a central T-shaped area containing two black and three white circles.
The consequences of redistricting changes depend on the context rather than the degree of change itself. Minimal-change maps are not always dilutive; indeed, there are several ways to redistrict in the situations depicted in figure 7 and figure 8 that distribute nonwhite voters efficiently across districts while preserving much of the original district shapes. Conversely, high-change maps could be egregious racial gerrymanders rather than sensitive efforts to safeguard minority representation given changing demographics. But the assumption that minimizing changes necessarily improves representation does not hold consistently across contexts.
Instances of dilutive drift often lead to litigation, as plaintiffs seek judicial remedies for alleged reductions in minority electoral influence. These lawsuits aim to address the ways in which redistricting practices perpetuate dilutive drift. Courts have been pivotal in shaping how these issues play out, sometimes offering recourse for marginalized voters but often enabling drift through reliance on traditional districting principles and efforts to minimize changes to existing maps. The next section examines the evolving role of the courts in addressing—or exacerbating—dilutive drift, with a focus on pivotal cases and their implications for minority representation.
Dilutive Drift in Court
Plaintiffs bring lawsuits alleging dilutive drift under the VRA, which prohibited state or local governments from imposing election rules that abridge the voting rights of racial minorities (Davidson and Grofman Reference Davidson and Grofman1994). Section 2 of the VRA prohibits discriminatory voting laws and protects against minority-vote dilution or vote deprivation through redistricting. States dismantling majority-minority districts can expect VRA litigation even though the Supreme Court struck down the Section 5 coverage formula in Shelby County v. Holder, weakened Section 2 in Brnovich v. DNC, and interpreted the VRA in ways that reduced federal enforcement capacity and placed greater responsibility on external actors to sustain the act’s protections (Snead Reference Snead2024).Footnote 26
As an “agent of drift,” the Supreme Court has been pivotal in reshaping the scope of minority protections in redistricting since the 1990 cycle, resulting in a congressional representation disproportionate to population size—a pattern that has grown as the white share of the population has declined (Schaeffer Reference Schaeffer2023; Snead Reference Snead2023). Until 2013 the VRA was itself an instrument of drift because it required certain jurisdictions to obtain federal preclearance before making any changes to existing election procedures under Section 5.Footnote 27 This nonretrogression provision has historically contributed to dilutive drift at various levels of government. For example, in Beer v. United States, the Supreme Court blocked a district court decision overturning a New Orleans City Council map that contained only one majority-Black district out of five, despite the fact that Black people were then 45% of the population (Snead Reference Snead2024).Footnote 28 The court interpreted Section 5 as prohibiting only dilutive changes, rather than retention of existing discriminatory maps.
In his firsthand account of the proceedings of the California Citizens Redistricting Commission in the 2010 cycle, Commissioner Angelo Ancheta (Reference Ancheta2014) described how the constraints of Section 5 effectively froze certain district boundaries:
[C]ompliance with Section 5 of the Voting Rights Act meant that some of the districts containing counties subject to preclearance were similar in shape to the district developed in previous decades. … [S]ome of the contortions previously necessary to maintain minority voting blocs needed to be repeated in the post-2010 lines. The Commission treated these districts as largely fixed and immovable pieces of the puzzle.
Before its elimination in 2013, Section 5 required mapmakers of all kinds—whether legislators, courts, or commissioners—to maintain district boundaries with limited alterations across cycles.
Yet, even in the absence of Section 5, courts are predisposed to favor low-change maps because they are reluctant to provoke confrontation with elected branches and risk damaging their legitimacy (Hardy Reference Hardy1977).Footnote 29 Minimal-change principles have shaped court jurisprudence in many ways. Litigants frequently frame “least change” as a principle that protects incumbency and preserves stability. For instance, in March 2025 oral arguments in the racial gerrymandering case Louisiana v. Castor, the state identified incumbent protection as a key aim and sought to persuade the justices that “ours was sort of a least-changed map. … [I]t is a similar configuration. … [I]t’s a very similar configuration.”Footnote 30 When courts themselves are required to draw maps, minimizing change is a more restrained approach, even if the low-change map preserves existing biases. For instance, Texas’s 1991 gerrymander was preserved in the 2000 cycle through judicial adoption of a minimal-change approach.Footnote 31 Judges signal their reluctance to intervene by minimizing changes to the status quo.
Courts can also reinforce racial gerrylaundering by simply refusing to advance a remedy. For instance, in Mississippi, the Supreme Court declined to intervene in litigation concerning racially discriminatory districting practices when it decided not to hear oral arguments in Connor v. Johnson, a case concerning Mississippi’s state legislative and congressional district boundaries.Footnote 32 This single-line “nondecision,” with no reasons given, tacitly affirmed the decision of a three-judge district court—composed entirely of judges with documented histories of supporting segregationist positions—that the congressional districting plan was constitutional and not racially discriminatory (Monmonier Reference Monmonier2001; Parker Reference Parker1990). Civil rights lawyer Frank Parker (Reference Parker1990) argued that the Connor nondecision reinforced the position of legislators opposed to expanding Black political representation, warning that in the absence of judicial intervention the state’s newly enfranchised Black electorate would remain politically marginalized. Mississippi preserved the racially discriminatory map for two subsequent cycles using a minimal-change approach; it took more than 20 years after the passage of the VRA for Mississippi to elect its first Black member of Congress since Reconstruction.
Modern vote dilution litigation challenges mapmakers’ failure to create new majority-minority or minority-opportunity districts as the nonwhite population expands. The Coalition Hub for Advancing Redistricting and Grassroots Engagement—a network of nine organizations lobbying to enhance participation through redistricting reform—reported of the 2020 cycle: “The least-change approach to redistricting limits the ability of communities of color to achieve effective representation in redistricting” (Andre et al. Reference Andre, Feng, Kylstra, Langworthy, Mitrovitch, Vicuña and Wang2023, 4).
Texas grew by four million people between 2010 and 2020—the only state to gain two seats in the 2020 reapportionment—and people of color accounted for 95% of that growth. The Black Texan population alone grew by almost two million but the state did not create any new majority-minority districts. Plaintiffs in League of United Latin Am. Citizens v. Abbott alleged that mapmakers’ failure to increase the number of majority-minority districts rendered the 2020-cycle maps unconstitutional.Footnote 33 Georgia grew by more than a million people over the decade even as the number of white residents shrank. A federal district judge ruled in October 2023 that Georgia’s congressional and state legislative districts were unconstitutional because they diluted the voting power of Black voters:
Despite the growth in the Black population in the affected areas and the voter polarization between white and Black Georgians … the Enacted Congressional Plan did not increase the number of majority-Black districts in the Atlanta metro area. By failing to do so, the Enacted Congressional Plan in effect dilutes and diminishes the Black population’s voting power in that area of the State.Footnote 34
In Minnesota, the legislature has failed in its constitutional duty to redistrict its eight congressional districts in every cycle since 1970—neglecting to hold hearings or approve plans before deadlines, voting down proposals, or presenting bills that were vetoed by the governor—so courts have been required to draw district lines in every modern cycle. In the 2020 cycle, the special five-judge redistricting panel endorsed minimal-change principles as a manifestation of politically neutral restraint:
We are not positioned to draw entirely new congressional districts, as the legislature could choose to do. Rather, we start with the existing districts, changing them as necessary to remedy the constitutional defect by applying politically neutral redistricting principles.Footnote 35
The state maintained the same number of districts—eight—as in every previous cycle since 1960 as its population growth kept pace with nationwide growth. Yet this stability occurred alongside substantial demographic change, as immigration transformed the racial characteristics of the state. The growth in Minnesota’s communities of color, including people from Mexico, Somalia, India, and Vietnam, was responsible for the state maintaining the same number of congressional districts, even as the state’s white population shrank. The Coalition Hub for Advancing Redistricting and Grassroots Engagement argued that the state’s changing demographics prompted a “wholesale reevaluation of districts that have remained largely the same for decades” (Andre et al. Reference Andre, Feng, Kylstra, Langworthy, Mitrovitch, Vicuña and Wang2023, 49).
Minimal-change maps do not uniformly harm minority representation, but where they intersect with racially polarized voting and rapid, substantial growth in the nonwhite population, the conditions for dilutive drift are particularly pronounced—as the cases of Alabama and Louisiana demonstrate.
Dilutive Drift in Alabama
In Allen v. Milligan, the Supreme Court found that Alabama’s congressional district map “remained remarkably similar” for 30 years despite state population growth driven by communities of color.Footnote 36 Alabama was forced to create one majority-Black district (out of seven) in 1992. Even this single majority-Black district (the Seventh) was thrust upon the state by court order after delay by legislators. The court signaled its reluctance to intervene, and its disapproval of Alabama’s stance, in that 1992 order:
It is out of deference to the Legislature that we have delayed our ruling until this time. In fact, we have afforded it every opportunity to fashion its own plan in order that it could fulfil its responsibility under the Constitution.Footnote 37
Over the next 30 years, the district boundaries remained largely unchanged even as the white population shrank, and the number of Black residents grew to almost 30% of the population. Average MAPS scores remained well below one, and in the 2020 cycle dropped to just 0.2. Civil rights organizations argued that Alabama’s map “further entrenches the state’s white majority by creating only a single majority-Black district in the state,” cracking Black voters by unlawfully splitting them between the majority-white First, Second, and Third Districts. The complaint in Milligan alleged that “the Legislature simply continued to reenact the same core district for CD [Congressional District] 7” over two successive redistricting cycles with the aim of bolstering and protecting white candidates and incumbents. The plaintiffs described the state’s stance as resistance to correcting dilutive drift. The Milligan plaintiffs alleged:
The Legislature made these decisions despite requests from Black legislators and voters in each redistricting cycle since 1990 to unpack CD 7 and draw two Black-majority districts.Footnote 38
In January 2022, a district court issued an injunction against the map but the Supreme Court froze the district court’s order, allowing the drifting map to remain in effect for the 2022 midterms. The following year, in an unusual victory for liberals, the Milligan court struck down the frozen Alabama maps and ordered the state to draw new maps that included at least two districts where Black voters could elect a candidate of their choice. Alabama refused to do so. In September 2023 the court ordered the state to comply with its decision. The following month, a three-judge panel selected a new plan that extended the Second District—a district held by a white Republican—to incorporate Alabama’s western Black Belt counties. The new map drew Black voters (communities that had previously been passively packed into the Seventh District and passively cracked across the Second, Third, and Sixth Districts) into an additional minority-opportunity district—the Second District—with a nonwhite population of 47% alongside the existing majority-minority Seventh District (figure 9). In November 2024, the Second District elected a Black Democrat, Shomari Figures, bringing Alabama’s congressional House delegation to two Black and five white representatives.
Dilutive Drift Is Remediated in Alabama
Note: Old map in place between November 4, 2021, and October 5, 2023. New map in place from October 5, 2023, to present.

Figure 9 Long description
The figure contains two panels.
Left panel: Old map (11.4.21–10.5.23).
District 5 is in the North. District 4 is in the Northwest. District 3 is in the East. District 6 is centrally located. District 7 is shaded dark gray and occupies the West-Central region. District 2 is in the Southeast. District 1 is in the Southwest.
Right panel: New map (10.5.23 – present).
Districts 5, 4, 3, and 6 remain in similar positions in the North and East. District 7, shaded dark gray, has been reshaped in the West-Central region. District 2 is now shaded light gray and has been significantly redrawn to stretch horizontally across the southern-central part of the state, reaching from the eastern border toward the west. District 1 is now restricted to the far South and Southwest corners.
The immediate aftermath of Milligan was a clear instance of deliberate failure to remedy dilutive drift; indeed, Alabama defied the court publicly and refused to create a second majority-minority district (Plagens, Sarda-Sorensen, and Vazquez Reference Plagens, Sarda-Sorensen and Vazquez2023). In defense of the minimal-change maps, Alabama’s congressional delegation had argued that the state was simply following the traditional “neutral” principle that the core of legislative districts should be retained.Footnote 39 But the majority in Milligan stated:
[T]his Court has never held that a State’s adherence to a previously used districting plan can defeat a [claim of vote dilution under Section 2 of the VRA]. If that were the rule, a State could immunize from challenge a new racially discriminatory redistricting plan simply by claiming that it resembled an old racially discriminatory plan.Footnote 40
Plaintiffs argued that the Alabama map was infused with discriminatory intent. After the remedial map was finally approved in October 2023, Alabama’s Black Democratic representative, Terri Sewell (Reference Sewell2023), celebrated the win but warned of the dangers of further resistance:
While we celebrate this historic victory, the continued resistance that we face from state officials should not be lost on anyone. This long and arduous battle over Alabama’s congressional map serves as a solemn reminder that efforts to deny fair representation to Black and minority voters are still alive and well.
The Alabama case shows that dilutive drift is not easily remedied. The state directly disobeyed the US Supreme Court, and the fight dragged on as state officials pursued multiple procedural avenues challenging the new map. Even after the state was ordered to comply with the Supreme Court, the state requested an emergency stay, and after the stay was rejected and the new map imposed, the state continued to the fight in court. On May 8, 2025, a district court issued an injunction preventing the state from returning to the state’s 2023 map, which contained just one majority-minority district.Footnote 41 The Supreme Court has not been a reliable ally to Black voters in cases of drift, as its decision to stay the 2022 injunction showed. Forceful action is required to address instances of passive packing and cracking (King Reference King2017).
Dilutive Drift in Louisiana
In Louisiana, the Republican legislature overrode Democratic governor John Bel Edwards’s veto to impose its minimal-change map (with an average MAPS score of just 0.3) in March 2022, retaining a single majority-minority district—the Second—although the state’s population is approximately one-third Black (figure 10). Plaintiffs filed multiple cases alleging dilutive drift, three of which were consolidated into a single challenge, Robinson v. Ardoin. Footnote 42 During the trial two expert witnesses stated that Louisiana’s “serpentine” 2020-cycle congressional Second District was “a ‘carbon copy’ of its previous 2011 iteration, which was found to be the seventh least-compact congressional district in the nation.”Footnote 43 Another expert witness testified that the legislature “followed a least-change approach and followed existing boundaries.” Between 2010 and 2020, Louisiana had lost 178,540 white residents but gained 11,627 Black and 129,989 Latino residents. Civil rights groups argued that the state’s six congressional districts should have been redrawn to increase the opportunities for minority voters to elect two Black members of Congress rather than just one. They pointed to the results of the 2020 Census, which showed that African Americans make up nearly a third of the state’s population and that northern Louisiana, with two white representatives in Congress, had lost population (Stabiler and Brown Reference Stabiler and Brown2021).
Dilutive Drift Is Temporarily Remediated in Louisiana
Note: Old map in place between March 31, 2022, and January 22, 2024. New map in place from January 22, 2024, to present, pending review.

Figure 10 Long description
The figure consists of two side-by-side maps of Louisiana showing six numbered congressional districts.
Left Panel: Old map (3.31.22–1.22.24).
* District 1 is in the Southeast.
* District 2 is a small, light-shaded area nested within the Southeast.
* District 3 is in the Southwest.
* District 4 is in the Northwest.
* District 5 covers the Northeast and Central regions.
* District 6 is a dark-shaded, jagged region concentrated in the South-Central area.
Right Panel: New map (1.22.24 – pending review).
* District 1 remains in the Southeast.
* District 2 is now a medium-shaded, elongated region stretching from the Southeast toward the center.
* District 3 remains in the Southwest but with altered northern borders.
* District 4 is in the North, now occupying the Northwest and North-Central areas.
* District 5 is shifted to the Northeast corner.
* District 6 is a dark-shaded, highly elongated diagonal district that stretches from the Northwest corner down through the center to the South-Central region.
Defendants in Robinson invoked a 1993 case, Hays v. State of Louisiana, that had invalidated a map with two majority-Black districts,Footnote 44 arguing that the Louisiana legislature kept Hays in mind when crafting the enacted map. The Obama-appointed district judge was unimpressed:
Hays, decided on census data and demographics 30 years ago, is not a magical incantation with the power to freeze Louisiana’s congressional maps in perpetuity. … [C]ore retention is nothing more than a guarantee that inequities in the map will be frozen in place despite changes in population.Footnote 45
As in Milligan, the district court in Robinson found that the Louisiana legislature was required to create a second majority-Black district, but the decision was put on hold while the Supreme Court considered Milligan, and delayed further by the Fifth Circuit, so the 2022 elections were held under the unconstitutional map that benefited Republicans in the midterms (Muller Reference Muller2023). Efforts to create a new map were delayed by overlapping court actions and appeals, with Republican lawmakers requesting additional time to redraw the districts. Finally, in January 2024 the governor signed into law a new map as instructed by the court. The new map had two minority-opportunity districts, the Second and Sixth Districts (figure 10).
But opponents of the remedial map filed new challenges. Plaintiffs in Callais v. Landry alleged that “the State engaged in textbook racial gerrymandering and violated the U.S. Constitution” in creating a new map with two majority-minority districts.Footnote 46 The 12 Callais plaintiffs—each identified in their complaint as a “non-African American voter”—argued that deliberately crafting “bizarrely shaped” districts involved racial gerrymandering in violation of the Equal Protection Clause of the Constitution.Footnote 47 On April 30, 2024, a three-judge panel found in favor of the plaintiffs and enjoined the map as an impermissible racial gerrymander, justifying its position in relation to traditional districting principles, such as respect for political subdivisions.Footnote 48 In November 2024 the US Supreme Court agreed to review the case, and oral arguments in March 2025 revealed that both Chief Justice Roberts and Justice Kavanaugh—pivotal votes in Milligan—were skeptical of the districts drawn to avoid dilutive drift.Footnote 49 Dueling visions of racial gerrymandering in this case have highlighted a central tension in remedial redistricting: the vulnerability of race-conscious maps to Equal Protection challenges. Efforts to address dilutive drift face constitutional scrutiny under racial gerrymandering doctrine.
Civil rights organizations litigating such cases encounter opposition from conservative legal groups that coordinate court challenges across states (Hertel-Fernandez Reference Hertel-Fernandez2019; MacLean Reference MacLean2017; Skocpol and Hertel-Fernandez Reference Skocpol and Hertel-Fernandez2016). Organizations such as the American Legislative Exchange Council and America First Legal file amicus briefs in defense of racially dilutive maps and coordinate legal efforts nationwide. They justify limiting map changes as a restrained application of traditional redistricting principles. In Robinson, Louisiana defended its failure to create a second Black-majority district on the grounds that the state had a “substantial interest in maintaining the continuity of representation in its districting plans,” urging the court to “abstain from tinkering.”Footnote 50
The decisions in Allen v. Milligan and Robinson v. Ardoin were rare interventions ordering the creation of new majority-Black districts, reaffirming the role of the VRA in protecting voting power. These cases demonstrate that courts can remedy instances of dilutive drift, but such interventions remain infrequent. The risk of drift persists as backlash grows against race-conscious redistricting, and as the Supreme Court continues to raise the bar for racial gerrymandering claims. In Alexander v. South Carolina State Conference of the NAACP, the court heightened evidentiary requirements, demanding more rigorous proof of discriminatory intent and effect—making it harder for plaintiffs to succeed, even in states with racial polarization and demographic change.Footnote 51
Courts have generally shown reluctance to redraw maps directly, and judicial practice often emphasizes deference to legislatures in redistricting. Their reliance on traditional redistricting principles, such as the preservation of existing local boundaries, reinforces minimal-change maps even when demographics shift. The courts’ institutional caution results in a tendency to preserve existing maps. Meanwhile, public focus remains on overt gerrymanders, while minimal-change maps have attracted comparatively less scrutiny, despite their important effects. As populations shift, preserving older boundaries can effectively dilute growing minority voting blocs.
Though Milligan and Robinson are encouraging precedents for those fighting for additional minority representation, they are insufficient to address the systemic risks of dilutive drift. The persistence of dilutive drift suggests that its effects may continue unless addressed through sustained legal and political action.
Conclusion
MAPS scores allow us to identify and compare low-change redistricting sequences across districts, states, and cycles. These measures provide quantitative support for the argument that certain racial and partisan gerrymanders have been frozen in place for multiple cycles (Yablon Reference Yablon2022), and that some districts and states remain persistently low-change for decades. MAPS scores document the growth of spatial change after the redistricting revolution of the 1960s, and pinpoint districts and states with the lowest levels of spatial change. Low-change districts and states are disproportionately, though not exclusively, Southern. They are typically drawn by legislators or courts rather than independent redistricting commissions. The distribution of MAPS scores indicates that minimal-change maps can protect incumbents and limit gains in representation for communities of color. Drawing from court cases in Alabama, Louisiana, and other states, I show how low-change maps can reduce the likelihood that racial-minority voters are able to elect their preferred candidates, through processes of passive packing and cracking.
Dilutive drift and racial gerrylaundering illustrate how institutional actors operate within the veto-prone US constitutional system in ways that can sustain historical inequalities and reduce political participation among marginalized groups (Highsmith, Sen, and Thelen Reference Highsmith, Sen and Thelen2025; Miller Reference Miller2023). Democratization in the US has always been hard won and prone to reversal (Bateman Reference Bateman2018; Hackett and King Reference Hackett and King2019; Johnson Reference Johnson2010; King Reference King2017; King et al. Reference King, Lieberman, Ritter and Whitehead2009; Mettler and Lieberman Reference Mettler and Lieberman2020). As democratic backsliding intensifies through voter suppression and gerrymandering (Grumbach Reference Grumbach2022), conservatives seek to preserve existing institutional advantages while progressives push for reform (Smith and King Reference Smith and King2024). Amid demographic transformation, minimal-change maps can maintain existing racial hierarchies of representation.
These dynamics have substantial implications for representation. Racial and partisan identities increasingly overlap, making dilutive drift a tool not just of racial exclusion but of partisan entrenchment. As the white population shrinks, limiting district changes can allow Republicans to maintain congressional majorities in the context of shifting demographics (Lieberman and Schlozman Reference Lieberman and Schlozman2024). The MAPS measures show that districts in states such as Alabama and Louisiana are particularly resistant to change, making them especially vulnerable to dilutive drift. Dilutive drift and racial gerrylaundering continue to occur in contemporary redistricting and have been sustained by certain judicial interpretations.
Minimal-change maps can be advantageous for mapmakers seeking to minimize legal risk or public scrutiny: alleged injuries are harder to prove, especially when justified under the traditional redistricting criteria that states have applied for centuries.Footnote 52 Defenders argue that retaining district courts fosters stability and constituent relationships, and mapmakers—mindful of litigation—may prefer low-visibility approaches after prior partisan gains. As one legislator put it, overreaching in redistricting risks judicial pushback (Mutnick Reference Mutnick2021).
Assessing mapmaker culpability for dilutive drift will require future legal and normative inquiry. Some circumstances—like pandemic-induced Census delays or divided government—make inaction less obviously intentional.Footnote 53 But in cases like Louisiana’s 2022 veto override or Alabama’s 2023 defiance of a Supreme Court order, these episodes were widely interpreted as deliberate refusals to implement remedial changes. The Milligan plaintiffs highlighted parallels with earlier opposition to federal mandates on racial issues (Plagens, Sarda-Sorensen, and Vazquez Reference Plagens, Sarda-Sorensen and Vazquez2023).
Judicial and legislative inaction can have the effect of reinforcing existing disparities in representation (King Reference King2017). In a 1963 case, Judge Rives observed that maintaining the status quo after prior discrimination risked perpetuating unequal conditions.Footnote 54 Redistricting cycles can either address past discrimination or maintain existing disparities.Footnote 55 While it might be helpful for a jurisdiction to have continuity, seniority, and experience in its congressional delegation stemming from incumbent protection efforts (Persily Reference Persily2002), these advantages must be set against the potential costs of retaining existing districts. Active gerrymanders draw attention, but minimal-change maps also have significant implications for political equality and representation.
Supplementary material
To view supplementary material for this article, please visit http://doi.org/10.1017/S1537592725103897.
Data replication
Data replication sets are available in Harvard Dataverse at: https://doi.org/10.7910/DVN/WKVLAP.
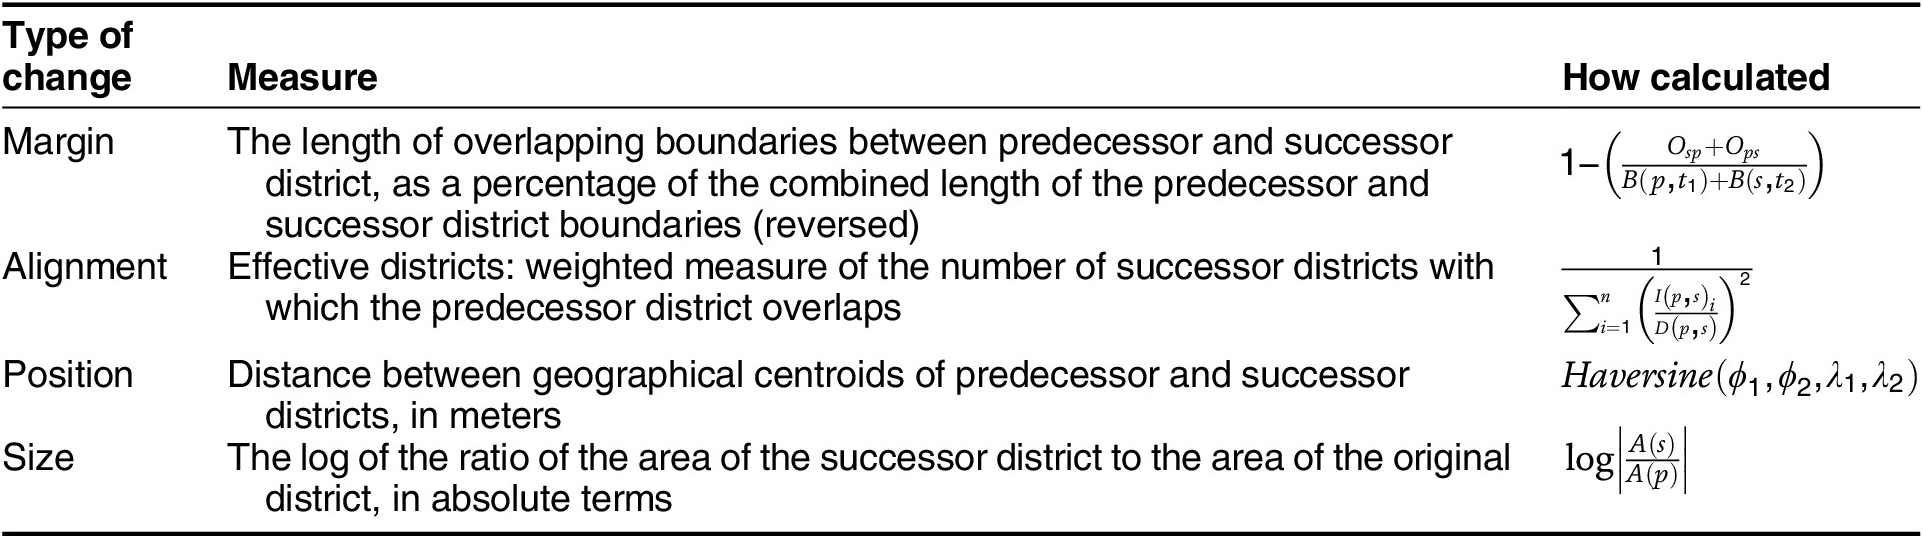
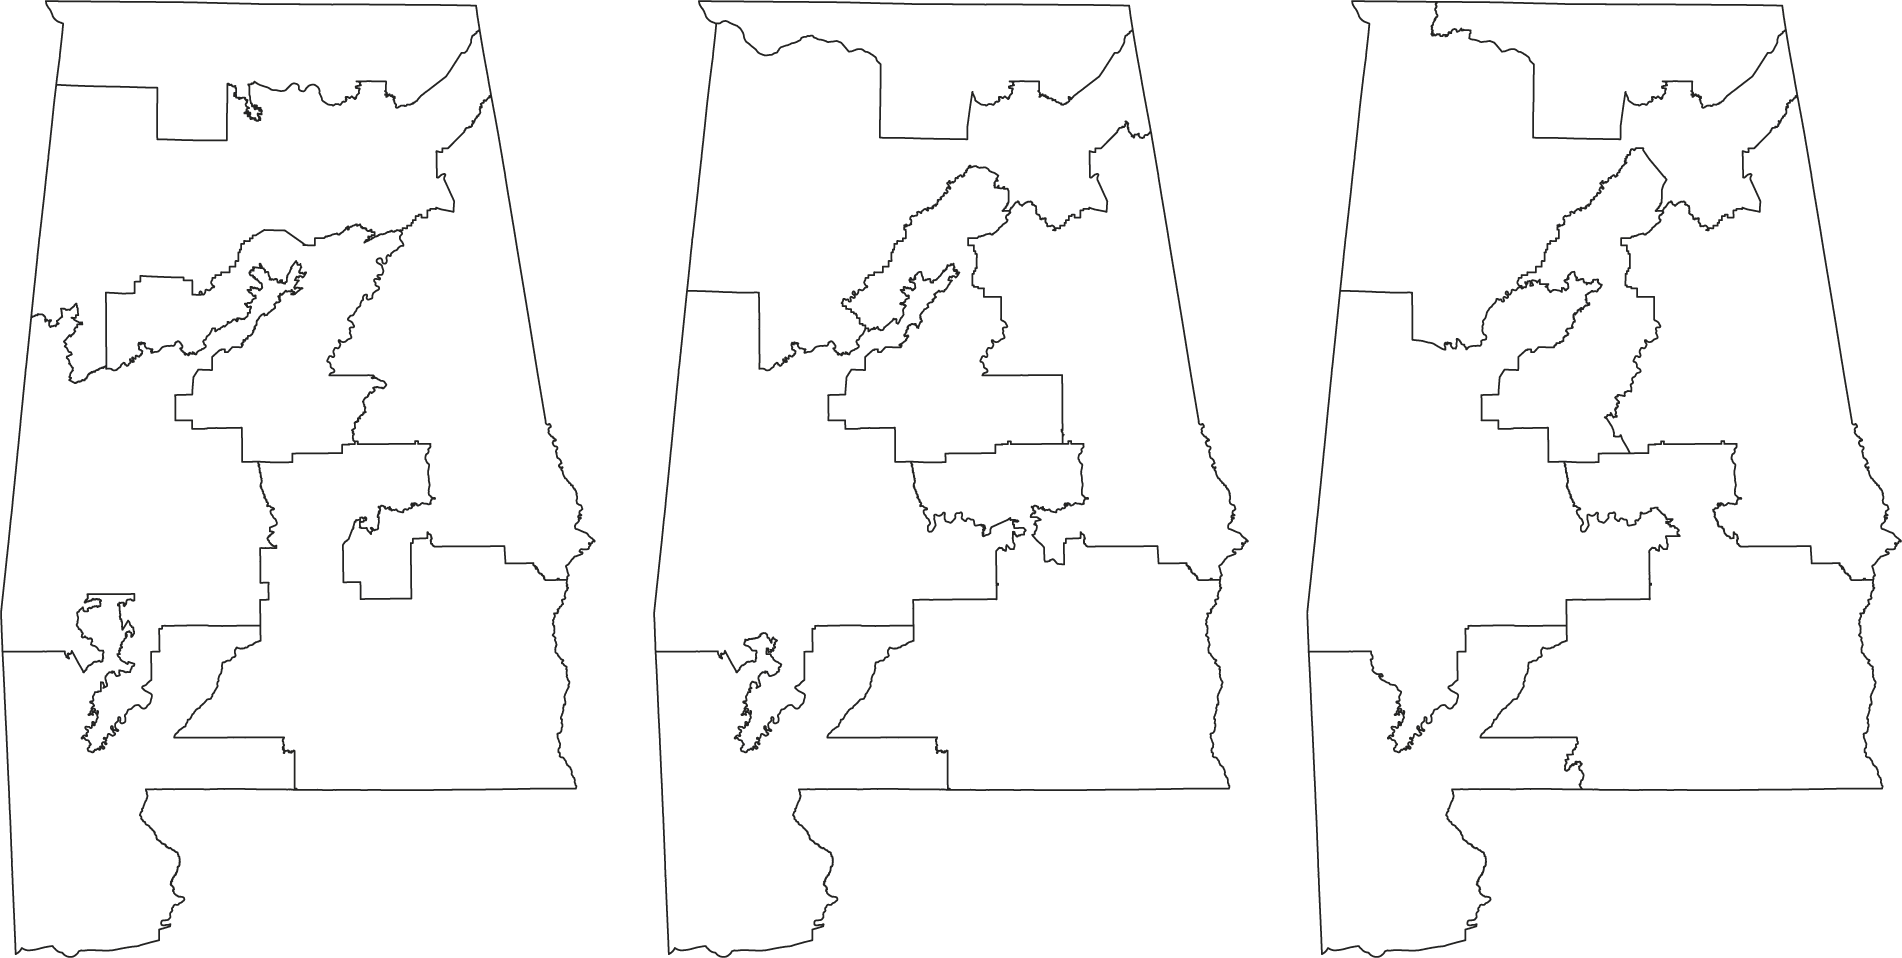
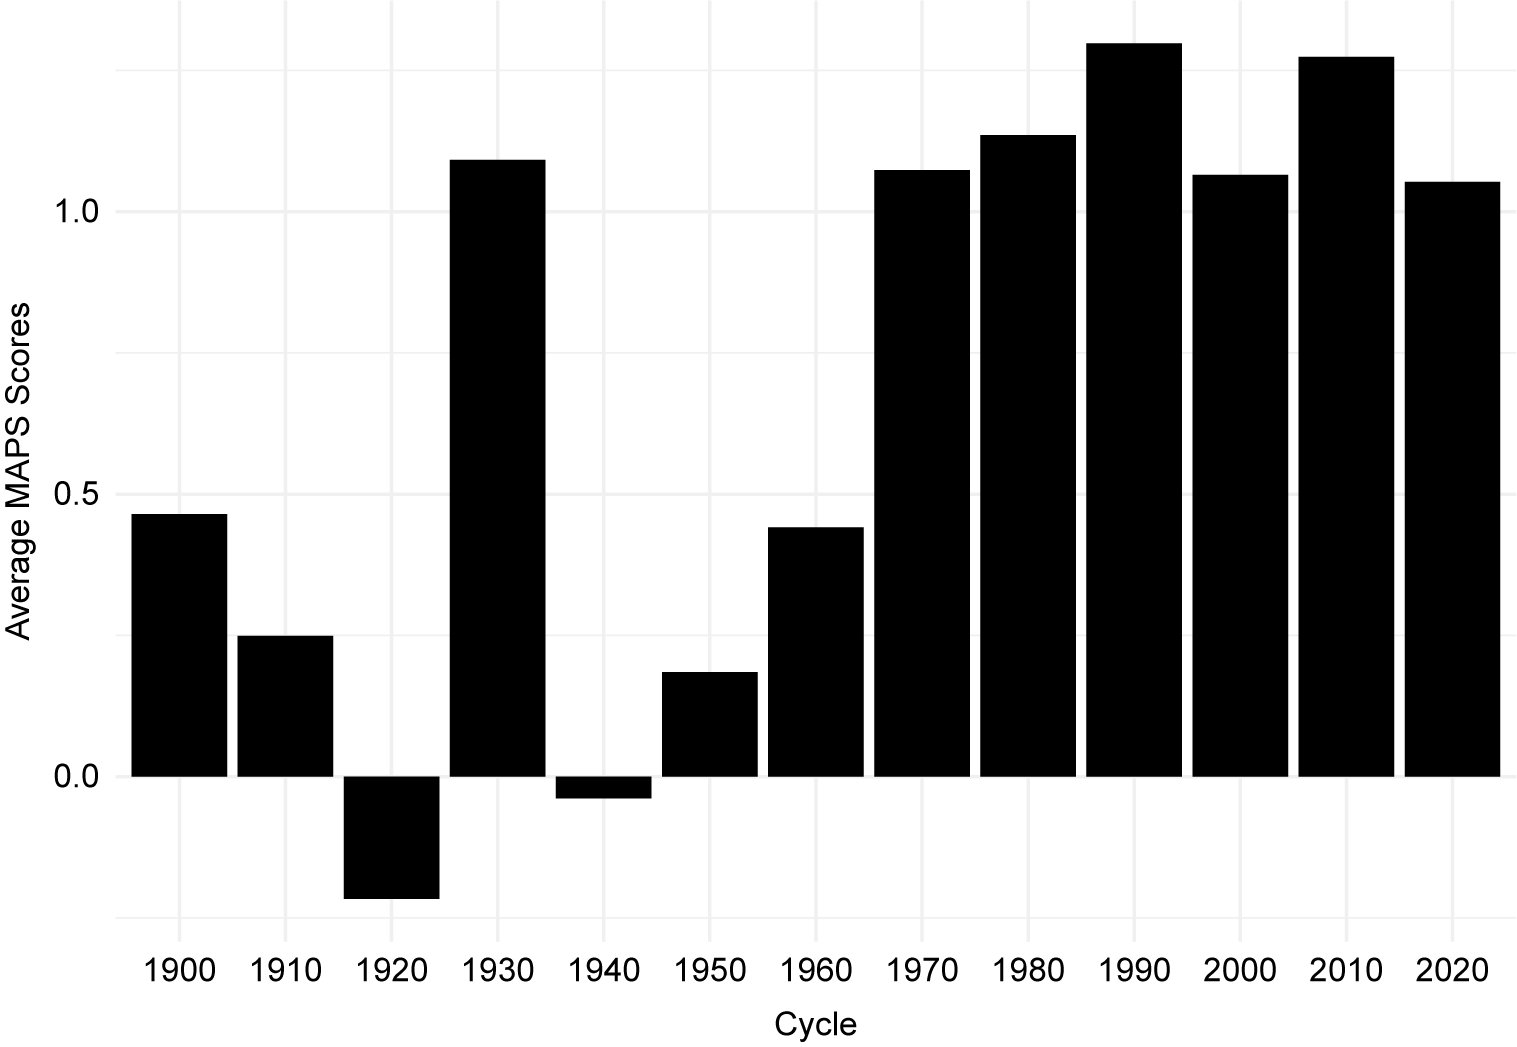

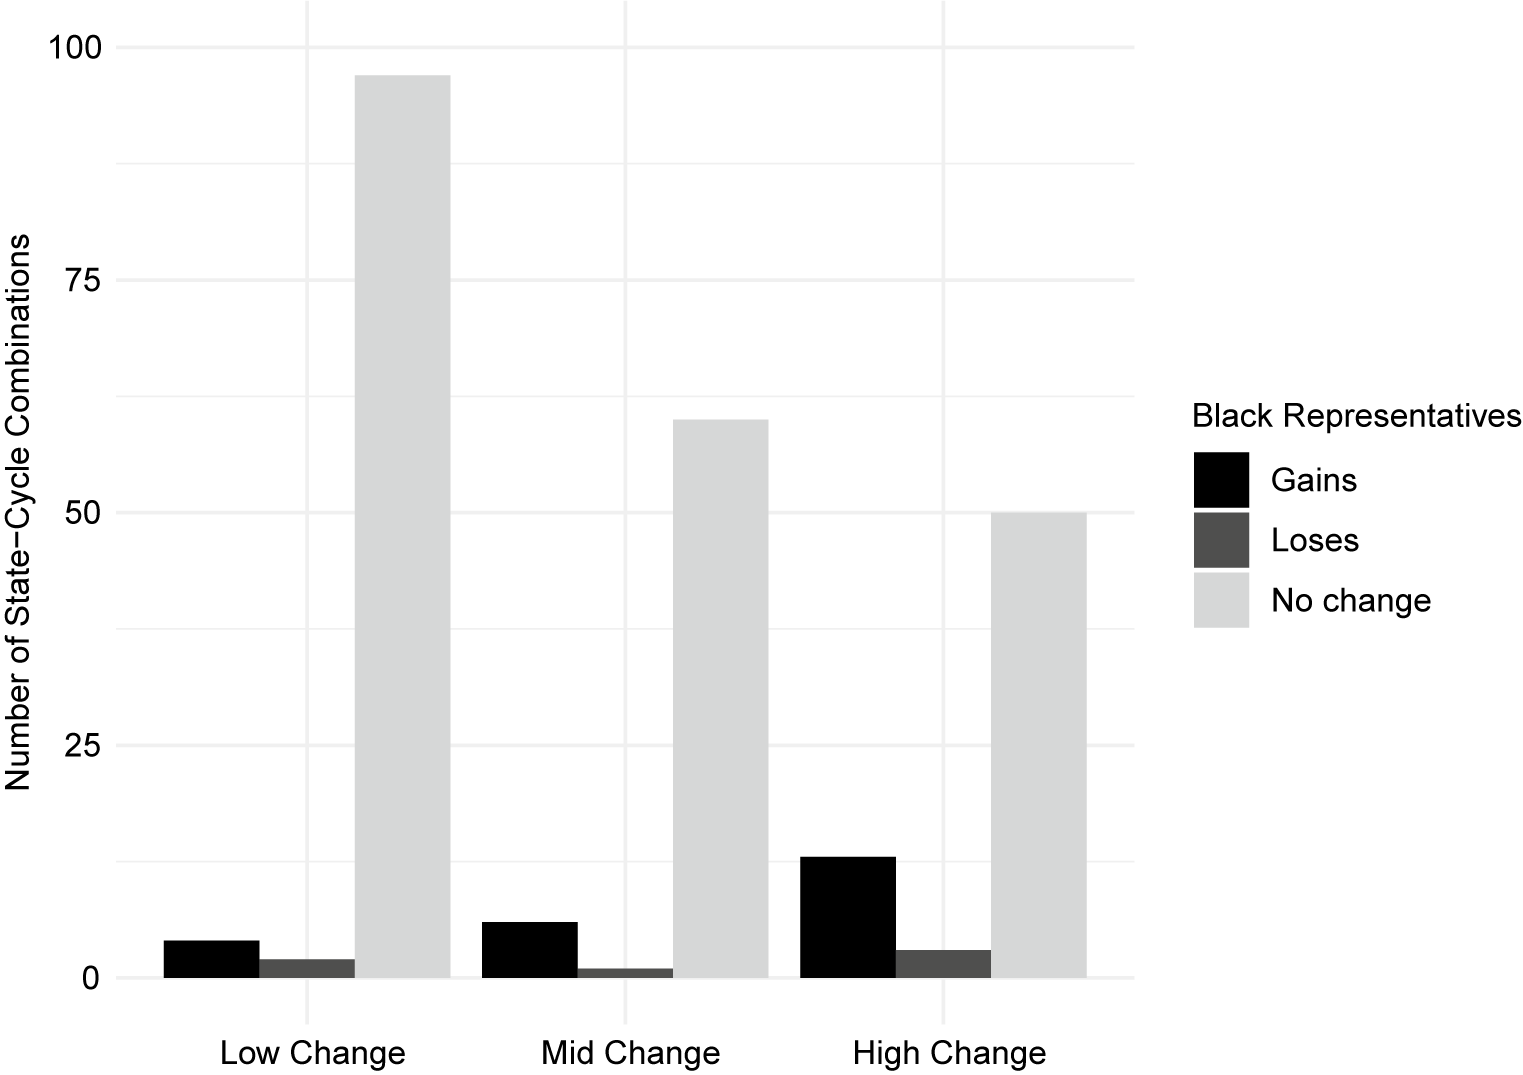
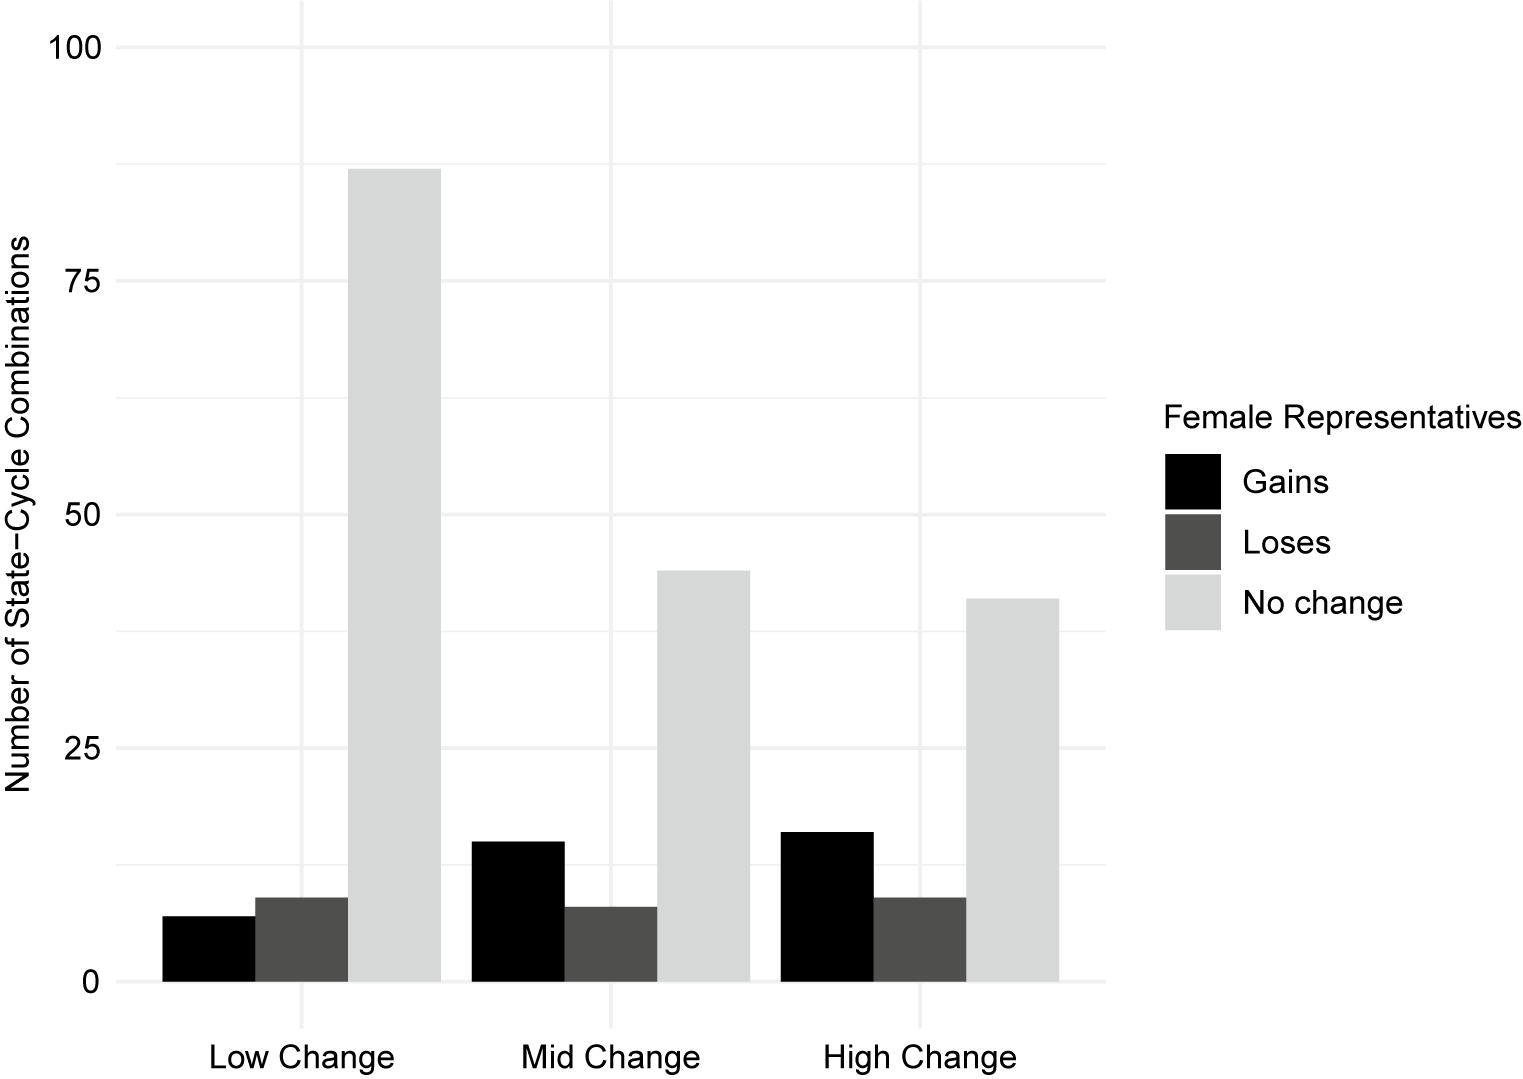
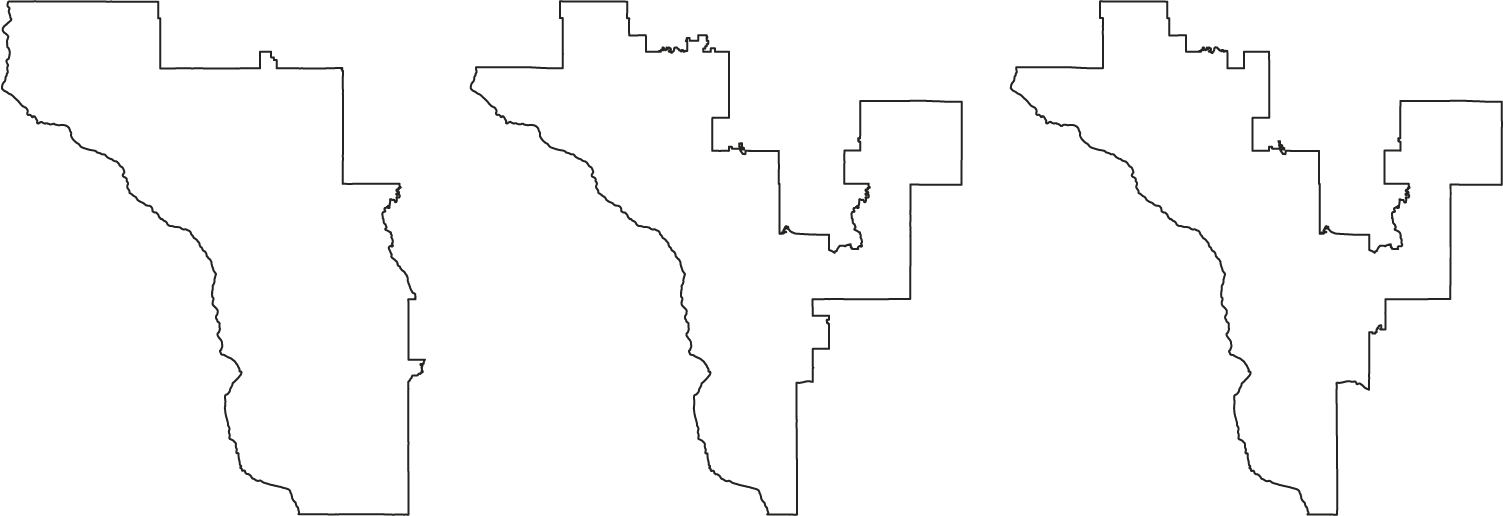
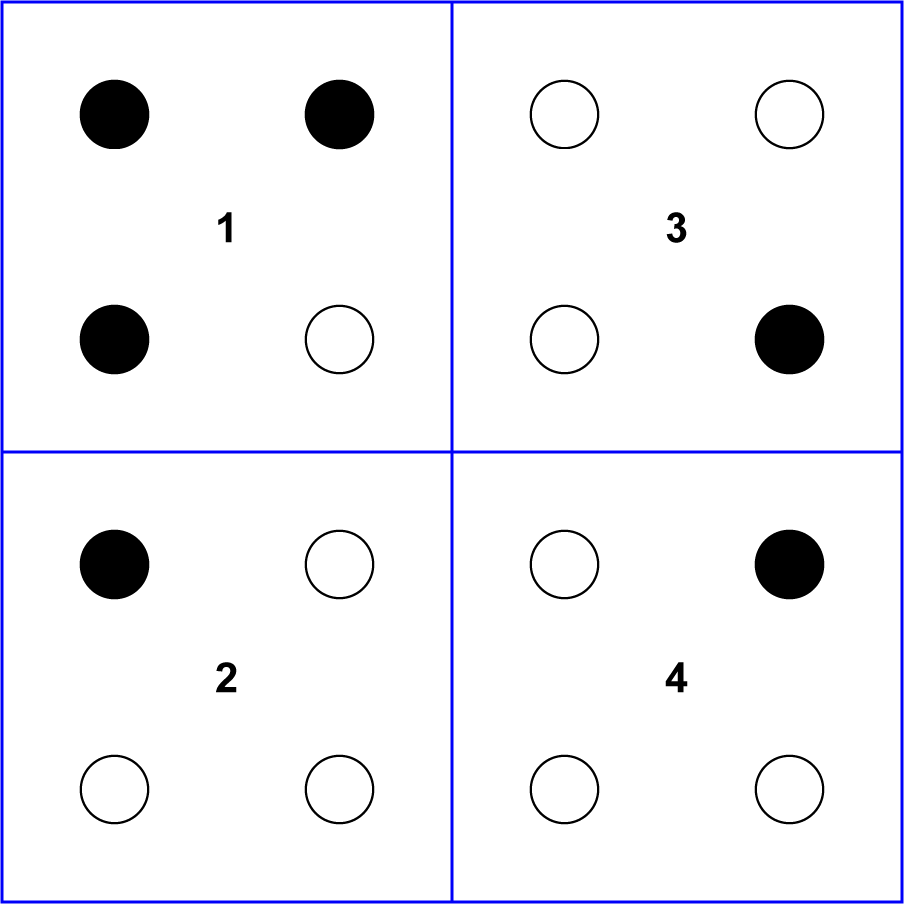
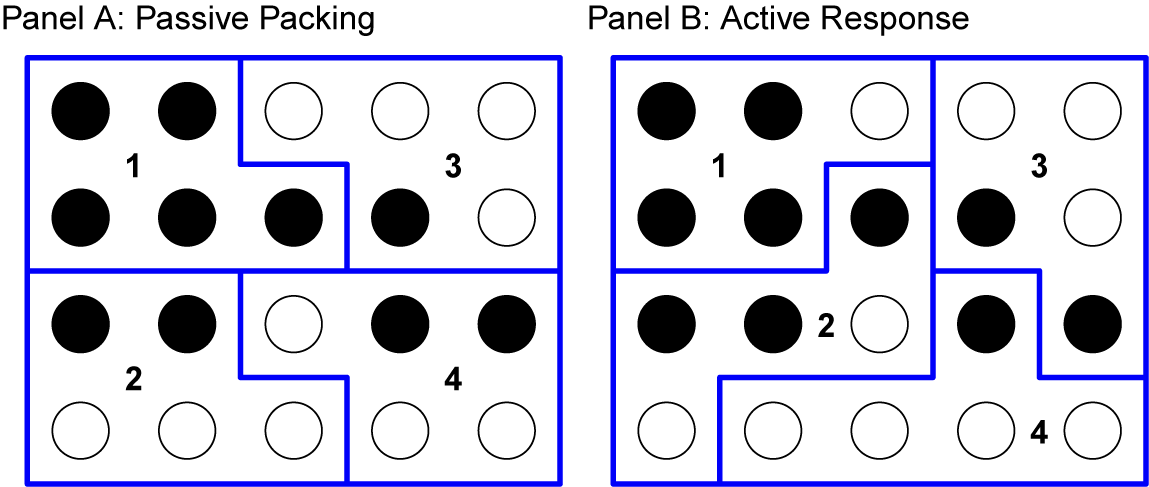
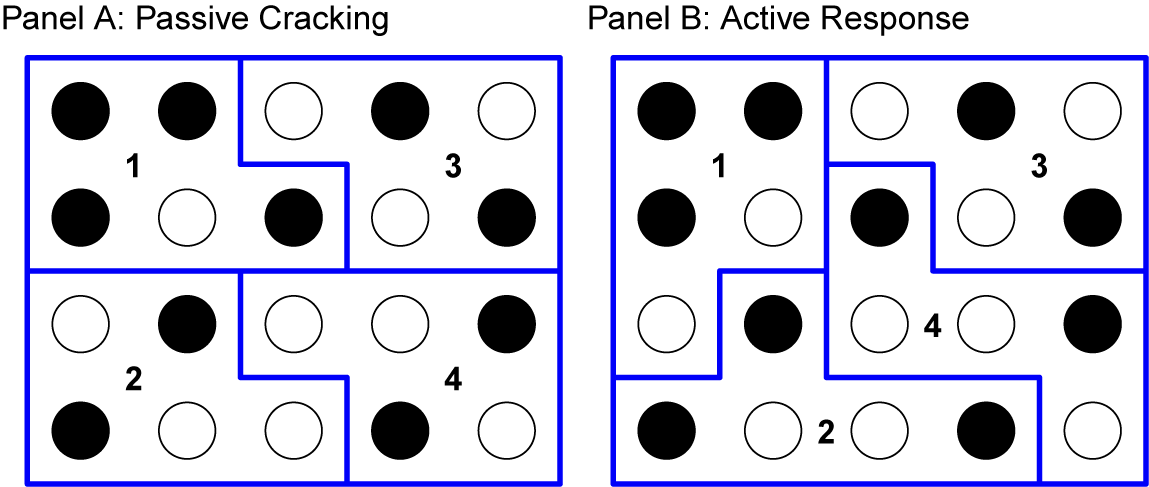
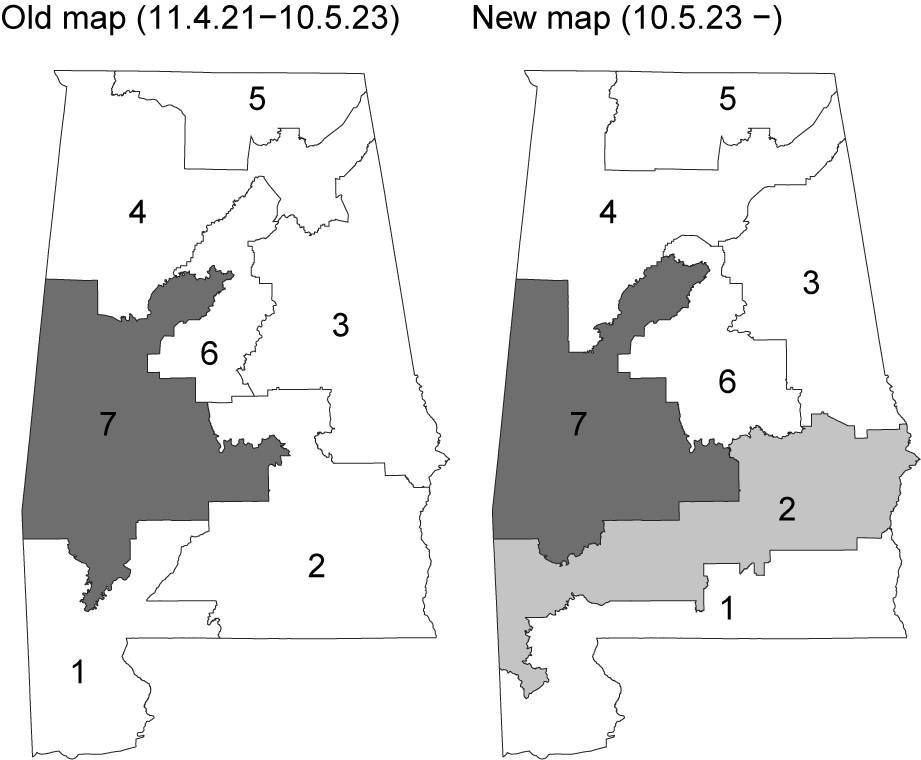
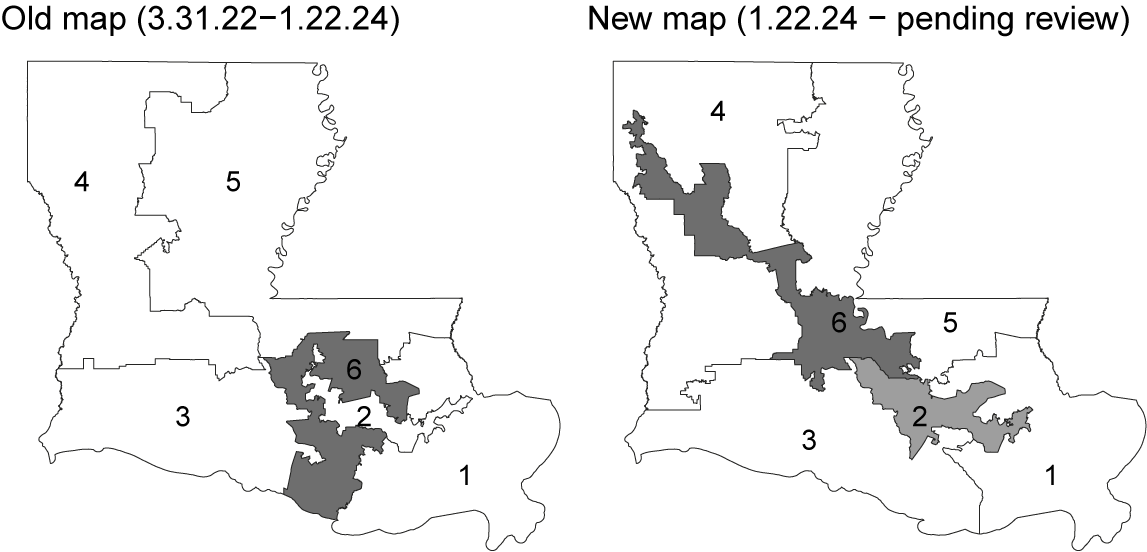


 Open access