


Introduction
Palmer amaranth (Amaranthus palmeri S. Watson) is a significant threat to agronomic and vegetable crop production, where yield losses have been reported to exceed 70% (Boyd et al. Reference Boyd, Moretti, Sosnoskie, Singh, Kanissery, Sharpe, Besançon, Culpepper, Nurse, Hatterman-Valenti, Mosqueda, Robinson, Cutulle and Sandhu2022; Ehleringer Reference Ehleringer1983; Klingaman and Oliver Reference Klingaman and Oliver1994; Sellers et al. Reference Sellers, Smeda, Johnson, Kendig and Ellersieck2003; Ward et al. Reference Ward, Webster and Steckel2013). Its consistent ranking as a common and troublesome weed species (Van Wychen Reference Van Wychen2022, Reference Van Wychen2023) can be attributed to its rapid growth rate, season-long emergence, prolific seed production, and morphological and phenological plasticity in response to environmental conditions (Ehleringer Reference Ehleringer1983; Keeley et al. Reference Keeley, Carter and Thullen1987; Spaunhorst et al. Reference Spaunhorst, Devkota, Johnson, Smeda, Meyer and Norsworthy2018). For example, Horak and Loughlin (Reference Horak and Loughlin2000) reported that A. palmeri produced 32% to 83% more dry biomass than common waterhemp [Amaranthus tuberculatus (Moq.) Sauer], redroot pigweed (Amaranthus retroflexus L.), and tumble pigweed (Amaranthus albus L.), likely providing A. palmeri with a competitive advantage relative to other problematic Amaranthus species. Additionally, the authors suggested that the fast growth rate of A. palmeri may narrow the time frame available to achieve effective postemergence control, allowing for escapes and seed return to the seedbank. Under optimal growth conditions and limited competitive interactions, female A. palmeri can produce hundreds of thousands of seeds per plant, allowing for rapid population growth (Burke et al. Reference Burke, Schroeder and Thomas2007; Jha et al. Reference Jha, Norsworthy, Riley, Bridges and Komp2008; Keeley et al. Reference Keeley, Carter and Thullen1987; Massinga et al. Reference Massinga, Currie, Horak and Boyer2001; Sellers et al. Reference Sellers, Smeda, Johnson, Kendig and Ellersieck2003). Seeds of A. palmeri are small and easily dispersed via the movement of agricultural equipment used for mowing, tillage, and harvesting operations (Norsworthy et al. Reference Norsworthy, Griffith, Scott, Smith and Oliver2008). Wildlife, water movement, and the use of manure contaminated by ingested seeds have also been implicated in the spread of the species (Farmer et al. Reference Farmer, Webb, Pierce and Bradley2017; Norsworthy et al. Reference Norsworthy, Griffith, Griffin, Bagavathiannan and Gbur2014; Yu et al. Reference Yu, Blair, Hardel, Chandler, Thiede, Cortilet, Gunsolus and Becker2021).
First described in 1877, A. palmeri is native to the southwestern United States and northern Mexico (Watson Reference Watson1877). Historically, the species was confined to the Sonoran Desert ecoregion, where evidence suggests precolonial human use as a potherb or grain (Sharpe et al. Reference Sharpe, Martin, Page and Geddes2024). During the 1800s, agricultural expansion facilitated the gradual spread of A. palmeri from its limited southwestern range, with herbarium records documenting its presence in the central United States by the late 19th century; its distribution accelerated with the rise of mechanized agriculture in the early 1900s, extending northward, southward, and eastward to reach New York by 1936 (Sauer Reference Sauer1957) and southern Canada by 1963 (Sauer Reference Sauer1972). Amaranthus palmeri populations have been reported not only in North America, but across Europe, Asia, Africa, South America, and the Caribbean (Sharpe et al. Reference Sharpe, Martin, Page and Geddes2024). The species’ adaptability has enabled successful colonization of diverse habitats, with climate models predicting continued poleward range expansion (Kistner and Hatfield Reference Kistner and Hatfield2018).
Populations of A. palmeri have evolved resistance to at least nine Herbicide Resistance Action Committee (HRAC) mode of action (MOA) groups, including acetolactate synthase (ALS; HRAC Group 2), microtubule assembly (HRAC Group 3), photosystem II (PSII; HRAC Group 5), 5-enolpyruvylshikimate-3-phosphate synthase (EPSPS; HRAC Group 9), glutamine synthetase (HRAC Group 10), protoporphyrinogen oxidase (HRAC Group 14), very-long-chain fatty-acid synthesis (HRAC Group 15), and hydroxyphenylpyruvate dioxygenase (HPPD; HRAC Group 27) inhibitors, as well as synthetic auxin (HRAC Group 4) herbicides (Heap Reference Heap2025). In New York, Butler-Jones et al. (Reference Butler-Jones, Maloney, McClements, Reale-Munroe, Mahoney, Jha and Nurse2024) confirmed glyphosate-resistant populations; their preliminary screening also indicated reduced sensitivity to atrazine (a PSII inhibitor) and possibly mesotrione (an HPPD inhibitor). Rieley et al. (Reference Rieley, Kumar, Aulakh, Stanyard, Jangra, Singh and Price2025) reported the first atrazine-resistant A. palmeri population in New York, identified in 2024 from an Ontario County soybean [Glycine max (L.) Merr.] field, with a GR90 of 20,770 g ai ha⁻1 (14.4-fold resistance factor). Select populations of A. palmeri from New Jersey were also confirmed resistant to glyphosate, an EPSPS inhibitor, in 2014 (Heap Reference Heap2025). In 2024, screening of 18 A. palmeri populations from Delaware revealed that all populations were resistant to glyphosate and ALS-inhibiting herbicides, with the exception of one population that remained sensitive to imazamox. Some populations also showed reduced sensitivity to mesotrione (M VanGessel, personal communication).
Given its competitiveness, confirmed resistance to multiple herbicide MOAs, and expected range expansion under climate change, A. palmeri poses a major threat to cropping systems in the northeastern United States. Characterizing potential resistance is essential for determining whether the utility of key herbicide chemistries is being threatened. Building on these concerns and on the findings of Butler-Jones et al. (Reference Butler-Jones, Maloney, McClements, Reale-Munroe, Mahoney, Jha and Nurse2024), who documented reduced sensitivity to atrazine and mesotrione in two of the three NY populations investigated, the present study aimed to characterize the responses of these populations, along with a NJ population selected for regional comparison, to atrazine and mesotrione and to elucidate the underlying resistance mechanism.
Materials and Methods
Plant Material
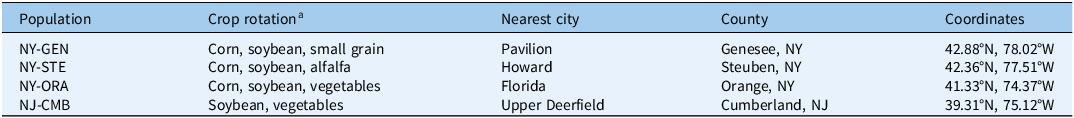
Seeds of A. palmeri were collected from populations located in Steuben (NY-STE), Orange (NY-ORA), and Genesee (NY-GEN) counties in New York (Butler-Jones et al. Reference Butler-Jones, Maloney, McClements, Reale-Munroe, Mahoney, Jha and Nurse2024), as well as Cumberland County in New Jersey (NJ-CMB) between 2019 and 2022. The crop rotation history and geographic origin of A. palmeri populations evaluated in the present study are summarized in Table 1. The genetic uniformity of these populations was not determined, as assessing it was beyond the objectives of the present study. In addition to the NY and NJ populations, a known Nebraska (NE-S) glyphosate- and atrazine-susceptible A. palmeri population, collected from Keith County in 2017, was used in all experiments as the reference. Seeds from this population were provided by R Werle at University of Wisconsin–Madison, WI. Seed samples from New York and New Jersey were collected in fall from a minimum of 20 female plants per site. After threshing and cleaning, all seed samples were stored at 4 C until use, and germination tests conducted before the experiments showed ≥80% germination for all populations evaluated in this study. Experiments quantifying resistance to atrazine and mesotrione applied postemergence and investigating underlying resistance mechanisms were conducted from 2023 to 2025.
Table 1. Crop rotation history and geographic origin of Palmer amaranth (Amaranthus palmeri) populations from New York and New Jersey evaluated in herbicide response studies.

a Taxonomy: corn (Zea mays L.); soybean [Glycine max (L.) Merr.]; alfalfa (Medicago sativa L.).
Whole-Plant Atrazine and Mesotrione Dose–Response Bioassays
Dose–response studies were conducted at the Rutgers Philip E. Marucci Research Center in Chatsworth, NJ, to evaluate atrazine and mesotrione resistance in the selected A. palmeri populations. A completely randomized design (CRD) was used, with nine replications for each combination of population, herbicide, and application rate. The atrazine and mesotrione studies were conducted independently, and each was repeated once in time (referred to as runs). Seeds were planted in 200-cell germination trays filled with a potting medium composed of 63% sphagnum peat moss (Lambert LM-111, Lambert Peat Moss, Rivière-Ouelle, QC, Canada), 35% of graded horticultural coarse perlite (Whittemore Perlite, Whittemore Company, Andover, MA, USA), and 2% polymer-coated fertilizer (Florikan Nano 14-4-14 Mini Prill, Profile Products, Buffalo Grove, IL, USA). Seedlings at the 2-leaf stage were transferred to individual 10 cm round plastic pots containing the same potting mix as previously described. Seedlings were grown in a glasshouse maintained at 23 C under a 16:8-h (light:dark) photoperiod. Natural lighting was supplemented with 60-W LED light fixtures (Feit Electric, Pico Rivera, CA, USA) placed equidistantly 50 cm above the bench to deliver 103 µmol m⁻2 s⁻1 photosynthetically active radiation (PAR). Pots were sprinkler-irrigated daily in early morning and late afternoon for 15 mins. Following transplanting at the 2-leaf stage, plants were allowed to recover from transplant shock for 7 to 10 d before herbicide application. Herbicide treatments were applied postemergence over the top of seedlings at the 3- to 4-leaf stage (approximately 7 to 11 cm in height). Applications were made with a CO2 backpack sprayer calibrated to deliver 140 L ha−1 at 160 kPa and fit with two extended range (XR) 11002 flat spray nozzles (TeeJet® Technologies, Glendale Heights, IL, USA) spaced 46 cm apart. For the atrazine dose–response study, A. palmeri seedlings were treated with atrazine as AAtrex® 4L (Syngenta Crop Protection, Greensboro, NC, USA) at rates of 0 (nontreated control, NTC), 35, 70, 140, 280, 560, 1,120, 2,240, 4,480, and 9,860 g ai ha⁻1. The 1,120 g ai ha⁻1 atrazine rate (1X) corresponds to the label-recommended rate for postemergence broadleaf weed control. For the mesotrione dose–response study, A. palmeri seedlings were treated with Callisto® 4SC (Syngenta Crop Protection) at rates of 0 (NTC), 3.25, 6.5, 13, 26, 52.5, 105, 210, 420, and 630 g ai ha⁻1. The recommended application rate of mesotrione in field corn (Zea mays L.) is 105 g ai ha⁻1. All atrazine and mesotrione treatments also included Maximizer® crop oil concentrate (COC; Loveland Product, Greeley, CO, USA) at 1% v/v. Following herbicide application, pots were allowed to dry in the greenhouse for 24 h before irrigation resumed.
Target Site (psbA Gene) Sequencing
Target-site sequencing was conducted at the Rutgers Philip E. Marucci Research Center. Leaves were collected from two representative plants from each population noted earlier. Leaf tissue for target-site sequencing was collected from plants grown independently of the dose–response assay. Genomic DNA was extracted from approximately 50 mg of tissue from each sample using a modified CTAB procedure (Daverdin et al. Reference Daverdin, Johnson-Cicalese, Zalapa, Vorsa and Polashock2017). DNA was quantified using a DeNovix DS-11FX spectrophotometer (DeNovix, Wilmington, DE, USA). All DNA samples were diluted to 25 ng µl−1. PCR reactions contained 5 µl of Taq 5X Master Mix (cat. no. M0285L, New England Biolabs, Ipswich, MA, USA), 0.2 µM of each PsbA primer, and 50 ng of plant DNA and nuclease-free water to a final reaction volume of 25 µl. The primers used (PsbA-F CTCCTGTTGCAGCTGCTACT and PsbA-R TAGAGGGAAGTTGTGAGC) amplify the partial psbA chloroplast gene (Mengistu et al. Reference Mengistu, Christoffers and Lym2005). The amplicon is expected to be about 578 bp and contains all of the mutations known to confer atrazine resistance (Vennapusa et al. Reference Vennapusa, Faleco, Vieira, Samuelson, Kruger, Werle and Jugulam2018). Reactions were run in an Axygen MaxyGene II Thermal Cycler (Corning Life Sciences, Tewksbury, MA, USA). Initial denaturation was set for 95 C for 30 s, followed by 30 cycles of 95 C for 15 s, annealing at 53 C for 15 s, extension at 68 C for 30 s, and a final extension at 68 C for 5 min. PCR amplification reactions were cleaned using ExoSap-IT according to the manufacturer’s protocol (ThermoFisher Scientific, Waltham, MA, USA). The cleaned samples were direct Sanger sequenced using the BigDye Terminator v. 3.1 Cycle Sequencing Kit (ThermoFisher Scientific) according to the manufacturer’s protocol. Sequencing reactions were run on an Applied Biosystems 3500 Genetic Analyzer (ThermoFisher Scientific). Nucleotide sequences were manually trimmed to remove poor-quality reads on the ends and aligned using the MegAlign Pro module of the Lasergene software package (DNASTAR, Madison, WI, USA).
Non–target site Mechanisms of Atrazine Resistance
Studies were conducted at the Pennsylvania State University in State College, PA, to investigate whether enhanced atrazine metabolism contributed to resistance in A. palmeri. Seeds from the NY-STE, NY-Gen, NY-ORA, NJ-CMB, and NE-S populations were germinated in petri dishes containing two sheets of filter paper (Whatman No. 1) moistened with water. Petri dishes were wrapped with a single layer of Parafilm® (Bemis Company, Neenah, WI, USA) to reduce evaporation and incubated in a growth chamber under a 14:10-h (day:night) photoperiod at 24 C and 600 µmol m⁻2 s⁻1 PAR. Seven-day-old seedlings were then transplanted into individual cones filled with sand and sub-irrigated with full-strength Hoagland solution for the duration of the experiment in a CRD with four replications. At the 2-leaf stage, plants were treated with five 1-µl droplets of a solution containing atrazine as AAtrex® 4L at 2,242 g ai ha−1 with 1% COC, simulating a typical field application. The droplets were allowed to dry for approximately 2 h before plants were returned to the growth chamber. Plants were then sampled 48 h after treatment (HAT), and the study was repeated once in time. Sampling consisted of removing plants from sand, then washing the roots with tap water and drying them with paper towels. Entire plants were ground in liquid nitrogen using a mortar and pestle to break up cells and expose any absorbed atrazine. Ground tissue was transferred to 50-ml centrifuge tubes, and 2 ml of acetonitrile:formic acid (99.9:0.1 v/v) was added to each tube. Samples were sonicated for 1 h, and centrifuged at 4,700 × g for 20 min. The supernatant was filtered with 0.45-µm filters before atrazine quantification.
Atrazine quantification was performed in an (Agilent, Santa Clara, CA) 1260 Infinity II HPLC coupled with an Agilent 6460C triple quadrupole mass spectrometer. A 1-µl aliquot was injected into the system. Separation was performed on an Agilent Poroshell 120 CS C18 column (2.1 by 150 mm, 2.7 µm) with gradient elution consisting of mobile phase A as 0.1% formic acid in water and mobile phase B as 0.1% formic acid in acetonitrile with the following program: 10% B for 3 min, 10% to 95% B over 2 min, 95% B for 2 min, 95% to 10% B over 30 s, and 10% B for 3 min. The atrazine detection protocol was developed de novo with the Mass Hunter application and performed in multiple reaction mode (216.1 → 174 precursor and product ion, fragmentor 130 V, collision-activated voltage 4 V, collision energy 15 V, in positive mode). Gas flow was set to 11.5 L min−1, nebulizer at 30 psi, sheath gas flow at 10 L min−1, gas temperature at 200 C, sheath gas temperature at 290 C, capillary voltage at 3,000 V, and nozzle voltage at 1,500 V. Atrazine metabolism was quantified by measuring residual parent compound 48 h after herbicide treatment. A calibration curve was constructed with atrazine technical standard (Sigma-Aldrich, St Louis, MO, USA) and provided 101% accuracy within the 195 to 12,500 ng ml−1 range.
Response of Amaranthus palmeri to Atrazine and Mesotrione Combinations
Greenhouse studies were conducted in 2022 and 2023 at Cornell AgriTech in Geneva, NY, to evaluate the effects of atrazine and mesotrione, applied alone or in combination, on A. palmeri control. Only the NY and NE-S populations were included in this study, as the NJ-CMB population had not yet been collected when the experiment was conducted. The study was arranged as a CRD with 10 replications per treatment and was repeated once in time. Five to 10 A. palmeri seeds were sown in 7.6-cm-diameter pots filled with Lambert LM-111 growing medium (Lambert, Rivière-Ouelle, QC, Canada). Seedlings were hand thinned to one plant per pot after emergence. Soil moisture was maintained throughout the duration of the study via daily irrigation. Greenhouses were maintained at a constant temperature of 25 C with a 16-h photoperiod. Natural lighting was supplemented with high-pressure sodium lamps (iPower, Rancho Cucamonga, CA, USA) placed equidistantly 3 m above the bench to deliver 640 μmol m−2 s−1 PAR.
Seedlings at the 2- to 4-leaf stage (approximately 7 to 11 cm in height) were treated with solo applications of atrazine as AAtrex® 4L at 701 and 1,121 g ha−1, and mesotrione as Callisto® at 105 g ha−1. The 701 g ha−1 rate was derived from the Environmental Protection Agency’s framework to limit total annual atrazine loadings. Mesotrione was also applied as a tank mix with both rates of atrazine, and an NTC was also included. Applications were made using a single-nozzle cabinet sprayer (DeVries, Hollandale, MN, USA) equipped with a TeeJet® 8002 even flat spray nozzle (TeeJet® Technologies). The sprayer was calibrated to deliver 187 L ha⁻1 at 276 kPa. All spray solutions included COC at 1% v/v. Following herbicide application, pots were allowed to dry in the greenhouse for 24 h before irrigation resumed.
Data Collection and Statistical Analysis
For the dose–response and atrazine plus mesotrione combination studies, aboveground A. palmeri biomass for each treated and NTC plant was harvested at 21 d after treatment (DAT), dried at 60 C for 7 d, and then weighed. Dry biomass data were converted to percent biomass relative to the NTC using Equation 1: ${\rm{Relative}}\;{\rm{Dry}}\;{\rm{Biomass}}\;\left( {{\rm{RDB}}} \right) = {{{\rm{D}}{{\rm{B}}_{{\rm{EU}}}}} \over {{\rm{D}}{{\rm{B}}_{{\rm{NTC}}}}}}*100$
with DBEU representing the dry biomass of the experimental unit and DBNTC corresponding to the mean dry biomass of the NTC for each population. The number of surviving plants was also recorded at 21 DAT, along with a visual estimate of A. palmeri control using a scale from 0% (no visible injury) to 100% (complete plant death).
In the absence of significant experimental run by herbicide treatment interactions, data were combined over runs for both atrazine and mesotrione dose–response studies. For relative biomass data (RBD), multiple dose–response models (two-parameter log-logistic with fixed upper limit, three-parameter log-logistic, and Weibull) were fit to each A. palmeri population (Knezevic et al. Reference Knezevic, Streibig and Ritz2007; Ritz et al. Reference Ritz, Baty, Streibig and Gerhard2015) using the drm function in the drc package (Ritz et al. Reference Ritz, Streibig and Ritz2016) in RStudio 2025.09.1 software (R Core Team 2025). Models were compared using Akaike’s information criterion, and the three-parameter log-logistic function (Equation 2) provided the best fit: $y = d\;/\left\{ {1 + \;{\rm{ex}}{{\rm{p}}^{\left[ {b\left( {\log \left( x \right) - \log \left( e \right)} \right)} \right]}}} \right\}\;{\rm{\;}}$
where y is relative biomass (%), d is the upper asymptote, b is the slope at the inflection point, e is the herbicide dose causing 50% growth reduction (ED50), and x is the herbicide rate.
For lethality data (binary: 0 = alive, 1 = dead), a two-parameter log-normal model (Equation 3) was fit using probit regression with binomial distribution via the drm function in the drc package (Ritz et al. Reference Ritz, Streibig and Ritz2016): ${{\rm{\Phi }}^{ - 1}}\left( p \right) = {b^{\left[ {\log \left( x \right) - {\rm{log}}\left( e \right)} \right]}}\;{\rm{\;}}$
where p is the probability of mortality, Φ⁻1 is the inverse cumulative normal distribution (probit transformation), b is the slope parameter, e is the herbicide dose causing 50% mortality (ED50), and x is the herbicide rate. This model implicitly constrains the upper asymptote to 100% mortality, as recommended by Kniss and Streibig (Reference Kniss and Streibig2019).
All analyses were conducted in RStudio 2025.09.1 software (R Core Team 2025). Effective doses causing 50% (ED50) and 90% (ED90) mortality were estimated using the delta method, and values were compared between populations using pairwise t-tests. Resistance ratios (R/S50 and R/S90) were calculated by dividing the ED50 and ED90 values of suspected resistant populations by the corresponding values of the susceptible NE-S population.
Statistical analysis of the atrazine plus mesotrione combination study was conducted using the generalized linear mixed model (GLIMMIX) procedure in SAS software (v. 9.4, SAS Institute, Cary, NC, USA). Population, herbicide treatment, and the interactions between the two factors were considered fixed effects, whereas runs and replication nested within runs were designated as random factors in the model. Relative biomass data were arcsine square-root transformed to better meet the assumptions for ANOVA and back-transformed for presentation purposes (Grafen and Hails Reference Grafen and Hails2002). Mean comparisons for the fixed effects were performed using Tukey’s honest significance test (HSD) test when F-values were statistically significant (P ≤ 0.05).
For the non–target site mechanisms of atrazine resistance, raw atrazine concentration data were analyzed with R (v. 4.5.1; R Core Team, 2025). Data were inspected for homogeneity of variance using Levene’s test and then pooled across experimental runs. ANOVA assumptions (normality of residuals and homogeneity of variances) were tested, and no violations were detected. Mean separation among populations was conducted using estimated marginal means (EMMs) obtained with the emmeans package (Lenth Reference Lenth2025). Pairwise comparisons were adjusted using Tukey’s HSD method to control the family-wise error rate across multiple tests. The significance level was set at α = 0.05. Compact letter displays (CLDs) representing groups that were not significantly different (P > 0.05 after Tukey or false discovery rate adjustment) were generated using the multcomp and multcompView packages (Graves et al. Reference Graves, Piepho, Selzer and Dorai-Raj2019; Hothorn Reference Hothorn2002). Results are reported as mean ± SE based on EMMs.
Results and Discussion
Whole-Plant Atrazine and Mesotrione Dose–Response Bioassays
No significant treatment by experimental run interactions were detected (P > 0.05), allowing data for each herbicide to be pooled across runs. Biomass-based ED50 values ranged from 65 to 278 g ha⁻1 across the NY and NJ populations, indicating up to 4-fold resistance relative to the NE-S reference (ED50 = 69 g ha⁻1) (Table 2; Figure 1). However, ED90 estimates revealed marked differences among populations. The NY-GEN and NY-STE populations required substantially higher doses of atrazine to achieve 90% biomass reduction (10,067 and 7,486 g ha⁻1, respectively) compared with the NE-S population (ED90 = 241 g ha⁻1), corresponding to 41.8- and 31.1-fold resistance. In contrast, the NY-ORA and NJ-CMB populations exhibited ED90-based resistance of ≤2.1-fold, showing a similar response to the susceptible check, even at higher atrazine doses. Plant lethality data provided better discrimination among populations than biomass measurements (Table 3; Figure 2). Lethality-based ED50 values for NY-ORA and NJ-CMB (407 and 396 g ha⁻1, respectively) were comparable to the NE-S reference (505 g ha⁻1), confirming their susceptibility. Conversely, NY-GEN and NY-STE demonstrated 42.3- and 14.3-fold greater resistance than NE-S, with lethality ED50 values of 21,355 and 7,200 g ha⁻1, respectively. These lethality-based resistance ratios corroborated the high-level resistance observed in biomass ED90 estimates, establishing NY-GEN as the most resistant population, followed by NY-STE. Injury assessments at 21 DAT further confirmed poor atrazine efficacy on NY-GEN and NY-STE, with ≤40% and ≤58% control, respectively, at recommended field rates (1,120 to 2,240 g ha⁻1). Conversely, NY-ORA, NJ-CMB, and NE-S were controlled >90% at field use rates (data not shown).
Table 2. ED50 and ED90 values (± SE) and resistance factors (R/S) for the relative dry biomass response of Amaranthus palmeri populations from New York (n = 3), New Jersey (n = 1), and Nebraska (n = 1) at 21 d after treatment with atrazine and mesotrione in whole-plant dose–response studies.

a Abbreviations: NY-GEN, NY-ORA, NY-STE, A. palmeri populations from Genesee County, Orange County, and Steuben County, NY, respectively; NE-S, A. palmeri population from Keith County, NE; NJ-CMB, A. palmeri population from Cumberland County, NJ.
b ED50 and ED90 are the required dose of herbicide to reduce A. palmeri relative dry biomass 50% and 90%, respectively.
c The R/S resistance level was calculated by dividing each population’s ED50 or ED90 by the corresponding value of the NE-S population.

Figure 1. Relative shoot dry biomass response of four Amaranthus palmeri populations to atrazine treatment at 21 d after treatment. Populations from New York (NY-ORA, NY-GEN, NY-STE), New Jersey (NJ-CMB), and Nebraska (NE-S, susceptible). Vertical bars indicate standard error (±) of the predicted mean.
Table 3. ED50 values (± SE), and resistance factors (R/S) for the lethality response of Amaranthus palmeri populations from New York (n = 3), New Jersey (n = 1), and Nebraska (n = 1) at 21 d after treatment with atrazine and mesotrione in whole-plant dose response studies.

a Abbreviations: NY-GEN, NY-ORA, NY-STE, A. palmeri populations from Genesee County, Orange County, and Steuben County, NY, respectively; NE-S, A. palmeri population from Keith County, NE; NJ-CMB, A. palmeri population from Cumberland County, NJ.
b ED50 is the required dose of herbicide to reduce A. palmeri relative dry biomass 50%.
c The R/S resistance level was calculated by dividing each population’s ED50 by the corresponding value of the NE-S population.

Figure 2. Lethality response of Amaranthus palmeri populations to atrazine at 21 d after treatment. Populations from New York (NY-ORA, NY-GEN, NY-STE), New Jersey (NJ-CMB), and Nebraska (NE-S, susceptible). Vertical bars indicate standard error (±) of the predicted mean.
The resistance levels observed in NY-GEN and NY-STE are comparable to those of previously reported atrazine-resistant A. palmeri populations. Jhala et al. (Reference Jhala, Sandell, Rana, Kruger and Knezevic2014) documented a NE population with ED90 values of 11,136 and 15,686 g ai ha⁻1 for biomass and control, respectively (9- to 14-fold resistance). Kohrt et al. (Reference Kohrt, Sprague, Swathi Nadakuduti and Douches2017) reported that 35,900 g ai ha⁻1 (9.3-fold) was required for 90% biomass reduction in a Michigan population. Kumar et al. (Reference Kumar, Liu, Boyer and Stahlman2019) identified a Kansas (KS) population resistant to multiple herbicides, including atrazine, with an ED50 value based on biomass reduction of 720 g ai ha⁻1, corresponding to a 14.4-fold R/S ratio. Nakka et al. (Reference Nakka, Godar, Thompson, Peterson and Jugulam2017) reported the highest resistance ratio documented in A. palmeri (1,500-fold), with a KS population exhibiting an ED50 of 11,384 g ai ha⁻1. Notably, the wide range of R/S ratios reported across these studies (9- to 1,500-fold) reflects differences in both the level of evolved resistance and the baseline susceptibility of the reference populations, underscoring the importance of comparing absolute ED values alongside fold differences when evaluating resistance across populations and studies.
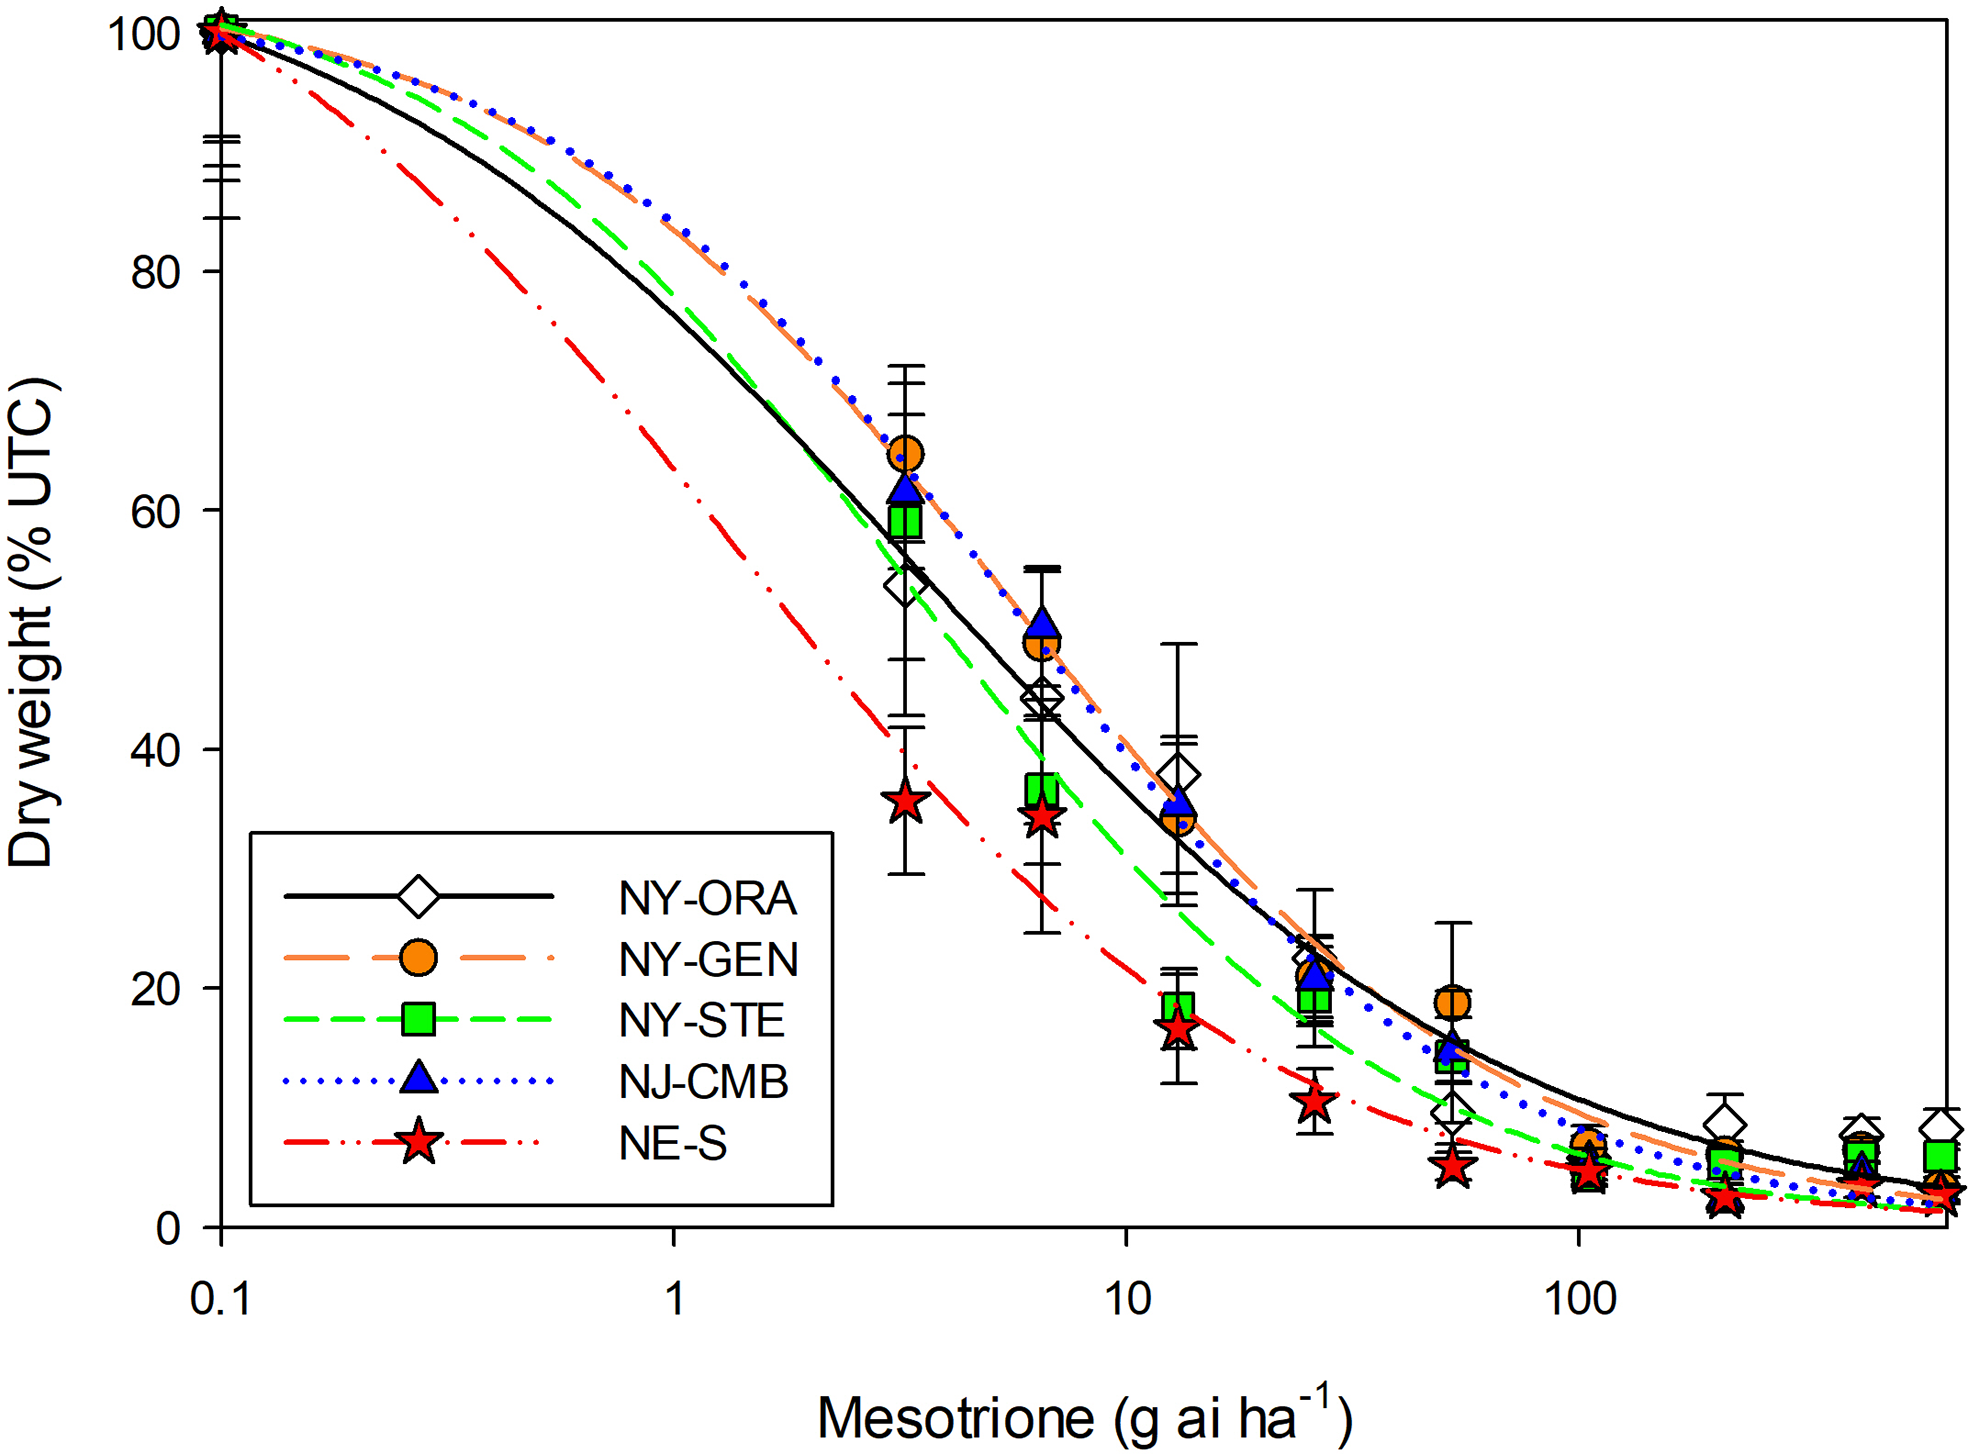
Biomass-based dose–response curves indicated similar levels of mesotrione sensitivity among the four NY and NJ populations, with R/S50 and R/S90 resistance levels ≤3.3- and 3.8-fold, respectively, relative to the NE-S reference (Table 2; Figure 3). Lethality-based assessments corroborated these findings, with ED50 values ranging from 46 to 67 g ha⁻1 for NY and NJ populations compared with 34 g ha⁻1 for the NE-S reference (Table 3; Figure 4). At the recommended field rate of 105 g ha⁻1, mesotrione provided 94% to 100% control across all populations (data not shown). Mesotrione resistance has been documented in several A. palmeri populations across the United States, with resistance levels substantially higher than those observed in the present study. An NE biotype exhibited 4-fold resistance based on ED90 values for visual control (1,007 g ai ha⁻1), whereas a KS population showed 13.4-fold resistance based on ED50 values for biomass reduction (188 g ai ha⁻1) (Jhala et al. Reference Jhala, Sandell, Rana, Kruger and Knezevic2014; Kumar et al. Reference Kumar, Liu, Boyer and Stahlman2019). In Iowa, multiple resistance to glyphosate, mesotrione, imazethapyr, and atrazine was confirmed, with biomass R/S50 values 8.5 (2,281 g ai ha⁻1)-, 9.5 (157 g ai ha⁻1)-, 40 (258 g ai ha⁻1)-, and 70 (12,224 g ai ha⁻1)-fold higher, respectively, than a sensitive biotype (Hamberg et al. Reference Hamberg, Yadav, Hartzler and Owen2024). These resistance levels exceed the maximum biomass- (3.3-fold) and lethality-based (2-fold) R/S values observed in the NY and NJ populations, confirming that the northeastern populations evaluated in this study remain susceptible to mesotrione.

Figure 3. Relative shoot dry biomass response of four Amaranthus palmeri populations to mesotrione treatment at 21 d after treatment. Populations from New York (NY-ORA, NY-GEN, NY-STE), New Jersey (NJ-CMB), and Nebraska (NE-S, susceptible). Vertical bars indicate standard error (±) of the predicted mean.

Figure 4. Lethality response of Amaranthus palmeri populations to mesotrione at 21 d after treatment. Populations from New York (NY-ORA, NY-GEN, NY-STE), New Jersey (NJ-CMB), and Nebraska (NE-S, susceptible). Vertical bars indicate standard error (±) of the predicted mean.
Target Site (psbA Gene) Sequencing
The partial psbA gene nucleotide sequences averaged 540 bases after manual trimming. All sequences were identical across samples (data not shown). An NCBI BLAST search revealed that these partial psbA sequences also shared 100% identity (over the 540 bases available) with several A. palmeri PSII protein D1 (psbA) partial coding sequences in GenBank (e.g., MW361341.1). The deduced amino acid sequences also matched those reported for A. tuberculatus in Vennapusa et al. (Reference Vennapusa, Faleco, Vieira, Samuelson, Kruger, Werle and Jugulam2018). Atrazine binds to the QB-binding site of the D1 protein in PSII, inhibiting electron transport and leading to oxidative stress and cellular damage. Mesotrione inhibits HPPD, blocking carotenoid biosynthesis and causing bleaching of new growth. Target-site atrazine resistance is conferred by amino acid substitutions in the D1 protein due to psbA gene mutations (Vennapusa et al. Reference Vennapusa, Faleco, Vieira, Samuelson, Kruger, Werle and Jugulam2018). Reported substitutions include Ser-264-Gly (Foes et al. Reference Foes, Liu, Tranel, Wax and Stoller1998), Phe-255-Ile, Asn-266-Thr, and Phe-274-Val, with amino acid numbering relative to the Arabidopsis [Arabidopsis thaliana (L.) Heynh.] D1 protein (Vennapusa et al. Reference Vennapusa, Faleco, Vieira, Samuelson, Kruger, Werle and Jugulam2018). None of the samples contained mutations shown to be associated with atrazine resistance (Figure 5), including known nucleotide or amino acid substitutions linked to psbA-mediated resistance. These results suggest that atrazine resistance in these populations is likely due to non–target site resistance (NTSR) mechanism(s).

Figure 5. Deduced amino acid sequence of psbA through the region reported to have mutations associated with atrazine resistance (F255I, S264G, N266T, F274V). The potentially substituted amino acids are numbered, relative to Arabidopsis thaliana psbA translation, and marked in red.
Non–Target Site Mechanisms of Atrazine Resistance
We observed that populations NY-STE and NY-GEN had the lowest amounts of atrazine remaining at 48 HAT, suggesting that these populations could have evolved NTSR mechanisms that enhance herbicide metabolism. Compared with NE-S, NY-STE had 21% less intact atrazine, while NY-GEN had 20% less (Figure 6). Populations NY-ORA and NJ-CMB had statistically similar amounts of remaining atrazine compared with NE-S. The moderate biomass-based R/S50 ratios (2- to 4-fold) observed for NY-GEN and NY-STE, despite high-lethality ED50 values, support NTSR (Kohrt et al. Reference Kohrt, Sprague, Swathi Nadakuduti and Douches2017; Ma et al. Reference Ma, Kaundun, Tranel, Riggins, McGinness, Hager, Hawkes, McIndoe and Riechers2013; Nakka et al. Reference Nakka, Godar, Thompson, Peterson and Jugulam2017; Vennapusa et al. Reference Vennapusa, Faleco, Vieira, Samuelson, Kruger, Werle and Jugulam2018). Given we observed an approximately 4-fold change in atrazine response based on the ED50, the reduction in atrazine metabolism (20% to 21%) might not fully explain the observed whole-plant level response. This gap might be explained by the fact that we assessed metabolism at a single time point (48 HAT), which prevents us from fully modeling the metabolism rate. It is also possible that a novel NTSR mechanism contributes to enhanced atrazine metabolism, such as enhanced atrazine extrusion to the apoplast (Pan et al. Reference Pan, Yu, Wang, Han, Mao, Nyporko, Maguza, Fan, Bai and Powles2021), or enhanced compartmentalization (Ge et al. Reference Ge, d’Avignon, Ackerman and Sammons2010), as is observed for glyphosate in other species. The mechanisms of NTSR to atrazine in A. palmeri have not been extensively investigated. Nakka et al. (Reference Nakka, Godar, Thompson, Peterson and Jugulam2017) did not observe amino acid substitutions in the psbA in an atrazine-resistant KS population but found that this population can degrade atrazine 24 times faster than a susceptible counterpart, and the authors hypothesized this is likely catalyzed by glutathione Stransferase and controlled by a major allele. Chahal et al. (Reference Chahal, Jugulam and Jhala2019) observed that >4-fold more atrazine remained intact in a NE A. palmeri resistant population compared with a known susceptible. Although the genes involved in atrazine metabolism in A. palmeri remain unknown, more advances have been made for the closely related species A. tuberculatus. Ma et al. (Reference Ma, Kaundun, Tranel, Riggins, McGinness, Hager, Hawkes, McIndoe and Riechers2013) reported that two A. tuberculatus populations from Illinois metabolized atrazine five times faster than the susceptible population. After further molecular studies, Evans et al. (Reference Evans, O’Brien, Ma, Hager, Riggins, Lambert and Riechers2017) identified a strong candidate glutathione S-transferase, AtuGSTF2, that could be associated with atrazine resistance. Future studies will focus on the genes involved in atrazine resistance in our A. palmeri populations.

Figure 6. Concentration of atrazine remaining at 48 h after herbicide treatment in Amaranthus palmeri populations from New York (NY-ORA, Orange County; NY-GEN, Genesee County; NY-STE, Steuben County), New Jersey (NJ-CMB), and Nebraska (NE-S). Error bars represent standard errors around the means. Different letters indicate statistically significant differences among populations (Tukey’s HSD P < 0.05).
Response of Amaranthus palmeri to Atrazine and Mesotrione Combinations
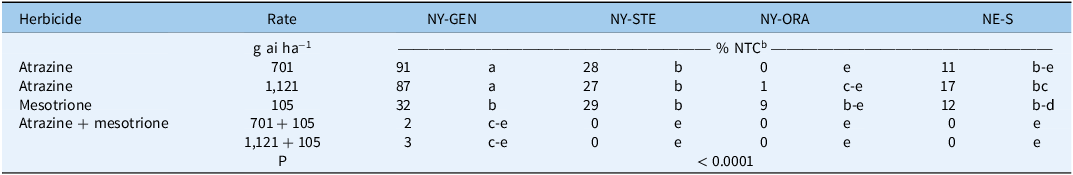
No significant treatment by experimental run interactions were detected (P > 0.05), allowing data to be pooled across runs. The NY-GEN, NY-STE, NY-ORA, and NE-S populations of A. palmeri differed significantly (P ≤ 0.05) in response to postemergence-applied atrazine, mesotrione, and atrazine plus mesotrione mixtures (Table 4). At 21 DAT, NY-GEN was largely unaffected by atrazine applied alone, with biomass remaining at 91% and 87% of the NTC at 701 and 1,121 g ha⁻1, respectively. In contrast, biomass of the NY-STE population was reduced to 28% and 27% of the NTC at the 701 and 1,121 g ha⁻1 rates, respectively. The NE-S population showed corresponding reductions of 11% and 17%. Biomass of the NY-ORA population at 21 DAT was ≤1% of the NTC at both atrazine rates. When mesotrione was applied alone, A. palmeri biomass was 32%, 29%, 9%, and 12% of the NTC for the NY-GEN, NY-STE, NY-ORA, and NE-S populations, respectively. The combination of atrazine plus mesotrione provided near-complete control of all populations, reducing biomass to ≤3% of the NTC, regardless of atrazine rate. Abendroth et al. (Reference Abendroth, Martin and Roeth2006) demonstrated enhanced control in both field and greenhouse settings when atrazine or other PSII inhibitors were combined with mesotrione, compared with mesotrione alone. Kohrt et al. (Reference Kohrt, Sprague, Swathi Nadakuduti and Douches2017) reported synergistic activity from atrazine tank mixed with four different HPPD-inhibiting herbicides, highlighting atrazine’s continued effectiveness against atrazine-resistant A. palmeri when paired with WSSA Group 27 herbicides. Chahal and Jhala (Reference Chahal and Jhala2018) and Jhala et al. (Reference Jhala, Sandell, Rana, Kruger and Knezevic2014) found that tank mixes of mesotrione and atrazine improved control of NE A. palmeri populations, including one resistant to both herbicides when applied individually. Resistance management remains critical and requires an integrated approach, including the use of diverse sites of action, preemergence followed by postemergence applications, rotation of crops and herbicide-resistant traits, tillage, and harvest weed seed control to limit the evolution and spread of multiple herbicide–resistant A. palmeri (Chahal and Jhala Reference Chahal and Jhala2018).
Table 4. Amaranthus palmeri dry biomass at 21 d after treatment in response to atrazine and mesotrione applied postemergence alone and in combinationa.

a Abbreviations: NY-GEN, NY-ORA, NY-STE, A. palmeri populations from Genesee County, Orange County, and Steuben County, NY, respectively; NE-S, A. palmeri population from Keith County, NE; NTC, nontreated control.
b Mean biomass across runs in the nontreated checks was 0.228, 0.286, 0.240, and 0.332 g for the NY-GEN, NY-ORA, NY-STE, and NE-S populations, respectively. Means followed by the same letter are not significantly different based on Tukey’s honest significance test (HSD; α = 0.05)
These efforts document A. palmeri resistant to postemergence applications of atrazine in New York, with two populations (NY-GEN and NY-STE) exhibiting 31- to 42-fold resistance based on ED90 estimates, and suggest that the resistance is caused by an NTSR mechanism. The absence of psbA mutations combined with enhanced atrazine metabolism in resistant populations indicates an NTSR mechanism has evolved. The confirmation of postemergence atrazine resistance in New York has significant implications for regional corn production systems, where atrazine remains a foundational herbicide for broadleaf weed management in both field corn and sweet corn (Wallace et al. Reference Wallace, Lingenfelter, VanGessel, Vollmer, Besançon, Sosnoskie, Flessner and Chandran2024; Wyenandt et al. Reference Wyenandt, van Vuuren, Owens, Hamilton, Hastings and VanGessel2024). The establishment of herbicide-resistant A. palmeri in the northeastern United States threatens crop production, because this aggressive, highly competitive weed is difficult to control and can significantly reduce yields. Given the prolific seed production of A. palmeri (up to 500,000 seeds per female plant), its rapid growth rate (exceeding 5 cm d−1), and extended emergence window, effective management of these resistant populations is critical to prevent further spread to adjacent cropping areas (Norsworthy et al. Reference Norsworthy, Griffith, Griffin, Bagavathiannan and Gbur2014; Ward et al. Reference Ward, Webster and Steckel2013). Species distribution models predict continued northward range expansion of A. palmeri under future climate scenarios, with mean annual temperature identified as the primary factor limiting range expansion at the northern margin (Briscoe Runquist et al. Reference Briscoe Runquist, Lake, Tiffin and Moeller2019; Kistner and Hatfield Reference Kistner and Hatfield2018). This suggests that growers in the U.S. Northeast should anticipate increasing A. palmeri pressure in coming years. Additionally, high temperatures and water stress may also affect herbicide performance, further exacerbating the species’ impact on agricultural sustainability (Coetzer et al. Reference Coetzer, Al-Khatib and Loughin2001; Varanasi et al. Reference Varanasi, Godar, Currie, Dille, Thompson, Stahlman and Jugulam2015).
Critically, all populations in this study remained susceptible to postemergence applications of mesotrione, and tank mixtures of atrazine plus mesotrione provided near-complete control (≤3% biomass relative to NTC) regardless of atrazine sensitivity. These results are consistent with the well-documented synergistic interaction between PSII- and HPPD-inhibiting herbicides, which has been shown to improve control of both susceptible and resistant A. palmeri populations (Abendroth et al. Reference Abendroth, Martin and Roeth2006; Chahal et al. Reference Chahal, Jugulam and Jhala2019; Jhala et al. Reference Jhala, Sandell, Rana, Kruger and Knezevic2014; Woodyard et al. Reference Woodyard, Hugie and Riechers2009). This synergy results in part from increased mesotrione absorption when tank mixed with atrazine (Chahal et al. Reference Chahal, Jugulam and Jhala2019) and demonstrates that HPPD-inhibitor combinations can remain viable management tools even when target-site or metabolic resistance to individual herbicides is present. Given the limited herbicide options available once resistance evolves and the capacity of A. palmeri to rapidly dominate seedbanks, growers should adopt a zero-tolerance threshold for seed production and implement diversified herbicide programs incorporating multiple effective sites of action applied preemergence followed by postemergence applications with residual activity (Barber et al. Reference Barber, Smith, Scott, Norsworthy and Vangilder2015; Chahal et al. Reference Chahal, Ganie and Jhala2018; Norsworthy et al. Reference Norsworthy, Ward, Shaw, Llewellyn, Nichols, Webster, Bradley, Frisvold, Powles, Burgos, Witt and Barrett2012, Reference Norsworthy, Griffith, Griffin, Bagavathiannan and Gbur2014). The continued efficacy of atrazine plus mesotrione tank mixtures on atrazine-resistant populations in this study provides New York corn growers with an immediately actionable management option; however, reliance on this strategy alone will likely accelerate selection for HPPD-inhibitor resistance, as has occurred in Kansas and Nebraska (Nakka et al. Reference Nakka, Godar, Thompson, Peterson and Jugulam2017; Thompson et al. Reference Thompson, Peterson and Lally2012). Sustainable management of A. palmeri requires integrated approaches that reduce selection pressure on any single herbicide site of action while minimizing seedbank inputs.
Funding
This work was supported by the National Institute of Food and Agriculture,
U.S. Department of Agriculture Hatch project (2020-21-230) “Documenting Herbicide Resistant Palmer Amaranth and Waterhemp in NY and Identifying the Parameters Influencing Spread.” CAB was supported by the USDA National Institute of Food and Agriculture and Regional Research Appropriations under project no. PEN04818 and accession no. 7004166.
Competing interests
The authors declare no conflicts of interest.


 Open access