


Non-technical Summary
Digenean trematodes are parasitic flatworms that often infest shell-forming mollusks, including clams and snails, and may leave recognizable traces in the host shell, which are preserved in the fossil record. In this project, we used morphometric approaches to analyze three clam species (Transennella conradina, Abra segmentum, and Chamelea gallina) from (sub-)fossil assemblages of Florida and Italy to evaluate the hypothesis that trematode infestation affects shell morphology. The results suggest that infested and non-infested individuals differ significantly in morphology. Infested populations show higher overall variance in morphology, which indicates abnormal morphological development of the infested bivalves. The significant reduction of the pallial sinus suggests a diminished burrowing ability in infested individuals, which could affect the ecological role of these organisms. Larger specimens show a significantly elevated occurrence of trematode-induced pits in comparison to smaller individuals, indicating accumulation of parasites over the life cycle of the host bivalve. The results also suggest that morphological changes induced by trematode parasites can potentially hamper the process of differentiating species in the fossil record, especially among infestation-prone species. We recommend utilizing fossil specimens without any parasite-induced morphological alterations to mitigate these effects. On the other hand, comparative morphometric analyses of infested and non-infested host specimens can help us study host responses to parasites over geological timescales.
Introduction
The parasite–host interactions between digenean trematodes and molluscan bivalves have a substantial evolutionary history, with the documented fossil record extending back to the Eocene in marine species (Todd and Harper Reference Todd and Harper2011; Huntley and De Baets Reference Huntley and De Baets2015) and Late Cretaceous in freshwater species (Rogers et al. Reference Rogers, Rogers, Bagley, Goodin, Hartman, Thole and Zatoń2018; De Baets et al. Reference De Baets, Dentzien-Dias, Huntley, Vanhove, Łaska, Skawina, Van Steenkiste and Vanadzina2024). These endoparasites possess a complex life cycle comprising multiple developmental stages that involve a series of invertebrate and vertebrate hosts (Cribb et al. Reference Cribb, Bray, Olson, Timothy and Littlewood2003).
The life cycle of digeneans begins when eggs release miracidia (larvae) that infect the first intermediate host; within this host, miracidia become mother sporocysts that reproduce parthenogenetically to produce cercariae (Supplementary Fig. 1). Depending on the taxon, cercariae are free-swimming with sensory/locomotory organs that actively locate and penetrate the next host (reducing host mismatch; Niewiadomska and Pojmańska Reference Niewiadomska and Pojmańska2011) or rely on passive transfer, encysting externally or remaining encysted until ingestion (Galaktionov and Dobrovolskij Reference Galaktionov and Dobrovolskij2003). In the second intermediate host, daughter sporocysts or rediae encyst as metacercariae; in bivalves, this stage produces diagnostic traces on the inner shell surface that are preserved in the fossil record (Bartoli Reference Bartoli1974; Huntley and De Baets Reference Huntley and De Baets2015). Some bivalve-infecting gymnophallids (Digenea) use the same mollusk as the first and second host, bypassing a free-living cercarial phase (Huntley et al. Reference Huntley, De Baets, Scarponi, Linehan, Epa, Jacobs and Todd2021; Jung et al. Reference Jung, Chang, Shin, Ryoo, Hong, Lee and Song2021). Metacercariae reach vertebrate definitive hosts (birds, fishes, mammals) either by remaining encysted until the bivalve is eaten or, in other taxa, by leaving the bivalve and using passive or active transmission of free-swimming cercarial stages (Morley Reference Morley2015; Wang et al. Reference Wang, Wang, Gong, Yu, Zhang, Ren and Ma2022). Some taxa may exhibit flexibility in their life cycle, either deploying free-swimming cercariae for active transmission or preferring to stay encysted in the molluscan host in the form of metacercariae depending on the inhabited environment (Galaktionov et al. Reference Galaktionov, Gonchar, Wegner, Wolfensberger, Buschbaum and Romanovich2025).
Trematode parasitism can influence the community dynamics of an ecosystem. Infested bivalves show various responses, including an increase in risky behaviors, susceptibility to predation, complete castration, reduction of pallial sinus length, and/or growth rate changes (Hulscher Reference Hulscher1982; Kabat Reference Kabat1986; Taskinen Reference Taskinen1998; Laruelle et al. Reference Laruelle, Molloy and Roitman2002; Fredensborg et al. Reference Fredensborg, Mouritsen and Poulin2005; Huntley et al. Reference Huntley, Schiffbauer, Avila and Broce2018; Huntley and Scarponi Reference Huntley and Scarponi2021; Montenegro et al. Reference Montenegro, Romero and González2021; De Oliveira et al. Reference De Oliveira, Menezes, Keidel, Mello-Silva and Santos2022). Trematode activity may result in reduced survivorship in host populations (Ayala-Diaz et al. Reference Ayala-Díaz, Richardson and Anholt2017) or, in extreme cases, local extermination of hosts (Jensen and Mouritsen Reference Jensen and Mouritsen1992). Beyond host-level effects, parasites—including trematodes—are key drivers of community and ecosystem dynamics (Esch and Fernandez Reference Esch and Fernandez1994). Incorporating parasites into food webs increases link density, connectance, predator–prey interactions, and competitive hierarchies via both density- and trait-mediated pathways (Mouritsen and Poulin Reference Mouritsen and Poulin2005; Dunne et al. Reference Dunne, Lafferty, Dobson, Hechinger, Kuris, Martinez and McLaughlin2013). Parasites also contribute substantially to biomass and energy flux: in three Pacific estuaries, trematode-dominated parasite biomass equaled or exceeded that of top predators (Kuris et al. Reference Kuris, Hechinger, Shaw, Whitney, Aguirre-Macedo, Boch and Dobson2008). At broader evolutionary scales, parasite impacts on morphology and performance have been hypothesized to contribute to major biotic shifts. For example, trematode infestation has been proposed as a potential explanation for the extinction of inoceramid bivalves as a result of significant shell deformities (Ozanne and Harries Reference Ozanne and Harries2002) or, conversely, enabled long-term ecosystem stability (Seilacher et al. Reference Seilacher, Reif and Wenk2007). By conducting comparative analyses between paleocommunities with high trematode prevalence (i.e., proportion of specimens possessing trematode-induced pits within an assemblage) and modern analogues, we can verify the effects of trematode activity in host populations and better interpret long-term impacts of trematodes on evolutionary timescales.
Mollusk shells, both recent and fossil, not only provide data on spatiotemporal dynamics of parasite–host interactions (De Baets and Littlewood Reference De Baets and Littlewood2015; De Baets et al. Reference De Baets, Huntley, Scarponi, Klompmaker and Skawina2021a,Reference De Baets, Huntley, Klompmaker, Schiffbauer, Muscente, De Baets and Huntleyb; Rojas et al. Reference Rojas, Huntley, Caffara and Scarponi2025) but also document trematode-induced changes in the morphology of host shells, such as reduction in shell durability and/or changes in body shape (e.g., length/width ratio) (Thieltges et al. Reference Thieltges, Saldanha, Leung and Poulin2009; Hammoud et al. Reference Hammoud, Kayenbergh, Tumusiime, Verschuren, Albrecht, Huyse and Van Bocxlaer2022). We focus here on digenean trematodes that remain encysted in bivalves and generate characteristic shell traces (i.e., gymnophallids). This study aims to evaluate changes in overall shell morphology induced by trematodes.
To explore the effects of infestation on bivalve morphology, this study targets three species of bivalves known to harbor traces of trematodes. We use the presence of characteristic pits (Supplementary Fig. 2) on the inner surface of the bivalve host shell as an indicator of this infestation. Various types of traces have been reported in previous studies focused on trematode–mollusk pairings, including igloos, pearls, volcano-shaped structures, and calcified shell-trapped trematodes (Ituarte et al. Reference Ituarte, Cremonte and Deferrari2001, Reference Ituarte, Cremonte and Zelaya2005; Laruelle et al. Reference Laruelle, Molloy and Roitman2002; Benito et al. Reference Benito, Izagirre, Lekube, Zaldibar, Villalba, De Montaudouin, Daffe, Soto and de Cerio2023; Gérard et al. Reference Gérard, De Tombeur, Dahirel and Ansart2023; Marchiori et al. Reference Marchiori, Quaglio, Franzo, Brocca, Aleksi, Cerchier, Cassini and Marcer2023). However, pits were the only trace morphotype considered in this study. Restricting analyses to one trace morphotype is a common practice in order to narrow down potential proxies of infestation (Montenegro et al. Reference Montenegro, Romero and González2021). The overwhelming majority of the specimens analyzed here exhibited parasite-induced traces, with only one specimen showing igloo-shaped traces. This specimen was removed during sample processing due to poor preservation, which made it inadequate for morphometric analyses. No other trace morphotypes were identified among the analyzed specimens.
Using landmark-based geometric morphometrics and the pallial sinus index (PSI = pallial sinus length/shell length), the study quantifies bivalve shell morphology, contrasts morphologies of the infested and non-infested bivalves, and explores the broader ecological and paleontological implications of the observed patterns. The PSI was used as a proxy for burrowing depth in this study. Previous studies show that deeper pallial sinuses correspond to deeper maximum relative burrowing depths in relation to shell size (Kondo Reference Kondo1987).
Materials and Methods
Target Species
The three bivalve species selected for this study are widespread, tend to be abundant in coastal habitats, and are potential hosts for trematode parasites, representing species with similar ecology and shell morphology. Transennella conradina Dall, Reference Dall1884 is a benthic infaunal venerid bivalve with a geographic range spanning south and west Florida, the Bahamas, and Quintana Roo, Mexico (Turgeon et al. Reference Turgeon, Lyons, Mikkelsen, Rosenberg, Moretzsohn, Felder and Kamp2009). Abra segmentum Récluz, Reference Récluz1843 is an infaunal semelid bivalve with widespread occurrences along the Atlantic coast of France as well as the Mediterranean Sea, Black Sea, Caspian Sea, and Aral Sea (Kevrekidis et al. Reference Kevrekidis, Kasapis and Kalpia2009). Chamelea gallina Linnaeus, Reference Linnaeus1758 is an infaunal venerid bivalve distributed along the south coast of Portugal, the Mediterranean, and the Black Sea (Rufino et al. Reference Rufino, Gaspar, Pereira and Vasconcelos2006; Joaquim et al. Reference Joaquim, Matias, Matias, Moura, Roque, Chícharo and Gaspar2014).
Study System, Sampling, and Laboratory Processing
Valves of T. conradina were acquired from the Florida Museum of Natural History (FLMNH), Invertebrate Paleontology (IP) site Leisey Shell Pit 03A (Lat: 27.7009, Long: −82.4914 WGS84), which has a diverse terrestrial and aquatic (freshwater/brackish/marine) fauna of Pleistocene age. The specimens used in this study were collected from the upper shell bed, a late Pleistocene lagoonal deposit belonging to the Fort Thompson Formation (Morgan and Hulbert Reference Morgan and Hulbert1995). This deposit consists of a mixture of marine/freshwater mollusk shells and vertebrate bones (Jones et al. Reference Jones, Mueller, Acosta and Shuster1995). Bulk sediment samples from Leisey Shell Pit 03A were wet sieved through a 1.5 mm sieve, and valves of T. conradina were separated. Only complete right valves were collected for morphometric analysis to avoid potential morphometric differences between the right and left valves. In total, 613 specimens were recovered.
Valves of A. segmentum were sieved from hand-collected sediment samples in Lago di Lèsina (Lat: 41.888, Long: 15.3635 WGS84), a lagoon in Puglia (Italy). A total of 441 valves and unique identifiable fragments (with intact umbo) were recovered. Unique fragments and whole valves obscured by encrusting algae account for 143 and 63 specimens, respectively. This left 235 unobstructed whole valves, 95 of which had at least one trematode pit resulting in a trematode prevalence value of 40.43% calculated from all whole specimens (Richardson et al. Reference Richardson, Scarponi, Scirocco and Huntley2019; J.W.H. personal observations 2024). A subsample of 39 infested specimens and 93 non-infested specimens from the aforementioned sample set were randomly selected for morphometric analysis and sent to the University of Florida (USA).
Chamelea gallina specimens were extracted from cores drilled into the Po coastal plain (Holocene marginal marine deposits of Emilia Romagna, Italy), known to have high trematode prevalence, with infested specimens characterized by a significantly larger median body size than non-infested specimens (Huntley and Scarponi Reference Huntley, De Baets, Scarponi, Linehan, Epa, Jacobs and Todd2021; Fitzgerald et al. Reference Fitzgerald, Ryan, Scarponi and Huntley2024). Complete valves were separated from core 240-P4S, a core collected from the Bevano site located east of Ravenna (Lat: 44.3635, Long: 12.384 WGS84) in the Po coastal plain (Greggio et al. Reference Greggio, Mollema, Antonellini, Gabbianelli, Abrol and Sharma2012; Wittmer Reference Wittmer2014). Specimens from three samples (i.e., 240-P4S-7, 240-P4S-15, 240-P4S-17) were pooled together for use in this study. The sample 240-P4S-7 (21.20 m, n = 34) represents a transgressive barrier deposit emplaced during the last phases of sea-level rise of the middle Holocene, whereas 240-P4S-15 (4.65 m, n = 48) and 240-P4S-17 (13.30 m, n = 82) are from Late Holocene beach ridge deposits accumulated in the area during coastal progradation after the maximum marine transgression (Amorosi et al. Reference Amorosi, Colalongo, Fiorini, Fusco, Pasini, Vaiani and Sarti2004). All valves were dried for 24 h at 45°C, soaked in a 4% hydrogen peroxide solution, and wet sieved through 1 mm sieves (Wittmer Reference Wittmer2014). In total, 164 whole valves were collected. Prevalence rates for all three species are reported in Table 1.
Sampling sites, trematode prevalence, and mean number of pits per shell of Transennella conradina, Abra segmentum, and Chamelea gallina.

For C. gallina, samples are from different geomorphological and climatic contexts, which could contribute to morphological variation. To address this potential confounding factor (Supplementary Table 1), we excluded sample 288410 (240-P4S-7), which comes from a Holocene climate optimum setting, and then repeated the comparisons, limited to the two beach ridge samples 289163 (240-P4S-15) and 289184 (240-P4S-17). All statistical analyses conducted in this study compare infested and non-infested individuals within the same species; comparisons across species were restricted to generalized qualitative statements rather than specific numerical claims. Variations in age or provenance should not influence our results for the aforementioned species, T. conradina and A. segmentum, as each group of samples originates from unique depositional settings with restricted time spans.
In the case of A. segmentum and C. gallina, both left and right valves were used due to the small sample size (A. segmentum: right = 64, left = 68; C. gallina: right = 71, left = 93). The morphology of the left and right valves was compared to assess for differences. Specimens were photographed individually using a HAYEAR microscope camera. A metric scale was included on each image to allow for calibrated numerical measurements of the imaged specimens. Three linear dimensions (shell length, shell width, and pallial sinus length) were measured in millimeters using the image editing software ImageJ (https://imagej.net/ij/; Schneider et al. Reference Schneider, Rasband and Eliceiri2012).
Because magnification levels varied during the photography process, precision was assessed through repeated measurements (50 trials) of the smallest (289163-R-24, C. gallina, LS = 1.61 mm) and largest (289184-L-53, C. gallina, LS = 17.84 mm) individuals in the entire dataset. Length measurements in pixels were converted to millimeters using the image-specific pixel-to-millimeter scale ratios, which depended on the magnification level used for each image. The standard deviation in millimeters was used as an estimate of imprecision. The smallest individual (SD = 0.0052 mm) and the largest individual (SD = 0.026 mm) both indicate that the measurement error is negligible (<0.03 mm). No lens deformation was detected in the images that were taken. These measurements were used to compute the PSI using the following equation of Kondo (Reference Kondo1987):
 $$ \mathrm{PSI}={\mathrm{L}}_{\mathrm{PS}}/{\mathrm{L}}_{\mathrm{S}} $$
where LPS is the pallial sinus length, and LS is the shell length.
Each specimen was categorized as infested (parasite traces present) or non-infested (parasite traces absent). The number of parasite-induced traces was also counted for each specimen to record trematode intensity (number of trematode traces per individual host).
As a measure of confidence in identifying the inner features of the bivalve shell, which can vary depending on the state of preservation of the individual, an arbitrary value between 1 (severe erosion, inner features indistinguishable) to 5 (inner features clearly distinguishable around landmarks) was initially assigned. Specimens initially evaluated as between 2 and 4 were later reevaluated to either 1 or 5 after specimens were cleaned more thoroughly and inspected in closer detail. Specimens reevaluated as 1 were omitted as analytically inadequate.
Thirteen landmarks were digitized using the TPSDig software, including nine homologous landmarks placed at notable internal features present inside the shell and four pseudo-landmarks digitized at the posterior, anterior, dorsal, and ventral endpoints (Fig. 1). Landmarks 1–4 are the extreme endpoints of the valve (Type III landmarks), whereas landmarks 5–13 are assumed to be homologous points (Type I landmarks).
Thirteen landmarks plotted for each specimen: 1, extreme dorsal point; 2, extreme anterior point; 3, extreme ventral point; 4, extreme posterior point; 5, beak of umbo; 6, central point of hinge teeth; 7, extreme dorsal point of anterior muscle scar; 8, intersection between anterior muscle scar and pallial line; 9, extreme ventral point of pallial line; 10, intersection between pallial line and pallial sinus; 11, extreme anterior point of pallial sinus; 12, intersection between pallial sinus and posterior muscle scar; 13, extreme dorsal point of posterior muscle scar. Landmarks 9–11 for Abra segmentum are configured differently from those of the other species, and thus the pallial sinus length was measured from landmark 10 instead of 11. A, Transennella conradina, B, Abra segmentum, C, Chamelea gallina.

We did not utilize sliding semilandmarks for outline analysis for this project. Outline analysis requires a clear definition of homologous curves; however, incomplete margins and/or differential abrasion in fossil shells make this task difficult. By using a limited number of biologically homologous extremes, we alleviate issues that can arise when outlines are slightly damaged or incompletely preserved. This enabled us to increase the number of usable specimens for analysis. Our primary aim was to test for significant changes in overall shell shape related to infestation, including the PSI. We employed four anatomically interpretable extremes to capture the major axes of external shape, without modeling fine-scale curvature, which is not central to our hypothesis. Because we concentrated on these four extremes, our estimate of intraspecific shape variation, as well as any between-group separation, should be viewed as a conservative approach to discerning full-outline differences.
Statistical Analyses
To explore whether the number of parasite pits varies across different species and within-species size/age classes, box-and-whisker plots were constructed separately for each of the three species, with specimens grouped into two size classes: (1) small specimens (shell geometric mean < median shell geometric mean) and (2) large specimens (shell geometric mean ≥ median shell geometric mean). The Wilcoxon signed-rank test was used to assess differences in median values between the groups.
PSI was analyzed separately for each species. PSI was plotted against specimen size (estimated by the geometric mean of shell dimensions) to assess potential allometric effects. Pearson correlation tests were used to assess the significance of correlations between PSI and shell geometric mean. Box plots were used to visually compare PSI for infested and non-infested specimens, and the Wilcoxon rank test was used to assess the statistical significance of the observed differences. To minimize potential allometric effects, the analyses were repeated for data restricted to the largest size class (the upper 25th percentile of shell geometric mean).
Ordinary least-squares Procrustes superimposition analysis was conducted separately for each species using the 13 landmarks described earlier. Analysis was done using the gpagen function in the geomorph package (Baken et al. Reference Baken, Collyer, Kaliontzopoulou and Adams2021; Adams et al. Reference Adams, Collyer, Kaliontzopoulou and Baken2024). This method eliminates the effect of size variance by standardizing centroid size among all specimens and rotating all specimens to the same orientation. For the two species for which both left and right valves were used, the landmarks for the left valves were flipped to conform to the right valve configuration. Once Procrustes coordinates were obtained for every specimen, principal component analysis (PCA) was completed separately for each species to compare infested and non-infested specimens. One-way permutational multivariate analysis of variance (PERMANOVA) was performed using the adonis2 function in the vegan package (Oksanen et al. Reference Oksanen, Simpson, Blanchet, Kindt, Legendre, Minchin and O’Hara2024) to test whether the differences in centroids observed between the infested and non-infested specimens were statistically significant. Thin-plate spline analysis was performed with lollipop graphs to track landmark shifts along the principal component (PC) axes using the MorphoJ software. Allometric effects were evaluated using the Pearson correlation test (with statistical significance estimated using bootstrapping; 10,000 iterations) between the PSI and centroid size and visually using bubble plots.
The use of PCA and PSI served two different purposes. Landmark-based PCA was used to depict the overall shell morphology and assess the impact of trematode infestation on the shell morphospace, identifying areas of interest among the internal features of the bivalve host where the greatest amount of morphological change is detected between infested and non-infested groups. Thus, the results are more conservative with respect to detecting differences but provide information on a larger morphological scale. Univariate analysis of PSI was specifically focused on functional consequences and expected to provide a stronger signal for that goal. These two measures are thus not intended to be approximations of the same morphological pattern, but rather focus on somewhat different, yet related, questions regarding the morphological consequences of infestation.
Effects of infestation on the morphospace occupation were evaluated using the hypervolume of all PCs (n = 22) calculated using the dynRB package (Schreyer et al. Reference Schreyer, Trutschnig, Junker, Kuppler, Bathke and Parkinson2022). The hypervolume is the n-dimensional region of trait/morphospace occupied by a group (e.g., species, sample, treatment), and it is calculated using dynamic range boxes. For each group of specimens (e.g., infested specimens of T. conradina), a number of range boxes is created based on the distribution it occupies in the observed morphospace. The first range box covers the entirety of the distribution (0–100%), and a variable number of range boxes are generated in decreasing quantile ranges (e.g., 12.5–87.5%, 25–75%, 37.5–62.5%, median). For each generated i th range box, the hypervolume and the overlap between other species’ specimen groups i th range boxes are calculated, and the overlap between specimen groups is calculated. The mean of the resulting range box values is used as the final estimation of the volume and overlap of each hypervolume (Junker et al. Reference Junker, Kuppler, Bathke, Schreyer and Trutschnig2016). To assess the effect of infestation on morphospace range, the hypervolume of non-infested specimens (no parasitic effect) was compared with the hypervolume of a pooled mix of infested and non-infested specimens (parasitic effect), with the two compared sets subsampled without replacement to a sample of n specimens (the specific value of n varied across species depending on the number of specimens available). Subsampling estimates were derived separately for each species (1000 replicate subsamples for each species). The rationale behind using pooled and non-infested groups for hypervolume comparison was to simplify the calculation process for morphospace inflation. If we had compared hypervolumes between infested and non-infested groups, it would have required an extra step to calculate the overall morphospace using the amount of overlap between the two hypervolumes (having to add up the hypervolumes of the infested and non-infested groups and subtract the amount of overlap to calculate the overall morphospace hypervolume). Also, comparing the overall morphospace to the non-infested morphospace provides a clearer visual depiction of morphospace inflation with box-and-whisker plots.
All analyses were performed in R (R Core Team 2025) and MorphoJ software. A significance level of alpha = 0.05 was assumed for all statistical comparisons.
Results
Trematode prevalence was high for all three species: Transennella conradina (24.30%, n = 613), Abra segmentum (40.43%, n = 235), and Chamelea gallina (66.46%, n = 161). Trematode intensity ranged from 0 to 127 for T. conradina (mean = 4.550), 0 to 18 for A. segmentum (mean = 4.641), and 0 to 17 for C. gallina (mean = 3.692), respectively (Table 1).
For all three species, the PSI of the infested specimens was reduced compared with the non-infested specimens (Fig. 2), and the median PSIs differed significantly between infested and non-infested specimens (Wilcoxon test, T. conradina: p << 0.0001, Z = 6.54; A. segmentum: p = 0.006, Z = 2.77; C. gallina: p << 0.0001, Z = 7.47). However, a significant negative correlation between PSI and shell geometric mean was observed in all three taxa although the effect size (r) varied notably among the three species (T. conradina: r = −0.14 ± 0.089, p < 0.0001; A. segmentum: r = −0.37 ± 0.15, p < 0.0001; C. gallina: r = −0.87 ± 0.03, p << 0.0001; 10,000 iteration bootstrap) (Fig. 3). Because trematode prevalence was significantly greater among the larger size classes, the allometric effect may partly or entirely account for the observed differences. PSI was reanalyzed for data restricted to large specimens only (Fig. 4), and the significant reduction in PSI, although less pronounced, was still observed for two out of the three taxa (Wilcoxon test, T. conradina: p < 0.0001, Z = 4.38; A. segmentum: p = 0.009, Z = 2.60), but was not notable or statistically significant for the third species (C. gallina, p = 0.495, Z = −0.68).
Box plot of Transennella conradina, Abra segmentum, and Chamelea gallina comparing the pallial sinus index (PSI) between infested and non-infested individuals. Box-plot widths correspond to the sample size of each group. Z values denote Wilcoxon test statistics. A, T. conradina. B, A. segmentum. C, C. gallina.

Allometric effects of the observed taxa. Pallial sinus index (PSI) plotted against geometric mean. Each data point represents a unique specimen. The r values denote Pearson correlation coefficients. Each data point is scaled to log(shell geometric mean). A, Transennella conradina, B, Abra segmentum, C, Chamelea gallina.

Box plot comparing the pallial sinus index (PSI) between infested and non-infested individuals, using large specimens only (Upper 25%). Box-plot widths correspond to the sample size of each group. Z values denote Wilcoxon test statistics. A, Transennella conradina, B, Abra segmentum, C, Chamelea gallina.

For all three taxa, PC ordination suggests a significant shift in morphospace when comparing the infested and non-infested specimens (Fig. 5A–C.). The centroids of the two groups differ significantly in location (for all three species, p < 0.0001 PERMANOVA; 10,000 iterations), whereas the morphospaces of infested and non-infested specimens overlap in the ordination space (Fig. 5A–C); in each case, the infested specimens extend beyond the region occupied by non-infested specimens, suggesting the inflation of morphospace. Thin-plate spline analysis shows a significant decrease in mean PSI in individuals possessing trematode-induced scars in comparison to non-infested specimens. Lollipop graphs (Fig. 5D–F) were plotted to visualize the behavior of landmarks in relation to PC 1 scores. For T. conradina and C. gallina, landmarks 10, 11, and 12 were used to evaluate changes in pallial sinus length (Fig. 1A,C), whereas landmarks 9, 10, and 11 were used for Abra segmentum as a result of differences in landmark configuration (Fig. 1B). Results show that the sinus becomes shallower as the PC 1 scores decrease. Also, the PC 1 scores were significantly lower for the infested specimens compared against the non-infested specimens in all three taxa (T. conradina: t = −6.60, p << 0.001; A. segmentum: t = −5.40, p << 0.001; C. gallina: t = −7.81, p << 0.001; Fig. 5D–F), suggesting that the infested populations are characterized by the statistically significant shallowing of pallial sinus length (consistent with the univariate analysis of the PSI given earlier).
Principal component (PC) 1 plotted against PC 2 using Procrustes coordinates. A, Transennella conradina, B, Abra segmentum, C, Chamelea gallina. Thin-plate spline analysis with lollipop graphs. PC 1 values increase from each point outward to the tip. D, T. conradina, E, A. segmentum, F, C. gallina.

PC ordination was carried out once again using large specimens restricted to shell lengths above the 75th percentile (T. conradina, A. segmentum) and 50th percentile (C. gallina) (Fig. 6). In two out of the three observed taxa (A. segmentum, C. gallina) we can still observe the decrease in average PC 1 values among infested specimens (Figs. 7B,C). Average PC values between infested and non-infested populations of T. conradina no longer show significant differences when restricted to large specimens; however, we can still observe significant morphospace inflation with specimens extending beyond the upper bound of PC 2 values of non-infested populations (PERMANOVA, 10,000 iterations; T. conradina: p = 0.0002; A. segmentum: p = 0.0008; C. gallina: p = 0.042). PCA was redone for C. gallina to only include specimens from beach ridge depositional environments. Differences in mean PC 1 values were still significant with this restricted analysis (Supplementary Fig. 3; PERMANOVA; p < 0.0001, all size classes; p = 0.0208, upper 25% size class). PC variances are reported for each species (Supplementary Table 2)
Principal component (PC) 1 plotted against PC 2 using Procrustes coordinates. Restricted only to large specimens. A, Transennella conradina (upper 25%), B, Abra segmentum (upper 25%), C, Chamelea gallina (upper 25%).

Hypervolumes of all principal component (PC) values between large infested and non-infested populations within each species (1000 iterations). Error bars indicate 95% confidence intervals. A, Transennella conradina (upper 25%), B, Abra segmentum (upper 25%), C, Chamelea gallina (upper 50%).

Comparative PC analyses between left and right valves were carried out for the two species (A. segmentum, C. gallina) where both valves were pooled for the previous analyses. Only A. segmentum showed statistically significant differences between the two valves (p = 0.0039). Effect size (PERMANOVA pseudo-F) was compared between analyses grouped by infestation status and valve to compare the effect on morphological change attributed to each variable. Morphological differences between infested and non-infested specimens consistently yield significantly larger effect sizes than those focused on left versus right valve comparisons (Supplementary Table 2; Supplementary Fig. 4). PC analysis was redone for A. segmentum and C. gallina restricted to right valves only to assess whether the morphometric differences between infested and non-infested groups were still significant. In this restricted analysis, significant differences were still observed between mean PC values of infested and non-infested specimens (PERMANOVA, A. segmentum: p = 0.0003, C. gallina: p < 0.0001; Supplementary Fig. 5).
To formally assess the inflation of morphospace, the hypervolumes of PC values for all PCs were calculated separately for each species for the following two groups: (1) all specimens (combining the infested and non-infested specimens) and (2) non-infested specimens only (Fig. 7). Only large specimens, with shell lengths exceeding the 75th percentile, were used for this analysis. Because groups (pooled vs. non-infested) differ in sample size, and the size of hypervolume potentially increases with the number of observations (Foote Reference Foote1992), the group sample size was standardized by subsampling with replacement. Confidence intervals of 95% around hypervolume estimates were calculated using percentiles of replicate subsamples (1000 iterations each). In two of the three species (T. conradina, A. segmentum), PC hypervolumes show significantly elevated values among pooled populations in comparison to non-infested populations (p << 0.0001 in both cases), suggesting an inflation of morphospace because of trematode infestation. However, in the case of C. gallina, the difference between the two hypervolumes was neither notable (Fig. 7) nor statistically significant.
Discussion and Conclusions
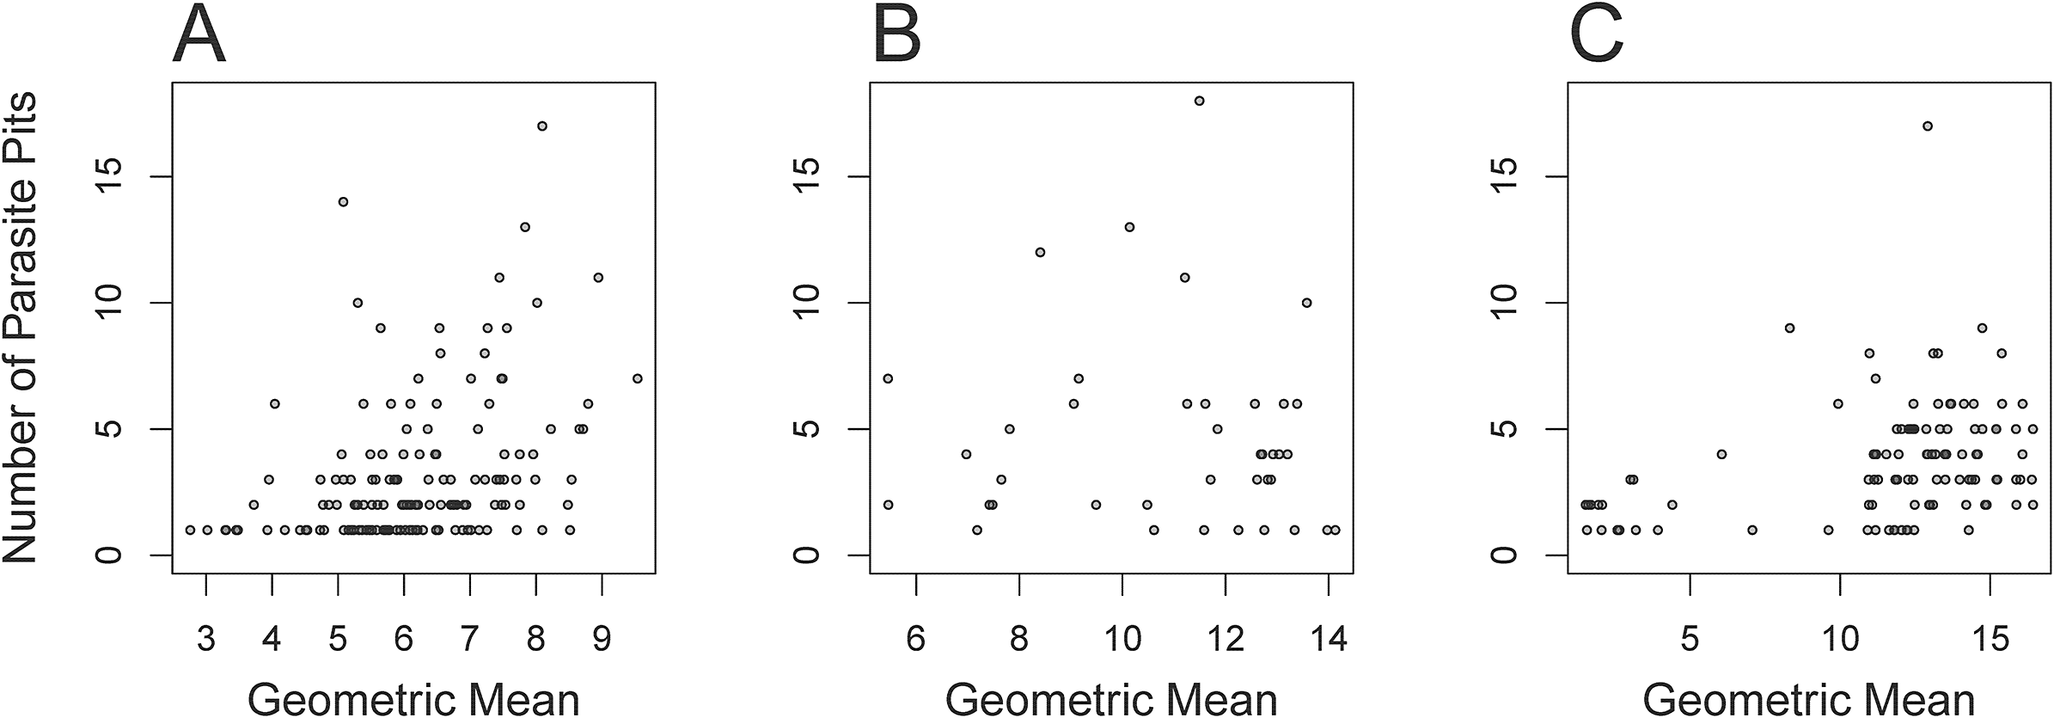
Trematode prevalence was substantial in the three species studied, pointing to the generally high prevalence of trematode parasites in mollusk bivalves, as observed in multiple previous studies (Huntley and Scarponi Reference Huntley and Scarponi2012; Huntley and De Baets Reference Huntley and De Baets2015; Scarponi et al. Reference Scarponi, Azzarone, Kowalewski and Huntley2017; De Baets et al. Reference De Baets, Huntley, Klompmaker, Schiffbauer, Muscente, De Baets and Huntley2021b; Montaudouin et al. Reference Montaudouin, Arzul, Cao, Carballal, Bruno, Correia and Cuesta2021; Montenegro et al. Reference Montenegro, Romero and González2021; Puljas and Burazin Reference Puljas and Burazin2022; Benito et al. Reference Benito, Izagirre, Lekube, Zaldibar, Villalba, De Montaudouin, Daffe, Soto and de Cerio2023; Marchiori et al. Reference Marchiori, Quaglio, Franzo, Brocca, Aleksi, Cerchier, Cassini and Marcer2023). However, the high prevalence also reflects the environmental setting and the host type: the infaunal bivalves from coastal habitats (especially lagoonal settings) tend to experience high trematode prevalence, especially when associated with phases of relative sea-level rise (Huntley et al. Reference Huntley, Fürsich, Alberti, Hethke and Liu2014; Scarponi et al. Reference Scarponi, Azzarone, Kowalewski and Huntley2017). For all three species, the large specimens (shell length > median (shell length)) had a significantly higher frequency of pits (intensity) and higher proportion of infested specimens (prevalence) than the small specimens (shell length ≤ median (shell length)) (p < 0.01 in all cases; Fig. 8; Table 2). Similar trends were observed in several previous studies on trematode–mollusk pairings (Hammoud et al. Reference Hammoud, Kayenbergh, Tumusiime, Verschuren, Albrecht, Huyse and Van Bocxlaer2022; Puljas and Burazin Reference Puljas and Burazin2022; Marchiori et al. Reference Marchiori, Quaglio, Franzo, Brocca, Aleksi, Cerchier, Cassini and Marcer2023).
The number of parasite pits plotted against shell length. A, Transennella conradina, B, Abra segmentum, C, Chamelea gallina.

Statistical analyses of trematode prevalence and pit count of Transennella conradina, Abra segmentum and Chamelea gallina. Small < median shell geometric mean, large ≥ median shell geometric mean of sample set.

The morphological responses of infested bivalve hosts may have taxonomic implications, as the species delineation of fossil bivalves primarily relies on shell characteristics, given that the preservation of soft tissue and viable genetic material is exceedingly rare in the fossil record. Specifically, the morphological changes resulting from parasitic interactions may lead to the oversplitting of species and inconsistencies in taxonomic assessments within the studied system (Inoue et al. Reference Inoue, Hayes, Harris and Christian2013). Yet the importance of this confounding factor remains poorly understood (Bickford et al. Reference Bickford, Lohman, Sodhi, Ng, Meier, Winker, Ingram and Das2007).
The significant increase of body size of trematode-infested mollusks when compared with non-infested specimens is consistent with previous studies (Ballabeni Reference Ballabeni1995; Sorensen and Minchella Reference Sorensen and Minchella1998; Negovetich and Esch Reference Negovetich and Esch2008; Huntley and Scarponi Reference Huntley and Scarponi2012). The size increase is typically attributed to trematode-induced castration of the molluscan host, which can result in the increased growth rate, because the host is no longer allocating resources toward reproduction (Sorensen and Minchella Reference Sorensen and Minchella1998). In addition, the tendency for larger individuals to possess a larger number of parasite-induced traces in all three observed species (Fig. 8) could reflect the accelerated growth rates of the host bivalve when more parasites are present. However, the presence of larger numbers of parasite pits in larger hosts could also reflect parasite accumulation through the host’s ontogeny, where larger and thus potentially older specimens are simply more likely to be infested by larger numbers of parasites as a result of them having been exposed to the threat of infestation for a longer interval of time (Huntley and Scarponi Reference Huntley and Scarponi2012). For example, ontogenetic accumulation of sporocysts containing metacercariae is known to occur in Macoma balthica populations infested with Parvatrema affinis (Swennen and Ching Reference Swennen and Ching1974), and consequently the greater number of parasite-induced scars is expected to be found in larger individuals.
An increased number of pits has been reported in larger size classes in numerous previous studies (Ruiz Reference Ruiz1991; Hammoud et al. Reference Hammoud, Kayenbergh, Tumusiime, Verschuren, Albrecht, Huyse and Van Bocxlaer2022; Puljas and Burazin Reference Puljas and Burazin2022). There are several possible explanations as to why this may be the case: (1) trematodes require space to accommodate metacercariae or sporocysts. Larger host bivalves possess greater extrapallial space and thus can harbor a larger number of trematodes and/or allow for increased chances of encystment (Sohn et al. Reference Sohn, Ryang, Chai and Lee1998); (2) larger individuals (assuming shell length as a proxy of age) naturally have longer exposure times to the water column as well as higher filtration rates, which increases the odds of elevated trematode intensity in the bivalve host (Richard et al. Reference Richard, Maire, Daffe, Magalhães and Montaudouin2022); (3) the heavily infested bivalves may have been affected by increased growth rates (gigantism), causing the most heavily infested individuals to grow to the largest sizes (Montenegro et al. Reference Montenegro, Romero and González2021; De Oliveira et al. Reference De Oliveira, Menezes, Keidel, Mello-Silva and Santos2022). If gigantism was the dominant factor, we would expect small individuals with a large number of trematode pits to be present in the sample sets. However, this was not the case here. Spatial point pattern analysis of traces (SPPAT) (Rojas et al. Reference Rojas, Dietl, Kowalewski, Portell, Hendy and Blackburn2020, Reference Rojas, Huntley, Caffara and Scarponi2025) could be used in future projects to assess the accommodation space required for encysted trematodes. A point of concern when evaluating these possibilities is that age, shell size (accommodation space), and exposure times may be partially correlated (especially for shell size and age), requiring us to properly separate the effects of each variable. A potential method is to gather non-infested live host bivalves grouped by size classes and perform artificial infection trials in controlled laboratory settings to document changes in trematode prevalence of the population and trematode density within each individual (Gustafson and Bolek Reference Gustafson and Bolek2016). Such trials could also help determine whether the morphological differences detected between infested and non-infested mollusks are a consequence of trematode activity or the cause of elevated susceptibility to infestation, which has been proven difficult to determine in previous studies on mollusk–trematode interactions (Minguez et al. Reference Minguez, Lang, Beisel and Giambérini2012; Puljas and Burazin Reference Puljas and Burazin2022).
The results of this study suggest a statistically significant reduction of the pallial sinus in infested specimens when compared with non-infested specimens. These results were observed here for two of the three species collected from different settings (Transennella conradina, Abra segmentum), regardless of whether a multivariate (geometric morphometrics) or univariate (PSI) approach was used, and even after restricting the data to larger size classes to minimize the influence of allometry. The decrease in the PSI of infested individuals suggests that infested hosts were characterized by relatively shallower maximum relative burrowing depths in comparison to non-infested individuals (Kondo Reference Kondo1987; Huntley and Scarponi Reference Huntley, De Baets, Scarponi, Linehan, Epa, Jacobs and Todd2021). This may benefit the parasite by increasing the likelihood of infestation into the subsequent (definitive) host in two ways: (1) by allowing the bivalve-infesting parasite easier access to the sediment surface in which cercariae can be ingested by the definitive host (Galaktionov Reference Galaktionov1996); and (2) through an increased host vulnerability to predation due to the decreased maximum relative burrowing depth or an increase in risky host behaviors. For example, the infested individuals of M. balthica more frequently displayed crawling-onto-the-shore behavior (Swennen Reference Swennen1969; Lim and Green Reference Lim and Green2011), although the explanation could be more complicated (Mouritsen Reference Mouritsen1997). These changes (e.g., increased accommodation space, risky behavior, reduced resistance to breakage, reduction/loss of reproduction capacity) may be beneficial to the survival and/or reproduction of the parasite and suggest the emergence of extended phenotypes of mollusk hosts when subjected to trematode infestation (Goodman and Johnson Reference Goodman and Johnson2011).
Bivalves play a significant role in the nutrient cycling process as part of a larger system encompassing biogeochemical and trophic processes (Atkinson et al. Reference Atkinson, Vaughn, Forshay and Cooper2013; Konrad Reference Konrad2014; Vaughn and Hoellein Reference Vaughn and Hoellein2018). Changes in burrowing capability or behavior can significantly influence the nutrient load and seafloor aeration of the local ecosystem. The negative impacts of trematodes on various ecological functions of bivalves are well documented. These include lowered clearance rates (Stier et al. Reference Stier, Drent and Thieltges2015), disruption of metabolic processes and reduced oxygen consumption (Magalhaes et al. Reference Magalhães, Freitas and Montaudouin2020), longer burrowing times and reduced survivorship in anoxic conditions (Wegeberg and Jensen Reference Wegeberg and Jensen1999), and reduced recruitment rates because of partial or complete castration of mature individuals (Mouritsen and Poulin Reference Mouritsen and Poulin2002). Depending on the taxon of the bivalve hosts or trematode parasites, these adverse effects of trematode parasitism may diminish the effectiveness of bivalve activity in the ecosystem, resulting in nutrient imbalance and insufficient oxygenation of the sediment. In areas with few dominant bivalve taxa and high trematode prevalence, the effect of trematodes must be accounted for to better understand the dynamics of trematode parasitism and its contribution to the overall ecosystem. Better understanding of evolutionary host responses against parasite infestation over geological timescales may also help with conservation efforts.
Geometric morphometric results indicate that trematode-infested specimens possess a notably inflated morphospace compared with non-infested specimens in all three observed species. Pooled populations show significantly elevated PC hypervolumes in comparison to PC hypervolumes of non-infested populations. This indicates a morphospace shift among infested populations, resulting in an overall inflated morphospace in pooled populations. When restricted to large specimens only, T. conradina no longer showed significant differences in PC 1 values between infested and non-infested populations. However, univariate analysis of PSI shows a statistically significant reduction in infested specimens, demonstrating that univariate signals can be masked in a multivariate analysis. Univariate analysis was proven to be more robust at identifying changes in specific anatomical details (i.e., sinus depth), whereas PC analysis was proven to be effective at quantifying shifts in morphospace. The integrative approach combining multivariate PC and univariate analyses of linear measurements is recommended here as potentially more effective at capturing individual morphological signals as well as changes in overall morphospace effectively. When allometric effects are present, it is advisable to restrict specimens to similar size classes to prevent allometric signals from overshadowing parasitic signals. The increase in morphological disparity induced by parasite-infested populations can potentially hinder species delineation using landmark morphometrics on shells, an approach commonly employed for both modern (Andrus et al. Reference Andrus, Stothard, Kabatereine and Wade2023) and fossil (Inoue et al. Reference Inoue, McQueen, Harris and Berg2014; Marquez et al. Reference Marquez, Trivellini and Van der Molen2017; Martins et al. Reference Martins, Chainho, Goulding, Samarão and Rufino2024) mollusk host species. Similarly, shifts in morphospace through evolutionary time, which are often quantified using morphometric analysis of skeletal remains at various taxonomic scales (Anderson and Roopnarine Reference Anderson and Roopnarine2005; Marinho and Arruda Reference Marinho and Arruda2021), can be potentially obscured or inflated by the inclusion of infested specimens, especially when parasite prevalence is high and morphological effects of the infestation are pronounced.
By focusing on single populations of bivalve hosts, this study does not incorporate the potential morphological variability that may occur across populations from differing local ecosystems. Potentially, substantial levels of intraspecific variation across populations could make infestation-related morphospace variability less significant when multiple populations are jointly considered in the analysis. Previous studies comparing bivalve populations across habitats indicate that intraspecific variability in shell morphology can indeed be substantial. Modern, single-generation populations of Mercenaria campechiensis from North Carolina, Florida, and Texas have been compared (Bush et al. Reference Bush, Powell, Arnold, Bert and Daley2002) against time-averaged Pleistocene samples of M. campechiensis from Florida (Caloosa Shell Quarry, Ruskin, FL) and North Carolina (Lee Creek Mine, Aurora, NC). Morphological variation shows high amounts of overlap between three paleocommunities located in the infauna-dominated upper bed. In contrast, the individuals from the epifauna-dominated lower bed show significantly less overlap in morphospace than those from the upper bed, suggesting that intraspecific changes in morphology outweigh the effects of morphological change over time in a relatively stable ecosystem (Bush et al. Reference Bush, Powell, Arnold, Bert and Daley2002). Lucina pectinata is shown to have elongated forms in loose sediment as opposed to the round forms found in compact hard-bottomed environments, as well as increased convexity of the shell among individuals sampled from brackish environments (Modestin Reference Modestin2017). Morphometric analyses of Ameghinomya antiqua along the Atlantic Patagonian coast reveal that salinity and temperature are the two most important drivers of change in shell shape, causing elongation of shells and ligaments under less favorable (low salinity and temperature) conditions, whereas chlorophyll a concentrations were highly positively correlated with shell size (Morán et al. Reference Morán, Martínez, Reyna, Martín, Malits and Gordillo2022). Considering these shell shape changes are immediately noticeable to the naked eye, it suggests that intraspecifically driven changes generally increase morphological variance to a greater degree than that of trematode-induced morphological changes, which are generally difficult to identify and require morphometric analyses to be detectable. For now, we recommend restricting morphological analyses to individual localities for trematode-induced changes to better capture these signals. However, it is evident that the morphological changes driven by trematode parasitism on bivalve hosts across multiple localities are understudied both in the paleontological and modern context and need more work to be fully understood.
Potential factors to consider in future studies that we have not explored in this study include the impact of trematode-induced morphological changes on the preservation of the host skeleton and/or evolution of the host species. Some studies show that trematode infestation may cause calcium leaching from host bivalve shells, resulting in lower shell mass and reduced capacity to resist breakage (Zhokhov et al. Reference Zhokhov, Pugacheva and Mikheev2024). Parasite-induced reduction of stress tolerance with host skeletons at the region of abnormal morphological development was also detected in decapod crustaceans (Wright et al. Reference Wright, Klompmaker and Petsios2024) and regular echinoids (Xavier et al. Reference Xavier, Almeida, Manso, Ghilardi, Santos, Sedorko and Scheffler2025). Parasite-induced change in structural integrity of host skeletons may result in preservational bias in the fossil record and must be considered and corrected for to accurately assess parasite prevalence in a fossil assemblage. Prior studies also reported long-term evolutionary consequences of trematode activity, such as the significant reduction of body size in Transennella (Bivalvia: Veneridae) (Ruiz Reference Ruiz1991) or the evolution of host defense mechanisms involving parasite trapping behavior observed in some terrestrial gastropods (Gérard et al. Reference Gérard, De Tombeur, Dahirel and Ansart2023). Future studies utilizing species involved in this study across differing time periods may be conducted to assess whether long-term evolutionary trends can be observed concordant to trematode prevalence rates or new adaptations emerge as a result of its activity.
In summary, this study demonstrates that the prevalence of trematodes can be high in bivalve species from coastal habitats and may exert significant morphometric effects, resulting in the inflation of morphospace, which can hinder the delineation of species and distort spatiotemporal trends in disparity. Fortunately, certain trematode infestations in the body fossils of bivalve mollusks can be identified, thus allowing us to mitigate these problems analytically by excluding infested specimens when conducting studies that use morphometric approaches to delineate fossil species or explore morphospace evolution. Conversely, this study suggests that morphometric studies that explicitly track the infestation status of specimens may be a fruitful research avenue for investigating spatiotemporal trends in parasite–host interactions, as well as the morphological responses of hosts, both within and across host taxa. Trematode–bivalve interactions are ubiquitous in present-day coastal ecosystems, significantly impact the hosts, and leave recognizable traces that are well preserved in the fossil record, making them a promising parasite–host system for paleobiological studies (De Baets et al. Reference De Baets, Huntley, Klompmaker, Schiffbauer, Muscente, De Baets and Huntley2021b). Integrating parasite information in morphometric analysis should not only improve our ability to delineate morphological species and reconstruct disparity trends but should also allow us to study the effects of trematode parasitism on bivalve morphology over long-term evolutionary timescales.
Acknowledgments
We thank G. Paulay (University of Florida) for valuable comments on the project and paper at various phases of its development. This study was partly funded by the Jon and Beverly Thompson Invertebrate Paleontology Endowment at the University of Florida and, the National Science Foundation grant (SGP 2409210 to J.W.H.).
Competing Interests
The authors declare no competing interests.
Data Availability Statement
Supplementary Materials including R scripts and raw data spreadsheets are archived on Dryad (https://doi.org/10.5061/dryad.fqz612k61). All Supplementary Figures, Tables, and Photomicrographs are archived on Zenodo (https://doi.org/10.5281/zenodo.18475722).


 Open access