


Introduction
The Earth's upper atmosphere plays an important role in influencing weather and future climate change. In particular, the mesosphere-lower thermosphere (MLT) is the transition region between Earth's atmosphere and space and is affected by atmospheric regions below and incoming solar ultra-violet and X-ray radiation, and charged particles. These drive chemical, radiative, and dynamical processes which couple the MLT with the lower atmosphere and with space weather. However, observation of the MLT is very limited and with our current knowledge derived from the measurement of radiative fluxes in the infrared (IR) that give an incomplete picture of its chemical composition, both in terms of the measured geophysical products as well as their altitude coverage. The detailed processes that govern the MLT function and interaction are thus poorly understood and yet, observed negative temperature trends indicate that the region is an important predictive indicator of climate change. Measuring the composition of the MLT is therefore an increasingly important goal for atmospheric scientists as it provides a means of disentangling our interpretation of associated heat flux between it and lower layers of the atmosphere, thereby providing a better understanding of the processes that drive climate change.
To achieve the above measurement objective, global observation of key MLT chemical species, e.g. O, NO, OH, is required. This is best accomplished through the low-Earth orbit (LEO) deployment of high-spectral-resolution supra-THz heterodyne radiometers that “target” each constituent and provide full characterization of the related spectral signatures. Measurement of OH and O requires, however, the development of radiometer systems capable of detecting at frequencies of 3.5 and 4.7 THz respectively and that also provide a spectral resolution of order 3 MHz. Moreover, the systems must be compliant with space operation and with the limited satellite platform resources: primarily, mass, volume, and electrical power. This presents a very considerable technical challenge because it requires the development and integration of complex heterodyne radiometer technologies that include, for example, supra-THz frequency mixer and local oscillator (LO) components, spectral signal processing systems, and precision optical interfaces. In relation to this, we present the development of a 3.5 THz quantum-cascade-laser (QCL) source and its integration within a precision-machined waveguide cavity that includes two miniature diagonal feedhorns. In addition to measuring resultant beam quality of the QCL output at 3.5 THz, we have also illuminated a breadboard antenna system concept that is compliant with passive sampling of the MLT from the LEO. This work represents an important step toward the realization of a full multi-channel supra-THz receiver system that will considerably advance Earth observation science.
Radiometer system concept
The use of THz heterodyne spectral radiometry has been well demonstrated at frequencies below 1 THz. However, developing supra-THz radiometer equivalents, shown schematically in Fig. 1, is very challenging and even more so when space deployment is required. For instance, difficulties must be overcome with respect to the fabrication of suitable heterodyne frequency mixers, LOs, and antennas; efficient radiometer front-end signal coupling between the mixer and the system fore-optics (primary and secondary antenna) is also necessary, as is compliance with small satellite platforms that invariably place demands on permissible system volume, mass, and power consumption. Additionally, a supra-THz LO source should ideally be coupled directly with a heterodyne mixing device and within a single package that also provides an accessible free-space output port for supra-THz power monitoring, leveling, and frequency stabilization.
Schematic of the supra-THz radiometer.

Despite their excellent potential as supra-THz LO sources, QCL devices exhibit a poor free-space power distribution, i.e. poor antenna pattern quality. This undesirable feature is particularly apparent when high-performance “double-metal” plasmonic cavities are used to confine radiation within the optical-gain medium [Reference Adam, Kasalynas, Hovenier, Klassen, Gao, Orlova, Williams, Kumar, Hu and Reno1] and limits QCL effectiveness in wider applications where free-space signal transmission is required. Integration with a mechanically fabricated waveguide and feedhorn antenna structure offers the possibility of enhancing the QCL output signal by constraining it to a propagation mode that results in improved beam quality, and simultaneously allows coupling to a mixer diode mounted within the same waveguide. This provides an attractive solution to the provision of a space-borne supra-THz LO and radiometer as it serves the purpose of delivering well-controlled signal guidance via a small and robust mechanical assembly, along with the provision of an efficient electromagnetic interface with free-space.
At a frequency of 3.5 THz, however, the dimensions of both waveguide and feedhorn challenge mechanical fabrication techniques. Thus, and in support of our radiometer concept, the viability of a diagonal feedhorn and waveguide combination as a supra-THz antenna and propagation medium requires demonstration, as does signal coupling to the instrument's primary antenna. To achieve the first objective, we have integrated a QCL within a mechanically micro-machined waveguide cavity that incorporates a diagonal feedhorn at each end. This new device extends a previously reported result [Reference Valavanis, Han, Brewster, Dean, Dong, Bushnell, Oldfield, Zhu, Li, Davies, Ellison and Linfield2] in which a QCL was integrated with a larger over-sized waveguide terminating in a rectangular aperture. In addition to using reduced waveguide dimensions that approach fundamental-mode operation, our novel dual feedhorn allows signal emission from each facet of the QCL to be propagated into free space. The integrated QCL device is subsequently used to validate a breadboard antenna system that is representative of a future satellite payload. This is achieved by illuminating the optical train and measuring the intensity distribution across the primary antenna surface.
Finally, our dual feedhorn approach takes a significant step toward realizing a fully integrated mixer and LO package. In this configuration, and with reference again to Fig. 1, one feedhorn will act as the signal input port and the other provides an output QCL signal required for subsequent injection into a frequency stabilization, i.e. phase lock, control system.
QCL and dual feedhorn integration and test method
QCL description
QCLs offer very considerable advantages as direct supra-THz signal sources. Although cryogenic operation is required, typically below 100 K, they are highly compact (millimeter scale) and rugged structures that are biased from a single direct current (dc) power supply as opposed to harmonically multiplying a lower-frequency source. They also directly generate sufficient supra-THz output power, typically at the milliwatt level, to “pump” a semi-conductor mixer diode, and thus provide a source of heterodyne radiometer LO power with an inherent narrow spectral emission signature.
Formed from a bandgap engineered semiconductor heterostructure, the QCL used in this experimental work is based on a GaAs/AlGaAs phonon-assisted “hybrid” design [Reference Wienold, Schrottke, Giehler, Hey, Anders and Grahn3]. The active region of the device has been grown using molecular-beam epitaxy and processed into a 1-mm-long, 56.8-μm-wide Au–Au ridge-waveguide structure, as described previously in [Reference Valavanis, Han, Brewster, Dean, Dong, Bushnell, Oldfield, Zhu, Li, Davies, Ellison and Linfield2]. The unmounted device operates in continuous-wave (cw) mode at heat-sink temperatures up to 86 K, with collected power in excess of 0.4 mW. It is important to note that the true output power of the unmounted laser is substantially larger than the measured value, as the coupling efficiency of radiation in the detector is limited by the poor beam quality.
QCL integration and cooling
The QCL was integrated into a waveguide cavity with a cross-section dimension of 0.16 × 0.08 mm2. The waveguide was machined into a copper block by using a precision mill. Two identical diagonal feedhorns with an across-diagonal aperture of 1.56 × 1.56 mm2 and a slant angle of 7.5° were also machined into the same block at each end of the waveguide. After machining, the block was gold plated to prevent corrosion and to improve thermal heat sinking to a cryogenic cooler. Bias connection to the QCL was achieved through the use of a standard SMA connector and a series of wire bonding steps that also included a stage of heat sinking. Figure 2a shows the fabricated cavity and feedhorn structure with a QCL placed in the waveguide.
(a) QCL, waveguide cavity, and dual feedhorn structure; (b) QCL, feedhorn block, and mirrors mounted on the cold finger. Window is not shown.
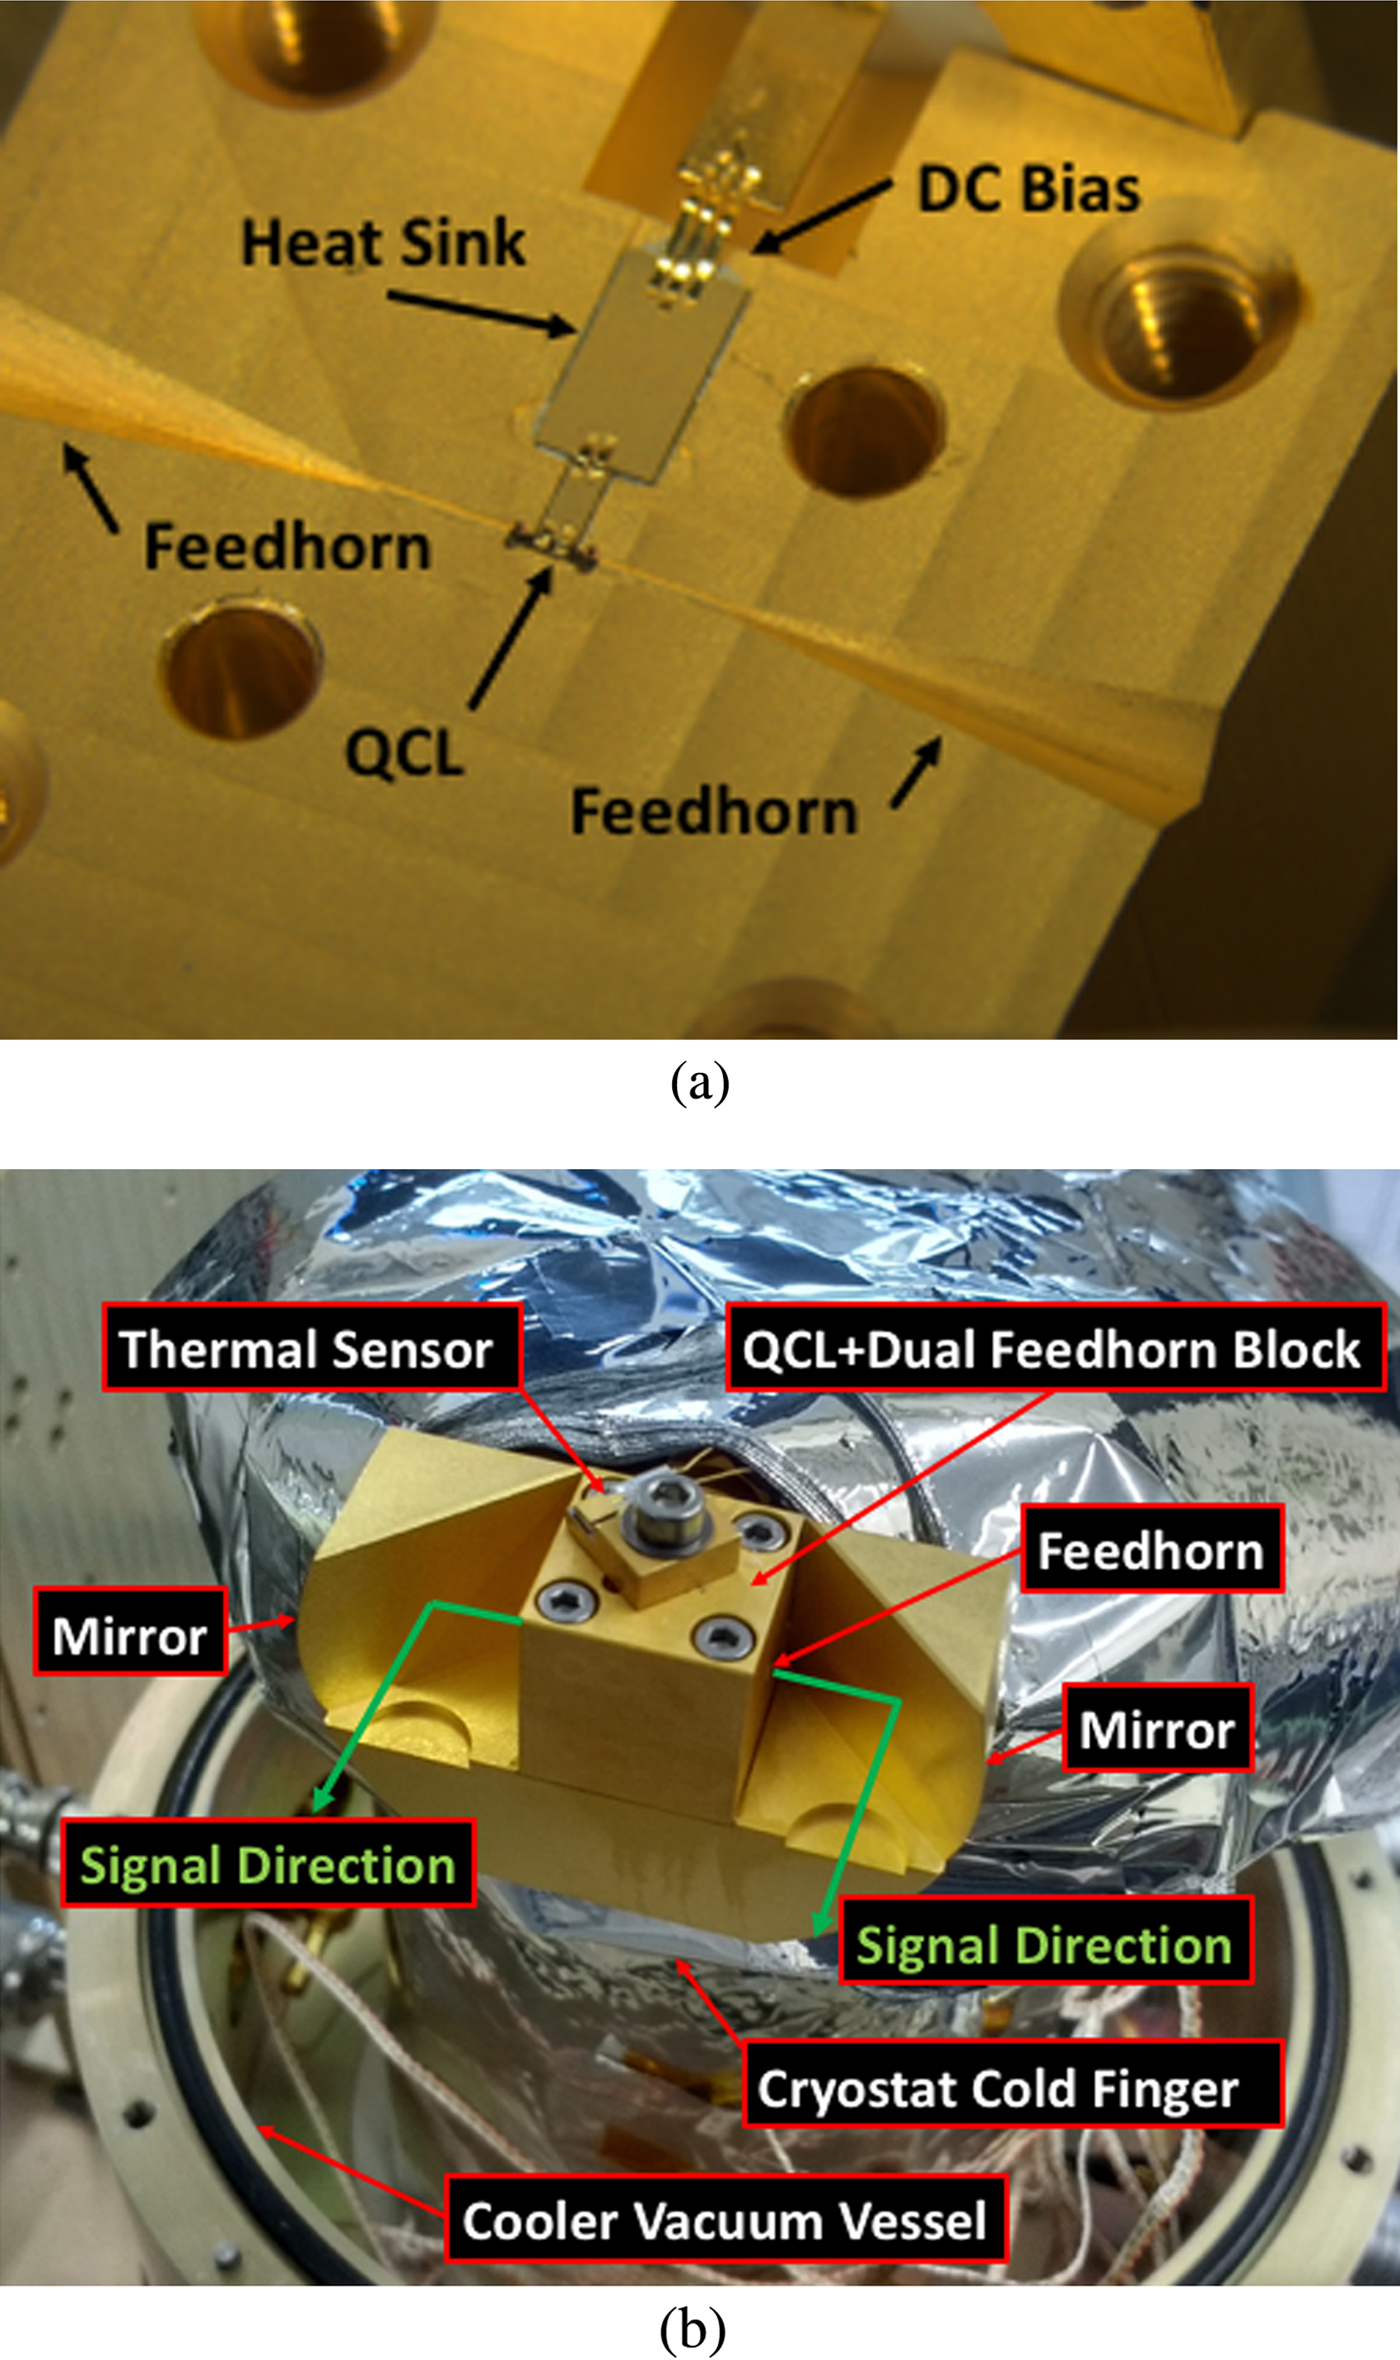
In order to attain the necessary electron population distribution within its multilayer bandstructure, the QCL must be cooled to a low-ambient temperature. To achieve this, the integrated QCL and feedhorn block was attached to the “cold finger” of a Stirling cycle cooler and operated at ~60 K in a cw mode. Two plane mirrors inclined at 45° to the signal propagation axis were machined into a gold-plated copper subcarrier and directed each feedhorn output through a single 1-mm-thick supra-THz semi-transparent vacuum window made from high-density polyethylene. Figure 2b shows the complete assembly mounted in the cooler.
Dual feedhorn antenna measurement method
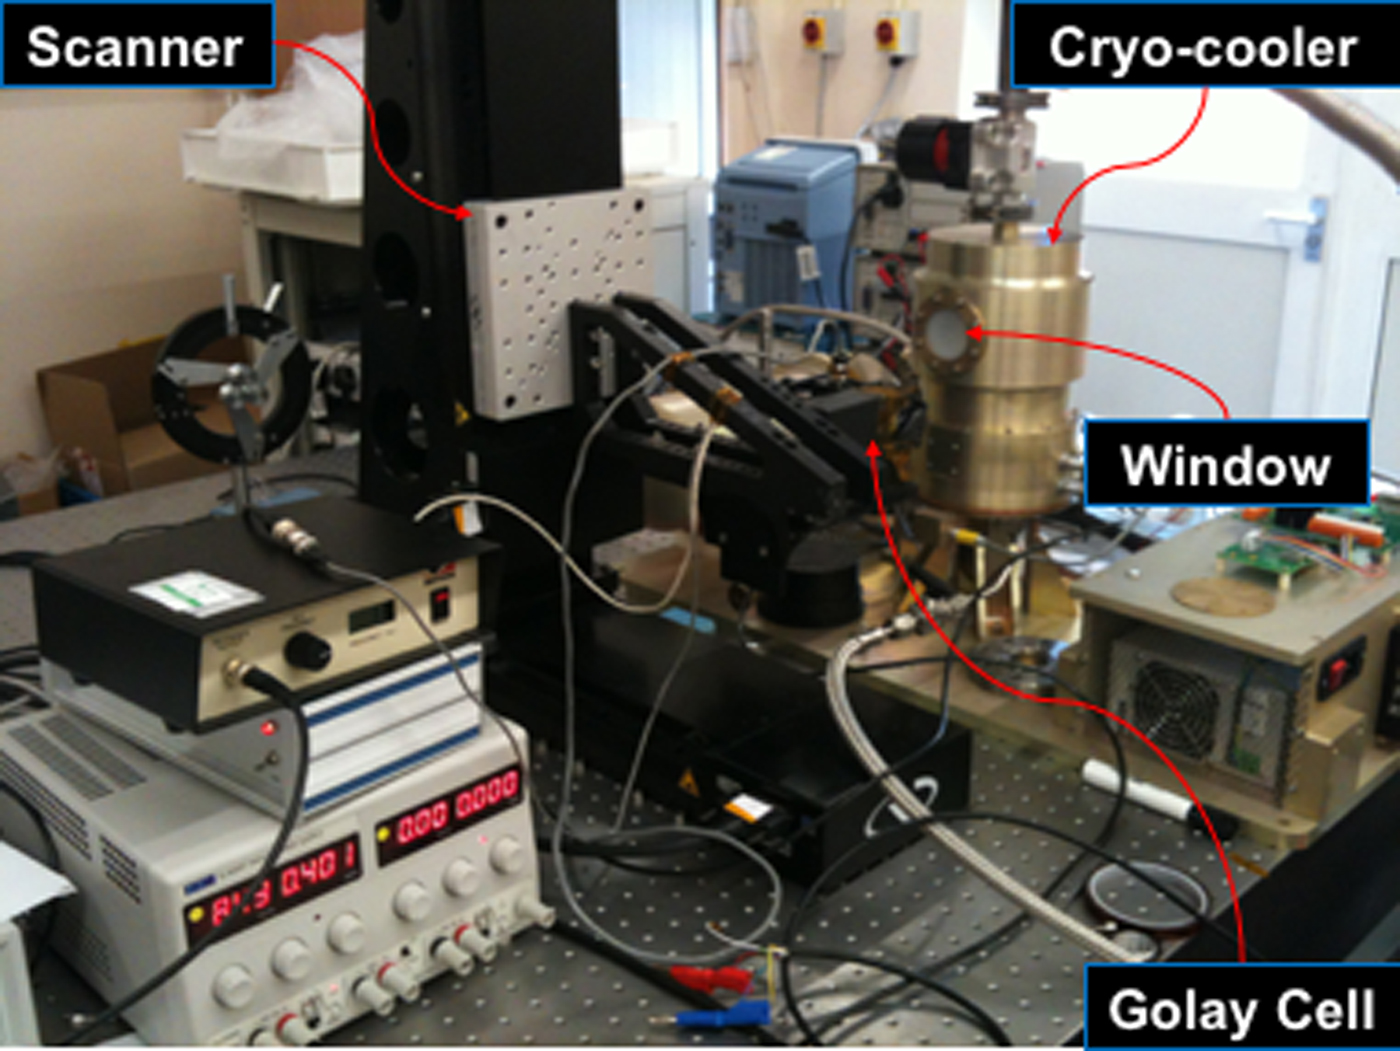
An unpolarized Golay detector [4] mounted on a two-dimensional linear scanning system was used to measure the supra-THz emission intensity, as shown in Fig. 3. With the detector located approximately 70 mm away from the feedhorn apertures, and thus in the antenna far-field, a series of discretely sampled intensity measurements were made in a rectangular coordinate reference plane orthogonal to the direction of signal propagation. The inherent Golay input signal entrance aperture was 3 mm in diameter, and could be reduced via the insertion of aperture stops, though at the expense of reduced signal-to-noise. A measurement step interval of 0.5 mm was used in both scan axes to ensure adequate spatial sampling. With a combined measurement integration and dwell time of 0.5 s, the typical time required to complete a full scan was 3 h.
System used to measure far-field 3.5 THz dual diagonal feedhorn antenna patterns.
Dual feedhorn simulation and measurement comparison
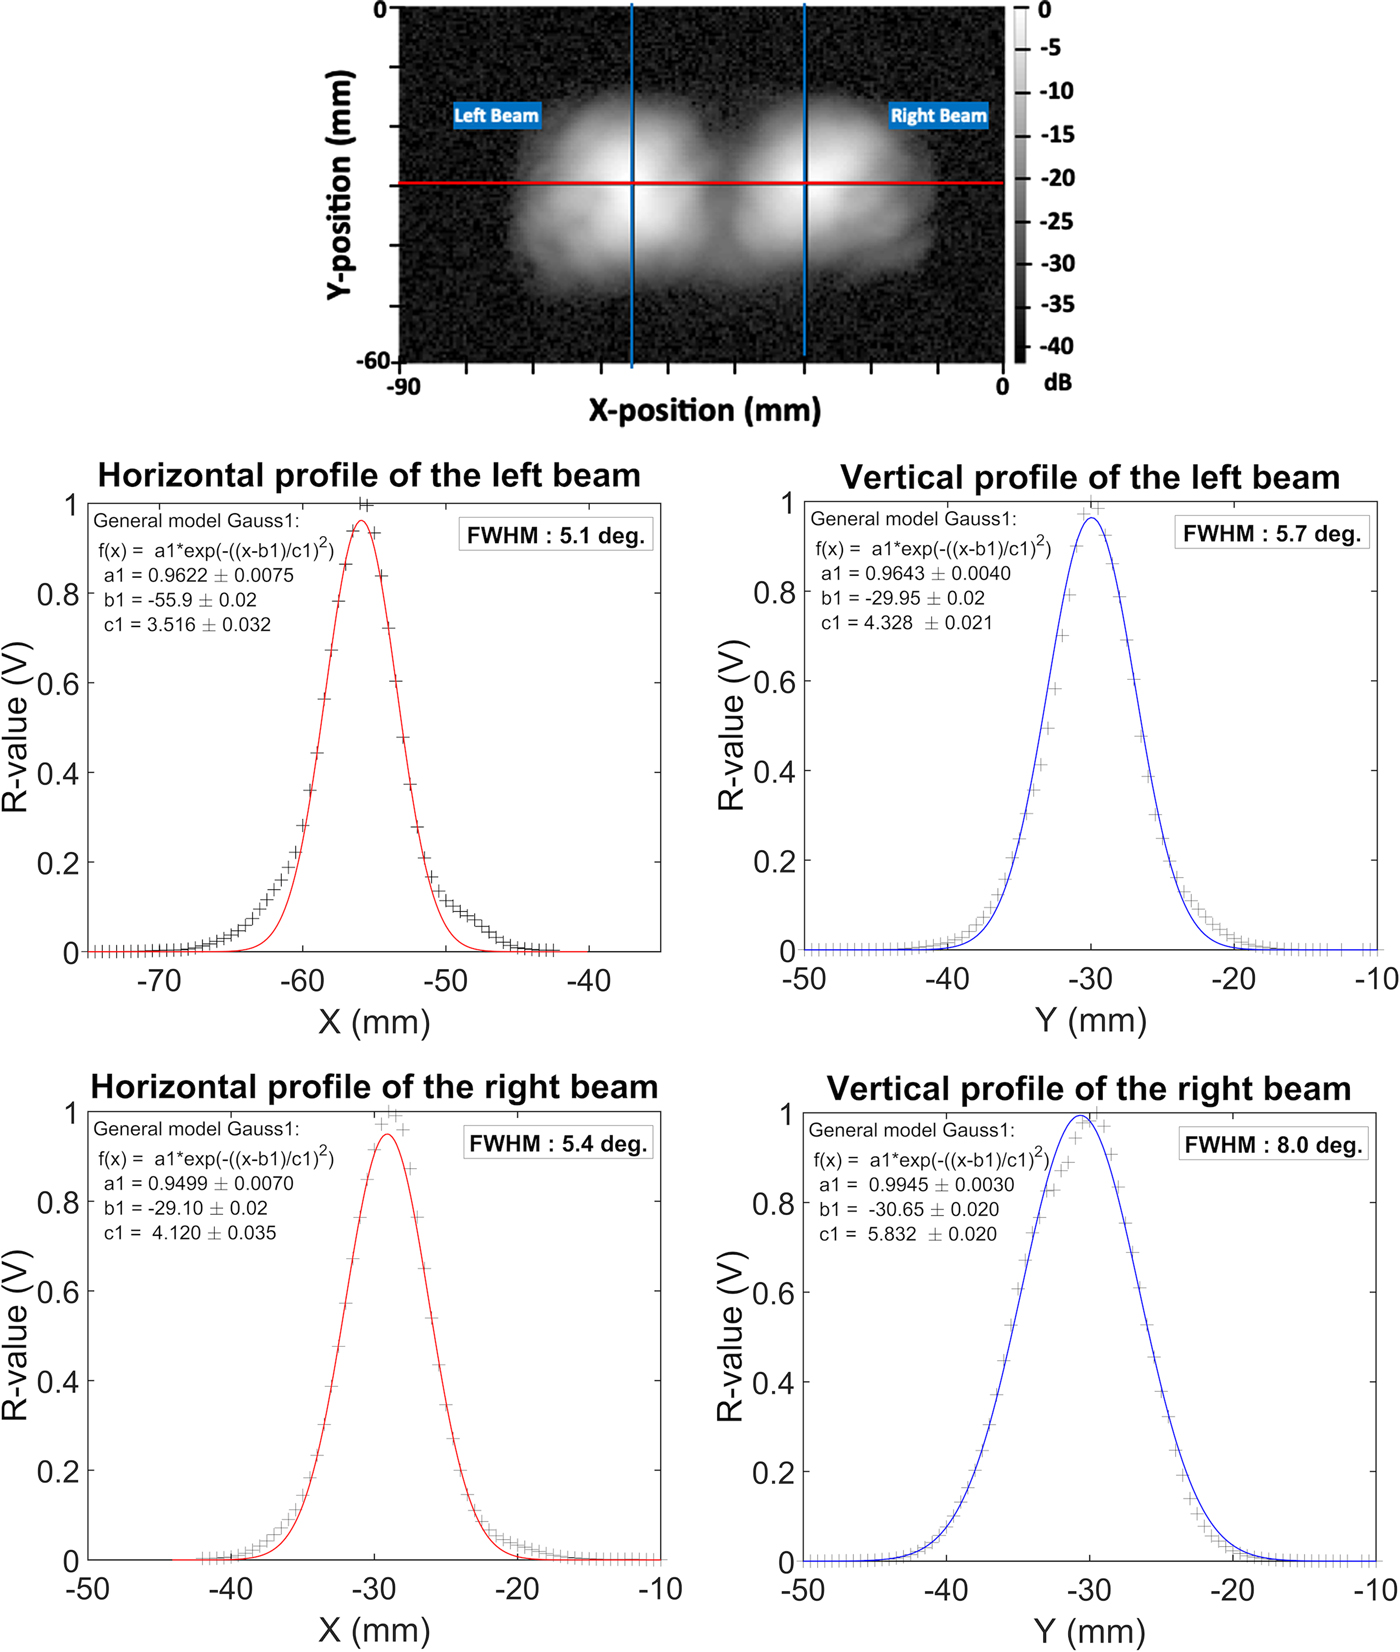
A software model of the diagonal feedhorn expanded single aperture electric fields into Gauss–Hermite modes [Reference Johansson, Wyborn, Acharya, Ekstrom, Jacobsson and Kollberg5], as shown in Fig. 4a. Comparison with the measured 3.5 THz feedhorn antenna patterns, Fig. 4b, obtained using the experimental arrangement shows good correlation. For example, bright central maxima and regions of undulating intensity located on two 45° planes that correspond to sidelobes are clearly visible for each beam. Additionally, the measured full-width-half-maximum (FWHM) beamwidths, as shown in Fig. 5, are close to the simulated value of 5°. The larger (8°) discrepancy apparent in one axis of one beam is likely due to imperfections in the feedhorn fabrication or misalignment of the separate block halves. Mutual interference effects due to the coherent nature of the QCL emission are also present within the measured pattern.
(a) Simulated single 3.5 THz feedhorn pattern. (b) Measurement of the dual feedhorn QCL device at 3.5 THz. The scan extent in each case is 70 × 70 mm2 and the Golay detector aperture was 3 mm diameter. The power scale applies to both images.
Top most image: 3.5 THz QCL dual beam profile sampled with a 2 mm diameter Golay detector aperture. Corresponding normalized horizontal and vertical antenna beam profiles measured across each diagonal feedhorn output (left and right beam) are shown in the bottom images (separate points) and with a Gaussian fit profile superimposed (continuous line). In most cases the beam FWHM is in close agreement with the simulated value of 5°.
Given the agreement with single beam simulation, we believe that the QCL signal is propagating in a fundamental transverse electric (TE10) mode within the waveguide, i.e. in the same mode used to excite the feedhorn simulation model. The results obtained represent a very substantial improvement in QCL output beam quality. This, in turn, demonstrates that a waveguide and diagonal feedhorn combination offers a very effective means of propagating a supra-THz QCL output signal.
Optical breadboard test
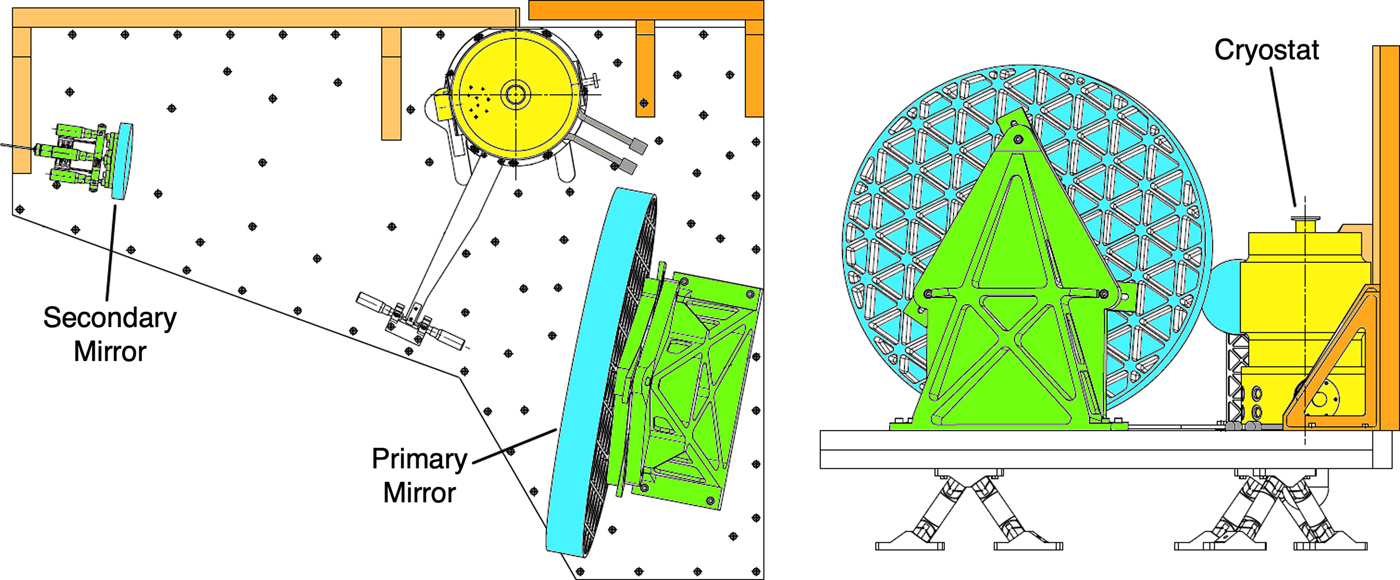
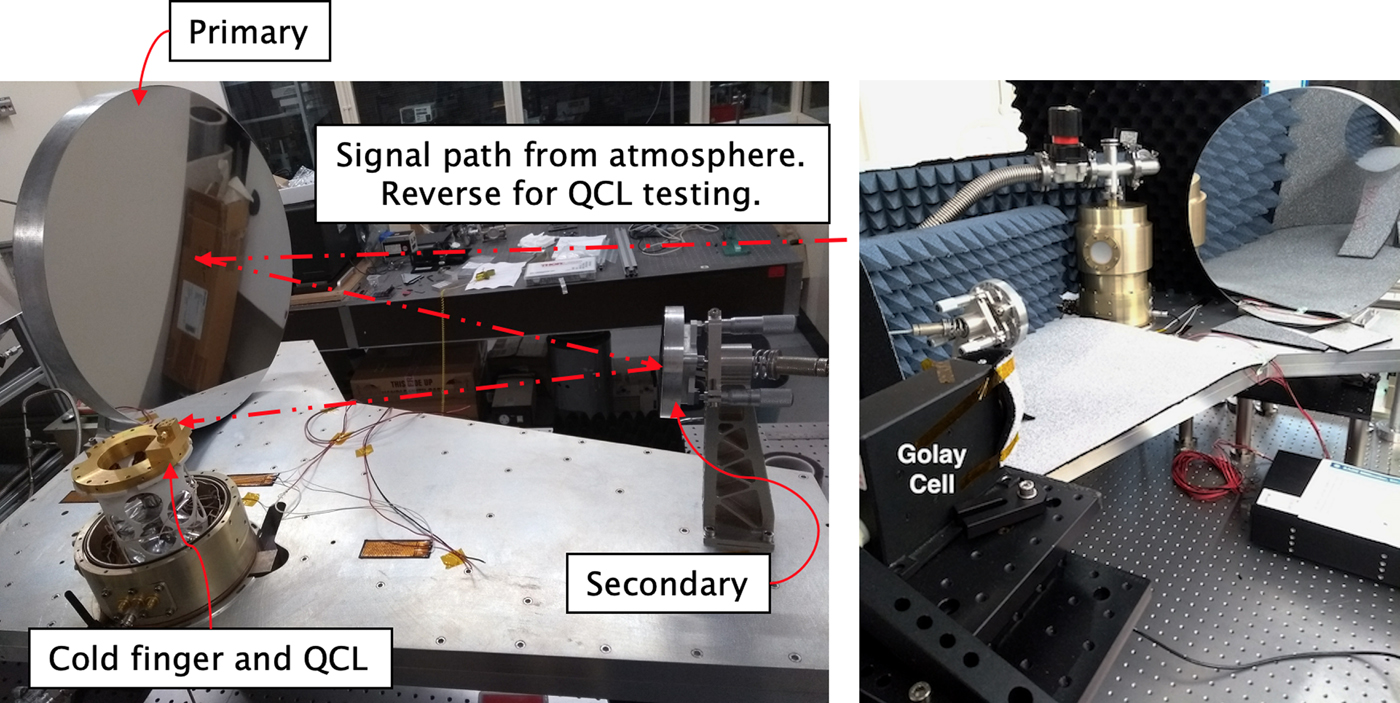
A breadboard payload structure has been developed as an essential step toward demonstrating a supra-THz heterodyne receiver intended for use in a future Earth-observation satellite – LOCUS (Linking Climate, the Upper-atmosphere and Space weather) [Reference Rea, Ellison, Swinyard, Linfield, Davies, Saunders, Parkes, Gerber, Henry, Wang, Alderman and Auriacombe6]. The breadboard incorporates the cryogenic system described in the section “QCL integration and cooling” and a quasi-optical train consisting of a 480-mm-diameter primary mirror and 100-mm-diameter secondary mirror that together form an offset Cassegrain telescope. Figure 6 shows a computer-aided design (CAD) view of the breadboard and Fig. 7 shows photographs of the constructed system, including the signal path between the QCL and mirrors. In order to allow inclusion and operation of an IR 5 µm wavelength radiometer channel within the payload, and which further extends the proposed mission science, each mirror surface has been diamond machined to sub-micrometer surface accuracy.
CAD drawings of the LOCUS breadboard system in plan (left image) and elevation (right image) views showing the location of the primary and secondary mirrors, and the cryogenic system that cools the QCL source. The QCL is replaced by a mixer and QCL LO when the system is configured as a supra-THz receiver.
Views of the LOCUS breadboard arrangement. The left image shows the location of the QCL on the cryogenic system cold finger. The signal path from the QCL to a Golay cell detector is also shown – note that the direction of this path is reversed when the QCL is replaced by a mixer and the system configured as a heterodyne receiver. The right image shows a view of the breadboard approximately from the direction of the Golay detector, which is shown mounted on the scanning system.
To confirm the approximate alignment of the system at 3.5 THz, a single output from the dual-feedhorn QCL source was used to illuminate the optical train. This was achieved by repositioning the QCL block on the cold finger such that only one beam emerged from the cryostat signal window, and with the unused output terminated in an absorbing load located within the cryogenic housing. The telescope (antenna) optics were first mounted on the breadboard and approximately aligned used a visible laser. The secondary was then removed and the QCL 3.5 THz beam measured using the Golay cell and scanner arrangement in a similar manner to that described earlier – note that a mechanical reference plate was previously added to the breadboard to ensure that the secondary could be correctly repositioned after its temporary removal.
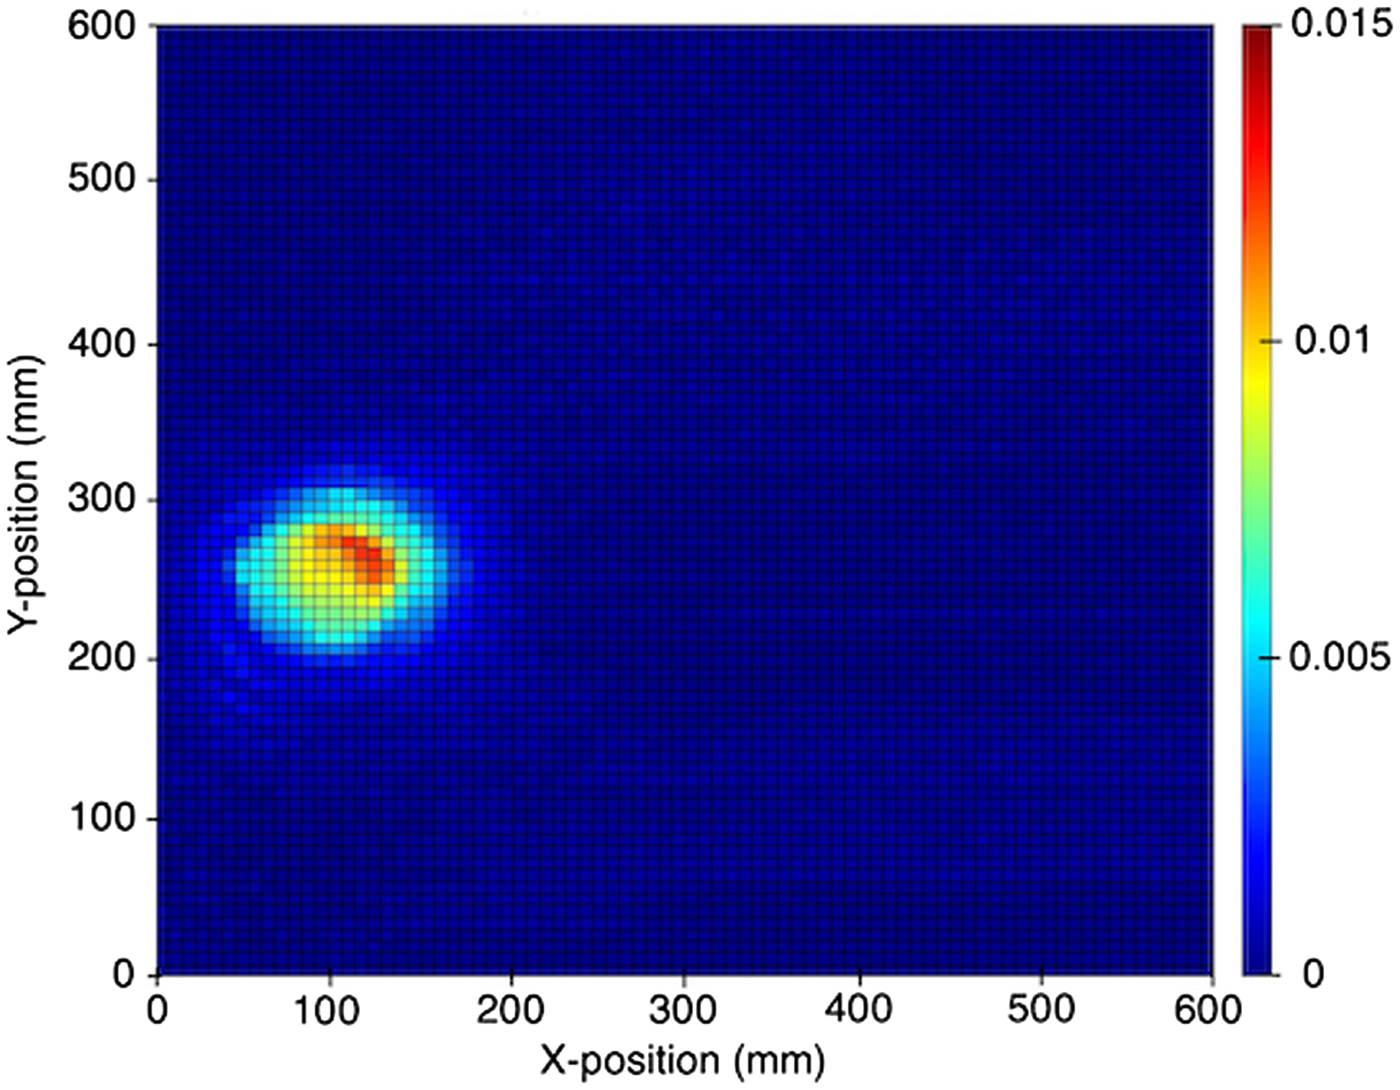
A scanned image of the resultant QCL beam with the secondary removed and with the plane of the detector located approximately 0.7 m from the QCL, is shown in Fig. 8. The spatial sampling interval was approximately 7.5 mm in both axes, with the integration time set to 300 ms for the Golay detector, a point-to-point settling time of 1 s, and a Golay input aperture of 2 mm diameter. The beam position is close to expectation, and the beam size consistent with an expected feedhorn FWHM as presented in the section “Dual feedhorn simulation and measurement comparison”, though some intensity distribution asymmetry is present, which might be the result of signal reflections.
Scan of the signal emerging from one output of the dual feedhorn 3.5 THz QCL with the secondary breadboard mirror removed. The intensity scale is linear and relative to the maximum observed signal.
The secondary was then relocated and a second scan performed in the near-field of the primary with the same step interval and Golay aperture size and the result is shown in Fig. 9. The small dashed circle indicates the approximate location of the secondary mirror, about which there appears to be a region of shadow that arises from QCL signal spillover. The latter is faintly discernible in Fig. 8, and more clearly visible in Fig. 9. Because of the greater measurement signal-to-noise ratio (SNR) arising from the increased integration time – it was necessary to increase the integration and settling times to 1 and 3 s respectively, resulting in a very lengthy scan time of approximately 7.5 h. A region of shadow is visible adjacent to the secondary that correlates well with a geometrical projection of the QCL beam from the cryostat. Note, though, that the secondary spillover in the left portion of the image is obscured by the presence of absorber material that was introduced in an effort to minimize stray signal input into the Golay detector.
First scan at 3.5 THz across the optical breadboard with the secondary mirror relocated. An intensity distribution across the primary mirror is evident, as is signal spillover and showing around part of the secondary. The small (dashed) and large (solid) circles show the approximate positions of the secondary and primary mirrors, respectively. The intensity scale is linear and relative to the maximum observed intensity. Note that the maximum in this case is nearly one order of magnitude lower than that of Fig. 8.
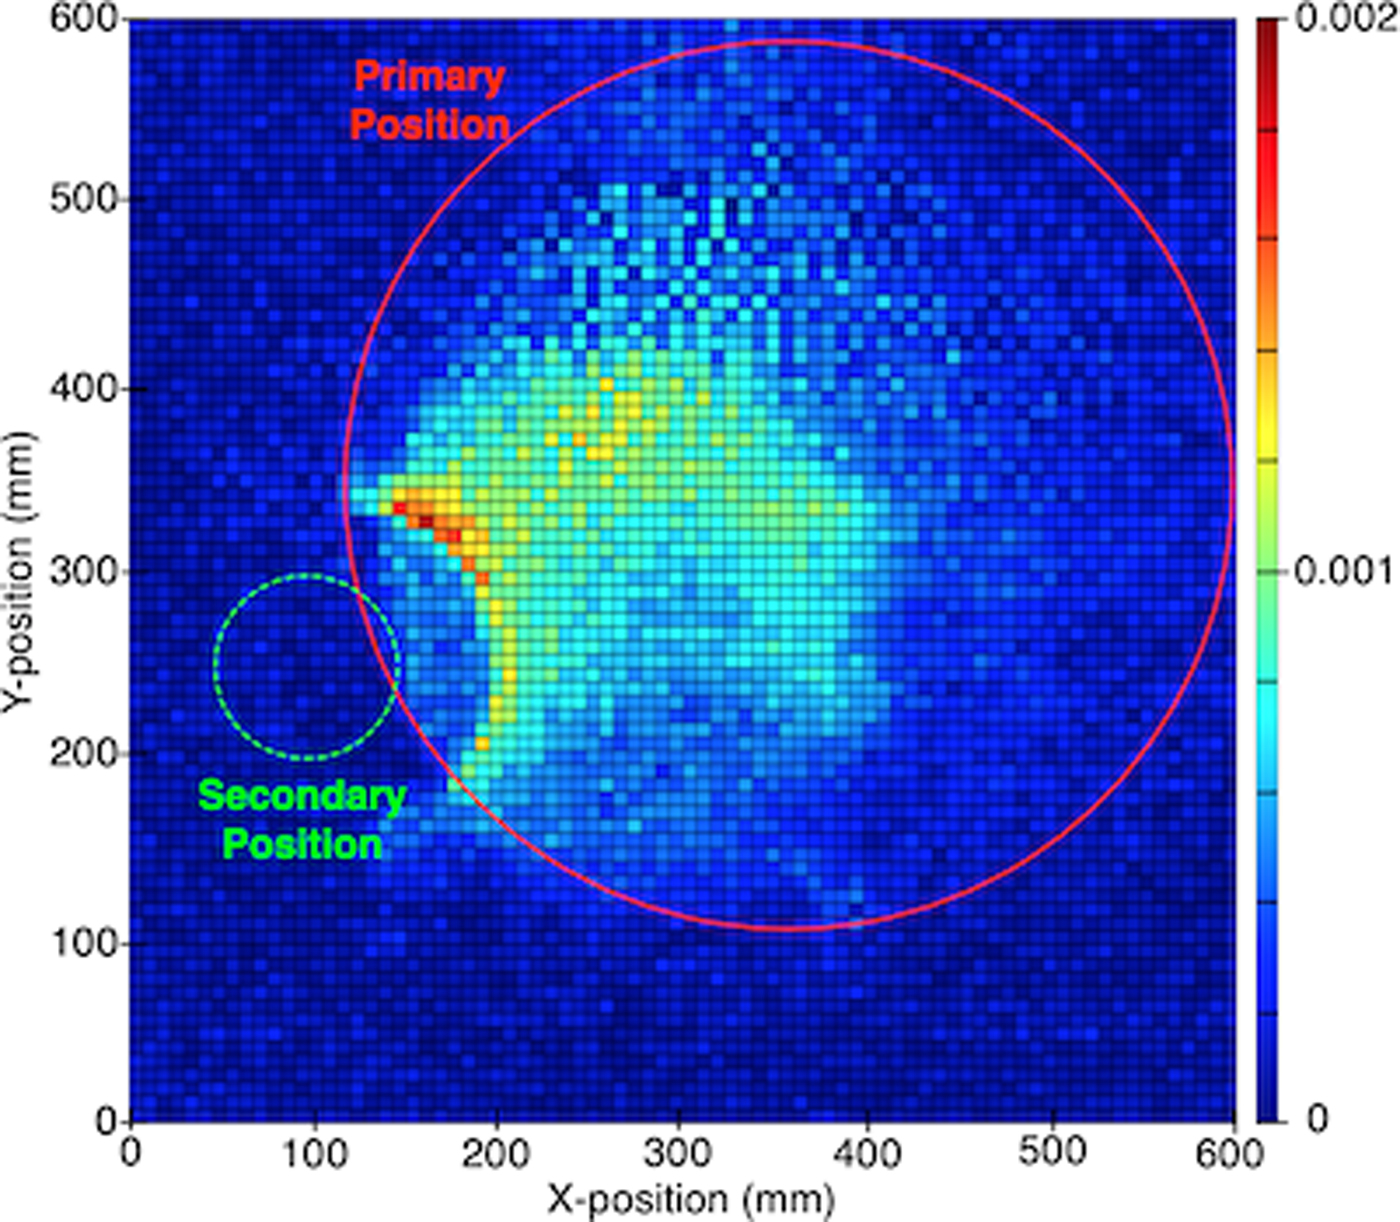
With further reference to Fig. 9, the location of the primary is indicated by the larger circle and a clear signal detection is apparent over part of its reflective surface area. This observed intensity distribution demonstrates that the QCL signal is successfully directed from the secondary toward to primary, though a lateral misalignment of the beam is apparent. To achieve a more evenly distributed signal across the primary, an adjustment of the secondary mirror position was performed. Additionally, a ring of absorbing material was added immediately around the secondary to attenuate the spillover signal and reduce image confusion. An improvement in the intensity distribution is observed, though the peak signal is still not centered on the primary (Fig. 10).
Scan at 3.5 THz across the primary mirror (circle) after adjustment of the secondary. The resultant intensity distribution is more clearly apparent with the secondary position adjusted and the spillover signal attenuated. The intensity scale is linear and relative to the maximum observed intensity.

Further optical alignment adjustments are thus required, but the lengthy scan duration and low SNR suggested that enhancement of the system sensitivity is a higher priority. These improvements would reduce the scan time and enhance the SNR, the latter being at present <10 dB. A revised measurement setup is therefore being planned that includes:
• Construction of a chamber surrounding the breadboard and scanner assembly that reduces the atmospheric water vapor content in the instrument signal path by injecting dry air. We estimate that at least 4 dB of signal loss occurs over the approximate 2 m signal pathlength.
• An improved detector unit based upon a Schottky diode direct detector that allows increased signal chopping speed, currently ~10 Hz, and substantially reduced settling time.
Nevertheless, the measurements performed to date represent a highly useful evaluation of the breadboard system by demonstrating the diagonal feedhorn and antenna interface, and we are not aware of similar tests being previously performed elsewhere.
Conclusion
A 3.5 THz QCL has been integrated with a waveguide and a dual diagonal feedhorn structure. This novel device has been used to test the effectiveness of a diagonal feedhorn and has demonstrated a very superior QCL beam profile when compared with unmounted devices. We conclude that this suggests a fundamental propagation mode is present within the waveguide. The resulting improvement in beam quality has been used to perform a first check and a rudimentary alignment of an optical breadboard assembly that forms the basis of a future supra-THz space-borne atmospheric sounding payload. The intensity distribution of the 3.5 THz signal across the face of the primary has been mapped and the optical system alignment adjusted to more effectively center the THz beam. We believe that this work represents an important step toward the development of a new Earth observation mission, LOCUS, aimed at improving our understanding of climate change.
In addition to the above, we foresee the wider use of our device in support of other applications where coherent sources of supra-THz radiation are required. These include, for example, the provision of LO power for future space-borne supra-THz heterodyne radiometers performing high-resolution spectroscopic astrophysics, laboratory-based gas spectroscopy measurement systems, and non-destructive imaging of materials. In addition to LOCUS, these wider applications will require refinement of our device technology to support higher frequency output, improved operational efficiency (i.e. lower power dissipation and high ambient temperature) and, in the case of heterodyne radiometers, close integration with the supra-THz mixing element and enhanced frequency stabilization. Correspondingly, and in addition to the improvements discussed in the section “Optical breadboard test”, we anticipate continued research and development work in areas associated with precision mechanical integration, QCL semiconductor composition, and frequency stabilization techniques.
Author ORCIDs
A. Valavanis, 0000-0001-5565-0463
Acknowledgement
The authors gratefully acknowledge the support of the RAL Millimetre-wave Group Precision Development Facility for fabrication of the waveguide and feedhorns. Funding for the work was provided by the European Space Agency General Support and Technology Programme (GSTP, contract 4000114487/15/NL/AF), the UK Space Agency Centre for Earth Observation and Instrumentation (CEOI, Contract RP10G0435A03), the UK Engineering and Physical Sciences Research Council (Grants EP/J017671/1 and EP/P021859/1), and the Royal Society (Wolfson Research Merit Award WM150029).
 Brian Ellison (CEng, FIET, MIEE) received a B.Sc. (Hons) degree in physics and astrophysics from the University of London, in 1977, and an honorary doctorate from The Open University, in 2017. In 1977 he joined the then UK Science Research Council and worked at its Chilbolton Observatory where he developed microwave radiometers for astronomy research. In 1984 he joined the California Institute of Technology, USA, where he developed millimeter-wave superconducting receivers and also acted as Chief Engineer for the Caltech Submillimeter-wave Observatory. In 1989 he joined the UK Science and Technology Facilities Council Rutherford Appleton Laboratory and currently leads its Millimetre-wave Technology Group and directs an extensive team of researchers in the development instrumentation for Earth-observation and astronomy experiments. His personal research interests include the advancement of terahertz technology related to high-resolution spectroscopy, and he is a visiting professor at the School of Physical Sciences of The Open University.
 Alexander Valavanis received his M.Eng. (Hons) degree in electronic engineering from the University of York, York, UK, in 2004, and his Ph.D. degree in electronic and electrical engineering from the University of Leeds, Leeds, UK, in 2009. From 2004 to 2005, he was an instrumentation engineer with STFC Daresbury Laboratories, Warrington, UK, and from 2009 to 2016 he was a Research Fellow at the University of Leeds. He is currently a University Academic Fellow (tenure track) in Terahertz Instrumentation at the University of Leeds. His research interests include terahertz instrumentation, quantum cascade lasers, silicon photonics, and computational methods for quantum electronics.
 Olivier Auriacombe received his M.Sc. degree in engineering and physics from Grenoble-Inp, PHELMA, Grenoble, France, in 2013, and submitted his Ph.D. thesis in astronomy from the Open University, UK in collaboration with the Rutherford Appleton Laboratory, in 2018. In 2017, he joined the Millimetre-Wave Technology Group at the Rutherford Appleton Laboratory, UK as an RF-engineer. His current research involves Schottky-based THz systems, measurement techniques, THz spectroscopy, and Astrochemistry.
 Daniel Gerber received a degree in physics from the University of Bern, Switzerland in 1998, followed by a Ph.D. degree in ground-based microwave remote sensing of the atmosphere from the same institute in 2003. He now works at the Rutherford Appleton Laboratory in the UK as an expert in millimeter- and submillimeter-wave air- and space-borne limb-sounding techniques. He is a UK delegate to ESA's DOSTAG advisory panel, and PI of the upper atmospheric THz mission concept LOCUS.
 Tom Rawlings received a degree in physics from Durham University in 2013 and is currently working toward a Ph.D. at University College London. He is based at the Rutherford Appleton Laboratory and where he has been working for 5 years designing cryocoolers for space applications. His main research interests are in Stirling and Joule-Thomson cryocooler design and modeling.
 Nick Brewster received a degree in physics (MPhys) from the University of Leicester in 2012. He has been working at RAL since 2013 and leads the Millimetre-wave Group device construction area, specializing in the assembly of miniature structures used in space flight projects such as MetOP-Second Generation microwave payloads.
 Matthew Oldfield received a degree in physics from the University of Kent in 1989. He joined the STFC Rutherford Appleton Laboratory Millimetre-wave Technology Group the same year and is a senior engineer with responsibility for a range of device technology research and development, including THz antennas. He is also responsible for the development of advanced THz remote sounding systems that have been deployed on an aircraft in support of Earth-observation and at ground-based observatories for radio astronomy.
 Yingjun Han received his B.E. degree in automatic control from the Northwestern Polytechnical University, China, in 1998, and his Ph.D. degree from the Institute of Physics, Chinese Academy of Sciences, China, in 2003. In 2003, he joined the Paul Drude Institute, Germany. In 2006, he joined the Shanghai Institute of Microsystem and Information Technology, Chinese Academy of Sciences, China. Since 2012, he has been with the School of Electronic and Electrical Engineering, University of Leeds, as a Post-Doctoral Research Fellow. His research interests include terahertz frequency electronics and photonics, quantum cascade lasers and their applications.
 Lianhe Li received his Ph.D. degree in microelectronics and solid-state electronics from the Institute of Semiconductors, Chinese Academy of Sciences, Beijing, China, in 2001. From 2001 to 2003, he was with the Laboratoire de Photonique et des Nanostructures, Centre National de la Recherche Scientifique (CNRS), France, where he was engaged in molecular beam epitaxy growth and characterization of low-bandgap GaAs-based III–V diluted nitride materials and devices with a particular emphasis on 1300–1550 nm telecom wavelength applications. In July 2003, he joined EPFL, Lausanne, Switzerland, as a Scientific Collaborator, where he was working on InAs quantum dots for lasers and superluminescent LEDs and single quantum dot devices. He is currently with the School of Electronic and Electrical Engineering, University of Leeds, UK.
 Esam Zafar received his B.Sc. degree in electrical and electronic engineering from the Umm Al-Qura University, Saudi Arabia, in 2011, and his M.Sc. degree in electronic and electrical engineering from the University of Leeds, Leeds, UK, in 2016. In 2011, he joined Gulf Medical Company Ltd., Saudi Arabia. In 2012, he joined Siemens Co. – HealthCare, Saudi Arabia. In 2013, he joined the Umm Al-Qura University, Electrical and Electronic Engineering department, Saudi Arabia as a teaching assistant. Since 2017, he has been a Ph.D. student at the University of Leeds, Leeds, UK, in Electrical and Electronic Engineering School.
 Edmund Linfield received his B.A. (Hons.) degree in physics and M.A. degree from the University of Cambridge, Cambridge, UK, in 1986 and 1991, respectively, and his Ph.D. degree in semiconductor physics from the Cavendish Laboratory, University of Cambridge, in 1991. He continued his research as a Post-Doctoral Research Associate with the Cavendish Laboratory, University of Cambridge, UK, until 1997, where he was appointed as an Assistant Director of Research. He also became a Fellow of Gonville and Caius College, Cambridge. In 2004, he moved to the University of Leeds, Leeds, UK, to take up the Chair of Terahertz Electronics. He is currently also Director of Research in the School of Electronic and Electrical Engineering, and was awarded a “Dream Fellowship” from the Engineering and Physical Sciences Research Council (2011). His research interests include semiconductor growth and device fabrication, terahertz-frequency optics and electronics, and nanotechnology.
 Alexander Giles Davies received his B.Sc. (Hons.) degree in Chemical Physics from the University of Bristol, UK, in 1987 and his Ph.D. degree in semiconductor physics from the University of Cambridge, UK, in 1991. In 1991, he joined the University of New South Wales, Sydney, Australia, supported by an Australian Research Council Fellowship, before returning to the Cavendish Laboratory, University of Cambridge in 1995 as a Royal Society University Research Fellow, and subsequently Trevelyan Fellow of Selwyn College, Cambridge. Since 2002 he has been with the School of Electronic and Electrical Engineering, University of Leeds, as Professor of Electronic and Photonic Engineering, and is currently also Pro-Dean for Research and Innovation in the Faculty of Engineering. His research interests include the optical and electronic properties of semiconductor devices, terahertz frequency electronics and photonics, and the exploitation of biological properties for nanostructure engineering.
 Giorgio Savini received his Masters and Ph.D. from Rome University “La Sapienza” in 2001 and 2005, respectively. As a post-doctoral research associate he worked from 2004 to 2008 in Cardiff University on far-infrared optics including filters, lenses, and polarization modulators as well as the calibration and testing of the Planck High Frequency Instrument and software pipeline validation for the FTS spectrometer on the Herschel Space Observatory. He moved to the Physics and Astronomy Department at University College London in 2009 as a lecturer, was promoted to Reader and then to Professor in 2013 and 2018, respectively. Currently he is involved in research in far-infrared optics and instrumentation design and modeling. Since 2015 he is also the Director of the University College London Observatory with a focus on undergraduate Teaching and Science Outreach.
 Michael Emes has a degree in Engineering, Economics and Management from St John's College, Oxford, and a Ph.D. from UCL-MSSL in developing ultra-low temperature cooling systems for spacecrafts. He previously worked as a strategy consultant for Mercer Management Consulting (now Oliver Wyman) on projects in rail, retail, and energy, including advising the Government on the restructuring of the rail industry when Railtrack was taken into administration. Michael is now Director of UCL Centre for Systems Engineering, and conducts teaching and research at UCL in project management, risk management, and decision-making in domains including transport, health, and aerospace. He is Programme Manager and a lead trainer for the European Space Agency's Project Manager Training Course, and Programme Director for UCL MSc programs in Technology Management and Management of Complex Projects. He is Co-chair of the APM Systems Thinking Specific Interest Group.
 Berend Winter received a degree in mathematics at the University of Groningen in 1990 and specialized in numerical mathematics. After working in the industry for 10 years he joined the Mullard Space Science Laboratory (UCL) in 1999. He heads the mechanical and thermal engineering group at MSSL and focuses on conceptual design for space instrumentation as well as R&D within the group. Since 1999 he has been involved in the design of instrumentation for missions including Herschel (structure of Spire and additional thermal design) Eddington FPA design, GAIA RVS concept as well as solar instrument design (Hinode – Extreme ultraviolet Imaging Spectrometer) and studies for X-ray missions like LOFT, XIPE, Strobe-X, and eXTP as well as instrument concepts for CMB missions such as LiteBIRD and Pristene.
 David Walker received a Ph.D. in astronomical instrumentation from University College London (UCL) in 1980. He went on to found and develop the Optical Science Laboratory at UCL, leading UCL's involvement in numerous projects for large overseas telescopes and industry. This stimulated his growing research-interest in advanced technologies for fabricating optical surfaces. With industrialist Richard Freeman he founded Zeeko Ltd. in 2000, to develop and market computer-controlled polishing machines, and he retains his Research Directorship. In 2004 he established the National Facility for Ultra Precision Surfaces at the OpTIC Centre in North Wales, and subsequently led the research-phase of the project to produce prototype mirror segments for the European Extremely Large Telescope. In 2015 he was appointed Professor of Ultra-Precision Surfaces at the University of Huddersfield, based at OpTIC with the focus of his current research on advanced processes and metrology for complex surfaces, and fully-autonomous manufacturing.
 Elena Saenz received her M.Sc. and Ph.D. degrees from the Public University of Navarra (UPNA), Pamplona, Spain, in 2004 and 2008, respectively, both in Telecommunication Engineering. Her doctoral research was focused on the analysis and design of meta-surfaces with emphasis on their application as superstrates for planar antennas. Until 2008 she was with the Antenna Group, Public University of Navarra. Since then, she has been working at the European Space Research and Technology Centre (ESTEC), European Space Agency (ESA), Noordwijk, The Netherlands with main interest in frequency/polarization selective surfaces, (sub)millimeter-wave technologies, antenna measurements, and material characterization. Dr. Saenz received the Loughborough Antennas and Propagation Conference (LAPC) 2006 and 2007 Best Paper Awards and the International Workshop on Antenna Technology (IWAT) 2007 Best Paper Award. In 2008, she received the IEEE Antennas and Propagation Society Graduate Research Award.


 Open access