

This article describes the creation of a new urban classification based on the 1891 census of England and Wales. It is the first attempt to use the recently available electronic version of the census to classify all large towns in late Victorian England and Wales on the basis of their economic structure. The creation of I-CeM, which is an integrated, standardized electronic dataset of the England and Wales censuses for 1851–1911, allows the previous limitations of census data for urban classification to be overcome.Footnote 1 Where previously scholars were restricted by the geographical units and aggregated occupation data provided in the published census reports, I-CeM allows manipulation of the original records in order to aggregate urban units and examine their occupational structures in great detail. While it was previously possible to examine individual parishes’ characteristics by manually extracting and coding data from the Census Enumerator Books (CEBs), this was a time-consuming practice.Footnote 2 I-CeM allows analysis of parishes and aggregated urban units on a scale not realistically feasible previously. This article describes the identification of urban units and a factor analysis of their occupational structure which allows an urban classification to be developed.
Contemporary and historiographical classifications
Nineteenth-century observers were not much concerned with creating an urban hierarchy. While distinctions between individual cities might be noted, such as the oft-remarked upon differences in Birmingham's and Manchester's social structures, there were few contemporary attempts to create a comprehensive typology of towns.Footnote 3 There were plenty of studies of, and commentary on, the state of particular towns, and much debate on the nature of urban life in general, but these tended to operate on the assumption that towns were, in general, all similar in character; as Engels famously commented, ‘What is true of London, is true of Manchester, Birmingham, Leeds, is true of all great towns.’Footnote 4 This belief in the similarity of the urban experience was echoed by Robert Vaughan, an author as convinced of the benefits of urban life as Engels was of the harm that towns caused. In The Age of Great Cities, Vaughan argued that cities were agents of civilization, and their denigration by other authors risked a return to the barbarity of feudalism: ‘if men are to become strong, physically or mentally, it must be by association – by the association of war, or by those of cities. It is, happily, towards strength in the latter form that affairs are now tending through the civilized world.’Footnote 5 However, his analysis proceeded from the basic assumption that all modern cities were alike. Similarly, Price-Williams sought to analyse all towns over 1801–71 focusing on their growth, not their differences.Footnote 6 Distinctions were sometimes made between towns based on population growth and economic underpinnings; for example, Vaughan suggested that easy access to coal determined why Birmingham and Manchester thrived while Canterbury and Taunton ‘remain nearly stationary’. However, these differences were not investigated in a systematic manner and did not influence his wider arguments about the fundamental similarity of urban living.Footnote 7
Even where nineteenth-century authors developed typologies, they were often ignored. For example, the Select Committee on the Health of Towns divided towns into five categories:
1. The metropolis
2. Manufacturing towns
3. Populous seaport towns
4. Great watering places
5. County and other considerable inland towns not being the seats of particular manufactures
However, the report made little use of these categories, arguing that ‘persons of the same class, and engaged in the same sort of occupations in different populous towns, are subject, more or less, to the same evils. . .that their health and comfort are affected by the same causes, and that the remedies suggested by Your Committee would be applicable to improve the condition of all or most of them’.Footnote 8 The same typology was repeated in the census reports for 1851–71, which included some discussion of the different rates of population growth in the various types of towns, but made little analytical use of the classification.Footnote 9 A similar account can be given of later nineteenth-century authors. Commentators such as Booth and Rowntree confined their studies to single cities, confident that their findings would apply to settlements of different size and economic structure.Footnote 10
Much of the literature that analysed towns was concerned with either attacking or defending the urban way of life. Consequently, the debate was not about the particular characteristics of certain towns, or certain types of town, but rather about the generic urban contrasted with the generic rural.Footnote 11 The evidence, whether qualitative or quantitative, provided by a particular town was usually made to stand for all towns, or even for all of society, not least because the population was increasingly urban: as the annual report of the registrar general commented in 1873, ‘Cities. . .in England. . .they comprise a large and increasing proportion of the nation. . .Their diseases serve to measure the fluctuation in the health of the whole community.’Footnote 12 Analysis, therefore, tended to consider either individual towns or all towns; for example, the registrar general considered the mortality statistics of the largest towns, but did not organize them into a hierarchy based on mortality rates or economic characteristics.
Nineteenth-century authors were also restricted by the geographical structure of the available population and economic statistics. The printed census reports did not consistently provide occupation statistics for urban locations. The 1851 census gave occupation statistics for counties, but not for any smaller geographic units or urban areas that overflowed the counties. In 1861 and 1871, the data was given for registration districts and for the ‘principal towns’ in each division. The 1881 and 1891 census printed occupation breakdowns for every urban sanitary district with a population of more than 50,000. In 1901, the population criteria for inclusion dropped from 50,000 to 5,000, before returning to 50,000 in the 1911 census. The continually changing priorities chosen for census publication reflect a lack of concern or agreement about what level of urban size was of importance and how to define urban units. Those units included in the census reports restricted the potential for contemporaries to create urban classifications based on anything other than population.
An early exception to this pattern of discussion was Thomas Abercrombie Welton, who recognized the geographical limitations of existing studies of urban growth in his 1911 work England's Recent Progress:
The common practice of marshalling population statistics under counties. . .is found on close examination to be misleading. The elements of which county populations are composed are often discordant, so that the items included in the total representing the phenomena counteract each other, and the average result is not illuminating. And where important centres, such as Liverpool or Birmingham, send their ramifications into two or more counties, the importance of an appropriate grouping of county areas, if average results of any value are to be attained, is specially evident.Footnote 13
Welton's novel solution was to group census registration districts together to form units which were then allocated to 19 different categories. He amalgamated districts, commenting, ‘many changes in local boundaries are merged, and thus got rid of without the need for estimates by massing districts near large towns between which transfers have taken place’.Footnote 14 For example, Wolverhampton was part of the category ‘Industrial (Wolverhampton, &c.)’ and consisted of the registration districts of Wolverhampton, Dudley and Stourbridge.Footnote 15 This definition is decidedly larger than just the town of Wolverhampton. Welton created 136 such locations allocated to 14 categories based on their economic function. The economic character of each location was defined by the sector employing more than 5,000 people in each area. These occupations were grouped into types, some based on material (‘cotton’, ‘iron’) and some on function (‘commercial’).Footnote 16 The remainder of the country was then divided into 24 ‘masses’ which were allocated to five geographical groupings. Welton's classification is shown in Table 1. This was a departure in that it explicitly used the occupational structure of these locations to categorize them, as opposed to the more impressionistic approach to urban classification seen in earlier commentators, notably the categories used in the census reports discussed above. Welton's classification has formed the basis for later urban classifications. Notably, Richard Lawton used a modified version of it in much of his work on urban population.Footnote 17 However, it is clearly open to a criticism similar to that which Welton himself made of county-level aggregation. The districts that Welton created covered large areas and thus contained many different kinds of location. For example, even the relatively homogeneous area covered by Welton's Wolverhampton district included 17 separate urban districts and further ‘rural parts’. The urban districts included Wolverhampton itself, the 29th largest town in England and Wales in 1901, several smaller but still substantial locations (Dudley, Stourbridge, Tipton and Bilston) and a host of smaller towns. These various locations embraced a range of different economic and administrative functions. The heterogeneity of Welton's urban units originated from reliance on published census data which restricted his ability to produce more geographically specific data.
Welton's urban classification
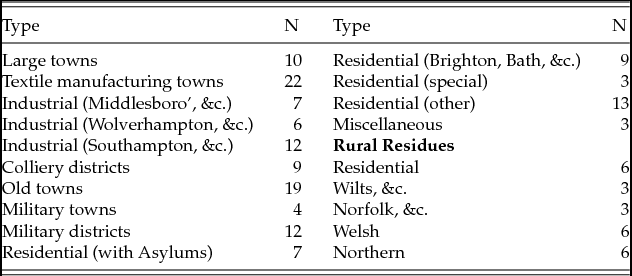
Source: Welton, England's Recent Progress, 6–7.
Similar points can be made about the urban classifications produced by later historians and other scholars. For the most part, historians have used broad classifications based on population combined with a number of characteristics picked out as particularly important. However, such approaches are rarely expanded to an explicit urban hierarchy. Thus, Asa Briggs in Victorian Cities discussed Manchester, Leeds, Birmingham, Middlesbrough, Melbourne and London, with each town representing a particular type of nineteenth-century urban location. Philip Waller followed a similar approach, stressing the variegated nature of Victorian urbanism, and grouping the nation's towns into four categories: London, ‘great cities and manufacturing towns of the conurbations’, ‘new growths’ and ‘country towns’; these broad categories had within them more specific kinds of towns; for example, ‘new growths’ contained resort towns.Footnote 18 In both cases, the authors consider statistical measures, especially of population, but the categorization or choice of epitomic towns are made by qualitative procedures.
In quantitative studies, historians have tended to examine this issue in the context of the question of urbanization. Urbanization is approached as an historical problem: how and why did populations grow and why did some towns increase in size while others did not? This particular interest means that some historians have classified towns according to their population. Such studies’ concerns are less with differentiating function or characteristics and more with measuring growth and looking for its causes in industrialization and changing transport technologies. Thus, Richard Lawton and Colin Pooley discuss the nineteenth- and twentieth-century urban hierarchy in terms of population, with growth determined by the spread of industry and later the construction of railways. They distinguish between types of towns to the extent that they note the emergence of new industrial towns in contrast to older historic cities (Birkenhead compared to Chester, for example), and they highlight the rise of the seaside town as a phenomenon particular to the nineteenth century.Footnote 19 However, no systematic classification is developed except in terms of population.
Lynn Hollen Lees, in her essay in the Cambridge Urban History, divides towns into five categories and examined the change in the percentage of the total population in towns of different sizes.Footnote 20 In this, she follows Lawton and Pooley's tables and the definition of conurbation used by Patrick Geddes. This classification, combined with central-place theory, led her to suggest a process of urban development which followed a regular pattern from ‘town into city, city into metropolis and metropolis into conurbation’ driven by population growth which promoted economic development which promoted further population growth. This rather circular description of the process of urbanization was, as with Lawton and Pooley, primarily explained by external forces of ‘industrialization’.Footnote 21
From this background focused on population, the work of Chris Law and Brian Robson has provided a widely used source for classifying towns and cities. This source has been linked backwards to earlier population estimates by Langton, who has also corrected the Law–Robson data for the early years 1801–41,Footnote 22 and the whole database has been made available through deposit at the UK Data Archive.Footnote 23 Law–Robson constructed population estimates for all towns with populations larger than 2,500 from 1801 to 1911.Footnote 24 They used three criteria to define a town. First, the settlement's population had to be greater than 2,500. Second, the population density had to be greater than one person per acre. Third, they used maps to check the degree of nucleation. The first two criteria were arbitrarily set in order to distinguish between the firmly urban and the rural or semi-rural. Thus, Law commented, ‘the figure of 2,500 was chosen because in practice it was found that this excluded the smaller market towns whose activities were very closely connected with the rural way of life’.Footnote 25 The third was used to mitigate the tendency for the first two criteria to over-estimate urban populations. For example, the degree of nucleation was used to remove locations with high populations and densities but without any strong nucleus around which an urban way of life could develop develop; mining regions often contained this kind of settlement.
There have been a few attempts to classify locations using criteria other than population. Humphrey Southall and David Gilbert compared the occupational structure of towns in 1841 and 1921. They used two measures of economic specialization to distinguish between three kinds of area: first, those where service sector employment was greater than that in manufacturing; those where employment in the old staple industries outstripped employment in light manufacturing; and those where light manufacturing employed more than the staple industries.Footnote 26 Second, there was a measure of the degree of occupational specialization, to differentiate between those towns that relied on one or two sectors and those with broad-based economic structures. The specific values for individual towns for these two measures were weighted by total numbers employed and averages taken to produce county index values. As with Welton's study, discussed above, they were restricted by the geographical units of the published census.
Beyond population and occupation, several other characteristics have been used to distinguish between different towns, albeit these approaches only examine a small group of towns, rather than producing a national classification scheme. Some historians and historical demographers have produced mortality estimates which allow us to rank towns according to how deadly they were. For example, Naomi Williams and Graham Mooney's estimates of infant mortality derived from the Annual Reports of the registrar general place Preston and Leicester at the top of the urban mortality league table in the second half of the nineteenth century.Footnote 27 Other, alternative, measures of health and welfare can be constructed, measuring life expectancy or the impact of particular diseases, and then used to rank towns and cities.Footnote 28 Other metrics used have included landownership and rent levels, the migrant population and religious affiliation and attendance.Footnote 29 Historians’ approaches, therefore, mostly ranked towns often by population but also by mortality and other demographic variables. Where typologies have been created, they have either been based on published census report data (as with Southall and Gilbert) or have not been primarily quantitative in their approach (as with Briggs and Waller).
These various studies are all incomplete in coverage and more generally they lack an overarching framework into which the various aspects of towns can be placed in order to produce a more rounded urban hierarchical classification. In 1973, Asa Briggs discussed the utility of an historical version of Moser and Scott's 1961 classification of (then) contemporary English towns. Briggs noted the difficulties with applying the same kind of analysis to nineteenth- and early twentieth-century statistical data, but stressed the potential importance of such an attempt.Footnote 30 A decade later, Richard Dennis raised this issue again and revealed that he had attempted such a project before realizing that the amount of work required to produce such a scheme was impractical in the course of his survey of English industrial cities.Footnote 31 The recent release of I-CeM, while not removing all obstacles to the production of a nineteenth-century classification like Moser and Scott's, does make such a project possible; the remainder of this article describes the first step in that project: classifying English and Welsh towns on the basis of their occupational structure.
Identifying towns in the census
The data available in I-CeM remains organized by census geographical units; however, it can be organized by units down to the parish, far smaller than the published census data. The first task, therefore, is to identify and code the parishes associated with all relevant urban settlements.
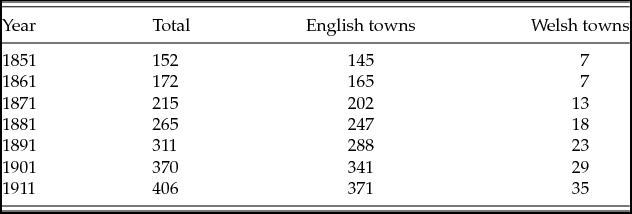
The approach adopted starts with identifying the constituent parishes of towns identified by Law and Robson with populations greater than 10,000.Footnote 32 The choice of this population threshold is not meant to deny the urban nature of many settlements with populations below this threshold; however, there is considerable, and ongoing, debate over the nature of small towns and how they are defined in terms of population, economic complexity and administrative functions.Footnote 33 There are also practical difficulties in applying consistent definitions below this threshold. By taking a relatively high population threshold, our approach identifies locations which were undoubtedly urban in their nature and avoids difficult questions of definition. A population of 10,000 is also a commonly used threshold. Adna Weber used this figure to distinguish between towns and cities.Footnote 34 More recently, Jan de Vries also used the threshold of 10,000 to distinguish cities from towns in his study of European urbanization.Footnote 35 This figure, therefore, provides a useful way to distinguish the definitely urban from the rural, and from those smaller locations which occupy an ambiguous position between town and country. Table 2 details the number of towns above the 10,000 threshold for each census year based on the population figures given by Law and Robson.
Towns over 10,000 in England and Wales, 1851–1911
Source: Urban Population Database, 1801–1911 (2012), UK Data Service, SN 7154, https://doi.org/10.5255/UKDA-SN-7154–1.
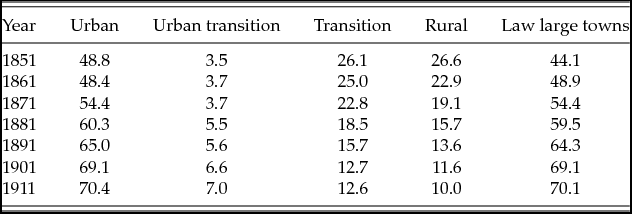
Using Law–Robson towns as a starting point, the parishes close to each urban location were then aggregated to ‘recreate’ the Law–Robson population total for that town. For example, Bedford in 1851 had a Law–Robson population of 11,693, and its built-up area overlapped with nine census parishes. Hence, for this case, the I-CeM source and Law–Robson definitions of spatial units are aligned and all these parishes can be coded as urban and assigned to Bedford. The process was automated using ArcGIS and a shapefile of the mapped footprints (continuous built-up areas) of 1,583 potential towns, then checked and corrected by hand. This process identified the constituent parishes of each large town in each census year. For other parishes that had urban characteristics but did not qualify as large urban areas, a classification based on registration sub-districts (RSDs) was used to define an ‘urban transition’ category that covered non-urban parishes in an RSD containing at least one urban parish. The remaining parishes were coded on the basis of their population densities; those in RSDs with population densities greater than 0.3 people per acre were coded as ‘transition’ and the remainders as ‘rural’. The urban transition and transition parishes cover the hinterlands of the large towns as well as the smaller towns identified by Law–Robson but falling below the 10,000 threshold. This process classified all parishes in each census, and coded all the urban parishes to the relevant town. This provides for the first time an automated means to reconstruct the populations of each individual town.
The use of I-CeM means that towns have to be reconstituted using parishes as the building blocks. However, there were other forms of urban administrative unit in nineteenth- and early twentieth-century England and Wales. When the census reports discussed the urban population, towns had different definitions based on the criteria used; thus in 1851, Cheltenham's population was based on the boundaries of the parliamentary borough, Folkestone's was derived from the population living within the municipal borough, while in Birmingham the municipal and parliamentary borough covered the same area.Footnote 36 After the 1872 Public Health Act, a further potentially urban unit was created, the urban sanitary district and in later censuses some town populations were defined by the boundaries of these districts.Footnote 37 These boundaries changed throughout this period, and some contiguous settlements remained distinct administrative entities, such as Manchester and Salford. This complex local administrative system was partially rationalized in the later nineteenth century through measures such as the 1888 Local Government Act, but remained partly determined by the specificities of local politics and identities.Footnote 38 Law and Robson took account of these changing definitions when creating their urban population estimates; as the I-CeM urban classification used here was created by replicating their population figures as closely as possible, the effects of boundary change have been minimized as far as is possible.Footnote 39 However, the imperfect fit between contemporary definitions, census administrative units and the reality of urban settlement mean that it remains imperfect. Nevertheless, this imperfection is counterbalanced by the ease of use and national coverage given by I-CeM.
Table 3 shows the changing balance of population between urban and rural locations from 1851 to 1911. This table illustrates the rapid urbanization witnessed in the second half of the nineteenth century. Furthermore, it suggests the urban system in England and Wales was increasingly dominated by large towns (those with populations over 10,000). This development was part of the slow decline of small towns from the mid-century onwards.Footnote 40 The final column in Table 3 gives the proportions living in large towns based on Law's figures. For all but 1851, the figures given by this method are very close to those produced by Chris Law and reproduced by other scholars. As our method uses Law–Robson's population figures as a guide for identifying the constituent parishes, this is unsurprising. However, while the method does not alter our understanding of the trajectory of urbanization, it does allow us to investigate the characteristics of these towns, moving beyond population figures to examine the occupational and demographic characteristics of settlements. Such studies were previously impossible on a large scale because of the labour involved in extracting the data from CEBs.
Urban classification populations (%), 1851–1911
Source: I-CeM, 1851–1911; Law, ‘Growth of urban population’, 141.
Classifying towns using factor analysis
The method described in the preceding section allows the populations of towns to be identified and examined at the level of the individuals in each household. The following classification is based on a factor analysis using the occupations of the population in all towns over 10,000 population in 1891. The occupation data used is taken from the Database of Entrepreneurs 1851–1911 created for the ESRC-funded project Drivers of Entrepreneurship and Small Business, which is in turn derived from I-CeM. There were 311 towns with a population greater than 10,000 in 1891. The 1891 census was used for a number of reasons. First, it is the first census in which the word ‘rank’ was omitted from the occupation question, potentially improving the quality of the occupation data because individuals were more likely to return their current employment. Secondly, the parish allocation in the 1891 I-CeM data is better than for other census years, and is correct for all the parishes contained in the urban areas developed here. As urban areas are reconstructed from parishes, it is important that people are accurately coded to parishes.Footnote 41 Thirdly, the 1891 census was the first to include a question about whether people were employers, self-employed (referred to by the census as ‘own account’) or workers. As the classification and analysis was developed to aid the study of business proprietors in nineteenth- and early twentieth-century England and Wales, it was sensible to begin with this census.
The population census returns for individuals in the 1891 census are derived from the original CEBs. Individuals followed a census instruction to give their ‘profession or occupation’ in 1891; if they had more than one occupation, they were asked to list them in the order of their importance. This information provides the basis for the data for the factor analysis. In addition, the information provided for the first time in the 1891 census on the employment status of the population is used. This new question gave the status of an individual, which provides a further check on whether an individual is fully economically occupied.
The census is an imperfect source for occupational information. While full-time paid employment undertaken by men is well recorded in the census, part-time, seasonal or casual labour was under-recorded. This makes aspects of the census unrepresentative of the actuality of employment, especially for women and children. This is likely to affect the classification of rural areas most seriously; however, some urban areas contained trades that involved extensive casual labour, dock labourers in London being the most famous example.Footnote 42 In addition, for men's occupations, a major limitation of the census is that some individuals gave generic descriptors, for example, ‘labourer’ or ‘weaver’, rather than specifying the industry in which they were active. In the analysis carried out below, however, this group has little effect on the overall classification because of its relatively small size in comparison to other areas of the economy.Footnote 43 Studies which have compared the occupational information provided by the census with other sources have concluded that the census is a reliable source for occupation data, thus Crompton found a high degree of consistency between the occupations of rural craftsmen and tradesmen given in CEBs and in local trade directories, as did Bennett in his study of partnerships in the 1880s.Footnote 44 Thus, while not perfect, the census offers the most accurate large-scale data on the occupational structure of communities in nineteenth-century England and Wales.
There has been a long-running debate on whether the census provides a reliable record of women's work in the nineteenth century.Footnote 45 It is clear that the census under-recorded female economic activity, notably in seasonal work (as was also the case with male employment) and where women contributed to economic activity within the household, whether domestic or in a family business.Footnote 46 However, for our purposes, the under-recording of domestic labour is of less importance than it would be for a more general study of female employment because we are looking for the distinctive aspects of female main economic activity in each urban place. Consequently, the issue then is whether there was any geographical or sectoral bias of under-recording. The main distortion is likely to have been in the agricultural sector and, thus, of lesser importance to the classification of towns. There was probably also an under-recording of female participation in home-based retail and production; however, these are areas in which women's occupations were actually often recorded and which were common to all urban locations. Furthermore, for the factor analysis to identify distinctive patterns of female economic activity in a location, it is not necessary that every woman's occupation was recorded correctly, only that the relative picture of female economic activity was accurate. Recent work has suggested that while the census may fail to reproduce accurately the absolute numbers of women involved in every sector, it was sensitive to changes in the local structure of female economic activity.Footnote 47 Moreover, it is important to recognize that the imperfections were far less serious in the original CEBs than in the editing imposed by census administrators when producing the published tables. Hence, the original data available from CEBs used here reduces the deficiencies considerably.
The data used were screened in several ways to ensure that the subsequent analysis used consistent definitions and was not distorted by spurious entries, or occupationally inactive individuals. Thus, those under the age of 15 were removed, as was anyone whose occupation descriptor suggested that they were economically inactive: the retired, ‘pensioners’, those ‘living on own means’, the unemployed and students. Finally, individuals who failed to state their employment status were removed.
The final stage before undertaking the factor analysis was to aggregate the occupations into a manageable number of occupational categories.Footnote 48 I-CeM offers a range of different occupation classifications. However, they are all too disaggregated to be suitable for use in factor analysis since many have zero or very small numbers in 1891. Consequently, the I-CeM occupation codes (after some corrections and cleaning of poorly identified strings) were aggregated to 50 occupation categories. These are based on the materials worked on or the services provided thus manufacturing is broken down into, for example, those working on different kinds of metal, different textiles or producing different kinds of clothing and footwear; retail is broken down into sub-categories including those selling stationery, food and clothing; while other services are divided into groups including those providing refreshment, lodging, business services, personal services and other professions. The individuals working in the 50 categories are all involved with the same products; making and dealing is separated to some extent, but not entirely. Partly, this arises from genuine maker-dealers such as tailors, but it is also an artefact of the census groupings used to create the classification which combined producers and dealers in some industries.Footnote 49 However, as the classification is not primarily a sectoral one, but instead based on the product or service created, this is less of a limitation than it is for classifications which seek to divide the economy into primary, secondary and tertiary activities based on published data.Footnote 50 A smaller but less important limitation relates to individuals who work with one material in a firm engaged in the production of a different product, such as people employed to maintain engines in textile factories. Some of these can be identified and I-CeM has coded them to the appropriate category where possible; but others simply cannot be identified and this source of error must be accepted.
Two factor analyses are presented below: one for all occupied and a second for female occupied.Footnote 51 The same procedures were used for each. Factor analysis has been widely utilized in urban analysis for identifying and classifying social areas and other geographical features.Footnote 52 It seeks to derive a generalized classification category from the similarities between a range of different indicators for each location; in this case, similarities between the spatial locations of occupations. This is based on using the correlation coefficients between each occupation for each area, in this case for each RSD. This reduces the large set of occupations to more limited groups (factors) based on their shared characteristics (shared variance). Common features are identified by the correlation matrix between each occupation. Principal component analysis with varimax rotation is then applied to the correlation matrix.Footnote 53 This ensures that each factor is orthogonal to the others; that is, uncorrelated with all the other factors.Footnote 54 The result is a set of groups that are independent of each other. Each of the original occupations has a loading on each of these factors. A larger factor loading indicates that the occupation makes a larger contribution to explaining the total variance in the data through that factor.Footnote 55 Using these loadings, each factor can be interpreted back to the weight each derives from the relative contribution from the original occupations. Finally, each area (RSD) can be classified by inspecting the loading it has on each factor. This is similar to the approach as applied by Moser and Scott to mid-twentieth-century urban classification.
After the first stage of factor analysis, many towns have high scores on several factors. This means that whilst the different factors are orthogonal to each other, it is quite possible for a given town to have attributes that related strongly to quite different factors; for example, it may have been a commercial centre, but also have a specific industrial concentration such as textiles, as was the case in Manchester. To obtain a more general classification, it is necessary to assess how far any town is primarily loaded on one factor rather than the others, or to combine factors that appear to be systematically overlapping with each other. This was achieved through a two-stage process. First, each town was automatically scored to their highest factor. Secondly, this score was then scrutinized and its attribution to a factor was modified if it was the outcome of the town having a small sample size (this was particularly common when dealing with female entrepreneurs, which were usually the smallest groups examined). The scores were also checked against known patterns of economic specialization derived from secondary literature. This process combines aspects of the standard approaches of exploratory and confirmatory factory analysis; the exploratory approach has been used to inspect the first factor allocations, and the confirmatory approach is used to ensure interpretation meets criteria of interpretability against known patterns.
Any town that did not score highly on any of the factors was allocated to a separate group, termed ‘no strong loading’. These are towns which had no notable concentrations of any of the occupations; they are close to the general average distribution of occupations across all towns. The ‘nationally typical’ is an important category often neglected in factor analysis studies.
For the two analyses discussed below, tables giving the factor variance, factor loadings for the 50 occupation categories and the classification of the towns are included in supplementary material. This supplement provides a resource for other researchers to use directly, without having to resort to analysis of the original data.
The factor analysis of the entire occupied population produced 16 factors; however, the variance was heavily concentrated in factors 1–3. The first three factors explained 31 per cent of the total variance, while all 16 factors explained 72 per cent (see Supplement 1, Table 1). After checking, two factors were reassigned and a special category embedded in the no strong loading group was separated out to identify coal mining areas (factor 15). Details of the factor loadings and the town scores are given in Supplement 1, Tables 2 and 3. Figure 1 shows a map of the final factors.
Urban classification, all employed, 1891
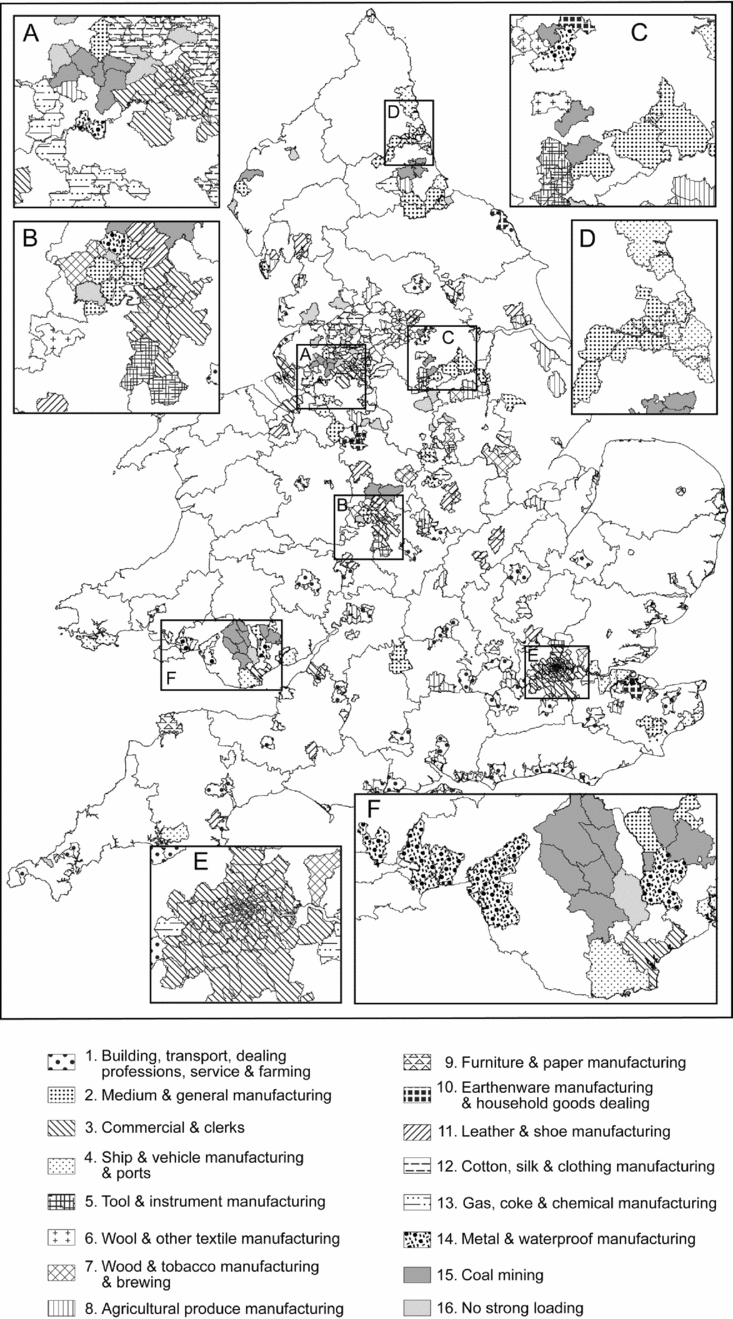
The first factor consisted of 50 towns (termed collectively: building, transport, dealing, professions, service & farming). These towns all have a farming presence but also act as centres for services; those with the highest loadings on this factor are major resorts such as Blackpool, Margate and Weston-Super-Mare. Also included are other resorts that had more diverse urban economies, such as Brighton and Bath, and major county towns that were service centres, including Bedford, Cambridge, Oxford and York. The second factor (termed: medium and heavy manufacturing) classifies 25 towns that were centres of engineering for railways, shipping, machinery and metal goods, such as Darlington, Derby and Middlesbrough. The third factor describes the major commercial centres and includes 17 towns, for example, London, Manchester and Bristol. The fourth factor includes ports and shipping-related industries, including towns such as Portsmouth, Plymouth and Southampton. The later factors pick out geographically concentrated industries. Thus, textile production is covered by two factors: the sixth factor picks up woollen towns, mainly in the West Riding, and the twelfth factor identifies cotton towns in Lancashire. Towns that score highly on the tenth factor (earthenware, glass and household goods) are, as to be expected, mainly found in Staffordshire. The twelfth factor is concentrated in Leicestershire and Northamptonshire and identifies towns that were heavily involved in the shoe and leather trades. Factor 13 (gas, coke and chemical manufacturing) includes all the major salt production centres. Factor 15 are those towns that had diverse occupational structures, but also had a strong presence of coal mining; for example, Aberdare, Ashton-in-Makerfield and Cannock. Finally, the ‘no strong loading’ category for towns judged by their occupations to be ‘typical’ of the national occupational structure are widely spread and include places such as Leek in Staffordshire.
The factor analysis of the entire occupied population generates a detailed, but readily intelligible classification of large towns in 1891. However, it does not address any gender differentiation. To assess this, the factor analysis was repeated solely for the female occupied population. A similar picture is produced, shown in Figure 2 for 17 factors (which explain 67 per cent of the variance: see Supplement 2, Tables 1–3). As with the total employed population, the factor loadings are strongly grouped on the first factor (although this explains only 11 per cent of the variance). Subsequent factors are usually dominated by one or two occupational groups, showing that where the pattern of female occupations differed from the national average, those locations tended to be dominated by one or two unusual occupations which were highly concentrated geographically.
Urban classification, all employed, female only, 1891
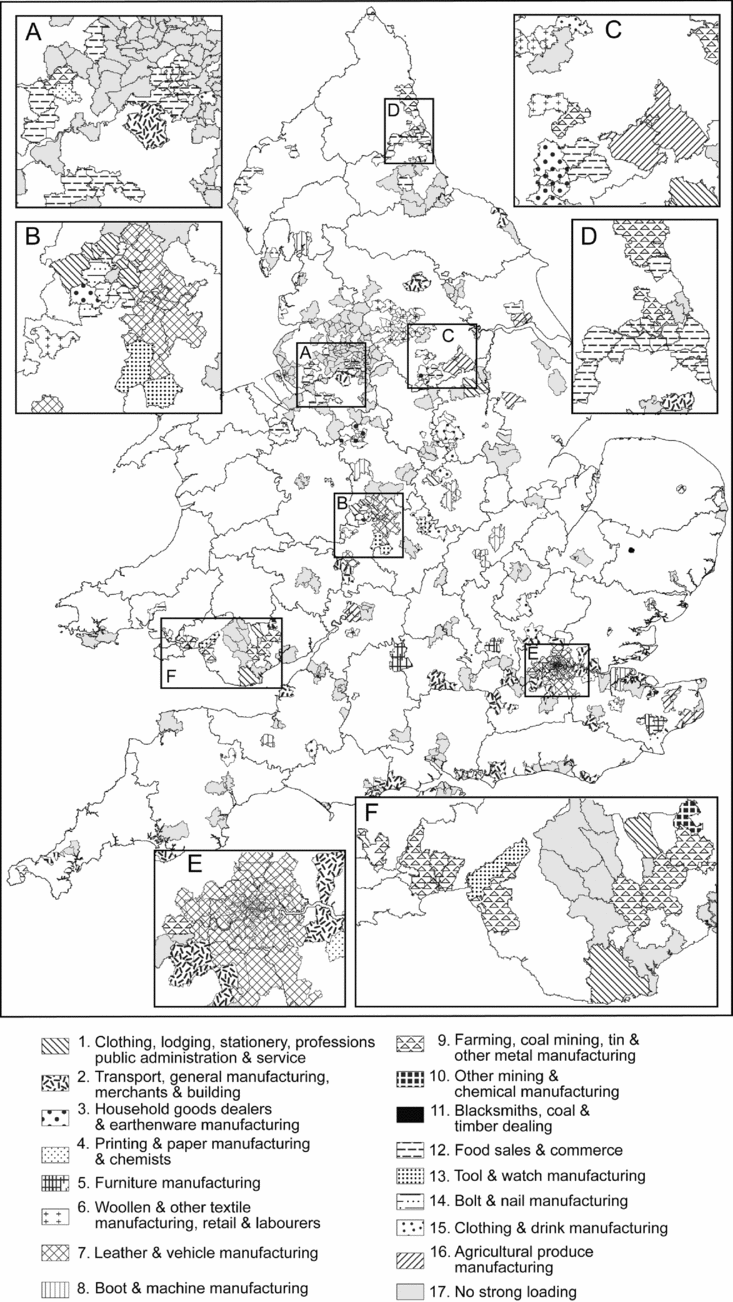
There are more towns included in the ‘no strong loading’ category in the female-only analysis. This suggests that there was less variation in urban female employment from town to town. However, the main factors tend to be geographically clustered, such as factor 1 (clothing, lodging, stationery, processions, public admin and service) in the south-east, factor 10 (farming, coal mining and metal manufacturing) in South Wales and the north-east, or factor 13 (food sales and commerce) in the north of England. These concentrations usefully highlight areas where the occupational structure of the female population differed from that of the general urban population. For example, London is classified to factor 3 (commerce and clerks) for all occupied, reflecting its role as a centre of commerce and administration; however, for women it is classified as factor 7 (leather, fur, bone and hair, and vehicle manufacture) with a second, high loading for factor 8 (furniture manufacture) reflecting the importance of female employment in these fields, reminding us that London was a major manufacturing centre as well as a political and mercantile hub.
Using the classification
The classification developed through factor analysis can be used to study a wide range of issues. Any data that can be arranged by parish can now be associated with a town and categorized by the most appropriate of the two classifications described above. For example, the effect of economic structure on political allegiance, welfare or demographic characteristics can be examined by ordering data on elections, poor law expenditure, fertility or mortality by type of town. This section examines the characteristics of different types of town, defined by the ‘all occupied’ factor analysis, to demonstrate the utility of the classifications outlined above.
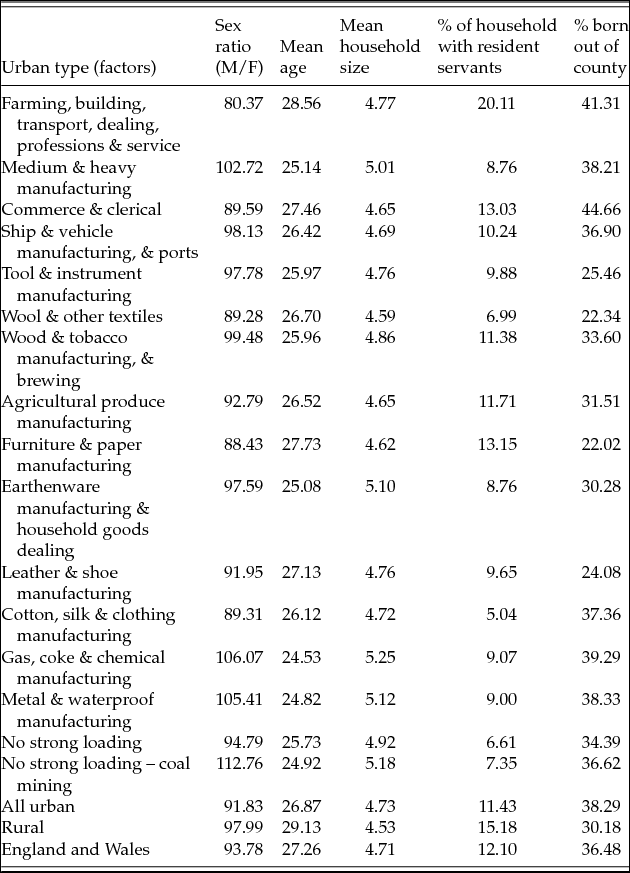
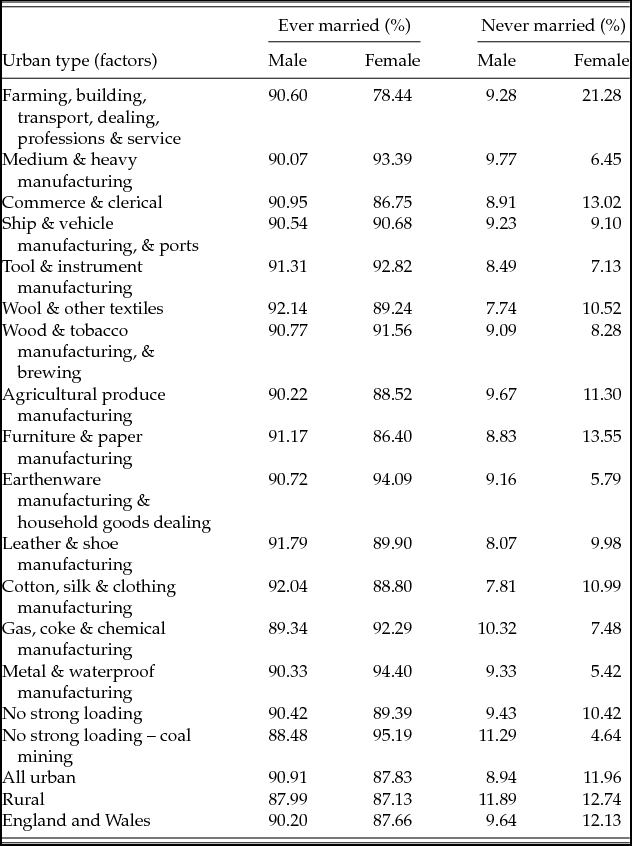
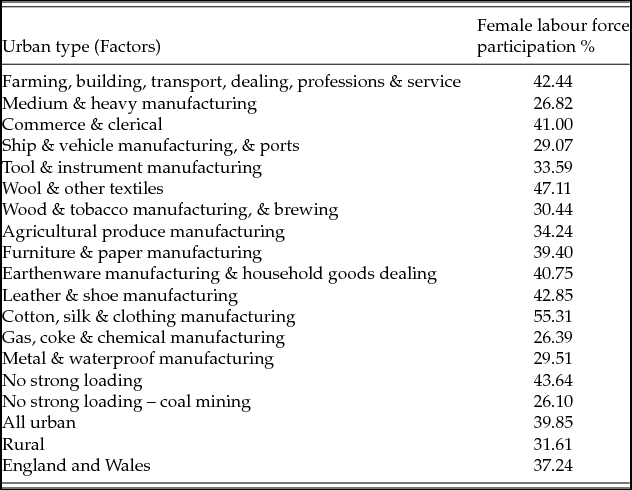
Tables 4–6 detail a series of demographic and socio-economic measures for each of the 16 different types of towns. The data in these tables suggest that while there were significant similarities between different kinds of towns in late nineteenth-century England and Wales, there were notable differences as well. Consequently, simplistic statements about whether Victorian towns were all the same or all different rather miss the point.
Demographic and socio-economic characteristics of different towns, 1891
Notes: Household consists of all family members, servants and any other individuals present on the night of the census, visitors, lodgers, etc.
Source: I-CeM, 1891.
Marital status in different towns, men and women, ages 45–54, 1891
Source: I-CeM, 1891.
Female labour force participation, over 15, 1891
Source: I-CeM, 1891.
There is considerable variation in the sex ratio, both between different types of towns and when compared to the rural and national figures.Footnote 56 The urban groups with sex ratios below the national figure were all towns in which there were greater opportunities for female employment (see Table 6); for example, in service and retailing in factor 1 or in textile manufacture in factors 6 and 12. The highest sex ratios, which are strikingly greater than the national or the rural figures, were in towns characterized by economic activity in which the employment opportunities for women were restricted: medium and heavy manufacturing, metal working, chemical and gas manufacturing and coal mining; all such towns had low female labour force participation. This chimes with previous research which has stressed that women tended not to migrate to areas where female employment was low.Footnote 57
All types of urban locations had lower mean ages than rural areas, and only factor 1 (building, transport, etc.) had an older mean age than England and Wales as a whole. Large towns, it would seem, had younger populations than the country at large. However, there was still significant variation between different types of towns. Factors 2, 10, 13, 14 and 16 all have particularly low mean ages because they had larger proportions of inhabitants aged under 15 than towns in other factors. This reflects a combination of features. First, as Table 5 shows, these towns had lower proportions of never-married women, as well as sex ratios which indicate an excess of men. Furthermore, many of the towns in these factors fall within areas characterized in the late nineteenth century by relatively early ages at marriage.Footnote 58 These factors are likely to lead to higher marital fertility and consequently a younger population. Secondly, some of these factors were characterized by economic activity in which children were still involved: notably, coal mining and earthenware production.Footnote 59
With regards to household size, urban locations all tended to have slightly larger mean households than rural England and Wales. However, the same factors that exhibited high sex ratios and lower mean ages once again look unusual; all had larger mean household sizes, over 5 compared to the national average of 4.71. This fits with the model of higher marital fertility suggested above and starts to suggest that there were two broad categories of towns based on differing nuptiality and fertility regimes.
Factor 1 had by far the highest proportion of households with resident servants. This reflected the basis of the economic activity in these towns within the household; in farming, and resorts where for retailing the household was often the economic unit, with no separate business premises. Such domestic-based economic activity tended to lead to higher rates of servant employment where many servants were also used as labourers, ‘assistants’ and ‘shop hands’, for instance. The other types of towns with higher rates of servant employment were also characterized by high domestic economic activity, also reflecting the use of domestic help as employees of the business.Footnote 60 However, the variation is not simply caused by differences in the economic basis of the different types of towns; it is also a function of social status. It is true that employing servants was not a simple indicator of middle- or upper-class status in Victorian England and Wales.Footnote 61 However, there is a relationship between the employment of male servants and social status, and the factors with higher proportions of households employing male servants were those with higher proportions of households with any residential servants. Thus, the share of households with resident servants was driven by both the economic structure of towns and the relative importance of a resident urban elite.
Unsurprisingly the towns in factor 3, which include London and Manchester, had the highest proportion of residents born outside the county of residence. The second highest figure is for factor 1, reflecting the importance of service and transport to these towns. The two factors with lower proportions born out of county were wool and other textile manufacture, and agricultural produce manufacture. The low proportions of migrants in the woollen towns reflects both the nature of the industry and the fact that Yorkshire is a much larger county than any other in England and Wales and thus people had to travel greater distances to appear as migrants.Footnote 62 The agricultural produce factor only covers three towns, Barnstaple, Frome and High Wycombe, whose populations grew slowly in this period (Frome's actually decreased between 1891 and 1901). Consequently, they were unlikely to have been attractive destinations for potential migrants.
Table 5 suggests that women living in urban areas in 1891 were more likely to be married at some point in their life than those living in rural areas in that year. There is, however, variation within this picture, with some types of towns characterized by much lower proportions never married, notably those factors discussed above: 2, 10, 13, 14 and 16. In contrast, in other types of towns, such as those in the factors characterized by wool or cotton textile production, the chance was only slightly higher than the national average. The differences reflected the economic structure of the towns.Footnote 63 It is noticeable that all the factors where the proportions of men never married were higher than the proportion of women never-married also had higher than average sex ratios, suggesting these places were attracting young men but not young women – something reflected in their generally low rates of female labour force participation. The converse is seen in factor 1, where the proportion of women never-married was particularly high, the sex ratio was low and female labour force participation was high, suggesting that economic opportunities for women in towns characterized by farming, building, transport, the professions and service were such that they could support a large single female population; indeed, that such locations were attractive to female migrants, unlike towns characterized by mining or heavy manufacturing where employment opportunities were thin on the ground.Footnote 64
Conclusion
Lewis Mumford famously argued that Victorian cities were all much the same, an argument which has been much disputed since its publication in the 1960s; the urban classifications discussed in this article provide more evidence that there was considerable variation between towns in England and Wales.Footnote 65 Yet, there were also similarities between different types of towns. These have been identified by factor analysis, but in a controlled way that seeks to direct the choice of factors and grouping of towns into interpretable and meaningful groups. The article has then used this classification to provide a brief comparison of some key indicators, such as demographic characteristics which distinguish two main groups of towns characterized by differing sex ratios and rates of nuptiality. These differences relate to differences in the opportunities for female labour force participation and the employment needs for the differing economic structures of the towns. These conclusions confirm much that has been previously argued about the late nineteenth-century urban society and economy. However, they demonstrate these trends across all 311 large towns based on 9,045,146 individuals’ occupations, confirming on a systematic and comprehensive basis arguments that have previously been made on a case-study basis. This reflects the importance and potential presented by the I-CeM data; it allows scholars to study issues quickly and efficiently at a national level using millions of data points where previously such topics could only be covered by painstaking case-studies based on particular locations often using samples of the CEBs from those locations.Footnote 66 The factor analysis discussed in this article also allows any data which can be organized by census parishes to be compared to the occupational characteristics of the large towns.
This article represents a first step in the creation of a comprehensive urban classification for Victorian and Edwardian England and Wales. To this occupation analysis, it will be necessary to add consideration of the demography, politics, built environment and social characteristics of urban life. However, with the creation of a method by which parish-based data can be organized into urban units, the creation of a ‘nineteenth-century Moser and Scott’ is feasible. The construction of a sophisticated urban classification will greatly enhance our understanding of the urban history and economic change in this key period.
Supplementary material
To view supplementary material for this article, please visit https://doi.org/10.1017/S0963926818000020


 Open access

