

It has been suggested by a substantial number of epidemiological and experimental studies that the origin of several health problems in later life that are associated with the metabolic syndrome, such as obesity, hypertension, heart diseases and type 2 diabetes mellitus, is attributed to insults during fetal and neonatal life( Reference Markakis 1 – Reference Barker 6 ). Although the proliferation of pancreatic islet cells increases just before birth and during the neonatal period, including the lactation period, it has been observed that the amount of DNA in the islet tissue of pups increases( Reference Reusens and Remacle 7 ). During the early developmental period of life, individuals are highly susceptible to adverse environmental conditions, such as a poor-protein diet, which may disrupt pancreatic β-cell function( Reference Holness, Langdown and Sugden 8 ). If maternal undernourishment occurs either during gestation or in early postnatal life, it leads to functional changes in insulin secretion and glucose metabolism( Reference Barbosa, Capito and Kofod 9 – Reference Zambrano, Bautista and Deas 12 ).
It is known that energy/protein restriction during either gestation or gestation and lactation induces a profile of metabolic changes( Reference Zambrano, Bautista and Deas 12 , Reference Fernandez-Twinn, Wayman and Ekizoglou 13 ) that is different from that observed for protein deprivation during lactation alone( Reference Zambrano, Bautista and Deas 12 , Reference de Souza Caldeira Filho and Moura 14 ). The former type of diet restriction generally causes high insulinaemia associated with insulin resistance in adult offspring, whereas the latter leads to low insulinaemia associated with high insulin sensitivity. Plasma insulin levels and insulin sensitivities in rat offspring that are metabolically programmed by an early protein restriction diet depend on the time the rat dams started consuming the diet( Reference Morimoto, Calzada and Sosa 15 ).
The autonomous nervous system (ANS) is an important regulator of metabolic homeostasis( Reference Ahren 16 , Reference Gilon and Henquin 17 ). The involvement of the ANS in the impaired function of pancreatic β-cells has been demonstrated in adult rats that experienced maternal protein malnourishment( Reference de Oliveira, Scomparin and Andreazzi 18 , Reference Gravena, Andreazzi and Mecabo 19 ). It is important to highlight that chronic protein malnourishment induces ANS imbalance, which is associated with pancreatic islet dysfunction( Reference Leon-Quinto, Magnan and Portha 20 ). Our laboratory has reported previously that maternal protein restriction leads to changes in the ANS activity of offspring rats( Reference Gravena, Andreazzi and Mecabo 19 ), in particular, a low parasympathetic tone without noticeable changes in the sympathetic tone( Reference de Oliveira, Scomparin and Andreazzi 18 ).
Increased parasympathetic activity potentiates glucose-stimulated insulin secretion in pancreatic β-cells( Reference Gilon and Henquin 17 , Reference Renuka, Robinson and Paulose 21 ) through acetylcholine (ACh) released by the pancreatic vagus neural ends( Reference Winzell and Ahren 22 ). The binding of ACh to the muscarinic acetylcholine receptors (mAChR) on the β-cell surface leads to an insulinotropic effect; this effect is associated specifically with the binding of ACh to the M3mAChR subtype (M3mAChR) and, to a lesser extent, to the M1mAChR subtype (M1mAChR). Although the insulinotropic effects of the M1 and M3 subtypes are best described, the other mAChR subfamilies (the M2mAChR subtype and, to a lesser extent, the M4mAChR subtype) block ACh insulinotropic action upon ACh binding. These contradictory and direct physiological effects of ACh on insulin secretion are exclusively mediated by mAChR.
ACh signal transduction in β-cells is mediated by G proteins. When ACh binds to the β-cell membrane's M2mAChR or M4mAChR, it attenuates insulin secretion through the inhibitory action of the adenylate cyclase through Gi protein. On the other hand, upon the binding of ACh to M1mAChR or M3mAChR, it amplifies insulin secretion through Gs protein by the activation of phospholipase C, which increases inositol 1,4,5-trisphosphate and diacylglycerol levels( Reference Gilon and Henquin 17 ).
Plasma insulin levels fluctuate because of the presence of several factors that can stimulate, potentiate and/or inhibit pancreatic β-cells at the same time. Beyond the cephalic phase of insulin secretion, it has been shown that during food intake and in the postprandial phase, blood insulin concentration oscillates as β-cell function increases or decreases( Reference Ahren 16 , Reference Gilon and Henquin 17 , Reference Drucker 23 ). It seems reasonable that the cholinergic response in pancreatic β-cells could be a result of the amount and/or activity of different mAChR subfamilies. Recently, it has been demonstrated that the lack of M3mAChR in pancreatic β-cells is responsible for the lean and hypoinsulinaemic phenotype in some mice( Reference Gautam, Duttaroy and Cui 24 ), which is similar to the phenotype observed in early undernourished rats. Thus, the present study was designed to understand the role of pancreatic β-cell mAChR function in the disruption of glucose homeostasis and poor insulin release in early undernourished rats.
Although it is known that maternal malnutrition during lactation leads to the impairment of pancreatic β-cell function and the consequent inability to secrete insulin, it is unclear which molecular mechanisms are involved in the reduced insulin secretion in this experimental model of metabolic programming.
Experimental methods
Dietary manipulation of lactating rats
Female Wistar rats were fed a normal laboratory diet with 23 % (w/w) protein content (Nuvital®) throughout pregnancy. After birth, the rats were distributed into two groups, and each lactating dam (eight litters for each experimental group) was housed with six pups (preferentially male). However, when the required number of male offspring in the litter was not reached, female newborns were used to adjust the litter size to six pups throughout the suckling phase. Because of sex differences in insulin levels and glucose tolerance as has been observed in some studies of early protein-restricted feeding( Reference Lopes Da Costa, Sampaio De Freitas and Sanchez Moura 25 ), after weaning, only male offspring were used in the experiments. In the normal-protein (NP) group, all dams were fed a normal-protein (23 %) diet ad libitum during lactation, whereas the low-protein (LP) group were fed a 4 % (w/w) protein diet with the same amount of energy as the normal diet, as described previously( Reference de Oliveira, Scomparin and Andreazzi 18 , Reference Barbosa, Medina and Balbo 26 ). In the LP group, all dams were fed a low-protein diet ad libitum during the first 14 d of lactation and a normal diet for the third phase of the lactation period. At the age of 21 d, the pups were weaned and thereafter fed a normal diet up to the age of 90 d, the period when the rats were analysed. Throughout the experimental period, the rats were kept under controlled conditions of temperature (22 ± 2°C) and light (07.00–19.00 hours), with ad libitum access to water and food.
The Ethical Committee for the Animal Experiments of the State University of Maringá, which adheres to the Brazilian Federal Law, approved the protocol.
Intravenous glucose tolerance test and the effects of muscarinic antagonists
Under ketamine and xylazine anaesthesia (3 and 0·6 mg/100 g body weight (BW), respectively), a silicone cannula was implanted into the right jugular vein of each rat from both groups and stabilised in the dorsal region of the neck. The cannula was treated previously with heparinised saline (50 IU heparin/ml (0.83 nkat/l) of saline solution (NaCl 0·9 %, w/v)) to avoid the clotting of blood. After a 12 h fast (19.00–07.00 hours) and without anaesthesia, a glucose load (1 g/kg BW) was infused, through the cannula, into the bloodstream of sixteen to eighteen rats in both groups. Blood samples (350–400 μl) were collected immediately before the infusion of the glucose load (0 min) and at 5, 15, 30 and 45 min.
To study the influence of muscarinic receptors on glycaemic changes, 5 min before the infusion of the glucose load, we used a physiological agonist, ACh (27 nmol/l per kg BW), or a non-selective antagonist, atropine (Atr, 20 nmol/l per kg BW), which was intraperitoneally injected into the other batch of rats from each group (n 12–16). To investigate whether the decreased insulin response to glucose as has been observed in this model is related, at least in part, to the increased or decreased function/sensitivity of M2mAChR or M3mAChR, respectively, we studied the effects of a selective M2mAChR antagonist (methoctramine (MTT) 2 μmol/l per kg BW) and a selective M3mAChR antagonist (4-diphenylacetoxy-N-methylpiperidine methiodide (4-DAMP) 0·21 μmol/l per kg BW) in different experimental groups (n 14–16). Blood samples were collected at the times indicated above, and plasma samples obtained were stored at − 20°C for further analyses. Glucose concentration was determined by the glucose oxidase method( Reference Trinder 27 ) using a commercial kit (Gold Analisa®). Insulin levels were determined using a RIA( Reference Scott, Atwater and Rojas 28 ) with a gamma counter (2470 Wizard2 Automatic Gamma Counter, PerkinElmer®). The other reagents used were human insulin as a standard, an anti-rat insulin antibody (Sigma-Aldrich®) and 125I-labelled recombinant human insulin (PerkinElmer®).
The intra- and inter-assay CV were, respectively, 12·2 and 9·8 % for insulin. The detection limit for insulin levels was 1·033 pmol/l.
Isolation of pancreatic islets
Pancreatic islets were isolated using a collagenase technique as described previously( Reference Gravena, Mathias and Ashcroft 29 ) with some adaptations. For this purpose, 90-d-old rats were decapitated, and the abdominal wall was opened. Into the rats' common bile duct, 8 ml of Hank's buffered saline solution (composition in mmol/l: NaCl, 136·9; KCl, 5·4; MgSO4.7H2O, 0·81; Na2HPO4, 0·34; KH2PO4, 0·44; CaCl2.2H2O, 1·26; NaHCO3, 4·16; glucose, 0·06; bovine serum albumin 15; (v/v): 95 % O2+5 % CO2, mixed/10 min, pH 7·4) containing 0·1 % collagenase type XI plus 5 % bovine serum albumin and 0·6 % HEPES (w/v) (Sigma-Aldrich®) were injected. The pancreas, swollen with the collagenase solution, was quickly excised and incubated at 37°C in a glass beaker for 17–18 min for the NP rats or 11–12 min for the LP rats. The suspension was then discarded, and the pancreas was washed with Hank's buffered saline solution in three continuous washings. The islets were collected with the aid of a stereomicroscope. At least three rats from three different litters were used for each experimental procedure in a group.
Stimulation of insulin secretion
To adapt the isolated islets to a baseline glucose concentration (5·6 mmol/l), the islets (four islets per well) were pre-incubated for 60 min in 1 ml of normal Krebs–Ringer solution (composition in mmol/l: NaCl, 115; NaHCO3, 24; KCl, 1·6; MgCl.6H2O, 1; CaCl2.2H2O, 1; bovine serum albumin, 15), pH 7·4, that contained 5·6 mm-glucose. This solution was gassed with 95 % O2 mixed with 5 % CO2 to maintain a pH of 7·4. To study mAChR function, following pre-incubation, the islets were incubated for an additional 60 min in the Krebs–Ringer solution containing 8·3 mm-glucose and/or 8·3 mm-glucose plus 10 μm-ACh in the presence of neostigmine (10 μmol/l) to prevent the action of acetylcholinesterase in the islets. To block the M2mAChR and M3mAChR subtype functions, MTT (1 μmol/l) and 4-DAMP (100 μmol/l), respectively, were used.
All of the drugs described above for studying mAChR function were purchased from Sigma-Aldrich.
Measurement of the fat pad stores
On the completion of all the experimental procedures, the rats (n 30) were killed, and their fat pad stores (retroperitoneal, periepididymal, visceral and inguinal) were removed and weighed.
Western blot analyses
The protein content of M2mAChR and M3mAChR in pancreatic islets isolated from the 90-d-old rats were determined by immunoblotting. In each experimental group, 300 islets were frozen at − 80°C in Hank's buffered saline solution and subjected to posterior sonication (two times, 10 s pulses, using a Sonic Dismembrator Model 100; Fisher Scientific) in 300 μl of lysis buffer (composition in mmol/l: HEPES, 50; MgCl2, 1; EDTA, 10; Triton X, 1 %; v/v) and finally centrifuged at 10 000 rpm for 5 min at 4°C. The supernatant was collected, and 10 μl/ml of protease inhibitor cocktail (Roche®) were added; the total protein content was determined by the BCA™ protein assay kit (Thermo Scientific®) using a microplate reader (Multi-Mode Reader, FlexStation® 3 Benchtop; Molecular Devices). The samples were treated with Laemmli sample buffer (w/v: glycerol, 20 %; β-mercaptoethanol, 10 %; 10 % SDS, 40 %; 0·5 m-Tris, at pH 6·8, 0·5 %; deionised water; bromophenol blue)( Reference Laemmli 30 ) and heated in a boiling water-bath for 3 min.
Total protein extracts (40 μg) from the pancreatic islets were separated by 10 % SDS–PAGE at 90 V/120 min. A standard molecular weight marker was loaded in parallel. Proteins were then transferred from the gel onto a nitrocellulose membrane using the Trans-Blot® Semi-Dry 15-minutes Electrophoretic Transfer Cell (Bio-Rad®) and blocked with 5 % skimmed milk in Tween–Tris-buffered saline (Tris–HCl, 1 mol/l; NaCl, 5 mol/l; Tween-20, 0·05 %, v/v) at room temperature for 90 min with continuous shaking. Next, the membrane was incubated overnight at 4°C with rabbit anti-M2mAChR and anti-M3mAChR polyclonal primary antibodies at a 1:1000 dilution (Sigma-Aldrich®), followed by incubation with a peroxidase-conjugated anti-rabbit antibody at a 1:5000 dilution (Sigma-Aldrich®). The antibodies were diluted in a buffer with a composition of 20 mm-Tris–HCl, 137 mm-NaCl and 0·05 % Tween 20. The procedure was repeated three times using a different pool of 300 islets from two to four rats obtained from two different litters of each experimental group.
The immunoreactive proteins were visualised using an ECL kit (GE Healthcare) and a scanner device (Amersham Storm™ 860 Imaging System; Gene Tool). The bands were quantified by densitometry using the Image J 1.4 Software (Wayne Rasband National Institute of Health).
The expression of β-actin protein determined using an anti-β-actin polyclonal primary antibody (diluted 1:1000 in Tween–Tris-buffered saline; Santa Cruz® Biotechnology) was utilised for normalisation.
Statistical analyses
Data are presented as means with their standard errors, and they were subjected to Student's t test or one-way ANOVA, followed by a Bonferroni t test. P< 0·05 was considered statistically significant. Tests were performed using GraphPad Prism version 5.0 for Windows (GraphPad Software, Inc.).
Results
Metabolic programming profile
As reported previously, the LP rats had a predominantly lean phenotype (lower retroperitoneal ( − 29 %, P< 0·001), periepididymal ( − 26 %, P< 0·001), visceral ( − 26 %, P< 0·001) and inguinal ( − 27 %, P< 0·01) fat pad stores and lower body weight ( − 17 %, P< 0·001) and length ( − 6 %, P< 0·001); all values compared with those of the NP rats). The metabolically programmed LP rats are not only normoglycaemic but also hypoinsulinaemic – 56 % lower plasma insulin levels compared with those in the NP rats (Student's t test: P=0.052 and P< 0·001; Table 1).
Effect of a protein-restricted diet during the first two of the three weeks of the lactation period on the biometric and biochemical parameters of adult rat offspring‡ (Mean values with their standard errors, n 30 rats per group)
NP, normal protein; LP, low protein; BW, body weight.
Mean value was significantly different from that of the NP group: ** P< 0·01, *** P< 0·001 (Student's t test).
† Mean value was not significantly different from that of the NP group (P= 0·052; Student's t test).
‡ Adult rat offspring from eight distinct litters were studied.
Glucose homeostasis during the intravenous glucose tolerance test
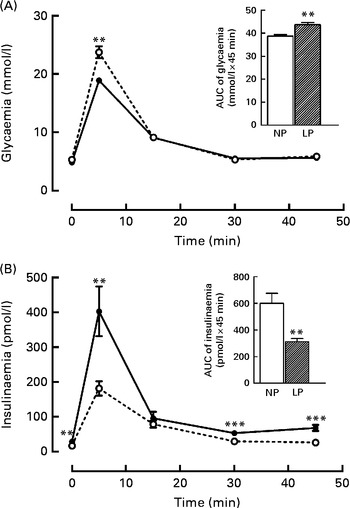
It is known that these programmed rats have high peripheral insulin sensitivity (data not shown), even though the rats exhibited both glucose intolerance (+16·5 %, P< 0·01) during the intravenous glucose tolerance test, as shown in the inset of Fig. 1(A), and low insulinaemia ( − 48·4 %, P< 0·01), as shown in Fig. 1(B).
Changes in the levels of plasma (A) glucose and (B) insulin during the intravenous glucose tolerance test (ivGTT). Values are means (n 16–18 rats per group), with their standard errors represented by vertical bars. (A, B) The inset represents the AUC of glycaemia and/or insulinaemia during the ivGTT, following pre-treatment with saline solution (NaCl, 0·9 %). Mean value was significantly different from that of the NP group: ** P< 0·01, *** P< 0·001 (Student's t test). NP, normal-protein group (![]() ); LP, low-protein group (
); LP, low-protein group (![]() ).
).
Effect of muscarinic antagonists in vivo during the intravenous glucose tolerance test on glucose homeostasis
Fig. 2(A) shows the in vivo results of treatment with an agonist and an antagonist of the muscarinic receptors (P< 0·001). As expected, ACh treatment decreased the percentage of AUC glycaemic increment during the intravenous glucose tolerance test to 16 % in the NP rats, whereas this increment was 37 % higher in the LP rats compared with the respective NP and LP AUC glycaemic values observed without treatment. Treatment with Atr, a non-selective muscarinic antagonist, led to an increase of 26 % in the glycaemic values of the NP rats, whereas Atr had no effect on glycaemia in the LP rats. Pre-treatment with MTT, a selective M2mAChR antagonist, decreased the AUC glycaemic values by 20 % in the NP rats, whereas this decrease was 31 % in the LP rats, compared with that in their respective controls without antagonist treatment. Pre-treatment with 4-DAMP, a selective M3mAChR antagonist, increased glycaemia by 16 % in the NP rats, whereas in the LP rats, there was no change compared with the respective NP and LP glycaemic values observed without 4-DAMP pre-treatment.
In vivo effect of pre-treatment with muscarinic receptor agonist and antagonist on (A) glycaemia and (B) insulinaemia during the intravenous glucose tolerance test (ivGTT). The line from 0 represents the total plasma AUC of (A) glycaemia and (B) insulinaemia throughout the ivGTT (100 %) induced by the glucose load in the normal-protein (NP, ![]() ) or low-protein (LP,
) or low-protein (LP, ![]() ) rats without any drug pre-treatment. Values are mean percentages (n 12–16 rats per group), with standard errors represented by vertical bars. ** Mean value was significantly different from that of the LP group (P< 0·01; ANOVA). †† Mean value was significantly different from that of the NP group (P< 0·01; ANOVA). ‡‡ Mean value was significantly different from that of the NP group for each respective treatment (P< 0·01; ANOVA). Glu, glucose; BW, body weight; ACh, acetylcholine; Atr, atropine; MTT, methoctramine; 4-DAMP, 4-diphenylacetoxy-N-methylpiperidine methiodide.
) rats without any drug pre-treatment. Values are mean percentages (n 12–16 rats per group), with standard errors represented by vertical bars. ** Mean value was significantly different from that of the LP group (P< 0·01; ANOVA). †† Mean value was significantly different from that of the NP group (P< 0·01; ANOVA). ‡‡ Mean value was significantly different from that of the NP group for each respective treatment (P< 0·01; ANOVA). Glu, glucose; BW, body weight; ACh, acetylcholine; Atr, atropine; MTT, methoctramine; 4-DAMP, 4-diphenylacetoxy-N-methylpiperidine methiodide.

While studying the in vivo muscarinic receptor functions, as shown in Fig. 2(B), it was observed that AUC insulinaemia was elevated by 55·5 % in the NP rats by ACh pre-treatment (P< 0·001), whereas there was no change in the LP rats. Insulinaemia was decreased by 30 and 22 % in the NP and LP rats, respectively, when Atr treatment was administered (P< 0·001). Although insulinaemia increased by 31 % in the NP rats by MTT pre-treatment, it was 155 % higher in the LP rats compared with that in their respective controls without MTT pre-treatment (P< 0·001). 4-DAMP pre-treatment decreased AUC insulinaemia by 63 and 40 % in the NP and LP rats, respectively, compared with that in their respective controls without drug pre-treatment (P< 0·001; Fig. 2(B)).
Effect of muscarinic antagonists in vitro on insulin secretion
As shown in Fig. 3(A), the insulin secretion stimulated by 8·3 mm-glucose in the islets of the LP rats was 2·8-fold lower than that in the islets of the NP rats (171·76 (sem 14·46) pmol/l, NP; 61·27 (sem 8·43) pmol/l, LP; one-way ANOVA).
In vitro effect of muscarinic receptor agonist and antagonist on glucose (Glu)-induced insulin secretion. (A) Insulin secretion was stimulated by 8·3 mm-Glu and potentiated by 10 μm-acetylcholine (ACh). Values are means of twelve animals obtained from four different litters, with their standard errors represented by vertical bars. a,b,c,dMean values were significantly different between the normal-protein (NP, ![]() ) and low-protein (LP,
) and low-protein (LP, ![]() ) groups (P< 0·01; one-way ANOVA): a, NP, Glu; b, LP, Glu; c, NP, ACh; d, LP, ACh. (B) Percentage of Glu-induced insulin secretion that is potentiated by 10 μm-ACh with either 1 μm-methoctramine (muscarinic acetylcholine receptor (mAChR) subtypes, M2 (M2mAChR) antagonist) or 100 μm-4-diphenylacetoxy-N-methylpiperidine methiodide (muscarinic acetylcholine receptor (mAChR) subtypes, M3 (M3mAChR) antagonist). The line from 0 represents the Glu-induced insulin secretion that is potentiated by 10 μm-ACh during 60 min of incubation (100 %) without any muscarinic antagonists in the islets of the NP or LP rats. Values are mean percentages, with their standard errors represented by vertical bars. ** Mean value was significantly different from that of the LP group (P< 0·01; one-way ANOVA). †† Mean value was significantly different from that of the NP group (P< 0·01; one-way ANOVA). ‡‡ Mean value was significantly different from that of the NP group for each respective treatment (P< 0·01; one-way ANOVA). 4-DAMP, 4-diphenylacetoxy-N-methylpiperidine methiodide.
) groups (P< 0·01; one-way ANOVA): a, NP, Glu; b, LP, Glu; c, NP, ACh; d, LP, ACh. (B) Percentage of Glu-induced insulin secretion that is potentiated by 10 μm-ACh with either 1 μm-methoctramine (muscarinic acetylcholine receptor (mAChR) subtypes, M2 (M2mAChR) antagonist) or 100 μm-4-diphenylacetoxy-N-methylpiperidine methiodide (muscarinic acetylcholine receptor (mAChR) subtypes, M3 (M3mAChR) antagonist). The line from 0 represents the Glu-induced insulin secretion that is potentiated by 10 μm-ACh during 60 min of incubation (100 %) without any muscarinic antagonists in the islets of the NP or LP rats. Values are mean percentages, with their standard errors represented by vertical bars. ** Mean value was significantly different from that of the LP group (P< 0·01; one-way ANOVA). †† Mean value was significantly different from that of the NP group (P< 0·01; one-way ANOVA). ‡‡ Mean value was significantly different from that of the NP group for each respective treatment (P< 0·01; one-way ANOVA). 4-DAMP, 4-diphenylacetoxy-N-methylpiperidine methiodide.

To assess the in vitro insulinotropic effect of cholinergic agents on the insulin secretion stimulated by glucose, 10 μm-ACh was used, which induced 3·5-fold less insulin secretion in the islets of the LP rats (106·70 (sem 10·50) pmol/l) compared with that in the islets of the NP rats (373·80 (sem 34·59) pmol/l, P< 0·001). The insulinotropic effect of MTT, a selective M2mAChR antagonist, resulted in a strong blockage of M2mAChR activity in both groups. MTT treatment led to 32 and 88 % increases in insulin secretion in the islets of the NP and LP rats, respectively (P< 0·001), as shown in Fig. 3(B). On the other hand, insulin secretion was blocked by 4-DAMP in the islets of both NP and LP rats. However, in the islets of the LP rats, 4-DAMP treatment decreased insulin secretion by 1·5-fold compared with that in the islets of the NP rats. In addition, this inhibition was 41 and 28 % in the islets of the NP and LP rats, respectively, compared with the insulin secretion induced by 8·3 mm-glucose and 10 μm-ACh in the islets of both groups (P< 0·001; Fig. 3(B)).
Protein expression of muscarinic receptors in pancreatic islets
As shown in Fig. 4(A), the protein expression of M2mAChR in the islets of the LP rats was increased by 57 % compared with that in the NP rats; nevertheless, the protein levels of M3mAChR were reduced by 53 % in the islets of the LP rats compared with those in the NP rats (P< 0·01; Fig. 4(B)).
Measurement of (A) M2 and (B) M3 muscarinic receptor protein levels in the pancreatic islets of adult rats. (C) Representative blots of M2 and M3 muscarinic receptor subtypes and β-actin (control load). Values are means of three different experiments, with three to four rats from two different litters in each group, with their standard errors represented by vertical bars. Mean value was significantly different from that of the NP group: ** P< 0·01, *** P< 0·001 (Student's t test). NP, normal-protein group; LP, low-protein group.

Discussion
In the present study, we showed for the first time that the amounts of the major mAChR subtypes, M3 and M2, were altered in the pancreatic islets of rats that were programmed with a maternal low-protein diet. Although it is known that M3mAChR is the major functional receptor subtype that is expressed and responsible for the cholinergic insulinotropic effect in pancreatic islets/β-cells( Reference Ahren 16 , Reference Gilon and Henquin 17 , Reference Iismaa, Kerr and Wilson 31 ), the ratio of M2:M3 has not been reported previously. Upon activation, the even-numbered mAChR subtypes (M2 and M4) in pancreatic β-cells block the insulinotropic effect of ACh. Similarly, the odd-numbered mAChR subtypes (M1 and M3) in pancreatic β-cells block the action of ACh( Reference Gilon and Henquin 17 ). We found a 1·3-fold higher protein expression of M2mAChR than of M3mAChR in pancreatic islets isolated from the normal rats; this ratio was 4·6-fold higher in the islets of the LP rats, suggesting a possible cause for the drastic dysfunction in the ACh-potentiated insulin secretion observed in the islets of the low-protein-diet-programmed rats.
In the present study, we report that the low-protein-diet-programmed rats have a characteristic lean phenotype and exhibit a disturbed glucose homeostasis associated with a low insulin release. An important question with serious pathophysiological implications is whether the low cholinergic response in the islets of LP animals is a protective effect against the increased peripheral insulin sensitivity in this experimental model( Reference de Oliveira, Scomparin and Andreazzi 18 , Reference Ozanne, Wang and Coleman 32 – Reference Latorraca, Reis and Carneiro 34 ).
The phenotype of high insulin sensitivity is important for the development of obesity and type 2 diabetes later in life. Once changes in peripheral tissues, such as the up-regulation of the expression of insulin receptors in the skeletal muscle( Reference Ozanne, Wang and Coleman 32 ) and the high expression of GLUT-4 in the white adipose tissue( Reference Garcia-Souza, Da Silva and Felix 33 ), have occurred in rats that are protein restricted during lactation, they adapt well to store energy reserves from an energy-rich diet and survive periods of food scarcity. The result of this adaptation is obesity because of the lipogenic effect of insulin when food is abundant( Reference Dong and Tang 35 ). Another consequence of this adaptation is β-cell exhaustion( Reference Rodriguez-Trejo, Ortiz-Lopez and Zambrano 36 ), which occurs when there is a high insulin demand because of the peripheral insulin resistance associated with obesity.
Unfortunately, the mechanism by which β-cells of the LP islets secrete less insulin when stimulated by glucose is not yet determined. However, it has been suggested that the persistent activation of M3mAChR in β-cells could be a mechanism that explains the increased glucose-induced insulin release in obese animals( Reference Gautam, Han and Hamdan 37 ). Transgenic mice that express the Q490L mutant of M3mAChR in β-cells are resistant to the impairment of glucose homeostasis when fed a high-fat diet. The islets isolated from these mutant mice, when stimulated by glucose, secrete more insulin than those isolated from wild-type littermates. This effect is cholinergic ligand independent( Reference Gautam, Ruiz de Azua and Li 38 ), indicating that the high glucose insulinotropic effect is associated with a high activity of M3mAChR. It has been shown that the overexpression of M3mAChR in β-cells causes increased plasma insulin levels in the fasting and fed states of mutant mice( Reference Gautam, Han and Hamdan 37 ). Thus, it is reasonable to speculate that the low protein expression and/or low function of M3mAChR in pancreatic β-cells could lead to a low glucose insulinotropic effect. In the present study, adult rats that were protein restricted during lactation displayed both fasting- and fed-state hypoinsulinaemia, and islets isolated from them exhibited a weak glucose insulinotropic response, which was associated with the low protein expression and low ligand pharmacological activity of M3mAChR in the isolated islets.
These data might support the hypothesis that a low glucose response in pancreatic β-cells is a consequence of a low activation of their M3mAChR. Whole-body M3mAChR knockout mice display low body masses and plasma insulin levels( Reference Yamada, Miyakawa and Duttaroy 39 ), a phenotype similar to that of the adult rats that were programmed with an early low-protein diet in the present study. It is remarkable that the islets of mutant mice, either whole body or only β-cell M3mAChR knockout, exhibit low glucose-induced insulin secretion( Reference Gautam, Han and Hamdan 37 , Reference Gautam, Gavrilova and Jeon 40 ); this is also similar to the islet dysfunction in LP animals, as has been observed in the present study.
Beyond the role of the low protein expression and function of the odd-numbered receptors, such as M3mAChR dysfunction in β-cells of the LP rats, there could be other contributing factors. For example, we did not study the insulinotropic effect of M1mAChR. In addition, although we did not study the insulinostatic effect of M4mAChR, we cannot ignore the role of even-numbered mAChR with increased function and protein expression, which could explain the low glucose-induced insulin secretion. In the islets of LP animals, the high protein expression and pharmacological activity of M2mAChR indicate that the cholinergic insulinotropic effect is attenuated by the action of a M2mAChR ligand. The β-cell mAChR results suggest that early protein restriction increases the ratio of M2:M3, resulting in adult offspring with glucose homeostasis disruption and β-cell dysfunction. The β-cells not only exhibit a reduced cholinergic insulinotropic response but also present a low glucose insulinotropic response. In fact, the low-protein-diet-programmed rats also displayed an unbalanced ANS function( Reference de Oliveira, Scomparin and Andreazzi 18 , Reference Gravena, Andreazzi and Mecabo 19 ), which could be responsible for the changes observed in β-cell mAChR in the present study.
As has been demonstrated previously, the offspring that were programmed by maternal protein malnourishment adapted to poor food supply( Reference Barker 6 , Reference Wells 41 ). Similar to humans who had experienced famine early in life( Reference Huang, Lee and Lu 42 , Reference Ravelli, van Der Meulen and Osmond 43 ), the experimental model programmed by diet restriction during a critical developmental period( Reference Erhuma, Bellinger and Langley-Evans 44 – Reference Vickers, Gluckman and Coveny 46 ) had a high risk of developing metabolic diseases, such as obesity and type 2 diabetes. The metabolic impairment is evident after weaning, when a high-energy diet results in imbalances in fat metabolism. In particular, the low-protein-diet-programmed rats in the present study seemed to be unable to develop obesity in adulthood when fed a protein-restricted diet; the mechanism responsible for this observation is unclear. It might be due to the specific time of metabolic programming (i.e. metabolic programming by a maternal protein-restricted diet only during the first two of the three weeks of the lactation period). In addition, if a high-fat diet is given after weaning to these programmed rats, larger fat stores are observed (JC de Oliveira, LF Barella, RA Miranda and PCF Mathias, unpublished results). It is remarkable that the adult offspring of dams that were subjected to a protein-restricted diet during lactation have a high longevity even when fed an obesogenic diet( Reference Ozanne and Hales 47 ).
Apart from cholinergic stimulation, it is known that several other physiological signalling pathways are involved in the insulin secretion process in pancreatic islets. Either directly or indirectly, many other stimuli to β-cells are associated with the cholinergic signal, such as incretins( Reference Drucker 23 , Reference Ruiz de Azua, Gautam and Guettier 48 ). It is important to keep in mind that many signalling pathways that increase or decrease glucose-induced insulin secretion exert their actions at the same time. Our laboratory has shown that adult rats that are protein malnourished during lactation exhibit an impaired ANS function with low vagal activity( Reference de Oliveira, Scomparin and Andreazzi 18 , Reference Gravena, Andreazzi and Mecabo 19 ), which can be the cause for changes in the mAChR subfamily composition. However, we cannot disregard the possibility that an imbalanced ANS is just an expression of the metabolic impairment observed in these programmed rats. Whether it is the cause or the effect, the ANS might play an important role in β-cell dysfunction caused by early protein restriction.
It is important to highlight that maternal milk production is reduced throughout lactation when lactating rat dams are fed a low-protein (8 or 10 %) diet, in which a low milk protein concentration( Reference Passos, Ramos and Moura 49 ) opposed to high milk leptin concentration as well as pups' serum leptin concentrations can be observed( Reference Bautista, Boeck and Larrea 50 ). During the suckling phase, leptin acts as a developmental promoter signal, mostly modulating hypothalamus neuronal cells and neurotransmitter connections( Reference Bouret and Simerly 51 ). Taken together, changes in leptin and amino acid content in rat dams' milk are indicative of organ and tissue developmental disturbances in offspring. As has been reported previously, the concentration of the transcription factor (pancreatic and duodenal homeobox 1) indispensable to pancreas as well as β-cell genesis, proliferation and maintenance is reduced by maternal protein restriction during gestation and lactation( Reference Arantes, Teixeira and Reis 52 ). In agreement with this evidence, out data suggest that a weak milk composition of LP lactating dams could greatly modulate their pancreatic islet mAChR composition, inducing the islets to secrete low levels of insulin leading to the lean phenotype. However, the question as to which is the exact mechanism behind this process remains unsolved yet.
Maternal nutrition and low birth weight are recognised as crucial for the induction of late metabolic alterations, which have potential clinical importance and highlight the necessity for public policies to improve maternal and infant nutritional conditions, especially during pregnancy and/or lactation. It should be, nowadays, one of the major calls in developing countries globally. Currently, considering the high prevalence of metabolic diseases, such as type 2 diabetes, it is important to explore new therapeutics that target β-cell mAChR composition to treat or prevent metabolic diseases.
Acknowledgements
The present study was supported by the Brazilian Federal Foundation, Conselho Nacional de Desenvolvimento Científico e Tecnológico (CNPq) and Coordenação de Aperfeiçoamento de Pessoal de Nível Superior (CAPES), and the Parana Science Foundation (Fundação Araucária). The funders (CNPq, CAPES and Fundação Araucária) had no role in the design, analysis or writing of the manuscript. The contributions of the authors are as follows: P. C. F. M. and J. C. d. O. designed the study and revised the manuscript; J. C. d. O., R. A. M., L. F. B., A. R. A., T. A. S. R., C. C. S. F., A. M. and L. P. T. conducted the research; R. T., C. G. and J. C. d. O. analysed the data; J. C. d. O. and P. C. F. M. wrote the manuscript; P. C. F. M. acted as the principal investigator, provided support and reviewed the data and manuscript.
The authors declare that there is no conflict of interest associated with this manuscript.


