


Gun violence in the United States has a devastating impact (e.g., Barney and Schaffner Reference Barney and Schaffner2019; Hartman and Newman Reference Hartman and Newman2019; Marsh Reference Marsh2022; Rogowski and Tucker Reference Rogowski and Tucker2019; Rossin-Slater et al. Reference Rossin-Slater, Schnell, Schwandt, Trejo and Uniat2020). Yet, despite repeated tragedies and public support for policies to reduce gun violence, policy response has been tepid (Goss Reference Goss2010; Luca, Malhotra, and Poliquin Reference Luca, Malhotra and Poliquin2020). This presents an unsolved puzzle. Why do salient mass shootings and a supportive public fail to instigate policy change? To solve this puzzle, scholars have examined whether mass shootings change electoral incentives and whether a lack of policy changes occurs in spite of or (perhaps) because of a lack of electoral pressure. In estimating the effects of these tragic shootings on elections, scholars have relied on panel data and difference-in-differences designs that exploit variation in shootings’ timing and location. Yet, despite using the same data sources, previous work reaches starkly different conclusions, with some finding mass shootings have strong electoral effects (García-Montoya, Arjona, and Lacombe Reference García-Montoya, Arjona and Lacombe2022; Yousaf Reference Yousaf2021) and others finding null effects (Hassell, Holbein, and Baldwin Reference Hassell, Holbein and Baldwin2020).
We show these conflicting findings come from the failure of some work to account for potential violations of the (essential) parallel trends assumption. Previous work documenting large effects of gun violence on electoral outcomes concludes so erroneously because shootings are more likely to happen in areas trending Democratic before shootings happened, whereas areas where shootings have not occurred were trending Republican.Footnote 1 (Note: if all the reader wants is a clear explanation of why research that does not account for parallel trends violations diverges in its conclusions from research that does account for trends, see Figures 2 [showing different trends for counties with and without shootings] and 4 [showing counties with shootings trending Democratic even before shootings]).
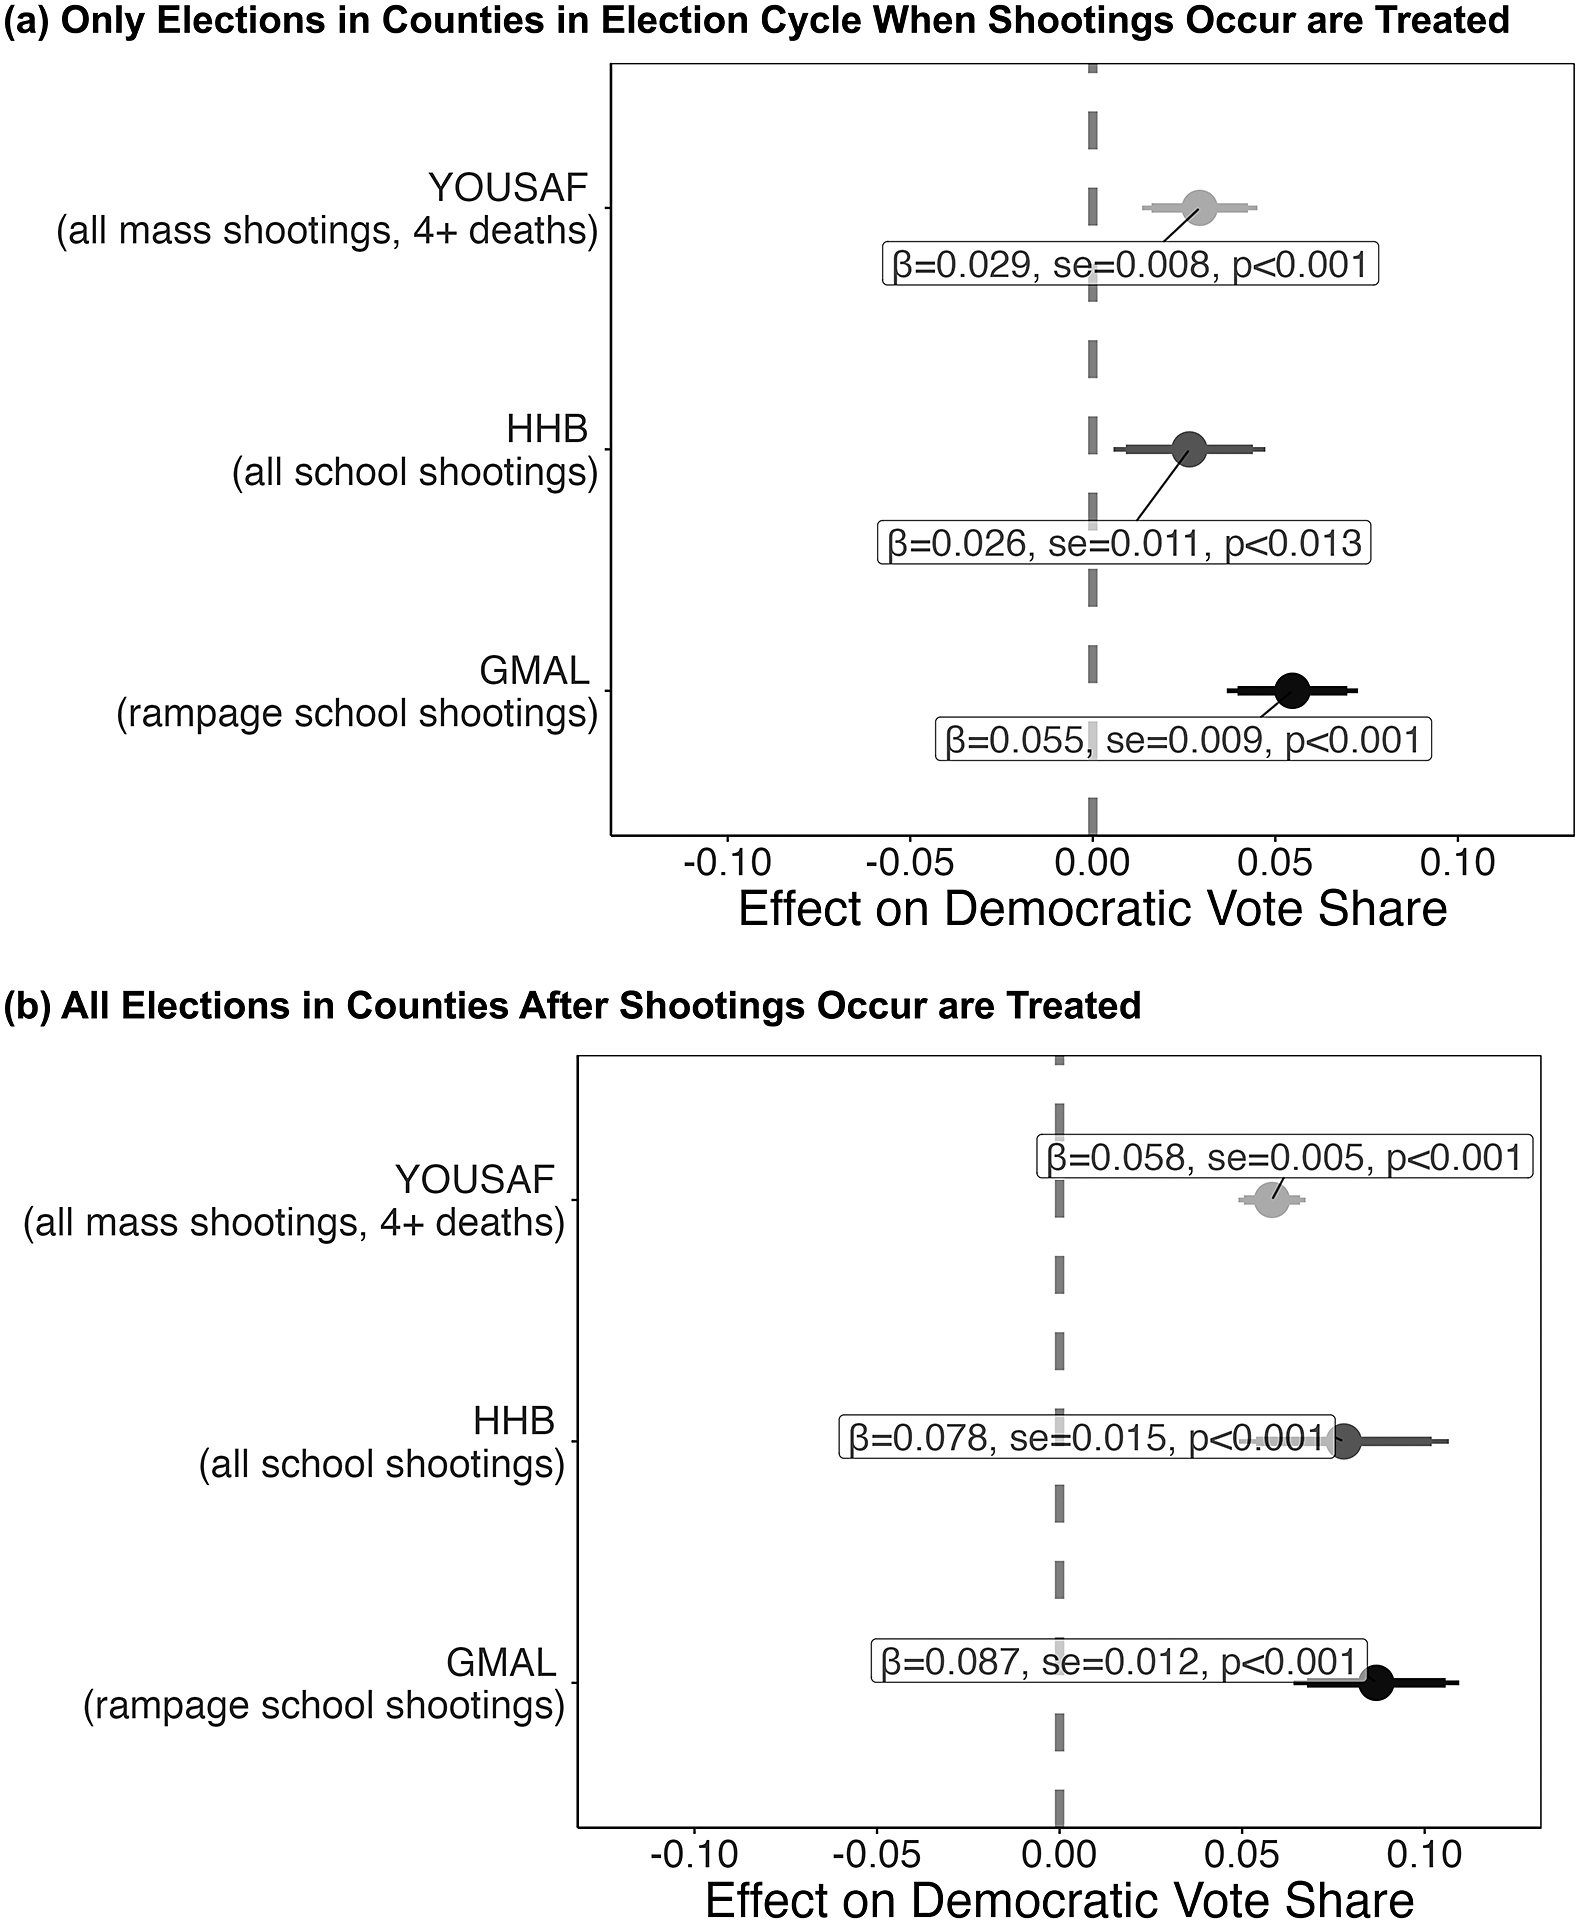
Differences in Previous Studies’ Estimated Effect of Mass Shootings on Election Outcomes Are Not Driven by Data Choices
Note: Estimates include county and year fixed effects (i.e., the TWFE estimator) with standard errors clustered at the county level and no covariates. The top panel shows effect estimates coding only the election immediately after a shooting occurs as having been treated; the bottom panel considers all post-shooting elections in counties with a shooting as treated. Coefficients, standard errors, and p-values are labeled for each coefficient. Takeaway: Naive TWFE estimators suggest mass shootings—regardless of the data/coding used—increase Democratic vote share in the county where shootings happens by 2.6–8.7 percentage points.
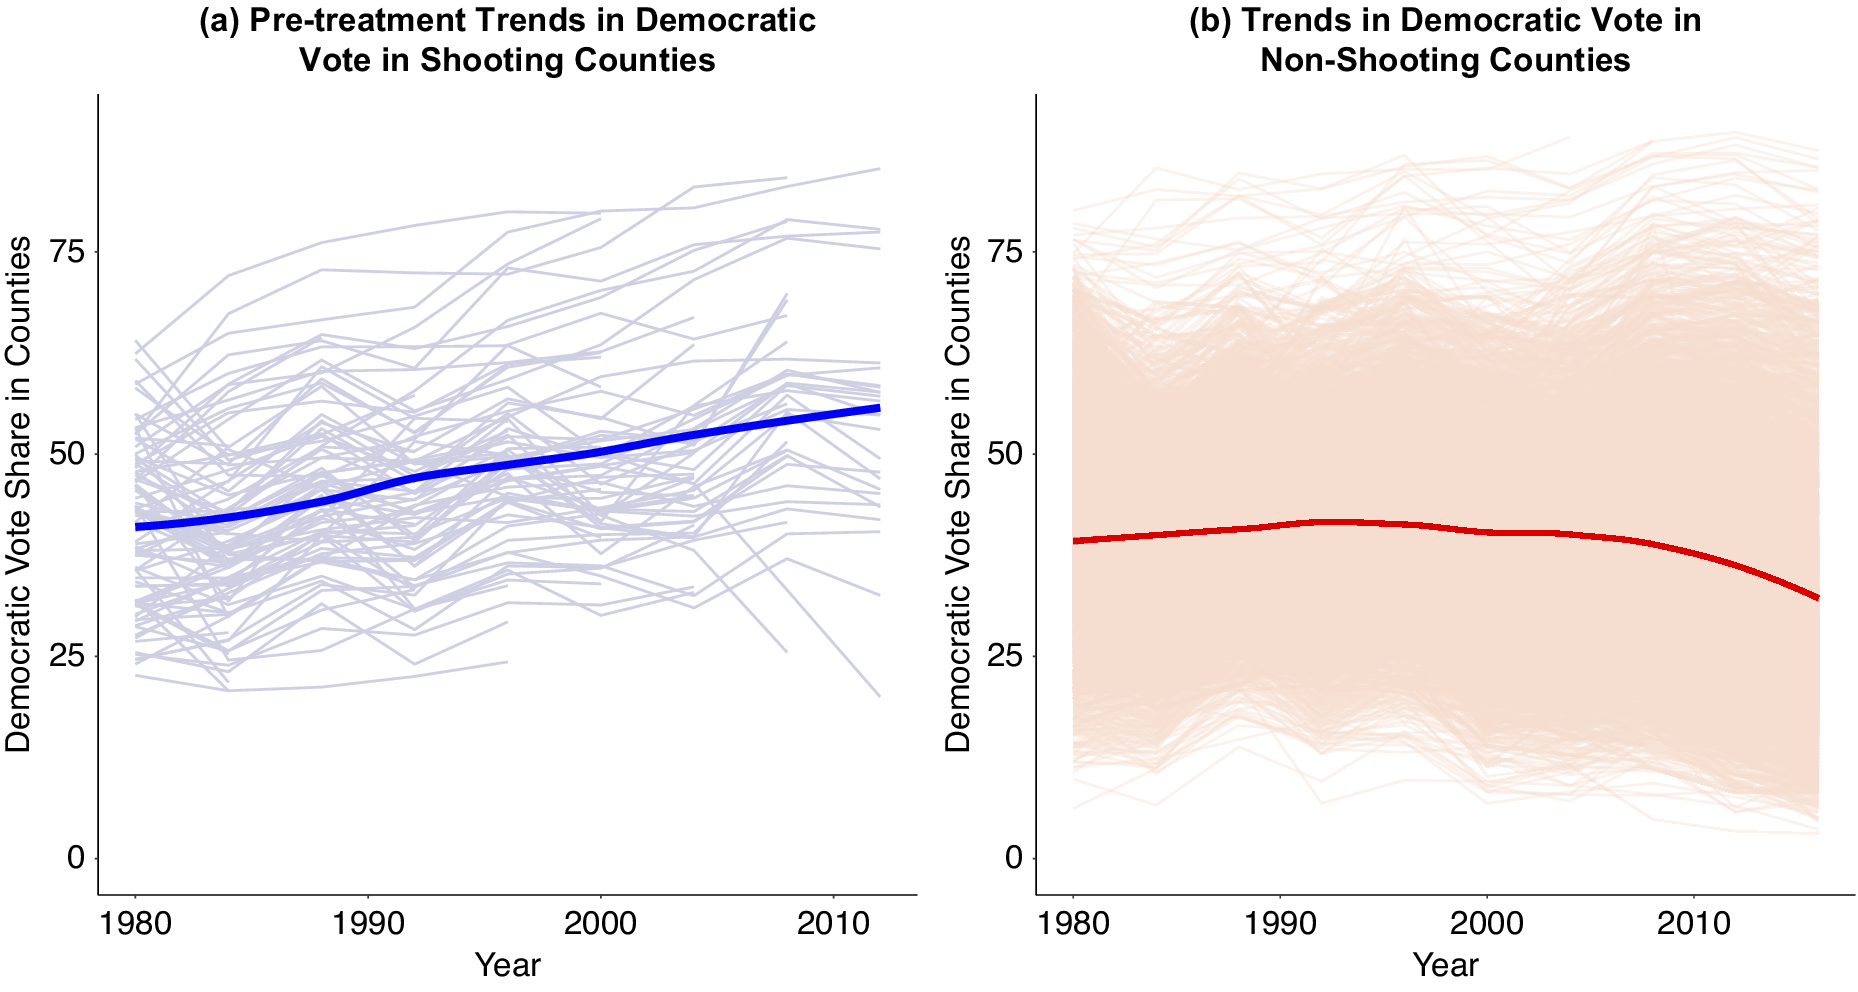
Trends in Presidential Vote in Counties with Mass Shootings Prior to Shootings, Compared to Trends in Counties without Shootings
Note: Pretreatment trends of Democratic vote share in counties where a shooting occurred (left panel) benchmarked to the trends in Democratic vote share found in counties where a shooting did not occur (right panel). Lighter lines show the patterns of individual counties; darker lines show the overall pattern for all counties. Takeaway: Counties that have shootings trended more Democratic even before the shootings occurred, whereas counties without a shooting trended slightly more Republican. Models that do not account for differential trends across counties will be biased.
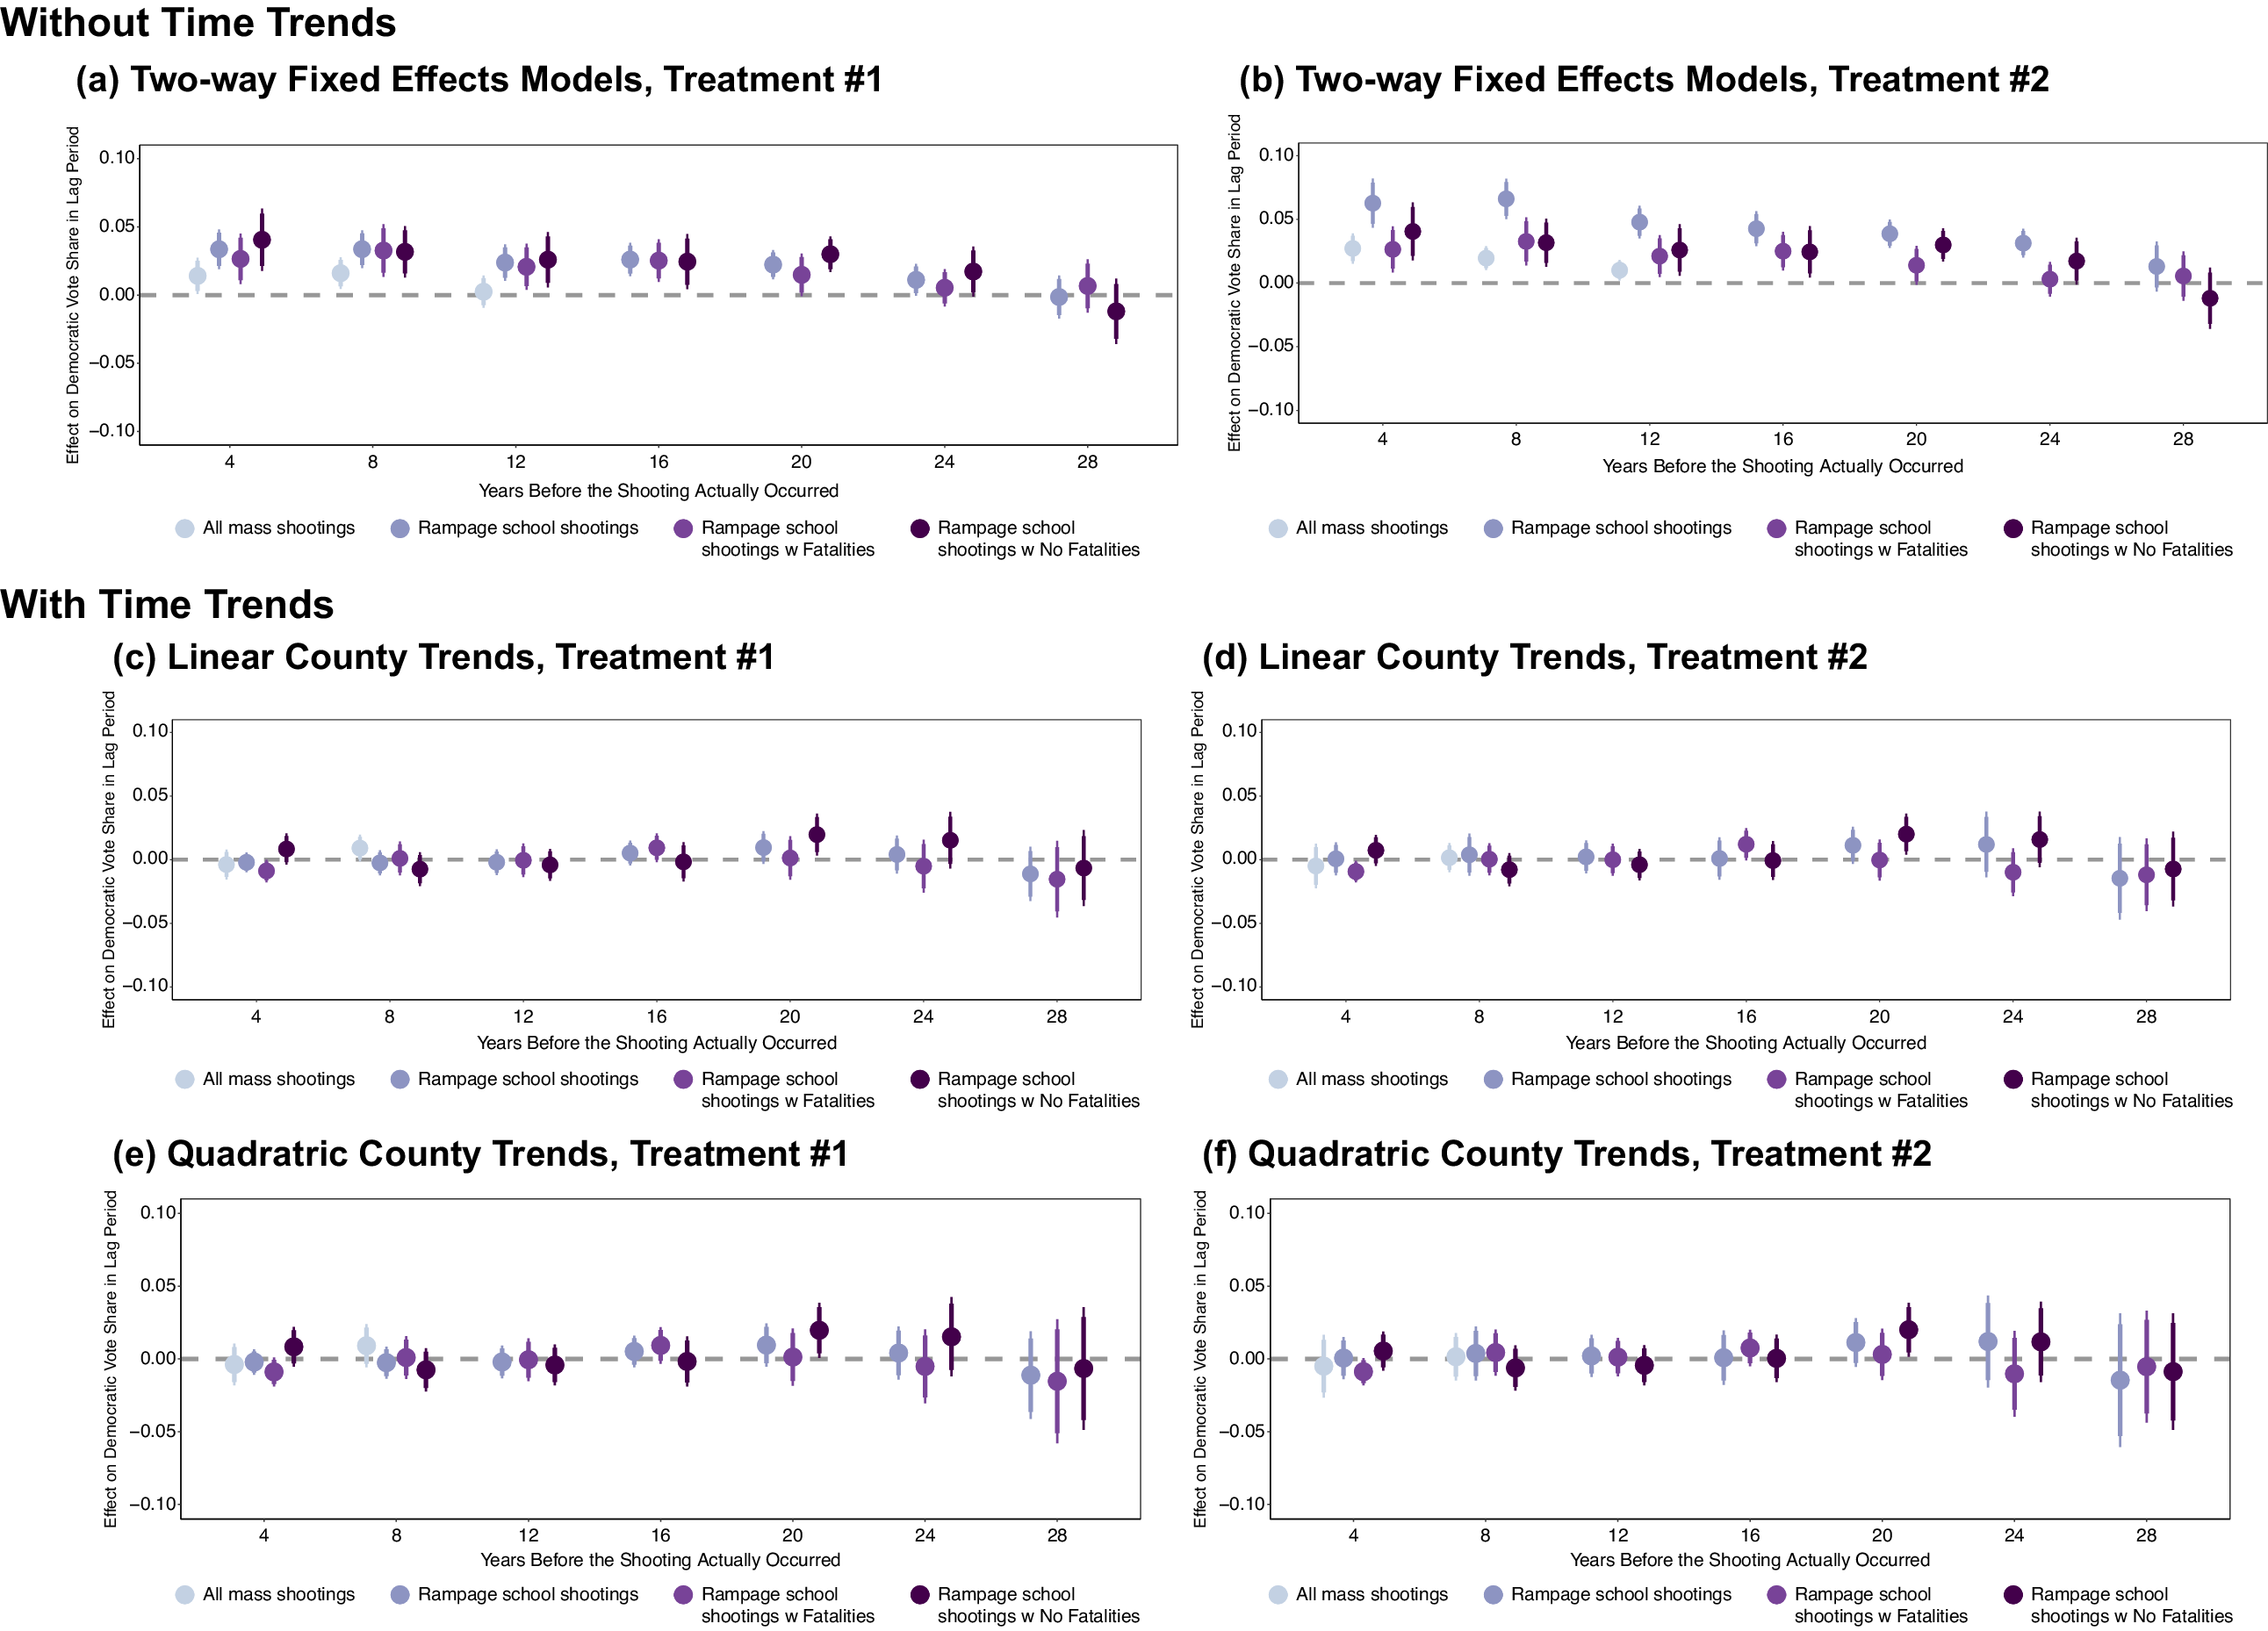
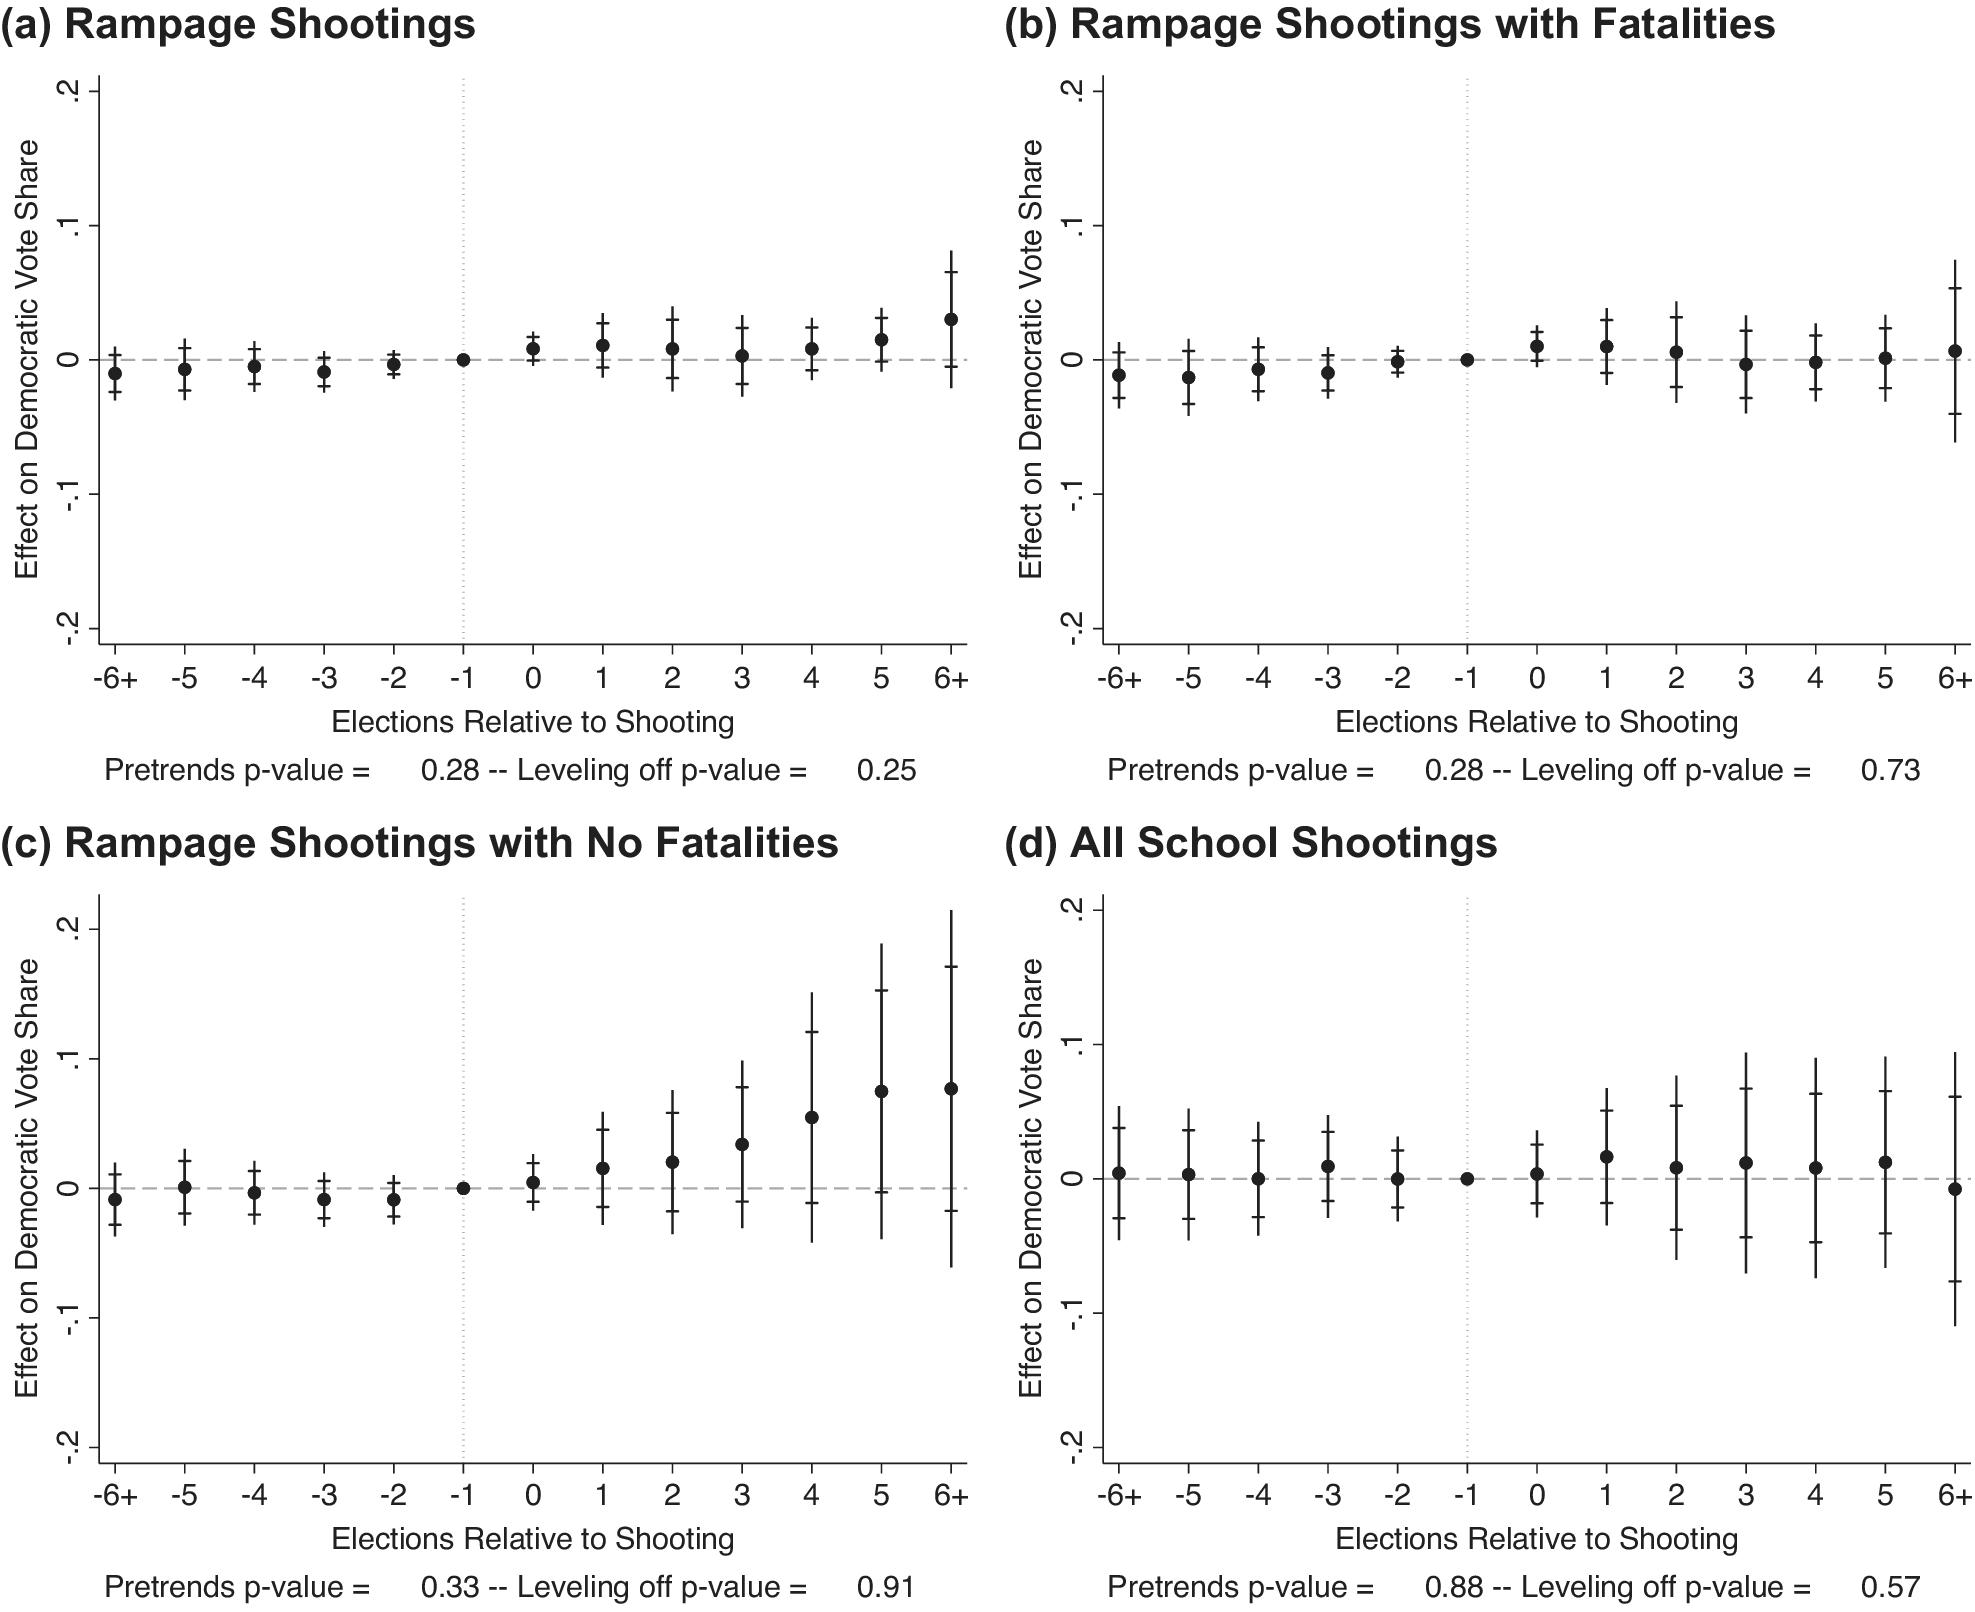
The Effect of Shootings on Election Outcomes Many Years Before
Note: Effect of mass shootings on Democratic vote share in the years prior to when a shooting occurred. Treatment #1 is coded such that only elections with shooting are coded as treated; Treatment #2 is coded such that all elections after a shooting occurs in a county are coded as treated. All models’ standard errors are clustered at the county level. Takeaway: TWFE estimators without time-trends indicate shootings may have an effect up to and including 20 years prior to when a shooting occurred.
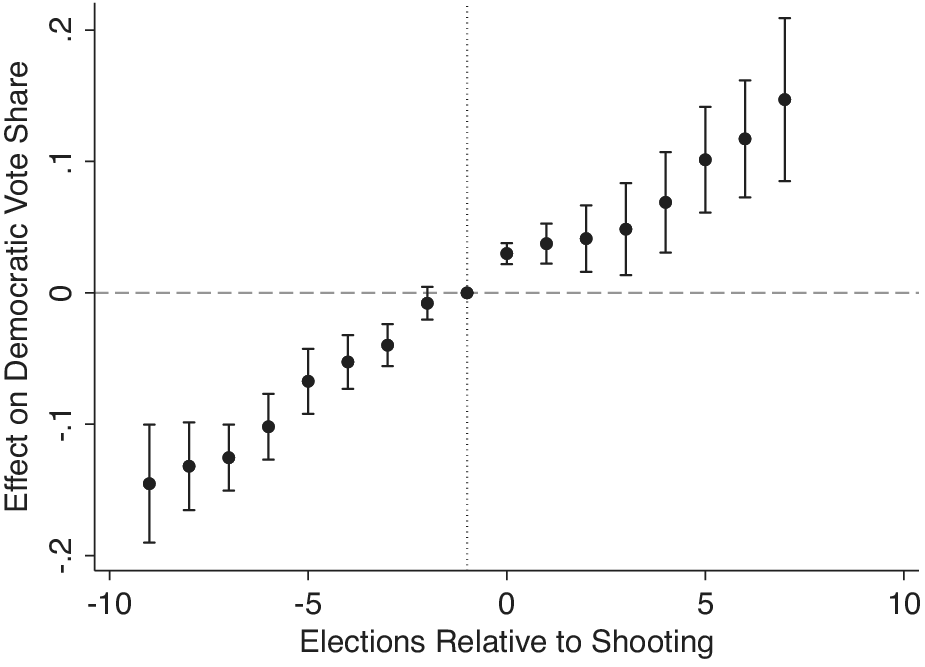
Event-Study Estimates Show that TWFE Fails to Account for Pretreatment Trends
Note: Event-study estimates with county and year fixed effects (GMAL’s data). Baseline election year is shown with a gray dotted line. Following prior work, we bin our extreme points (Baker, Larcker, and Wang Reference Baker, Larcker and Wang2022; Schmidheiny and Siegloch Reference Schmidheiny and Siegloch2019). Takeaway: Counties that have shootings trended more Democratic even before the shootings occurred. The increase that occurs after a shooting is entirely consistent with a general trend toward more Democratic election outcomes. Models that do not account for differential trends across counties will be biased.
Models accounting for violations of parallel trends provide no evidence that mass shootings cause large electoral change in the United States, and while chances of much smaller positive or negative effects cannot be entirely eliminated, almost all of these estimates are not statistically significant and are highly dependent on specific model specifications (see Figure 11). Sensitivity analyses embracing uncertainty around exact departures from parallel trends show these results are highly sensitive to minimal reasonable departures from parallel trends. Hence, the preponderance of evidence does not support conclusions that mass shootings have any large positive effect on Democratic vote shares.
These results are consistent whether we look at all mass shootings, school shootings, or just “rampage-style” school shootings.Footnote 2 (Note: if all readers want out of this article is a clear estimate of the effects [or more appropriately the lack thereof] of gun violence on Democratic vote shares, see Figures 5 [showing nonsignificant effects after controlling for unit time trends], 6 [showing nonsignificant effects after controlling for unit time trends in event-study designs], and 11 [showing the distribution of effects around zero].)
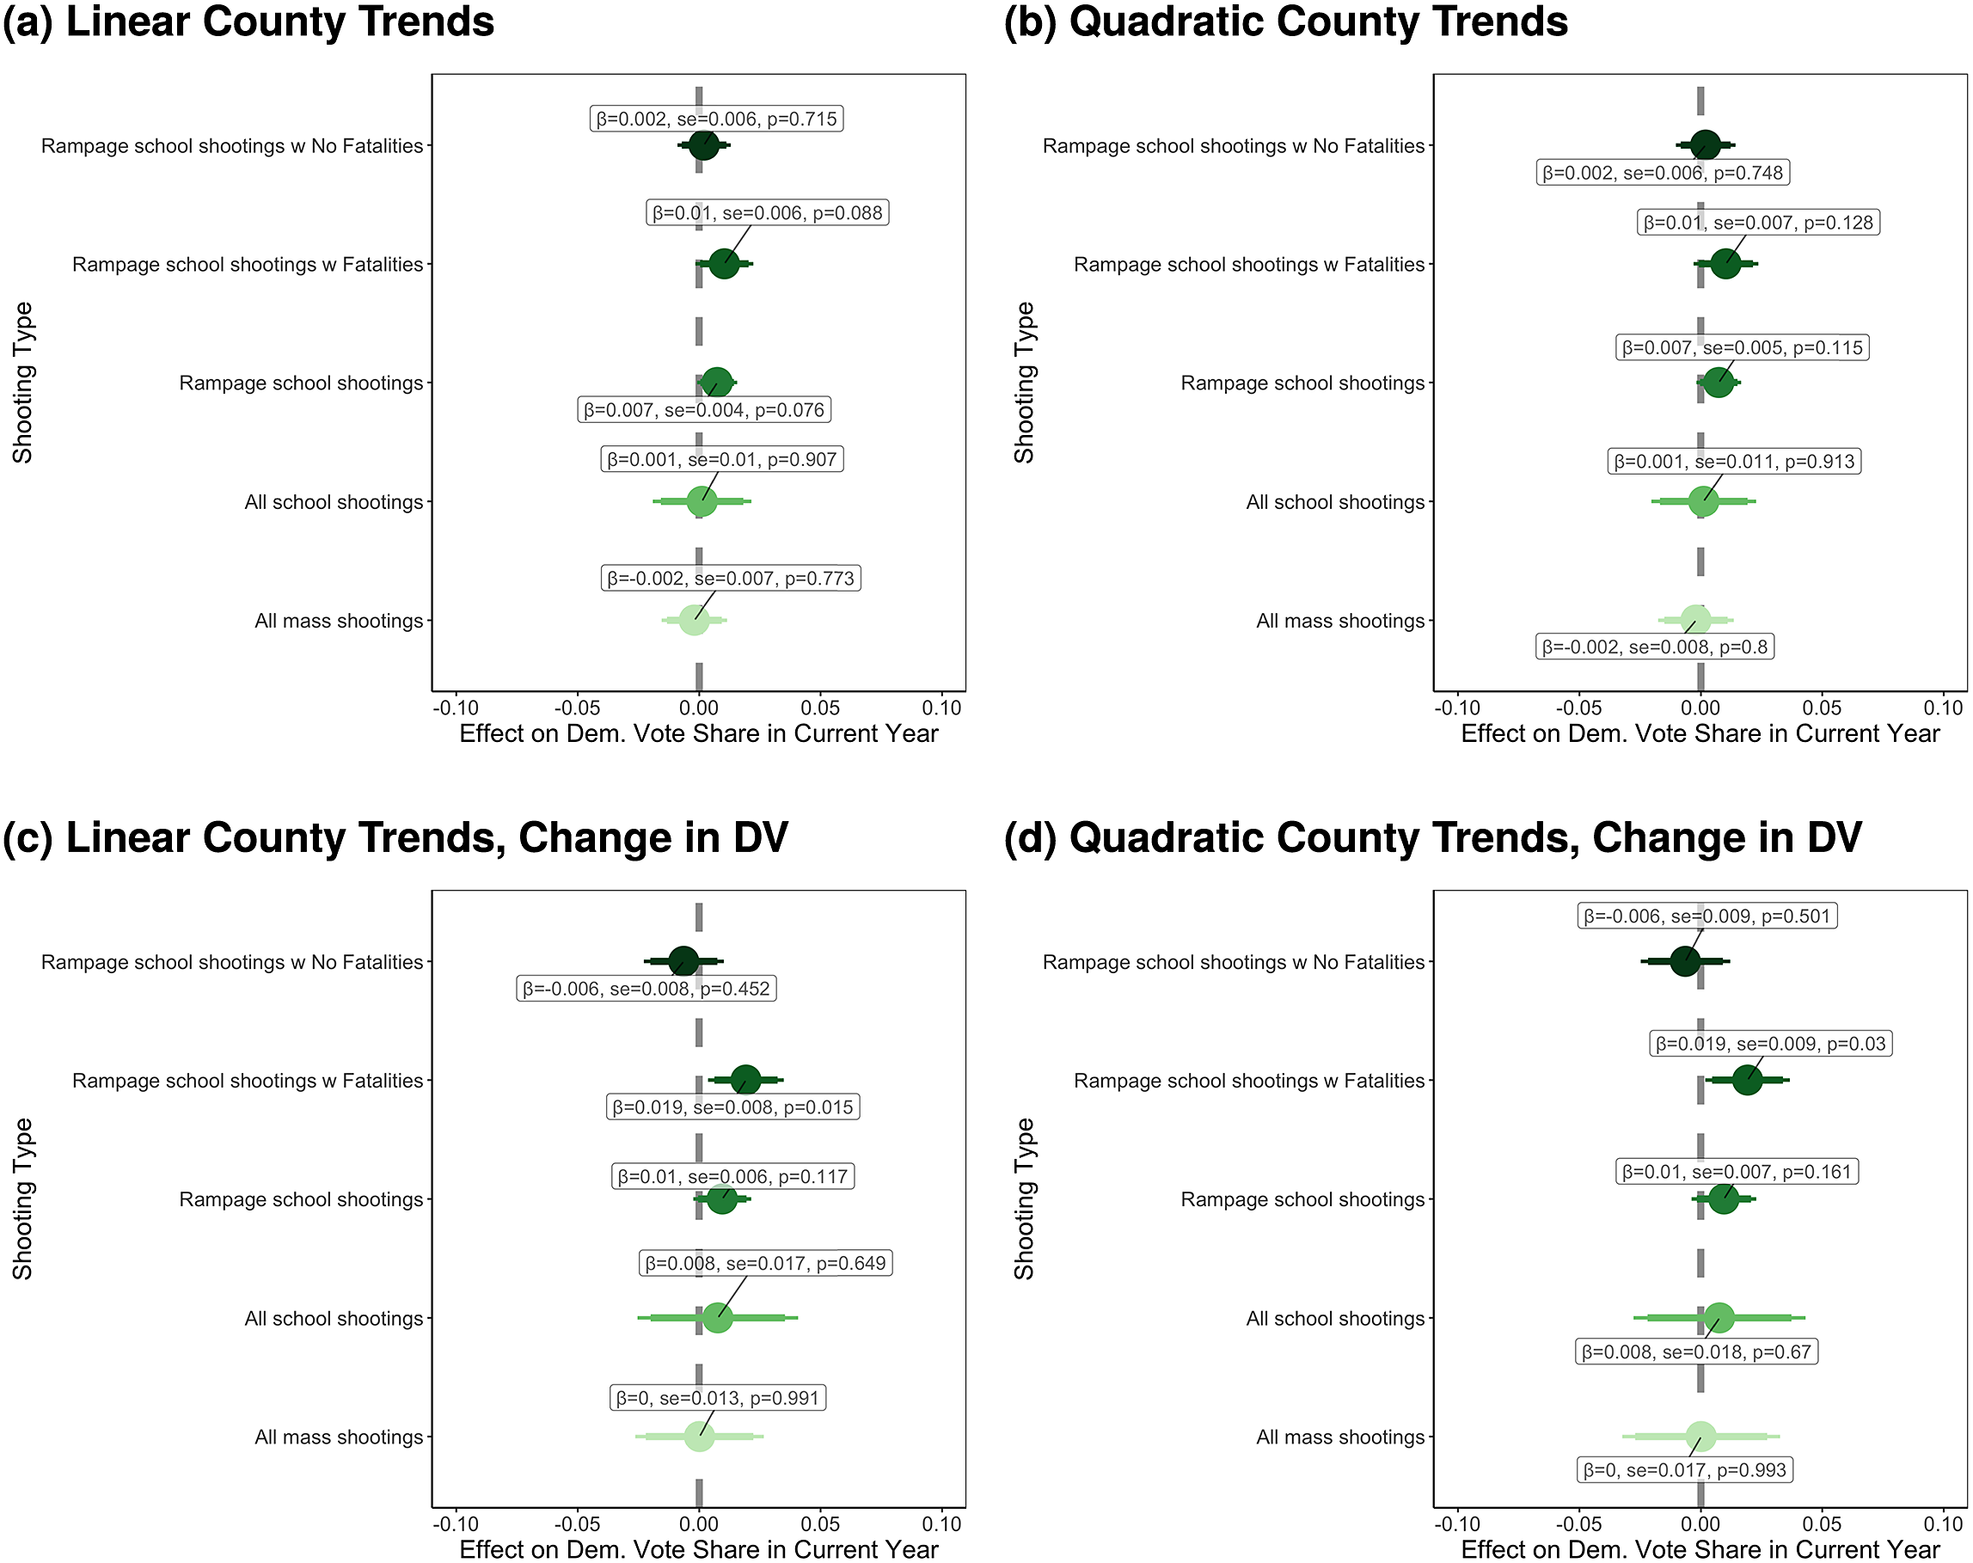
Effects of Mass Shootings on Elections after Absorbing County-Specific Trends
Note: Effect of mass shootings of various types once we account for differential trends. Within each panel, the first three estimates are using the GMAL coding of mass shootings and their data, the next comes from HHB, and the last comes from Yousaf. For cubic and quartic specifications, see Supplementary Figure S9. For effects where we code all post-shooting counties as being treated—not just counties and years with shootings—see Supplementary Figure S14. Takeaway: Once we account for differential trends across counties, the effects of mass shootings are all smaller and precisely estimated.
Event-Study Estimates of Shootings after Absorbing County-Specific Trends
Note: Event-study estimates from the HHB and GMAL data with county and year fixed effects and county-specific quadratic time trends. These use the method developed by Freyaldenhoven et al. (Reference Freyaldenhoven, Hansen, Pérez and Shapiro2021) to account for pre-trends in event-study designs. Analysis executed using the xtevent and xteventplot commands in STATA (Freyaldenhoven et al. Reference Freyaldenhoven, Hansen, Pérez and Shapiro2022). These commands, as a default, plot both the standard confidence intervals and those developed by Olea, Luis, and Plagborg-Møller (Reference Olea, Luis and Plagborg-Møller2019), which were developed for contexts with dynamic effects. The figure uses the same y-axis as Figure 4 for ease in comparing across the two. Takeaway: Once time trends are taken into account, the effect of shootings attenuates considerably.
Resolving discrepancies in these published findings also provides an opportunity to illustrate the critical importance of navigating pitfalls in difference-in-differences designs. The difference-in-differences design has recently proliferated, partially because of its simplicity and modest data requirements coinciding with a broader interest in causal inference and “credible” estimates which it provides (Angrist and Pischke Reference Angrist and Pischke2010). This has prompted a growing methodological literature covering the potential and pitfalls of this design (e.g., De Chaisemartin and d’Haultfoeuille Reference De Chaisemartin and d’Haultfoeuille2020; Kahn-Lang and Lang Reference Kahn-Lang and Lang2020; Roth et al. Reference Roth, Sant’Anna, Bilinski and Poe2022).
Although we strive first to answer the question of whether mass shootings affect election outcomes in the United States, we are also interested in narrowing the gap between theory and application of the difference-in-differences designs in political science. We do so by (1) outlining potential biases arising from (a) violations of parallel trends and (b) treatment effect heterogeneity; (2) highlighting the importance of researcher decisions related to specifying difference-in-differences models (e.g., treatment coding, the use of time trends and, if so, their functional form, and how [or at what level] to adjust standard errors); and (3) implementing them in an applied example.
This article provides a guide in the application of the difference-in-differences design and provides an answer to an important unresolved debate, shedding light on the political economy of gun violence in the United States and contributing to our understanding of what events spark electoral accountability.
DIFFERENCE-IN-DIFFERENCES AND THE TWO-WAY FIXED EFFECTS ESTIMATOR
We think it is important to first explain the predominant difference-in-differences approach and the logic behind the pitfalls that exist. Difference-in-differences designs routinely rely on two-way fixed effects estimator (TWFE). With TWFE, the outcome of interest is regressed on time and unit (often geographic) fixed effects, along with the treatment status. The TWFE controls for factors remaining constant within years (e.g., nationwide economic conditions) and factors varying across spaces (e.g., stable local culture).
Original difference-in-differences designs used these identification strategies in largely exogenous interventions implemented in a single time period. This design constitutes a two-group (treated and not treated) and two-period (pre and post) design and “[the difference-in-differences estimator] is equal to the treatment coefficient in a TWFE regression with group and period fixed effects” (De Chaisemartin and D’Haultfoeuille Reference De Chaisemartin and D’Haultfoeuille2023, C3).
Importantly, this design rests on the parallel trends assumption or the assumption that without treatment “that the average outcome among the treated and comparison populations would have followed ‘parallel trends’ in the absence of treatment.”Footnote 3 As discussed below, there are multiple ways to evaluate and adjust for violations of this crucial assumption.Footnote 4
DIFFERENCES IN FINDINGS ON THE ELECTORAL EFFECTS OF MASS SHOOTINGS
In an article published at the American Political Science Review (APSR), Hassell, Holbein, and Baldwin (Reference Hassell, Holbein and Baldwin2020) (hereafter HHB) estimate the effect of school shootings on voter turnout and election outcomes at federal, state, and local levels. Using various modeling strategies, HHB find school shootings—regardless of the number of victims—have precisely estimated null effects on vote shares.Footnote 5 In contrast, in a later article in APSR, García-Montoya, Arjona, and Lacombe (Reference García-Montoya, Arjona and Lacombe2022) (hereafter GMAL) focus on the effect of “rampage-style” school shootings. Using a TWFE, they emphasize (in the abstract and throughout the manuscript) that these shootings increase Democratic vote share by around 5 percentage points in the local community.Footnote 6 In work published in the Journal of the European Economic Association, Yousaf (Reference Yousaf2021) uses a TWFE showing all mass shootings—not restricted to school shootings—decrease Republican presidential vote share by 2–6 percentage points locally.Footnote 7
Going one step further, there are model specifications that are similar to those that GMAL and Yousaf run on their data and are theoretically justified but that are not run in these original papers. Some of these plausible alternative specifications (albeit, these are not explored by GMAL or Yousaf) suggest effects as large as $ \approx $
8.7 percentage points the election following a mass shooting. In addition, some event-study models using TWFE specifications (albeit, these are not explored by GMAL or Yousaf) suggest effects as large as 13 percentage points a full 28 years after a mass shooting.
$ \approx $
8.7 percentage points the election following a mass shooting. In addition, some event-study models using TWFE specifications (albeit, these are not explored by GMAL or Yousaf) suggest effects as large as 13 percentage points a full 28 years after a mass shooting.
Ultimately, GMAL’s and Yousaf’s conclusions differ with HHB’s—with the former suggesting large statistically detectable meaningful effects of mass shootings in partisan vote shares in local communities. Our work shows results from TWFE models suggesting these large effects are not robust because they fail to fully account for violations of the critical parallel trends assumption.
DATA/METHODS
All papers in this literature use a common dataset—Dave Leip’s Atlas of U.S. Elections—which reports county-level vote shares.Footnote 8 We focus our examination on key differences in previous work examining the electoral effects of gun violence.Footnote 9 In estimating difference-in-differences designs, one decision in the hands of the researcher is what counts as treatment. In our case, each study uses slightly different shootings as treatments (see Supplementary Table S1). However, despite previous claims (GMAL, 821–3), differences in data choices and coding are ultimately not what drives divergent findings.
Below, we are interested not only in the statistical significance of the effects but also in their magnitude. While adjudicating effect size is always somewhat in the eye of the beholder, we use several tools to quantify the size of our observed effects. First, we benchmark estimates to other similar geographic-based treatments. Second, we use equivalence testing to see what effects we are able to rule out (Hartman and Hidalgo Reference Hartman and Hidalgo2018). Finally, though not fully capturing the scope of effects, we also note when effects are not statistically significant.
TWFE ESTIMATOR IN OUR EMPIRICAL CASE
As detailed previously, the most common approach to estimating difference-in-differences effects when treatment varies over time and space is the TWFE. This approach is followed by GMAL and Yousaf, who emphasize results using county and year fixed effects.Footnote
10 We replicate this approach with the data provided by HHB although this is not their primary estimator.Footnote
11 The TWFE is specified in Equation 1, where $ {Y}_{ct} $
represents the Democratic vote share in a county (c) and election period (t),
$ {Y}_{ct} $
represents the Democratic vote share in a county (c) and election period (t), $ {\phi}_c $
represents a county fixed effect,
$ {\phi}_c $
represents a county fixed effect, $ {\lambda}_t $
represents a year fixed effect,
$ {\lambda}_t $
represents a year fixed effect, $ {\epsilon}_{ct} $
represents the error term, and
$ {\epsilon}_{ct} $
represents the error term, and $ {D}_{ct} $
denotes the treatment (i.e., whether a county (c) in a given election period (t) is exposed to a mass shooting).
$ {D}_{ct} $
denotes the treatment (i.e., whether a county (c) in a given election period (t) is exposed to a mass shooting). $ \beta $
is the effect mass shootings on Democratic vote share:Footnote
12
$ \beta $
is the effect mass shootings on Democratic vote share:Footnote
12
 $$ \begin{array}{rl}{Y}_{ct}={\phi}_c+{\lambda}_t+\beta *{D}_{ct}+{\epsilon}_{ct}.& \end{array} $$
Another researcher decision point is how to code the exact nature of the treatment.Footnote 13 One possibility is to code units exposed to treatment in a given period as treated and all other observations—pre- and posttreatment in eventually treated units and never-treated units—as the control group. In the mass shooting example, this approach codes all counties with a mass shooting in a given electoral cycle as treated, but county-level observations before and after that electoral cycle (along with those who never have a shooting) as untreated, allowing treatment in- and out-switchers. This approach assumes effects of mass shootings are constrained to the immediate electoral cycle. Alternatively, another approach is to code treatment, so all observations in treated units posttreatment are coded as treated. In our example, this approach codes all counties with mass shootings in an election cycle and following election cycles as treated, and all counties before—along with counties never having shootings—as untreated. This means there are no out-switchers. This approach allows mass shootings to have longer effects, changing the electoral environment both when they occur and afterward.Footnote 14
The choice between the two approaches is a researcher decision that should be motivated by theory. Here, given a lack of strong expectations about mass shootings temporal effects, we use both approaches. (We complement these approaches with an event-study design described below, explicitly modeling effects in periods before and after shootings with lags and leads.)
TWFE Estimates of Shootings’ Effect on Vote Shares
We start by showing that different conclusions across studies on the electoral effects of shootings are not driven by data choices. Figure 1 removes differences in methodological approaches in previous studies and shows the effects of TWFE models (GMAL’s and Yousaf’s approaches) using the data from all of the studies. Figure 1 also splits the results by treatment coding approaches outlined above.Footnote 15
As shown in Figure 1, TWFE specifications consistently produce substantive positive statistically significant effects regardless of the time frame, treatment codings—be they “rampage-style” school shootings (GMAL), school shootings (HHB), or all mass shootings (Yousaf)—or how long treatments apply. With GMAL’s data, we find—like GMAL did—that “rampage-style” shootings correlate with increases in Democratic vote share. This estimate (while varying by specifications) is 5.5 percentage points in the TWFE estimator for the first treatment coding (i.e., panel a) and is 8.7 percentage points in the second treatment coding (i.e., panel b). Both estimates are highly significant ( $ p<0.01 $
). The effects for HHB and Yousaf are very similar. Simply, when using the same model choices, the effects of shootings of different types are consistently sizeable. In other words, previous differences in conclusions across studies of the electoral effects of gun violence are not due to choices about which shootings count as treatment. In short, TWFE estimates, regardless of the coding of shootings, indicate significant and substantively meaningful positive effects of shootings on Democratic vote share.
$ p<0.01 $
). The effects for HHB and Yousaf are very similar. Simply, when using the same model choices, the effects of shootings of different types are consistently sizeable. In other words, previous differences in conclusions across studies of the electoral effects of gun violence are not due to choices about which shootings count as treatment. In short, TWFE estimates, regardless of the coding of shootings, indicate significant and substantively meaningful positive effects of shootings on Democratic vote share.
We pause to discuss effect magnitude. Upwards of an 8.7 percentage point shift in Democratic vote share is large—as are many of the other estimates. As GMAL note, these effects represent “a remarkable shift in an age of partisan polarization and close presidential elections” (GMAL, 809). We see how large these effects are by benchmarking them to other studies using county-level vote shares and difference-in-differences designs. For example, Sides, Vavreck, and Warshaw (Reference Sides, Vavreck and Warshaw2022, 709) estimate a six-standard-deviation shift in relative television advertising produces a 0.5-point change in two-party vote share. Hence, if we believe these results travel, GMAL’s simple TWFE estimates indicate one school shooting has an effect on Democratic vote share equivalent to a shift of approximately 66–104 standard deviations in relative advertising. Using an economic comparison—the most common of retrospective voting treatments—Healy and Lenz (Reference Healy and Lenz2017, 1423) show a “1 percentage point increase in mortgage delinquencies increases Democratic vote share by 0.33 percentage points.” Thus, the effect of “rampage-style” shootings is roughly the equivalent to a 16.7–26.4 percentage point increase in mortgage delinquencies; or moving from a world with no delinquencies to one where about one-fifth of residents are at risk of losing their homes.
In short, TWFE models suggests gun violence—regardless of how shootings are coded—fundamentally reshapes electoral results in the local communities in which they occur. Is this sizable relationship causal and robust? Recent methodological developments provide us a guide to answer this question.
ADDRESSING ISSUES WITH TWO-WAY FIXED EFFECTS ESTIMATORS
Recent research has shown that simple TWFE models can be problematic for important reasons, including:
-
1. violations of the parallel trends assumption (e.g., Freyaldenhoven et al. Reference Freyaldenhoven, Hansen, Pérez and Shapiro2021; Liu, Wang, and Xu Reference Liu, Wang and Xu2024; Rambachan and Roth Reference Rambachan and Roth2021) and
-
2. mistaken inferences derived from heterogeneity in treatment effects (e.g., Goodman-Bacon Reference Goodman-Bacon2021; Sun and Abraham Reference Sun and Abraham2021).
We discuss these issues in order and apply solutions articulated in the literature using the example of mass shootings’ seeming effects on Democratic vote share.
ASSESSING AND ADDRESSING PARALLEL-TRENDS VIOLATIONS
A core assumption to the difference-in-differences design is the parallel trends assumption. The parallel trends assumption asserts outcomes of interest from pre- to posttreatment would have moved in parallel across treated and untreated groups if not for treatment. If parallel-trends assumptions are violated, estimated effects are biased. There are several ways to assess the potential for differential pretreatment trends.
Checking for Visual Evidence of Differential Pretreatment Trends
Because of the fundamental problem of causal inference, we do not observe counter-factual worlds where the treated and untreated groups are exposed to opposite conditions. Hence, no singular test can prove parallel trends is satisfied; however, treated and untreated units not moving together before treatment exposure, indicates potential issues (De Chaisemartin and D’Haultfoeuille Reference De Chaisemartin and D’Haultfoeuille2023; Marcus and Sant’Anna Reference Marcus and Sant’Anna2021).Footnote 16 An appropriate first step is to visually inspect patterns in aggregate-level data to see whether, prior to treatment, treatment and control areas are trending in different directions.Footnote 17
Figure 2 examines differential pretreatment trends separating counties into two bins; panel (a) contains counties with a shooting excluding all post-treatment observations, and panel (b) contains all counties without shootings.Footnote 18 , Footnote 19 Figure 2 illuminates what TWFE models absorb and do not absorb. County fixed effects adjust for differences in Democratic vote share across counties. Year fixed effects account for differences across years. However, TWFE models do not account for the possibility counties’ Democratic vote shares change at different rates over time, a significant problem in the context of school shootings.
As Figure 2 shows, shootings happen in communities—proceeding and unrelated to shootings themselves—trending more Democratic relative to other locales. This is likely because mass shootings occur disproportionately in growing populations and have increased over time (Musu-Gillette et al. Reference Musu-Gillette, Zhang, Wang, Kemp, Diliberti and Oudekerk2018; U.S. Government Accountability Office 2020) at the same time American politics has realigned with these same more populated areas becoming more Democratic (DeSilver Reference DeSilver2016). In general, researchers should take care when demographic/political changes predating treatment aligns with short-term treatment exposure.
This (coincidental) pretreatment trend separation becomes especially prevalent after 2004. This is particularly problematic because GMAL explicitly note shootings effects before 2004 are essentially null (or negative), but in 2004 the positive effects on Democratic vote share increase (GMAL, Figure 7). Figure 2 indicates this is the exact time when parallel trends assumptions become particularly tenuous. Two-way fixed effects models do not absorb these trends and, as such, are likely biased estimates.
Checking for Pretreatment Effects with the Model Specifications Used
While Figure 2 provides visual evidence of differences in pretreatment trends, it is not dispositive. Graphical representations can differ and changes in formatting can minimize or exacerbate the appearance of differential trends leading researchers to draw different conclusions.Footnote 20 Hence, the next check to assess TWFE design validity which should be standard practice is whether this model suggests impacts prior to treatment (Grimmer et al. Reference Grimmer, Hersh, Meredith, Mummolo and Nall2018). In our case, this placebo test is informative as shootings—something that people cannot precisely anticipate—should not affect vote shares prior to their occurrence. If there are effects, it suggests TWFE estimates are likely not causal (Angrist and Pischke Reference Angrist and Pischke2008; Hansen and Bowers Reference Hansen and Bowers2008).
Specifically, we run the specification listed in Equation 2. Equation 2 is the same as Equation 1, except for the outcome variable. Instead of estimating shootings’ effects ( $ {D}_{ct} $
) in subsequent elections (
$ {D}_{ct} $
) in subsequent elections ( $ {Y}_{ct} $
), we substitute a lagged outcome variable (
$ {Y}_{ct} $
), we substitute a lagged outcome variable ( $ {Y}_{ct-k} $
). Here, k corresponds to the number of lagged periods included. We include seven lagged periods in our models as the GMAL panel is sufficiently long. However, power considerations may influence the number of lags used. We recommend initially looking for effects in one period lag, then looking how far back one can estimate precise-enough specifications:Footnote
21
$ {Y}_{ct-k} $
). Here, k corresponds to the number of lagged periods included. We include seven lagged periods in our models as the GMAL panel is sufficiently long. However, power considerations may influence the number of lags used. We recommend initially looking for effects in one period lag, then looking how far back one can estimate precise-enough specifications:Footnote
21
 $$ \begin{array}{rl}{Y}_{ct-k}={\phi}_c+{\lambda}_t+\beta *{D}_{ct}+{\epsilon}_{ct}.& \end{array} $$
Panels a and b (the top section) of Figure 3 (we discuss panels c–f later) show the TWFE models for various shootings on lagged measures of Democratic vote share and show there is substantial imbalance in lagged outcomes.Footnote 22 , Footnote 23 We start on the left of each panel, with the presidential election prior to the shooting and work up to seven presidential elections (28 years) before shootings occurred.Footnote 24 Effects vary by specification, but range between 2 and 7 percentage points, with most highly significant. This analysis indicates mass shootings have a significant and substantive effect on Democratic vote shares up to 20 years prior to a shooting. Simply, the TWFE does not recover balance prior to shootings, regardless of data used.
There is little reason—theoretically or empirically documented—to suspect shootings should have anticipatory effects on vote shares, given these events are unexpected where they occur. There is, however, the possibility pretreatment effects show up where there is not bias if treatment in one period ( $ {D}_{ct} $
) is highly correlated with treatment in prior periods (
$ {D}_{ct} $
) is highly correlated with treatment in prior periods ( $ {D}_{c,t-k} $
). In that case, the coefficient on
$ {D}_{c,t-k} $
). In that case, the coefficient on $ {D}_{ct} $
may show an effect if there is an effect of
$ {D}_{ct} $
may show an effect if there is an effect of $ {D}_{c,t-k} $
on
$ {D}_{c,t-k} $
on $ {Y}_{c,t-k} $
. In such cases, pretreatment effects could emerge even without errors in the research design. Therefore, we recommend also modeling effects of lagged and leaded treatment using an event-study design.
$ {Y}_{c,t-k} $
. In such cases, pretreatment effects could emerge even without errors in the research design. Therefore, we recommend also modeling effects of lagged and leaded treatment using an event-study design.
Checking for Pretreatment Trends with Event-Study Designs
An event-study design traces effects before and after treatment and provides another way to see pretreatment imbalances (Armitage Reference Armitage1995; Binder Reference Binder1998). An event-study is an increasingly common difference-in-differences model, given its less restrictive and more transparent modeling assumptions, but still relatively rare in political science. An event-study (usually) uses TWFE but also includes lagged and lead treatment variables as shown in Equation 3 below. We list treatment in a given county (c) and year (t), lagged or leaded by the corresponding periods since treatment (k). For simplicity, Equation 3 shows the event-study model for only one pretreatment period ( $ k-2 $
), the period when treatment occurs (k), and one period after treatment occurs (
$ k-2 $
), the period when treatment occurs (k), and one period after treatment occurs ( $ k+1 $
). The baseline is the period before treatment occurs (
$ k+1 $
). The baseline is the period before treatment occurs ( $ k-1 $
) (Armitage Reference Armitage1995; Binder Reference Binder1998):
$ k-1 $
) (Armitage Reference Armitage1995; Binder Reference Binder1998):
 $$ \begin{array}{rl}{Y}_{ct}={\phi}_c+{\lambda}_t+{\beta}_{-2}*{D}_{ct,k-2}+{\beta}_0*{D}_{ct,k}+{\beta}_1*{D}_{ct,k+1}+{\epsilon}_{ct}.& \end{array} $$
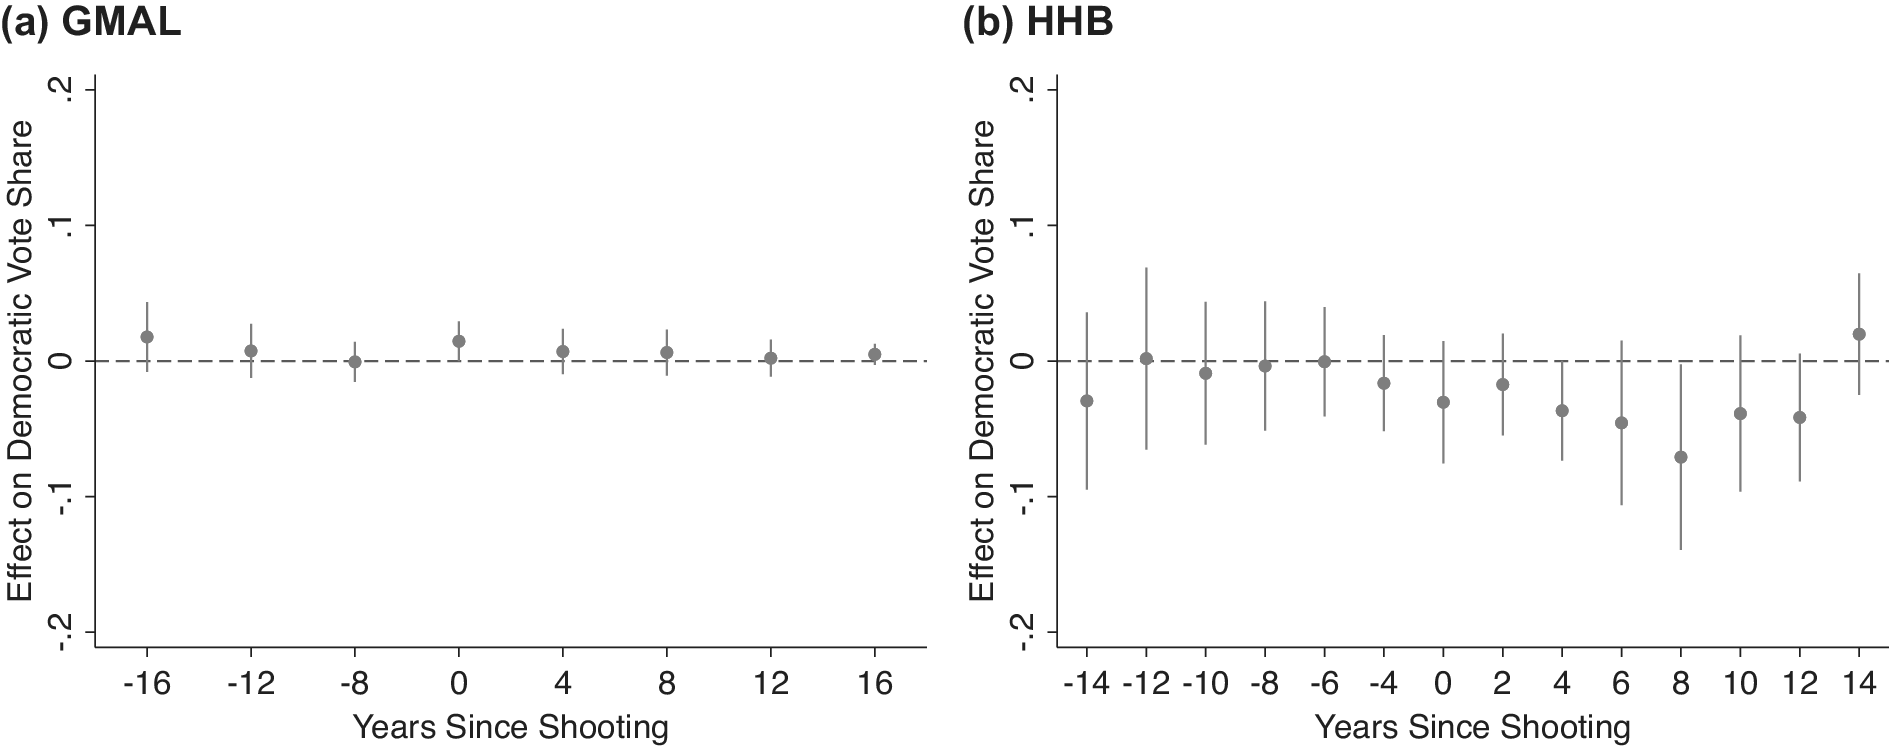
Figure 4 shows nine preelection treatments and eight posttreatment periods included using the GMAL data. The right of Figure 4 (right of the gray vertical line) shows an immediate, significant, and substantive jump in Democratic vote share the election year following a shooting and grows after the event occurs, having an increasingly larger effect on Democratic vote share (10–13 points), and allows us to rule out smaller effects using equivalence testing. While not completely impossible, the long-lasting and growing effect remains theoretically unexplained.
However, by looking to the left of the baseline period (left of the gray dotted vertical line), Figure 4 also illuminates the “effect” is unlikely to be causal. If the TWFE models were causal, these coefficients should not be significantly/substantively distinct from zero. Instead, Figure 4 shows that relative to one election prior to a shooting, prior election years see less Democratic support and this underperformance increases further back in time. Simply, vote shares trend more Democratic before shootings in counties where shootings occur (relative to counties without shootings). Elections after a shooting are just a continuation—indeed, the points represent an almost perfect linear function—further evidence that TWFE estimators are biased in this case. We recommend parameterizing models as an event-study become standard in difference-in-differences applications.
Controlling for Any Differential Unit-Specific Time Trends
Facing potential parallel-trends violations, one potential remedy is adjusting for factors—observed or unobserved—leading to pretreatment imbalances. In this case, visual inspection (see Figure 2) reveals treated and untreated units have different pre-trends. A solution is to include unit-specific time trends (Angrist and Pischke Reference Angrist and Pischke2008; Reference Angrist and Pischke2010; Wing, Simon, and Bello-Gomez Reference Wing, Simon and Bello-Gomez2018), making the identifying assumption deviation from county-year trends. Identification comes from sharp deviations from otherwise smooth unit-specific trends corresponding to the following equation:
 $$ \begin{array}{rl}{Y}_{ct}={\phi}_c+{\lambda}_t+{\gamma}_c*t+\beta *{D}_{ct}+{\epsilon}_{ct}.& \end{array} $$
While Equation 4 includes linear county-specific time trends ( $ {\gamma}_c*t $
), the functional form is a potentially influential decision in the hands of a researcher.Footnote
25 As a result, we run many model specifications—all taking slightly different tacts to adjusting for differential pre-trends. The next section shows various other approaches, including methods recently developed by Liu, Wang, and Xu (Reference Liu, Wang and Xu2024), Freyaldenhoven et al. (Reference Freyaldenhoven, Hansen, Pérez and Shapiro2021), and Rambachan and Roth (Reference Rambachan and Roth2021). We recommend scholars run robustness checks across several parameterizations of the unit-specific trends, acknowledging higher-order unit-specific trends could face a bias-variance tradeoff, especially in smaller datasets.
$ {\gamma}_c*t $
), the functional form is a potentially influential decision in the hands of a researcher.Footnote
25 As a result, we run many model specifications—all taking slightly different tacts to adjusting for differential pre-trends. The next section shows various other approaches, including methods recently developed by Liu, Wang, and Xu (Reference Liu, Wang and Xu2024), Freyaldenhoven et al. (Reference Freyaldenhoven, Hansen, Pérez and Shapiro2021), and Rambachan and Roth (Reference Rambachan and Roth2021). We recommend scholars run robustness checks across several parameterizations of the unit-specific trends, acknowledging higher-order unit-specific trends could face a bias-variance tradeoff, especially in smaller datasets.
Figure 3c–f shows the pretreatment effect models with linear and quadratic trends (adding $ {\gamma}_c*{t}^2 $
to Equation 4). For cubic and quartic county-specific trends, see Supplementary Figures S9 and S10. In contrast to the TWFE (Figure 3a,b), all models with county-specific trends are balanced pre-treatment. Importantly, these null effects (especially in proximate periods) are not driven by standard error inflation ruling out even modest pretreatment differences using equivalence testing (effects outside the
$ {\gamma}_c*{t}^2 $
to Equation 4). For cubic and quartic county-specific trends, see Supplementary Figures S9 and S10. In contrast to the TWFE (Figure 3a,b), all models with county-specific trends are balanced pre-treatment. Importantly, these null effects (especially in proximate periods) are not driven by standard error inflation ruling out even modest pretreatment differences using equivalence testing (effects outside the $ -0.99 $
to 0.57 percentage point range).
$ -0.99 $
to 0.57 percentage point range).
Figure 5 shows estimates for models including linear and quadratic county-specific time trends on the posttreatment outcomes with only counties with shootings in that year coded as treated.Footnote 26 As Figure 5 shows, once we make this necessary adjustment to correct for the violation of the parallel trends assumption, the effects of mass shootings of all types attenuate heavily. All effect estimates are much smaller and virtually all are not significant.
Specifically, Figure 5a,b—the estimates for “rampage-style” school shootings (i.e., GMAL’s treatment)—indicates a 0.7 percentage point increase in Democratic vote share, an effect that is not statistically significant and 7.9 times (i.e., 790%) smaller than the original TWFE effectively ruling out effects as large as the TWFE with a high degree of confidence.Footnote
27
, Footnote
28 We can effectively rule out effects of “rampage-style” shootings (GMAL’s treatment) larger than 1.5 percentage points and smaller than $ -0.1 $
percentage points, effects of all mass shootings (Yousaf’s treatment) larger than 1.2 percentage points and smaller than
$ -0.1 $
percentage points, effects of all mass shootings (Yousaf’s treatment) larger than 1.2 percentage points and smaller than $ -1.6 $
percentage points.Footnote
29 Effects of all school shootings (HHB’s treatment) are also much smaller and not significant. Simply, there is no evidence of large effects documented in previous work finding an effect, and no consistent evidence for positive (or negative) effects statistically distinguishable from zero regardless of the data used.Footnote
30 While statistically significant effects infrequently show up in Figure 5, they are not robust. Notably, if we add higher-order polynomials—as in Supplementary Figure S9—no effects are significant. This—along with further checks below—emphasizes the lack of support for the conclusion that shootings have significant, systematic, or large effects on Democratic vote shares.Footnote
31
$ -1.6 $
percentage points.Footnote
29 Effects of all school shootings (HHB’s treatment) are also much smaller and not significant. Simply, there is no evidence of large effects documented in previous work finding an effect, and no consistent evidence for positive (or negative) effects statistically distinguishable from zero regardless of the data used.Footnote
30 While statistically significant effects infrequently show up in Figure 5, they are not robust. Notably, if we add higher-order polynomials—as in Supplementary Figure S9—no effects are significant. This—along with further checks below—emphasizes the lack of support for the conclusion that shootings have significant, systematic, or large effects on Democratic vote shares.Footnote
31
Using an event-study design that accounts for the differential pre-treatment trends by adding leads and lags of the treatment values bolsters conclusions as effects are even smaller and more precise. Figure 6 uses Freyaldenhoven et al. (Reference Freyaldenhoven, Hansen, Pérez and Shapiro2021) methods displaying event-study designs and accounting for pre-trends in event-study designs.Footnote 32 , Footnote 33 Figure 6 uses the same y-axis as Figure 4 for ease in comparison. Adding trends attenuates pre-treatment imbalances. So too, however, are any large post-treatment differences as the immediate effect of “rampage-style” school shootings is a mere 0.8 percentage point bump for Democrats. This effect is barely statistically significant using the linear trends models (p=0.048) but still allows us to confidently rule out large effects; we can rule out effects larger than 1.67 percentage points using equivalence testing, nowhere near the size of GMAL’s 5 percentage point estimate emphasized throughout their text. Using the quadratic trends model, the effect is only marginally significant at the 10% level (p<0.066) and we can rule out effects larger than 1.71 percentage points.Footnote 34 These effects appear to be the upper bound produced from this method.
If we use Clarke and Tapia-Schythe’s (Reference Clarke and Tapia-Schythe2021) approach to estimating the event-study with trends and the corresponding eventdd command in STATA, we get negative effects on Democratic vote shares (albeit statistically indistinguishable from zero). With this slightly different approach, the effects in elections immediately following shootings are $ -0.13 $
percentage points (
$ -0.13 $
percentage points ( $ p=0.898 $
; 95% CI: [−2.05, 1.80]).Footnote
35 Other shooting codings are similarly very small and insignificant. Moreover, testing the robustness of these effects to other pretreatment periods—as the approach designed by Freyaldenhoven et al. (Reference Freyaldenhoven, Hansen, Pérez and Shapiro2021) allows—effects are even smaller and even less suggestive of an effect (see Supplementary Figures S2–S5). Benchmarked to the two-period lag trend, the estimate for elections immediately after a shooting using linear county trends is 0.47 percentage points (
$ p=0.898 $
; 95% CI: [−2.05, 1.80]).Footnote
35 Other shooting codings are similarly very small and insignificant. Moreover, testing the robustness of these effects to other pretreatment periods—as the approach designed by Freyaldenhoven et al. (Reference Freyaldenhoven, Hansen, Pérez and Shapiro2021) allows—effects are even smaller and even less suggestive of an effect (see Supplementary Figures S2–S5). Benchmarked to the two-period lag trend, the estimate for elections immediately after a shooting using linear county trends is 0.47 percentage points ( $ p=0.324 $
; 95% CI: [−0.5, 1.4]). Estimates for elections after a shooting for the quadratic county trends model is 0.5 percentage points (
$ p=0.324 $
; 95% CI: [−0.5, 1.4]). Estimates for elections after a shooting for the quadratic county trends model is 0.5 percentage points ( $ p=0.359 $
; 95% CI: [−0.5, 1.5]). Moreover, none of the large longer-term effects remain.
$ p=0.359 $
; 95% CI: [−0.5, 1.5]). Moreover, none of the large longer-term effects remain.
In short, in event-studies adjusting for unit-specific trends, there is little evidence for the sizeable effects previously suggested. In fact, there is little evidence for any significant effect. The occasional effect crossing the $ p<0.05 $
threshold are not robust to reasonable model variations, such as the baseline comparison points one uses. Moreover, while some specifications cannot fully exclude some much smaller but non-negligible positive effects, most 95% confidence intervals also cannot rule out non-negligible negative effects.
$ p<0.05 $
threshold are not robust to reasonable model variations, such as the baseline comparison points one uses. Moreover, while some specifications cannot fully exclude some much smaller but non-negligible positive effects, most 95% confidence intervals also cannot rule out non-negligible negative effects.
Additional Checks Addressing Violations of Parallel Trends Assumptions
Including unit-specific time trends (see above) is not the only solution to parallel-trends violations; indeed, scholars may desire more flexible solutions. Recent advances have suggested many alternative solutions to potential parallel-trends violations or unobserved time-varying confounders. Unfortunately, these approaches have not yet been benchmarked to one another, let alone compared in different data contexts. The standard approach is to develop a new estimator and assert it applies in all contexts. We are currently unaware of work testing these methods head-to-head, let alone providing recommendations regarding which methods to apply in different contexts. As such, we recommend scholars run a variety of specifications, as we do below, identifying general patterns. We recommend that scholars implement, at minimum, checks suggested by Liu, Wang, and Xu (Reference Liu, Wang and Xu2024) and Rambachan and Roth (Reference Rambachan and Roth2021) outlined below.
Building on research exploring factor-augmented models for causal identification (e.g., Bai and Ng Reference Bai and Ng2021; Xu Reference Xu2023), Liu, Wang, and Xu (Reference Liu, Wang and Xu2024) develop procedures—including what they call the fixed effects counterfactual estimator, the interactive fixed effects counterfactual estimator, and the matrix completion estimator—to “estimate the average treatment effect on the treated by directly imputing counterfactual outcomes for treated observations” (1).Footnote 36 Using simulations, Liu, Wang, and Xu (Reference Liu, Wang and Xu2024) show that the interactive fixed effects counterfactual estimator provides more reliable causal estimates than conventional TWFE models when unobserved time-varying confounders exist. The interactive fixed effects counterfactual estimator can be applied with the package panelView, which is available in both Stata and R (Mou, Liu, and Yiqing Reference Mou, Liu and Yiqing2022b).
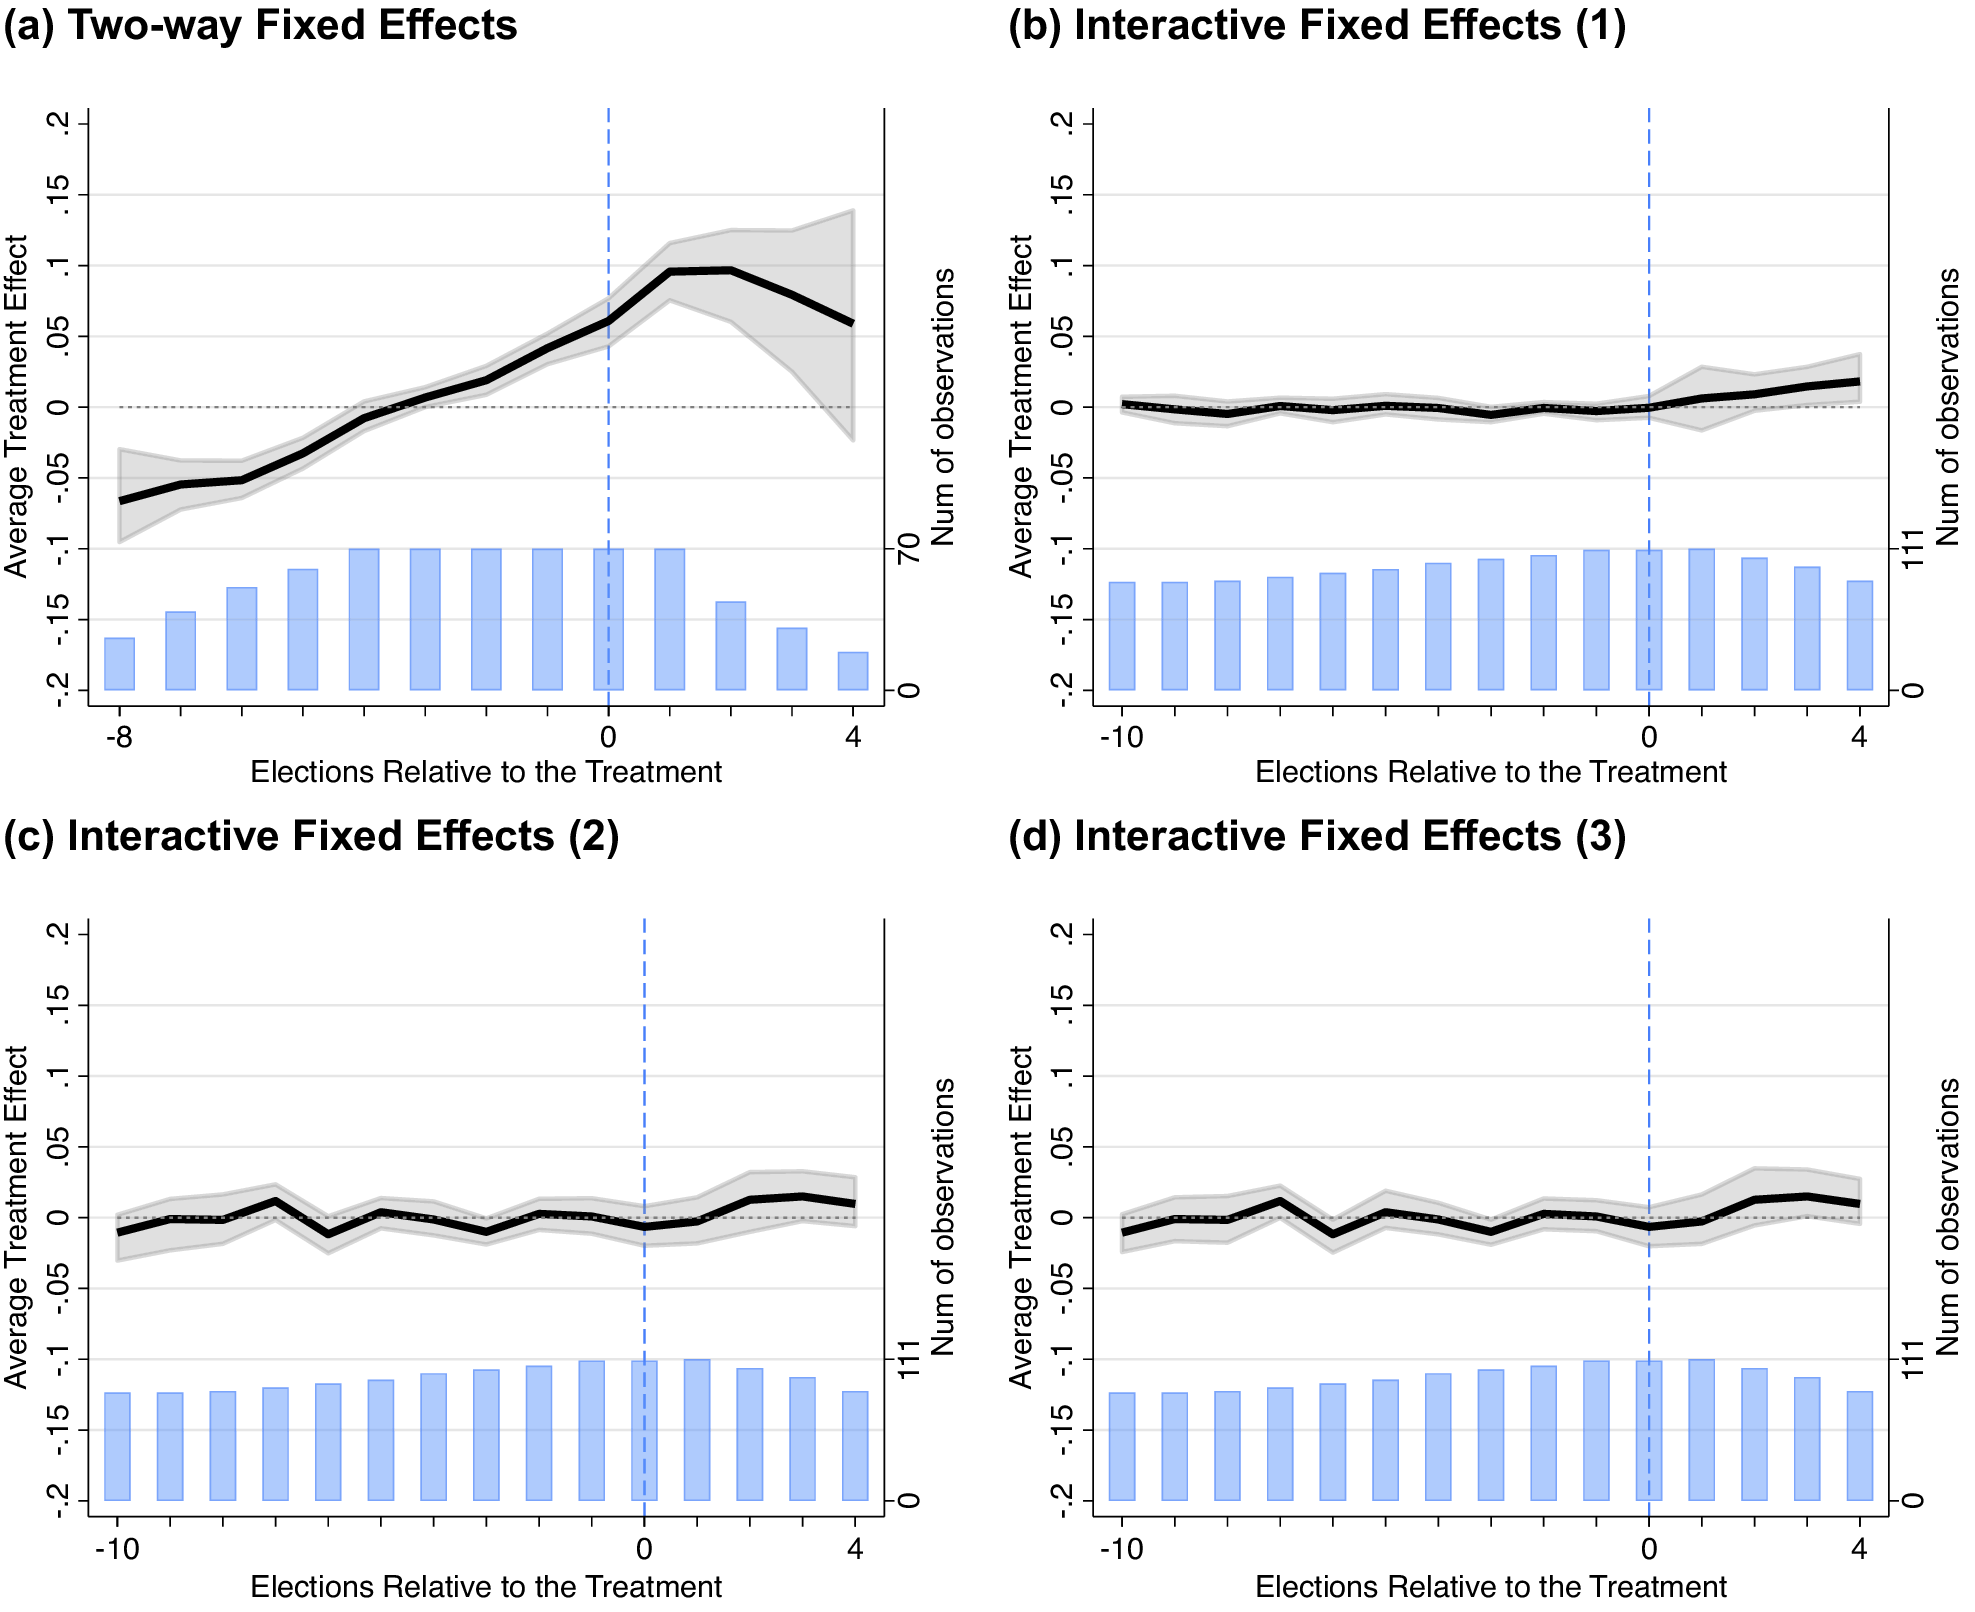
Figure 7 applies Liu, Wang, and Xu’s (Reference Liu, Wang and Xu2024) approach using the GMAL data.Footnote 37 Panel a shows the TWFE and panels b–d show interactive fixed effects counterfactual estimators. In the TWFE model, there are pretreatment imbalances and a general overall upward trend—as Figure 5 indicated previously. Again, this suggests the TWFE picks up on a general pro-Democratic trend in pre-treatment periods. However, after adjusting for pretreatment differences using Liu, Wang, and Xu’s (Reference Liu, Wang and Xu2024) approach to address pretreatment imbalances, there is virtually no evidence shootings substantially or significantly affect vote shares in subsequent elections. Nor is this for lack of statistical power and we can rule out larger effects using equivalence testing. Moreover, any (much smaller) effects that appear intermittently are not robust to reasonable model variations in the realm of researcher decision-making.
Liu, Wang, and Xu (Reference Liu, Wang and Xu2024) Interactive Fixed Effects Counterfactual Estimator
Note: The interactive fixed effects counterfactual estimator developed by Liu, Wang, and Xu (Reference Liu, Wang and Xu2024) using GMAL’s data. Panel a shows the TWFE estimated by Liu, Wang, and Xu’s (Reference Liu, Wang and Xu2024) FECT package; it is analogous to Figure 5, but their procedure estimates slight differences—for example, in the number of pre- and posttreatment periods. In panel b, the number of factors (r) is set to 3—that chosen by cross-validation and the degree of the polynomial is set to 4. In the bottom row, r is set to 1 in both panels and degree 2 in panel c and 4 in panel d. For other variations, see the Supplementary Material. Takeaway: The upward trend in the TWFE model (i.e., panel a) is indicative of violation of the parallel trends assumption. In the interactive fixed effects models, there is no evidence of the substantial effects shown in more simplistic model specifications that do not account for potential violations of the parallel trends assumption.
Rambachan and Roth (Reference Rambachan and Roth2021) propose another solution using a sensitivity analysis approach for potential violations of the parallel trends assumption allowing researchers to avoid arbitrarily choosing a parametric model.Footnote 38 This approach is particularly useful as researchers often struggle to know the functional form of the underlying system.
This sensitivity analysis can be formalized in several ways. For example, researchers can see how robust their effects are to varying departures from differential trends evolving smoothly over time. This may be especially useful when concerned “about confounding from secular trends … evolv(ing) smoothly over time” (Rambachan and Roth Reference Rambachan and Roth2021, 13)—as we are in this case. This sensitivity test is “done by bounding the extent to which the slope may change across consecutive periods” (Rambachan and Roth Reference Rambachan and Roth2021, 12).Footnote
39 They call this the $ SD $
or “second derivative” or “second differences” approach.Footnote
40 Using Rambachan and Roth’s (Reference Rambachan and Roth2021) general approach, conclusions do not depend on arbitrary model specification choices. In essence, this approach “show[s] what causal conclusions can be drawn under various restrictions on the possible violations of the parallel-trends assumption” (Rambachan and Roth Reference Rambachan and Roth2021, 1). This approach is implementable through the HonestDID package in R and STATA (Rambachan and Roth Reference Rambachan and Roth2021; Rambachan, Roth, and Bravo Reference Rambachan, Roth and Bravo2021).
$ SD $
or “second derivative” or “second differences” approach.Footnote
40 Using Rambachan and Roth’s (Reference Rambachan and Roth2021) general approach, conclusions do not depend on arbitrary model specification choices. In essence, this approach “show[s] what causal conclusions can be drawn under various restrictions on the possible violations of the parallel-trends assumption” (Rambachan and Roth Reference Rambachan and Roth2021, 1). This approach is implementable through the HonestDID package in R and STATA (Rambachan and Roth Reference Rambachan and Roth2021; Rambachan, Roth, and Bravo Reference Rambachan, Roth and Bravo2021).
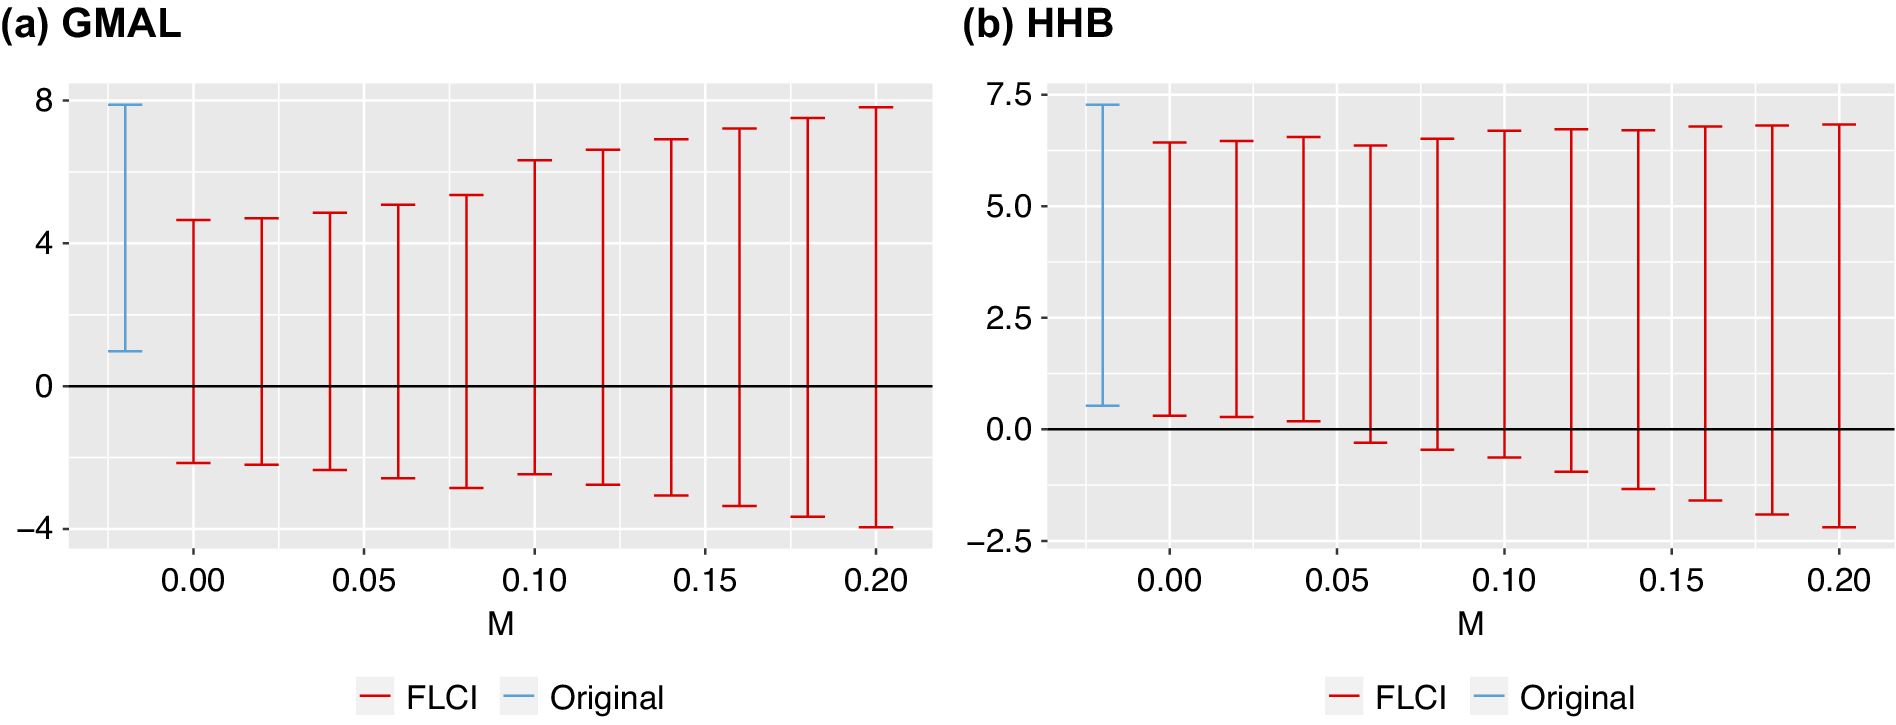
Rambachan and Roth (Reference Rambachan and Roth2021, 28) note “it is natural to report both the sensitivity of the researcher’s causal conclusion to the choice of this parameter and the ‘breakdown’ parameter value at which particular hypotheses of interest can no longer be rejected.” Figure 8 shows Rambachan and Roth’s sensitivity approach using GMAL’s and HHB’s data. Figure 8 uses the $ SD $
approach, plotting robust confidence sets for the treatment effect in the mass shooting case for different values of the parameter M. The confidence sets show that the effect of mass shootings on Democratic vote share is only positive and significant in the coefficient on the far left—the original estimate not allowing for any violations of parallel trends—indicating effects of mass shootings are highly sensitive to any minor departures from parallel trends. The robust confidence intervals include zero when allowing for linear violations of parallel trends (
$ SD $
approach, plotting robust confidence sets for the treatment effect in the mass shooting case for different values of the parameter M. The confidence sets show that the effect of mass shootings on Democratic vote share is only positive and significant in the coefficient on the far left—the original estimate not allowing for any violations of parallel trends—indicating effects of mass shootings are highly sensitive to any minor departures from parallel trends. The robust confidence intervals include zero when allowing for linear violations of parallel trends ( $ M=0 $
), and become even wider allowing for nonlinear violations of parallel trends (
$ M=0 $
), and become even wider allowing for nonlinear violations of parallel trends ( $ M>0 $
). Such a low breakdown suggests any meaningful departure of the slope changing between consecutive periods, would cause the observed effects in GMAL’s data to not be significant. Overall, these results indicate effects of shootings (using the GMAL data) are highly sensitive to even minor parallel-trends violations.
$ M>0 $
). Such a low breakdown suggests any meaningful departure of the slope changing between consecutive periods, would cause the observed effects in GMAL’s data to not be significant. Overall, these results indicate effects of shootings (using the GMAL data) are highly sensitive to even minor parallel-trends violations.
Implementing Rambachan and Roth’s Sensitivity Analysis in the Shooting Example
Note: Results from the sensitivity analysis suggested by Rambachan and Roth (Reference Rambachan and Roth2021) using GMAL’s data—that is, testing for effect sensitivity across $ {\triangle}^{SD}(M) $
. The models incorporate information from three elections prior to treatment and five post-treatment periods. Takeaway: The results show the effects of shootings on vote shares are highly sensitive and do not hold with even minor deviations from parallel trends.
$ {\triangle}^{SD}(M) $
. The models incorporate information from three elections prior to treatment and five post-treatment periods. Takeaway: The results show the effects of shootings on vote shares are highly sensitive and do not hold with even minor deviations from parallel trends.
Summarizing Tests for Violations of Parallel Trends
Testing for potential violations of parallel trends is often not easy or straightforward because of the fundamental problem of causal inference—that is, the inability to observe what would have happened to treated groups without treatment. But even when considering only tests of pre-trends, there are challenges. For example, in choosing methods to address this core issue, one must consider the nature of the data available, the statistical power, and numerical degrees of freedom (Bilinski and Hatfield Reference Bilinski and Hatfield2018; Roth Reference Roth2022). We are not arguing every case employ unit-specific trends. What we are arguing is that all researchers should diagnose and address potential violations of this core assumption. How they do so—with the many tools at their disposal that we have outlined above—is less important than that they do so in a way that is transparent, thorough, and appropriate to the applied case.
In the case of mass shootings, this much is clear: once we make adjustments for clearly differential pre-trends, the evidence for any effect gets much more muddled than previous studies have suggested. Effects are substantively smaller than what simple TWFE models suggest. There is no clear evidence of durable lasting effects. Moreover, depending on the dataset one uses and the way treatment is coded, effects can be marginally positive, negative, or (approximately) zero, are very rarely significant, and highly sensitive to any meaningful departures from strictly parallel trends.
DIAGNOSING AND ADDRESSING TREATMENT EFFECT HETEROGENEITY/REMOVING CONTAMINATED COMPARISONS
Recent research also indicates issues with variations in treatment with heterogeneity of treatment effects. For example, Goodman-Bacon (Reference Goodman-Bacon2021) shows any TWFE estimate with variations in treatment timing can be decomposed into an average of all possible $ 2\times 2 $
difference-in-differences estimates constructed from the panel data set weighted by group sizes and variance in treatment (Goodman-Bacon Reference Goodman-Bacon2019). If there are time-varying treatment effects, they can produce biased estimates (Goodman-Bacon Reference Goodman-Bacon2019, 3).Footnote
41 To diagnose this potential for bias, Goodman-Bacon (Reference Goodman-Bacon2019) allows for decomposing the
$ 2\times 2 $
difference-in-differences estimates constructed from the panel data set weighted by group sizes and variance in treatment (Goodman-Bacon Reference Goodman-Bacon2019). If there are time-varying treatment effects, they can produce biased estimates (Goodman-Bacon Reference Goodman-Bacon2019, 3).Footnote
41 To diagnose this potential for bias, Goodman-Bacon (Reference Goodman-Bacon2019) allows for decomposing the $ 2\times 2 $
difference-in-differences estimates using the bacondecomp package in R and STATA (Goodman-Bacon Reference Goodman-Bacon2021; Goodman-Bacon, Goldring, and Nichols Reference Goodman-Bacon, Goldring and Nichols2019).Footnote
42 As stated in the package’s STATA help file:
$ 2\times 2 $
difference-in-differences estimates using the bacondecomp package in R and STATA (Goodman-Bacon Reference Goodman-Bacon2021; Goodman-Bacon, Goldring, and Nichols Reference Goodman-Bacon, Goldring and Nichols2019).Footnote
42 As stated in the package’s STATA help file:
[The decomposition] by default produces a graph for all comparisons and shows up to three types of two-group/two period comparisons, which differ by control group: (1) Timing groups, or groups whose treatment stated at different times can serve as each other’s controls groups in two ways: those treated later serves as the control group for an earlier treatment group and those treated earlier serve as the control group for the later group; (2) Always treated, a group treated prior to the start of the analysis serves as the control group; and (3) Never treated, a group which never receives the treatment serves as the control group.
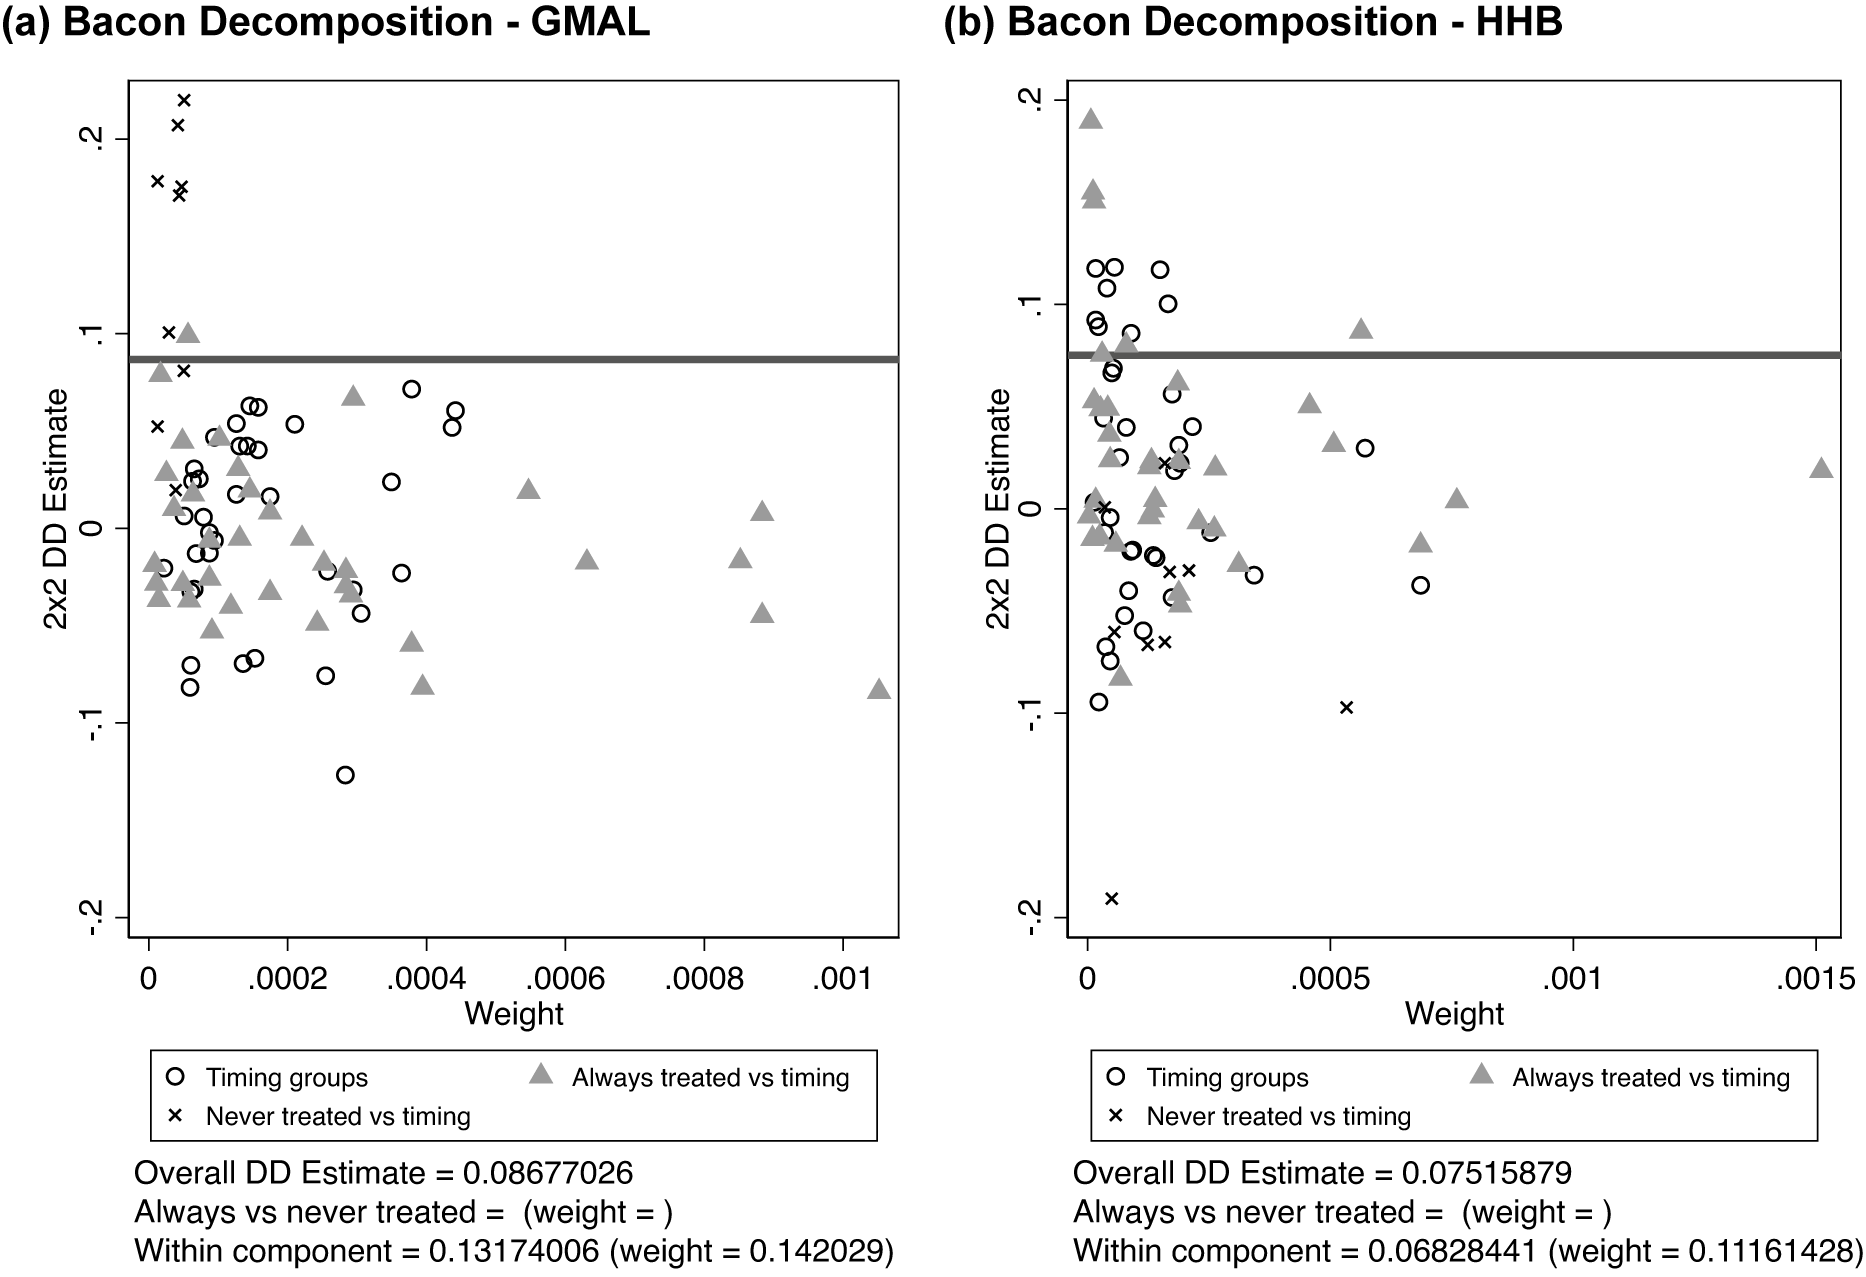
Figure 9 provides this decomposition.Footnote
43 As shown in both the GMAL and HHB data, the TWFE is a composite of $ 2\times 2 $
’s eliciting large negative and positive effects. Effects can be very different depending on the
$ 2\times 2 $
’s eliciting large negative and positive effects. Effects can be very different depending on the $ 2\times 2 $
’s included in the estimate (as indicated by the spread of estimates across the y-axis). Second, the TWFE is a weighted composite highly influenced by several comparisons of always treated versus timing. However, many of the
$ 2\times 2 $
’s included in the estimate (as indicated by the spread of estimates across the y-axis). Second, the TWFE is a weighted composite highly influenced by several comparisons of always treated versus timing. However, many of the $ 2\times 2 $
estimates have similar weight—as noted by the cluster of estimates on the left side of the graph. Overall, to our eye, there appears to be no clear evidence our effects are driven by treatments of various types.
$ 2\times 2 $
estimates have similar weight—as noted by the cluster of estimates on the left side of the graph. Overall, to our eye, there appears to be no clear evidence our effects are driven by treatments of various types.
Illustration of the Goodman–Bacon Decomposition of the TWFE Models
Note: This figure shows the results from the Bacon decomposition for the TWFE models. The figure also shows all of the possible $ 2\times 2 $
difference-in-differences (DiD) estimate, with their weights for the ATE on the x-axis and the effect size on the y-axis. The horizontal line shows the overall DiD estimate.
$ 2\times 2 $
difference-in-differences (DiD) estimate, with their weights for the ATE on the x-axis and the effect size on the y-axis. The horizontal line shows the overall DiD estimate.
We think it is important to note that the mass shooting example is not an ideal application to show the value of Goodman–Bacon decomposition as (at present) the Goodman–Bacon decomposition only decomposes the TWFE and does not decompose more sophisticated models implemented accounting for parallel-trends violations. Nevertheless, this may not always be true in all contexts, and scholars should examine this decomposition to illuminate whether effects are driven by specific comparisons and if the bias Goodman-Bacon (Reference Goodman-Bacon2021) discusses is present.
There are several proposed solutions to problems arising with heterogeneous treatment effects (Borusyak, Jaravel, and Spiess Reference Borusyak, Jaravel and Spiess2021; Callaway and Sant’Anna Reference Callaway and Sant’Anna2021; De Chaisemartin and d’Haultfoeuille Reference De Chaisemartin and d’Haultfoeuille2020; de Chaisemartin, D’Haultfoeuille, and Guyonvarch Reference de Chaisemartin, D’Haultfoeuille and Guyonvarch2019; Zhang Reference Zhang2022). Some allow the inclusion of additional covariates including unit-specific trends. One approach that does is Sun and Abraham (Reference Sun and Abraham2021) implemented using the eventstudyinteract package in STATA and fixest package in R (Berge, Krantz, and McDermott Reference Berge, Krantz and McDermott2022; Sun Reference Sun2021).Footnote
44
, Footnote
45 This approach “estimates the shares of cohort as weights.” In our case, implementing Sun and Abraham’s solution with a simple TWFE (with no time trends and thus not addressing parallel-trends violations) substantially reduces effect estimates (Figure 10). At first, these changes look modest with event-study estimates going from 3 percentage points ( $ p=0.000 $
) in the naive models to 2.4 percentage points (
$ p=0.000 $
) in the naive models to 2.4 percentage points ( $ p=0.001 $
) in the Sun and Abraham adjusted models in the first posttreatment period. However, in the second and following treatment periods, effects that were large (10–13 percentage points) heavily attenuate and even become negative (1.1 [
$ p=0.001 $
) in the Sun and Abraham adjusted models in the first posttreatment period. However, in the second and following treatment periods, effects that were large (10–13 percentage points) heavily attenuate and even become negative (1.1 [ $ p=0.19 $
],
$ p=0.19 $
], $ -0.4 $
[
$ -0.4 $
[ $ p=0.75 $
],
$ p=0.75 $
], $ -2.2 $
[
$ -2.2 $
[ $ p=0.12 $
], and
$ p=0.12 $
], and $ -1.5 $
[
$ -1.5 $
[ $ p=0.18 $
] in posttreatment elections 1–4, respectively). Adding unit-specific trends to Sun and Abraham’s estimator (panel a) makes effects even smaller. We go from 2.4 percentage points [
$ p=0.18 $
] in posttreatment elections 1–4, respectively). Adding unit-specific trends to Sun and Abraham’s estimator (panel a) makes effects even smaller. We go from 2.4 percentage points [ $ p=0.001 $
] in the TWFE to roughly half (linear trends [
$ p=0.001 $
] in the TWFE to roughly half (linear trends [ $ p=0.031 $
]; quadratic [
$ p=0.031 $
]; quadratic [ $ p=0.051 $
]; or cubic trends [
$ p=0.051 $
]; or cubic trends [ $ p=0.085 $
]). (Even in the cubic model, the standard error remains modest in size—being 0.8 percentage points.) Moreover, the long-run effect of 10–13 percentage points is not present. None of the effects are present in the HHB data (panel b). This suggests that effect heterogeneity plays some role. Once adjusted for, long-term effects attenuate substantially and short-term effects become much smaller and flimsier to reasonable alternative specifications (e.g., the coding of treatment or the functional form of unit-specific trends).
$ p=0.085 $
]). (Even in the cubic model, the standard error remains modest in size—being 0.8 percentage points.) Moreover, the long-run effect of 10–13 percentage points is not present. None of the effects are present in the HHB data (panel b). This suggests that effect heterogeneity plays some role. Once adjusted for, long-term effects attenuate substantially and short-term effects become much smaller and flimsier to reasonable alternative specifications (e.g., the coding of treatment or the functional form of unit-specific trends).
Sun and Abraham (Reference Sun and Abraham2021) Approach for Estimating Dynamic Treatment Effects in Event Studies with Heterogeneous Treatment Effects
Note: Results from the clean comparisons suggested by Sun and Abraham (Reference Sun and Abraham2021) using the GMAL and HHB data. Models include quadratic county-specific time trends to address potential violations of the parallel trends assumption in the TWFE. Takeaway: Clean comparison effects with trends show no sign of a sizable and durable effect on Democratic vote shares shown in the TWFE nor in the simple event-study plot (see Figure 5).
More importantly, for reasons we outline below, it is unwise to overemphasize one model specification. Combining the evidence from all of the various approaches taking into account potential contamination from treatment effect heterogeneity, the best evidence suggests that in the case of shootings and electoral vote shares, (1) violations of parallel trends loom large, (2) effect heterogeneity may play a modest role, and (3) there is no sign of the sizable and durable effect, but perhaps a much smaller effect—and one that is not clearly distinct from zero across almost all reasonable model specifications (and is negative in some specifications).
OTHER POTENTIAL ISSUES RAISED IN THE LITERATURE ABOUT EXECUTING DIFFERENCE-IN-DIFFERENCES DESIGNS
A few final words of guidance and caution remain. First, in all empirical checks, it is important not to forget theory. For example, we focus on whether shootings change Democratic vote shares in counties where they occur. We have done so because whether an effect occurs there is the central dispute. However, there are other potential effects. Perhaps shootings have spillover effects—with effects in adjacent counties—or as a function of the distance from a shooting, the time since a shooting, or the intensity of the shooting (e.g., the number of deaths/injuries). Alternatively, perhaps mass shootings have national effects. The best evidence currently suggests that none of these things occur (HHB).Footnote 46 However, scholars should remember there are often multiple ways of conceptualizing treatment exposure.
Second, it may, at times, be useful to unpack treatment effects at a more granular level—estimating, for example, the effect of individual shootings, rather than the average effect using the synthetic control method (Abadie, Diamond, and Hainmueller Reference Abadie, Diamond and Hainmueller2015; Arkhangelsky et al. Reference Arkhangelsky, Athey, Hirshberg, Imbens and Wager2021; Kreif et al. Reference Kreif, Grieve, Hangartner, Turner, Nikolova and Sutton2016; Porreca Reference Porreca2022). Similarly, if interested in whether a subset of observations drives results, Broderick, Giordano, and Meager (Reference Broderick, Giordano and Meager2020) have an implementable procedure.Footnote 47
Third, in some applications, implementing different modeling strategies for estimating treatment effects with longitudinal data may make sense. For example, others have attempted to bracket treatment effects of interest in longitudinal data. Specifically, Hasegawa, Webster, and Small (Reference Hasegawa, Webster and Small2019) recommend bracketing by splitting the control group into different groups based on relative comparisons to the treatment group. As they describe, “the basic idea is to consider one control group that has a lower expected outcome than the treated group in the before period and another control group that has a higher expected outcome than the treated group in the before period” (Hasegawa, Webster, and Small Reference Hasegawa, Webster and Small2019, 372). They show estimators using the lower control group and the higher control group bracket the causal effect of treatment. This approach may be fruitful in cases where the pool of control units is large and easily split.Footnote 48 Likewise, Ding and Li (Reference Ding and Li2019) and Angrist and Pischke (Reference Angrist and Pischke2008) suggest bracketing strategies combining the standard difference-in-differences specification with lagged dependent variables.Footnote 49 , Footnote 50
Fourth, scholars may be interested in estimating distributional effects. Recent work combines difference-in-differences estimators with those quantile regression produces (see Callaway and Li Reference Callaway and Li2019; Roth et al. Reference Roth, Sant’Anna, Bilinski and Poe2022). Using this test, HHB show little signs of shifts at any point along the distribution of Democratic vote shares—that is, there is little evidence of polarizing effects in Democratic and Republican counties (see their Supplementary Figure A12 and surrounding discussion).
Finally, in making modeling decisions, one should acknowledge the tradeoffs between bias and precision and the importance of considering power in testing for pre-trends (Freyaldenhoven, Hansen, and Shapiro Reference Freyaldenhoven, Hansen and Shapiro2019; Roth Reference Roth2022; Roth et al. Reference Roth, Sant’Anna, Bilinski and Poe2022). For example, higher-order polynomials for unit-specific time trends require more power and may inflate standard errors. In our applied example, we have taken great care to pay attention to effect sizes, statistical significance, and the range of potential effects.
Overall, we note how to implement difference-in-differences designs depends, to a certain extent, on the nature of the data—that is, whether or not there are likely violations of parallel trends or unaccounted treatment effect heterogeneity or both. In the case of gun violence on electoral outcomes, the former appears to be key, while the latter less so. However, this may not always be the case. We think it is best to follow the suggestions outlined above to ensure inferences are not misleading. In our applied example, doing so reconciles why different studies using the same data arrived at vastly different conclusions regarding gun violence’s effects on electoral vote shares.
SYNTHESIZING EVIDENCE FROM MULTIPLE SPECIFICATIONS
We note here a few important points required to come to a conclusion about mass shootings’ effects on elections. In our particular example, there are many plausible models, a small number of which show statistically significant effects. Given the potential for bias and the role of researcher decisions, it is important for researchers to (1) address potential threats to inference outlined above, (2) be transparent about the effect of simple changes to model specification, and (3) take a “preponderance of evidence” rather than a “singular model” approach.Footnote 51
What does this mean in the mass shootings context? Though on occasion we see intermittent statistically significant effects, these effects are (1) much smaller than previous research (i.e., GMAL and Yousaf) claims and (2) not robust to reasonable alternative specifications under the control of researchers. Taking a “singular model” approach makes researchers vulnerable to mistaken inferences given researcher degrees of freedom in choosing a model specification. However, a “preponderance of evidence” approach provides considerable reasons to doubt mass shootings have any significant, systematic, or large effects.Footnote 52 Models accounting for parallel-trends violations, while not completely ruling out some potential smaller effects (although almost all of these effects are not statistically significant), provide little to no evidence that mass shootings cause large electoral change in the United States and instead provide compelling evidence consistent with null effects.
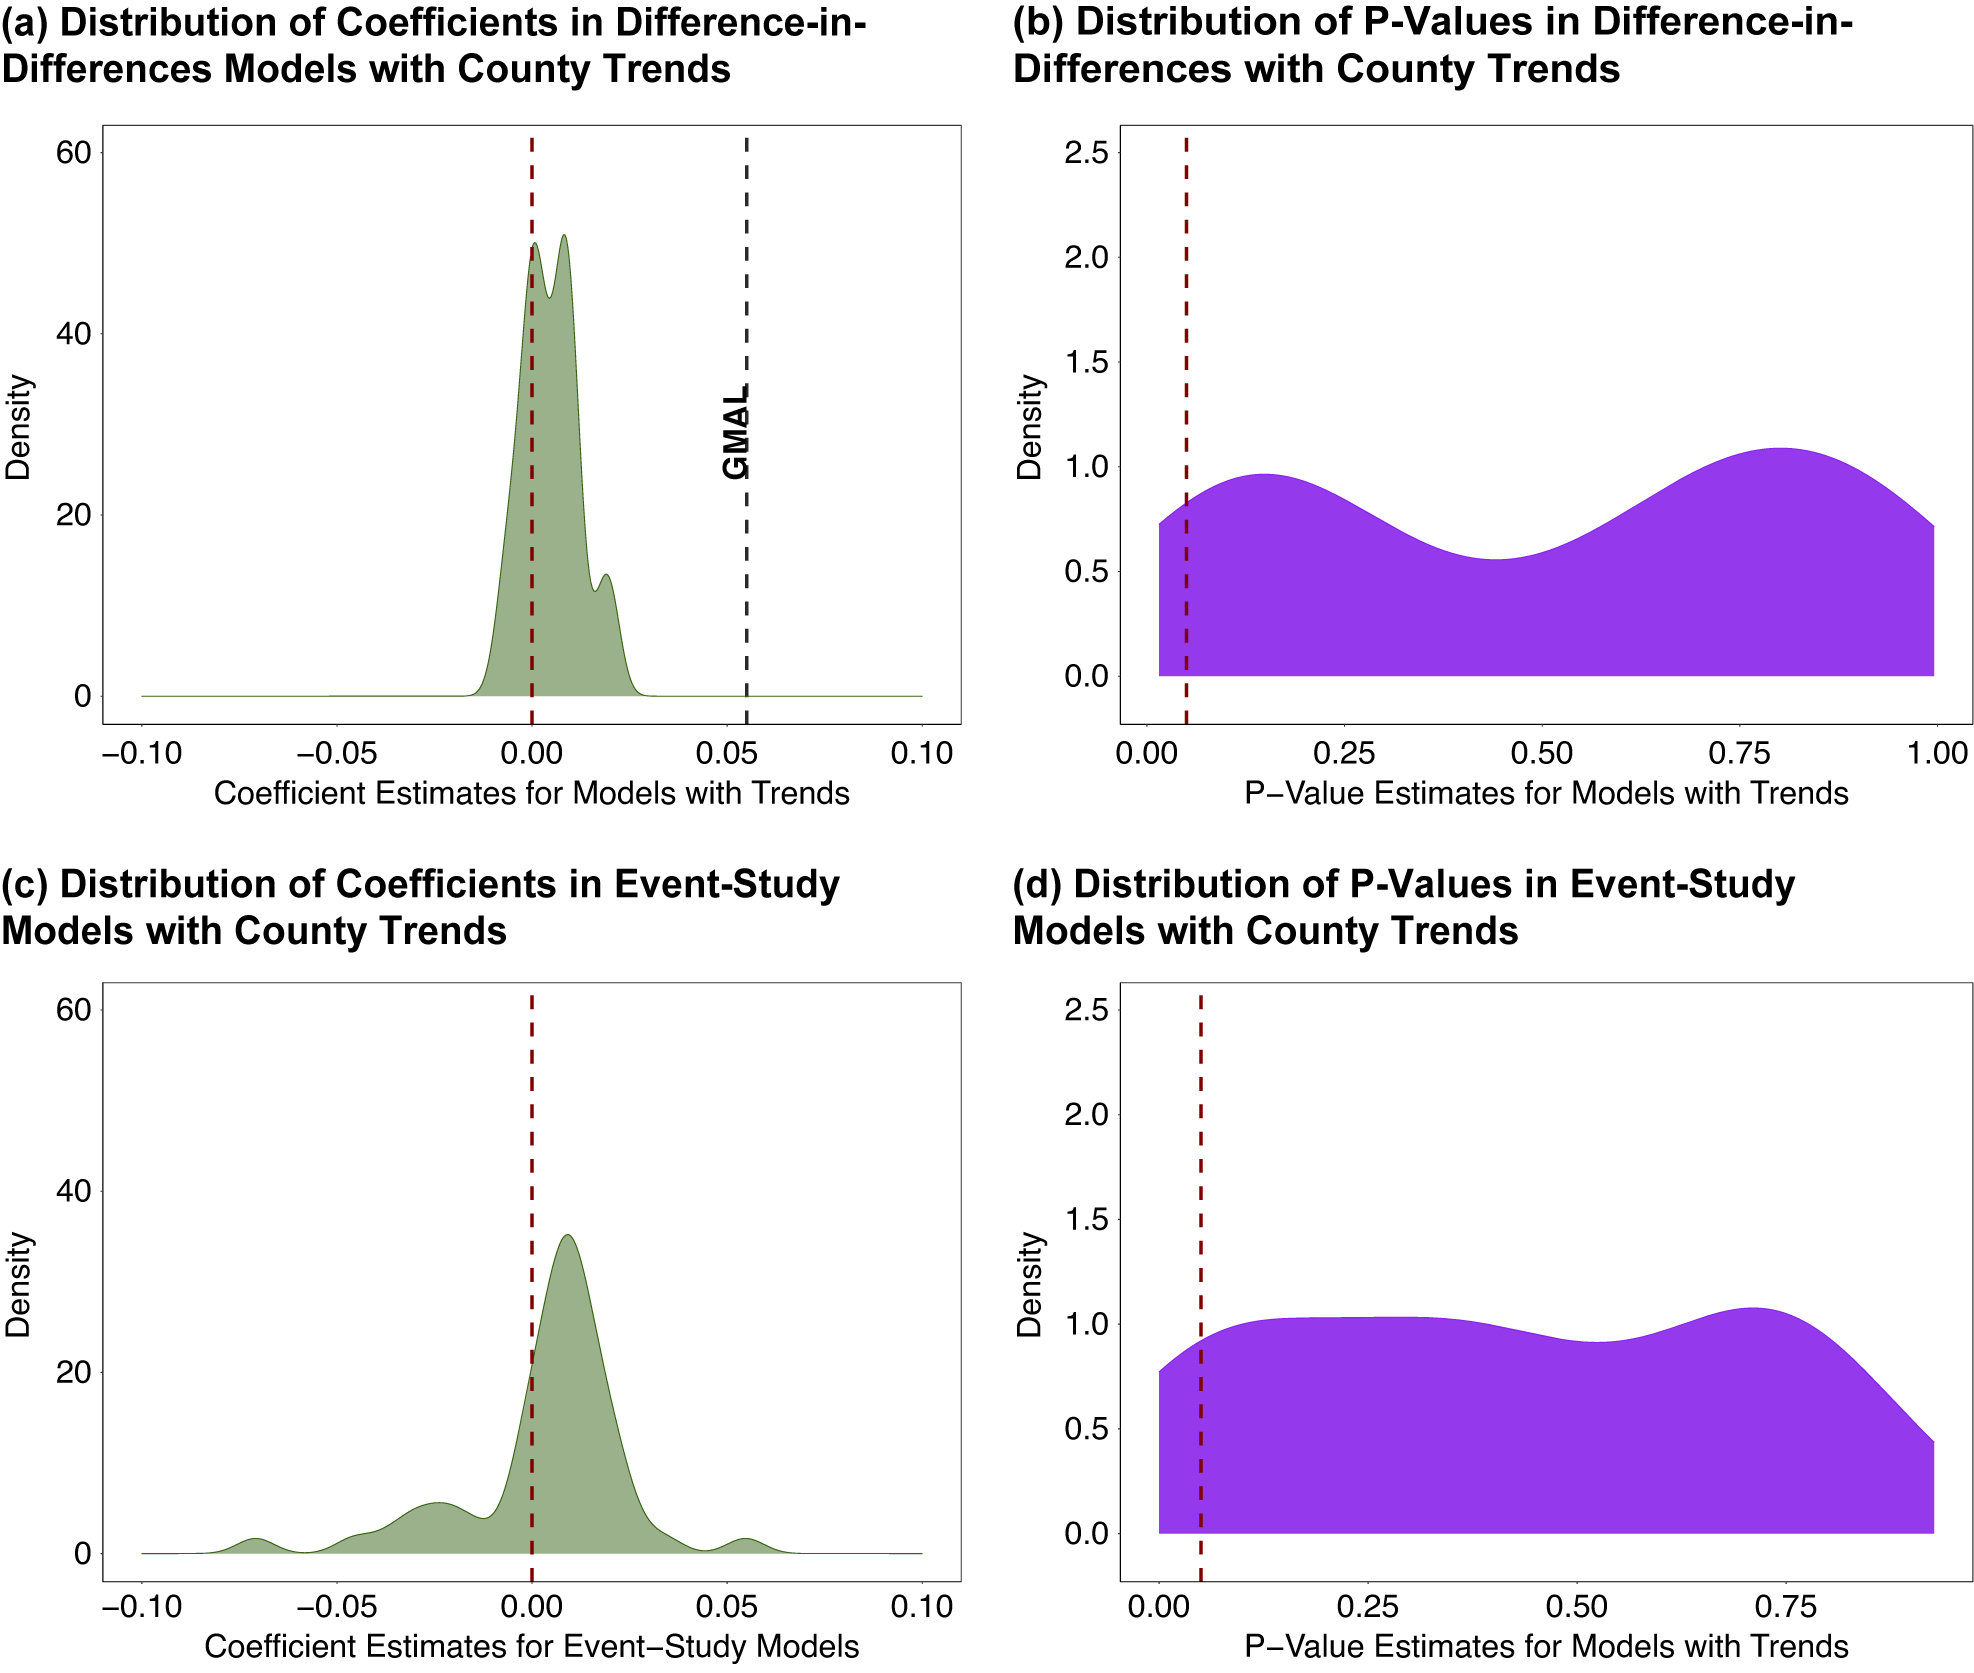
This can be seen by synthesizing four pieces of evidence. First, though a very small number of corrected models show much smaller positive effect on Democratic vote share, almost all are not statistically significant. Second, negative effects also show up regularly across the small, but reasonable, changes to model specification within researcher control. Figure 11 plots the distribution of effects and p-values for all difference-in-differences models and event-study models we estimated above. As shown in panel a, all coefficients from difference-in-differences models with trends are much smaller than GMAL’s TWFE. Some are positive and some are negative and the distribution spikes near zero. The average effect is 0.9 percentage points. Panel c shows that event-study models also spike at zero, with similar numbers of positive and negative effects. The average effect for all posttreatment periods is 0.4 percentage points and the average in the year immediately following treatment (i.e., period 0) is 0.07 percentage points. Third, when significant and positive effects do show up, these effects are not robust to slight variations in model specification within researchers’ reasonable control. Fourth, sensitivity analyses embracing uncertainty around exact parallel-trends departures show results are highly sensitive to even minimal reasonable departures. Hence, the preponderance of evidence suggests large effects are implausible and that modest positive (or negative) effects are anything but sure.
Distribution of All Effect Estimates and P-Values for Models with County Trends
Note: Distribution of all model estimates with trends in Figure 5 in the first row and then for all the event-study estimates in the article on the bottom row. The event-study coefficients are shown for periods 0–4 post-treatment. The left panel in each row shows coefficients (in percentage point units). The right panel in each row shows the distribution of p-values across model specifications. Takeaway: Once we account for potential violations of parallel trends, the effects of shootings spike around zero, are only rarely significant, are not robust to slight changes in model specification, and are sometimes positive and sometimes negative.
CONCLUSION
In reconciling research on the effects of mass shootings on electoral outcomes, our work also highlights the considerations we argue should become standard practice given the hazards of navigating difference-in-differences designs. In addition to resolving an important question, we hope our article sparks a more nuanced approach to estimating difference-in-differences models. If appropriately used, the checks outlined above will help researchers make better inferences using this common identification strategy.
The methodological contribution we provide applies best to cases where the treatment may not be fully exogenous or may vary in timing across units, and with larger sample sizes having more cross sections than time points. Instances departing from these may leverage approaches similar to those outlined above, but with unique features. Moreover, we have not explored some valuable aspects of panel data estimation recently developed for scenarios with very few treatment units (e.g., synthetic controls) that are valuable. Finally, our work is applied to a context where there is not currently, nor any prospect of a future, experimental baseline. While the econometric literature has long highlighted the value of the checks we run—through proofs, simulations, and other validation techniques—there is not yet (to the best of our knowledge) a comparison of difference-in-differences tools in our arsenal to a randomized baseline. Future work would do well to find other contexts where randomization is possible and add this benchmarking task to our suite of studies on this widely used method, as has been done with other methodological techniques (e.g., Arceneaux, Gerber, and Green Reference Arceneaux, Gerber and Green2006; Green et al. Reference Green, Leong, Kern, Gerber and Larimer2009).
Returning to the context of this study, America’s legacy of gun violence is heartbreaking and the thousands of deaths that occur from guns each year constitute a policy failure of epic proportions. Yet scholars have disagreed whether policymakers relative inaction occurs in spite of (or as a result of a lack of) an electoral response. While agreeing mass shootings do not effect voter turnout, scholars have come to vastly different conclusions about mass shootings’ effects on vote shares. We show that we cannot definitively conclude gun violence has any impact on Democratic vote shares (either positive or negative) and that previous work showing such relationships fails to navigate many of the pitfalls of difference-in-differences designs, specifically a failure of the parallel trends assumption. Moreover, even the most generous interpretation—i.e., entirely ignoring statistical uncertainty (something that prior work suggests should not be done; see, e.g., Stock and Watson Reference Stock and Watson2020)—suggests shootings have, at best, modest effects on Democratic vote share much smaller than prior research emphasizes. Looking across all robustness checks, we cannot conclude mass shootings of any kinds substantially affect election outcomes. Such a conclusion comes only from selecting highly sensitive results that are not robust.
Furthermore, these estimates are all local to the county in which the shooting occurred. Though all mass shootings are repugnant, they are (thankfully) relatively rare. Given shootings only occurred in 0.4% of counties (116 total; 11.6 per election) in HHB’s data, 0.4% of counties (115 total; 11.5 per election) in GMAL’s data, and only 0.5% of counties (72 total; 14.4 per election) in Yousaf’s data further emphasizes the limited impact shootings have on elections.Footnote 53 Ultimately, both the modest effect sizes in percentage points and their limited scope show mass shootings have little substantive consequence for election outcomes. Even if we take point estimates above at face value and ignore statistical uncertainty (something we certainly should not do), given the county-specific effect of the size observed and their infrequency mass shootings would have virtually no effect on any statewide or national election.
Lastly, as a reminder, there are often multiple ways of conceptualizing treatment exposure. These include, but are not limited to, short-lived treatments (constrained only to the period when they happen) or longer-term treatments (turned on in all periods after treatment occurs), spillover treatments (affecting units adjacent to treatment), varying dosage treatments, and even the possibility of national treatments drowning out any potential local effects. However, the best evidence we have currently suggests that none of these occur in mass shootings contexts (see HHB, 1377).
Our work sets the table for future work on the political economy of gun violence and retrospective voting/accountability more generally. Future work would do well to explore why mass shootings fail to substantively change the electoral incentives elected officials face, despite having favorable conditions to do so (HHB). Our work also acts a guide for researchers navigating the potential pitfalls of difference-in-difference designs. Future work would do well to continue to advance the boundaries of this promising and increasingly common method for making causal inferences.
SUPPLEMENTARY MATERIAL
To view supplementary material for this article, please visit https://doi.org/10.1017/S0003055424000108.
DATA AVAILABILITY STATEMENT
Research documentation and data that support the findings of this study are openly available at the American Political Science Review Dataverse: https://doi.org/10.7910/DVN/GH69TI.
Acknowledgments
We would like to thank Laura García-Montoya, Ana Arjona, Matthew Lacombe, and Hasin Yousaf for making their replication data and code available. We also thank Matt Baldwin, Charles Crabtree, Bernard Fraga, Andrew Goodman-Bacon, Justin Grimmer, Zoltan Hajnal, Nazita Lajevardi, Gareth Nellis (and the UCSD Graduate Student Seminar), Ben Newman, Tyler Reny, Brian Shaffner, Zayne Sember, Neil Visalvanich, Bertrand Wilden, and Yiqing Xu, and five anonymous reviewers for their feedback.
CONFLICT OF INTEREST
The authors declare no ethical issues or conflicts of interest in this research.
ETHICAL STANDARDS
The authors affirm this research did not involve human participants.


 Open access
Comments
No Comments have been published for this article.