Introduction
The Archæan Eon (3.8–2.5 Ga) predates the partial oxygenation of the atmosphere (~2.4–2.3 Ga; Holland Reference Holland2006; Kump Reference Kump2008), but multiple lines of evidence demonstrate that many different life forms arose during this period, with evidence of biologic activity possibly as early as 3.7 Ga (Rosing Reference Rosing1999). The earliest life forms evolved metabolisms that enabled them to survive and thrive in predominantly anoxic, reducing oceans rich in dissolved Fe2+ and NH4+, and which probably contained very low concentrations of NO3−, SO42−, H2S and non-ferrous trace metals (e.g. Beaumont & Robert Reference Beaumont and Robert1999; Anbar & Knoll Reference Anbar and Knoll2002). Photosynthesizing cyanobacteria may have appeared as early as ~2.8 Ga (Brocks et al. Reference Brocks, Logan, Buick and Summons1999; Falkowski & Godfrey Reference Falkowski and Godfrey2008), providing localized sources of O2 in an otherwise O-depleted environment. Beneficiaries of the small quantities of O2 likely included the chemolithoautotrophs, which used it as an electron acceptor for their metabolisms (Godfrey & Falkowski Reference Godfrey and Falkowski2009). Nitrogen (N) is essential to all known forms of life. Biological activity leads to significant fractionation of N isotopes with positive shifts in δ15N up to ~10–20‰ (Fogel Reference Fogel, Beauchemin and Matthews2010), which may be preserved in the geological record under suitable circumstances. Nitrogen concentrations and isotopic compositions of the rocks of the Hurd Property appear to record the input of sedimentary organic N during seafloor hydrothermal alteration, implying that those signatures have been preserved for ~2.7 Gyr.
Many geochemical studies of Precambrian life have focused on kerogen and detrital mineral records preserved in low-grade metasedimentary sequences (e.g. Beaumont & Robert Reference Beaumont and Robert1999; Jia & Kerrich Reference Jia and Kerrich2004; Hashizume et al. Reference Hashizume, Sugihara, Pinti, Orberger and Westall2006; Pinti et al. Reference Pinti, Hashizume, Orberger, Gallien, Cloquet and Massault2007; Garvin et al. Reference Garvin, Buick, Anbar, Arnold and Kaufman2009; Thomazo et al. Reference Thomazo, Ader and Philippot2010; Godfrey et al. Reference Godfrey, Poulton, Bebout and Fralick2013; Thomazo & Papineau Reference Thomazo and Papineau2013). There also is evidence for microbial activity in modern basaltic rocks (e.g. Furnes et al. Reference Furnes, Thorseth, Tumyr, Torsvik, Fisk, Alt, Kinoshita, Stokking and Michael1996; Fisk et al. Reference Fisk, Giovannoni and Thorseth1998; Furnes et al. Reference Furnes, Banerjee, Muehlenbachs, Staudigel and de Wit2004; Banerjee et al. Reference Banerjee, Furnes, Muehlenbachs, Staudigel and de Wit2006; Staudigel et al. Reference Staudigel, Furnes, Banerjee, Dilek and Muehlenbachs2006) and their ancient metamorphosed equivalents (e.g. Banerjee et al. Reference Banerjee, Simonetti, Furnes, Muehlenbachs, Staudigel, Heaman and Van Kranendonk2007; Staudigel et al. Reference Staudigel, Furnes, McLoughlin, Banerjee, Connell and Templeton2008). Occurrences of possible Archæan microbial ichnofossils, which closely resemble modern tubular and granular structures thought to be produced by euendolithic microorganisms in modern seafloor glasses, have received considerable attention because of their possible implications for our understanding of the earliest life on Earth (e.g. Schopf Reference Schopf, Eriksson, Altermann, Nelson, Mueller and Catuneanu2004; Furnes et al. Reference Furnes, Banerjee, Staudigel, Muehlenbachs, McLoughlin, de Wit and Van Kranendonk2007), and for astrobiology (Izawa et al. Reference Izawa, Banerjee, Flemming, Bridge and Schultz2010). The oldest such fossils identified with high degrees of confidence include those found in volcanic glasses from the ~3.4–3.5 Ga basalt pillow rims and inter-pillow hyaloclastite units in the Hooggenoeg and Kromberg Formations of the Barberton greenstone belt in South Africa (Furnes et al. Reference Furnes, Banerjee, Muehlenbachs, Staudigel and de Wit2004; Banerjee et al. Reference Banerjee, Furnes, Muehlenbachs, Staudigel and de Wit2006; Staudigel et al. Reference Staudigel, Furnes, Banerjee, Dilek and Muehlenbachs2006), and in the ~3.35 Ga pillow basalts in the Euro Basalt of the Pilbara Craton, Western Australia (Banerjee et al. Reference Banerjee, Simonetti, Furnes, Muehlenbachs, Staudigel, Heaman and Van Kranendonk2007). Possible ichnofossils consisting of tubular and granular aggregates of fine-grained titanite have been documented by Bridge et al. (Reference Bridge, Banerjee, Mueller, Muehlenbachs and Chacko2010) in a unit of brecciated volcanic rocks at the Hurd Property, a ~2701 ± 1 Ma outcrop (Ayer et al. Reference Ayer, Ameline, Corfu, Kamo, Ketchum, Kwok and Trowell2002) in the Southern Volcanic Zone (SVZ) of the Abitibi greenstone belt (AGB). The outcrop exhibits low-temperature, greenschist-facies metamorphism thought to largely reflect hydrothermal alteration during emplacement on the Archæan seafloor without obvious overprinting by later regional-scale metamorphism (see the discussion in Bridge et al. Reference Bridge, Banerjee, Mueller, Muehlenbachs and Chacko2010; also Hannington et al. Reference Hannington, Santaguida, Kjarsgaard and Cathles2003). Bridge et al. (Reference Bridge, Banerjee, Mueller, Muehlenbachs and Chacko2010) placed the original ichnofossil discovery into an inferred physical volcanological context. In this paper, we present new field, petrographic and geochemical observations (including major and trace element and silicate N and O isotope data) bearing on the nature of the volcanic protolith of the Hurd volcanics and their subsequent alteration during seafloor hydrothermal fluid–rock interaction. We discuss the possibility that the elevated N concentrations and shifts in δ15N values in these rocks, relative to the compositions of likely protoliths, reflect additions of sedimentary/organic N during chemical/isotopic alteration that is in general similar to that observed on the modern and Mesozoic seafloor (see Li et al. Reference Li, Bebout and Idleman2007; Bebout et al. Reference Bebout, Banerjee, Izawa, Kobayashi, Lazzeri, Ranieri and Nakamura2017).
Geologic setting
The AGB (Fig. 1) is one of the most extensively studied greenstone belts in the world, as both the youngest (~2.7 Ga: Ayer et al. Reference Ayer, Ameline, Corfu, Kamo, Ketchum, Kwok and Trowell2002) and largest (~700 × 300 km; Card Reference Card1990) of the Archæan terranes (e.g. Dimroth et al. Reference Dimroth, Imreh, Rocheleau and Goulet1982, Reference Dimroth, Imreh, Goulet and Rocheleau1983a, Reference Dimroth, Imreh, Goulet and Rocheleaub; Mueller et al. Reference Mueller, Daigneault, Mortensen and Chown1996; Mueller & Daigneault Reference Mueller, Daigneault, Mueller, Daigneault, Pearson, Houle, Dostal and Pilote2006). Located on the Superior Craton of Canada and stretching west–east across the Ontario–Québec border (see Fig. 1 inset), the AGB is interpreted as a volcanic arc collage that evolved over a time span of 90 Myr (Mueller et al. Reference Mueller, Daigneault, Mortensen and Chown1996). The Hurd outcrop is located within the Blake River Segment (BRS), which constitutes one of the two tectonic blocks of the fault-bounded SVZ of the AGB (Fig. 1). Formation of the volcanic arc, represented by the SVZ, occurred during the earliest stage of the greenstone belt's development, ~2730–2698 Ma, prior to the subduction of the SVZ under the older arc represented by the Northern Volcanic Zone (Mueller et al. Reference Mueller, Daigneault, Mortensen and Chown1996; Pearson & Daigneault Reference Pearson and Daigneault2009). Bridge et al. (Reference Bridge, Banerjee, Mueller, Muehlenbachs and Chacko2010; also see Bridge Reference Bridge2008) provided a comprehensive description of the geologic setting of the BRS.
General geology of the Abitibi greenstone belt, the location of the Hurd Property outcrop in the Southern Volcanic Zone is marked by the red star. Inset map shows the position of the Abitibi Subprovince on the Canadian Shield. Modified from Mueller & Daigneault (Reference Mueller, Daigneault, Mueller, Daigneault, Pearson, Houle, Dostal and Pilote2006).
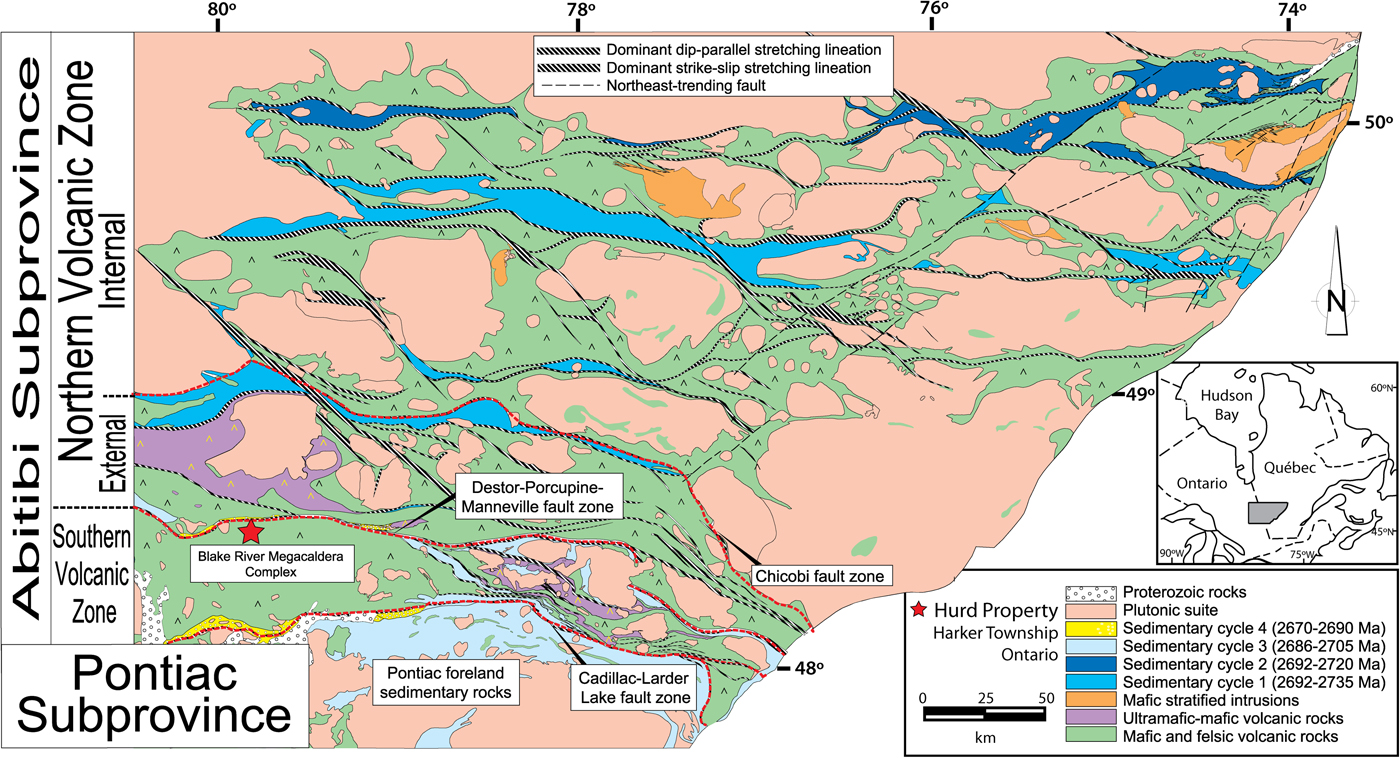
The Abitibi Subprovince has a complex tectonic history, involving regional transpressional subduction, accretion, transcurrent faulting and exhumation; however, the central part of the BRS was largely protected from deformational processes and regional metamorphic overprinting. With the exception of the areas proximal to the large fault zones (the DPMFZ and CLLFZ; Fig. 1), the BRS represents a low-strain domain largely preserving original rock fabrics and textures (Dimroth et al. Reference Dimroth, Imreh, Goulet and Rocheleau1983a; Mueller et al. Reference Mueller, Daigneault, Mortensen and Chown1996). The Hurd Property outcrop is located in Harker Township, Ontario, Canada, north of the Town of Kirkland Lake (48.48°N, 79.77°W). It is a part of the Kinojevis assemblage, which contains tholeiitic mafic and minor felsic volcanic units (Berger & Amelin Reference Berger and Amelin1999) and likely formed during a period of subaqueous, basal shield volcano building (Bridge et al. Reference Bridge, Banerjee, Mueller, Muehlenbachs and Chacko2010). The Hurd outcrop is located near a site with a U-Pb zircon age of 2701 ± 1 Ma (Ayer et al. Reference Ayer, Ameline, Corfu, Kamo, Ketchum, Kwok and Trowell2002) and is likely similar in age. Given the interior position of the Hurd outcrop in the BRS and its well-preserved, recognizable volcanic textures, the chemical trends demonstrated in this study are considered to reflect the seafloor alteration processes that occurred penecontemporaneously with magmatic eruption.
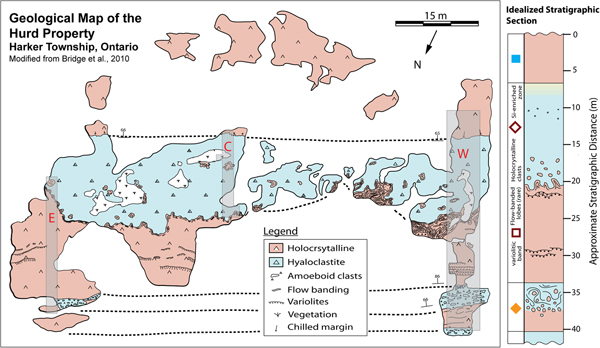
The exposure has been investigated at various scales in a series of studies beginning with that of Jones (Reference Jones1992), who interpreted the units as spherulitic basalt and variolitic intermediate flows. Scott et al. (Reference Scott, Richard and Fowler2003) argued that the units are dacitic, and Bridge (Reference Bridge2008), Bridge et al. (Reference Bridge, Banerjee, Mueller, Muehlenbachs and Chacko2010) produced a high-resolution map of a ~60 × 100 m area with a 2 m grid scale (Fig. 2) and interpreted the units to be tholeiitic basalt flows. Six subvertical units of alternating lobate to massive and brecciated hyaloclastite facies are exposed at the outcrop and shown in the representative stratigraphic section in Fig. 2. The stratigraphically lowest (oldest) unit is a poorly exposed hyaloclastite of unknown thickness and from which no samples were collected in this study. The next unit up-section, also not sampled, is a 3.9 ± 1.1 m-thick, holocrystalline massive flow that grades into an overlying 3.8 ± 0.2 m-thick, brecciated hyaloclastite unit. This hyaloclastite unit is the oldest flow represented by the sample suite collected in this study and contains abundant amoeboid, holocrystalline clasts that were likely sourced from the underlying massive flow. The outcrop is volumetrically dominated by the next two younger units: a 12.0 ± 3.0 m-thick, holocrystalline massive flow containing a zone with variolitic banding at its base and grading into 0.2–2.0 m of rocks exhibiting lobate flow facies at its upper contact; and an 11.4 ± 0.6 m-thick, brecciated hyaloclastite flow unit containing lateral zonations near its top and bottom that host amoeboid-shaped, variably altered, holocrystalline clasts. The uppermost unit at this outcrop is a holocrystalline unit with an unexposed upper contact. It is slightly coarser-grained than the underlying massive flows and has an unknown thickness and origin (i.e. it could represent an intrusive sill). Unit thickness ranges were calculated using the minimum and maximum dip angles measured at the outcrop (65° and 86°; see Fig. 2) along with the minimum and maximum measured unit thicknesses (as presently exposed).
Detailed map of the Hurd Property outcrop with the locations of the three transects mapped in 2008 (E, East; C, Central; W, West). Samples were collected at 2 m (or smaller) intervals within each transect, but not all were analysed for this study. The transect maps and flow thickness measurement calculations were combined into an idealized stratigraphic section (right). Diamonds and squares indicate the unit sources on samples on all following geochemical scatter plots. Map modified from Bridge et al. (Reference Bridge, Banerjee, Mueller, Muehlenbachs and Chacko2010).

Methods
Mapping, sampling and mineralogical characterization
Detailed mapping at the Hurd Property was focused on three transects running perpendicular to the 055° baseline of the Bridge et al. (Reference Bridge, Banerjee, Mueller, Muehlenbachs and Chacko2010) map in the central (15 m long), eastern (25 m long) and western (40 m long) sections of the outcrop (see Fig. 2). An idealized stratigraphic section for the volcanic units was constructed by referencing the three transect maps (Fig. 2). Extensive sampling along the transects, by hammer and chisel or water-cooled, diamond-tipped rock drill, was typically at about 2 m intervals but with variation in the intervals to ensure that the dominant units and their range of lithologies were well represented. Sampling was also focused near the top of the thickest and youngest hyaloclastite unit in which Bridge et al. (Reference Bridge, Banerjee, Mueller, Muehlenbachs and Chacko2010) identified distinctive titanite-mineralized tubular structures suspected to be microbial trace fossils. Transmitted-light petrography was carried out using a Nikon Eclipse LV100 POL petrographic microscope equipped with a Nikon DS-Ri1 12 Mpixel camera. Petrographic analysis, combined with sample stratigraphy from mapping, enabled the selection of representative samples for geochemical analysis, based on sample textures and mineralogy. X-ray diffraction (XRD) analysis of bulk sample powders was performed at the University of Western Ontario (UWO), using a Rigaku Rotaflex diffractometer equipped with a rotating anode source operating at 45 kV and 160 mA, with Co Kα radiation (λ = 1.7902 Å). This work confirmed the mineralogical assemblages observed in thin section and also served to identify some trace or very fine-grained minerals indistinguishable with the petrographic microscope.
Geochemical methods
Samples were first broken with a hammer, placed in a jaw crusher to produce rock chips, then powdered using a tungsten carbide ring mill. The major element compositions were obtained by X-ray fluorescence (XRF) spectroscopy at the UWO using a Phillips PW-1480 Wavelength Dispersive XRF unit. An extensive suite of trace elements (including REE, B, Li) was obtained from UWO and the Activation Laboratories Ltd. (Ancaster, Ontario, Canada; see methods provided by Activation Laboratories Ltd. at the following website: http://www.actlabs.com).
Analyses of whole-rock N concentrations and isotope compositions, the latter reported in standard δ notation relative to atmosphere (δ15Nair), were performed at the Lehigh University using a Finnigan MAT 252 mass spectrometer operated in carrier-gas mode and employing the methods described by Bebout et al. (Reference Bebout, Idleman, Li and Hilkert2007; also see Li et al. Reference Li, Bebout and Idleman2007; Bebout et al. Reference Bebout, Banerjee, Izawa, Kobayashi, Lazzeri, Ranieri and Nakamura2017). For these extremely low-N samples, approximately 300 mg of whole-rock sample powder were loaded into 6 mm (o.d.) quartz tubes along with 1 g of CuOx reagent. The tubes were evacuated overnight, heated intermittently with a heat gun during evacuation and sealed under high vacuum. The sealed tubes were heated in a programmable furnace at 1050°C for 3 h, then loaded into a tube-cracker device allowing the tubes to be cracked at high vacuum to release gases into an all-metal extraction line interfaced with a Thermo Finnigan Gas Bench II carrier gas system. The N2 was separated cryogenically from other gas phases then entrained in He carrier gas into the ion source of the mass spectrometer. Uncertainties in δ15N (expressed as 1σ) are <0.15‰ for samples with >5 ppm N and increase to ~0.6‰ for samples with 1–2 ppm N (see Bebout et al. Reference Bebout, Idleman, Li and Hilkert2007, Reference Bebout, Banerjee, Izawa, Kobayashi, Lazzeri, Ranieri and Nakamura2017; Li et al. Reference Li, Bebout and Idleman2007).
Silicate O isotope ratios, reported relative to ratios in Vienna Standard Mean Ocean Water (δ18OVSMOW), were measured at the UWO, in dual-inlet mode, using a Thermo Finnigan Delta XL mass spectrometer. Approximately 9 mg of whole-rock sample powder were loaded into spring-loaded sample holders, evacuated overnight at ~150°C, and then loaded into Ni reaction vessels and evacuated for another 3 h at 200°C. The sample powders were then reacted overnight at ~580°C with ClF3 to release the silicate-bound O (see Clayton & Mayeda Reference Clayton and Mayeda1963; Borthwick & Harmon Reference Borthwick and Harmon1982), which was then converted to CO2 for isotopic measurement.
Results
Mineralogy and petrography
All samples experienced greenschist-facies alteration but have largely retained the primary textures of their protoliths. Thus, the prefix ‘meta-’ is omitted from all rock identifications for ease of reference to the dominant sample textures. Thin sections reveal a classic greenschist-facies alteration assemblage of albite, chlorite, quartz, actinolite, magnetite and calcite (Fig. 3; Appendix A). Other calcic phases typical of greenschist-facies alteration (e.g. epidote) are rare in the sample suite. The holocrystalline samples contain dominantly albite, actinolite, magnetite, chlorite, quartz and trace calcite. The dominant phases in the hyaloclastite samples are chlorite, quartz and a palagonite-like assemblage of very fine-grained clays and silica with traces of other phases (e.g. oxides, oxyhydroxides, zeolites, titanite). These secondary phases formed by replacement of the original palagonite that represents hydration and low-temperature alteration of basaltic glass. Powder XRD analyses confirmed the presence of the dominant mineral phases: chlorite, quartz and albite, and also indicated the presence of accessory titanite, illite and trace epidote. Appendix A provides more detailed petrographic descriptions, including photomicrographs (Fig. A1) and Table A1 the latter presenting a summary of the mineralogy and textures in the holocrystalline and hyaloclastite samples.
Photomicrographs of the various extents of shard deformation and palagonitization exhibited in the Hurd Property hyaloclastite samples. (a) 07RN-33 and (b) 38-KH08 represent autobrecciated clasts with subangular to angular and cuspate shards rimmed with palagonite (brown). Fibrous growth texture is evident in the palagonite (b). (c) 02-KH08 and (d) 05-KH08 represent rounded and mildly fractured clasts that have non-distinct palagonite rims. (e) 03-KH08 and (f) 06-KH08 represent the most extensively fractured and palagonitized shards.
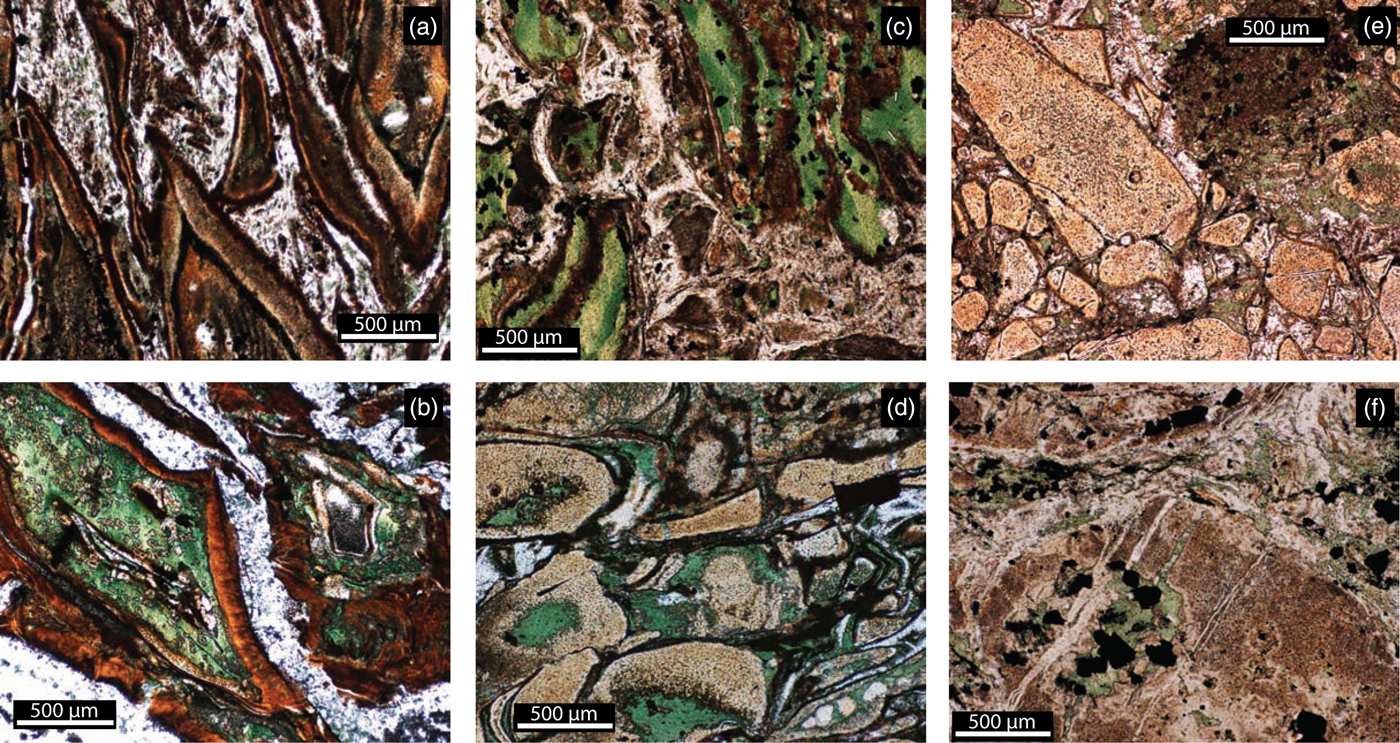
Formerly glassy clasts within the hyaloclastite samples exhibit a wide range of shapes and textures, from cuspate, distinctly palagonite-rimmed (Fig. 3(a) and (b)); to subangular (Fig. 3(c) and (d)) and highly rounded, fractured and pervasively palagonitized (Fig. 3(e) and (f)) shards. Fine- to medium-grained chlorite, and fine- to coarse-grained magnetite and other opaque minerals (most of them probably pyrite-dominated sulfides) replaced non-palagonitized areas of the hyaloclastite glass. The chlorite is chiefly observed in the shard cores and in patches among the palagonite zones of the more heavily fractured clasts. Magnetite mostly occurs associated with chlorite. Round inclusions of quartz rimmed by a brown material, possibly a clay phase, are a less common feature within the altered clasts. A few of the hyaloclastites, specifically those with subangular to angular/cuspate clasts (Fig. 3(a) and (b)), contain tubular and granular structures of varying length and morphology filled with fine-grained titanite, which may be titanite-mineralized microbial ichnofossils (see McLoughlin et al. Reference McLoughlin, Staudigel, Furnes, Eickmann and Ivarsson2010). The interstices among the clasts mostly contain fine-grained quartz with some very coarse-grained (>1 mm) calcite. Chlorite is less abundant in the interstitial spaces and, where present, is commonly clustered near shard boundaries. In some samples, the clasts are very closely packed, leaving minimal interstitial space (i.e. the samples are clast-supported; Fig. 3(e) and (f)).
Major and trace element compositions
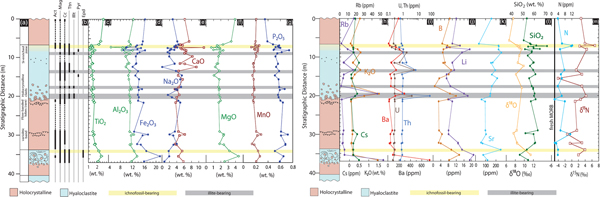
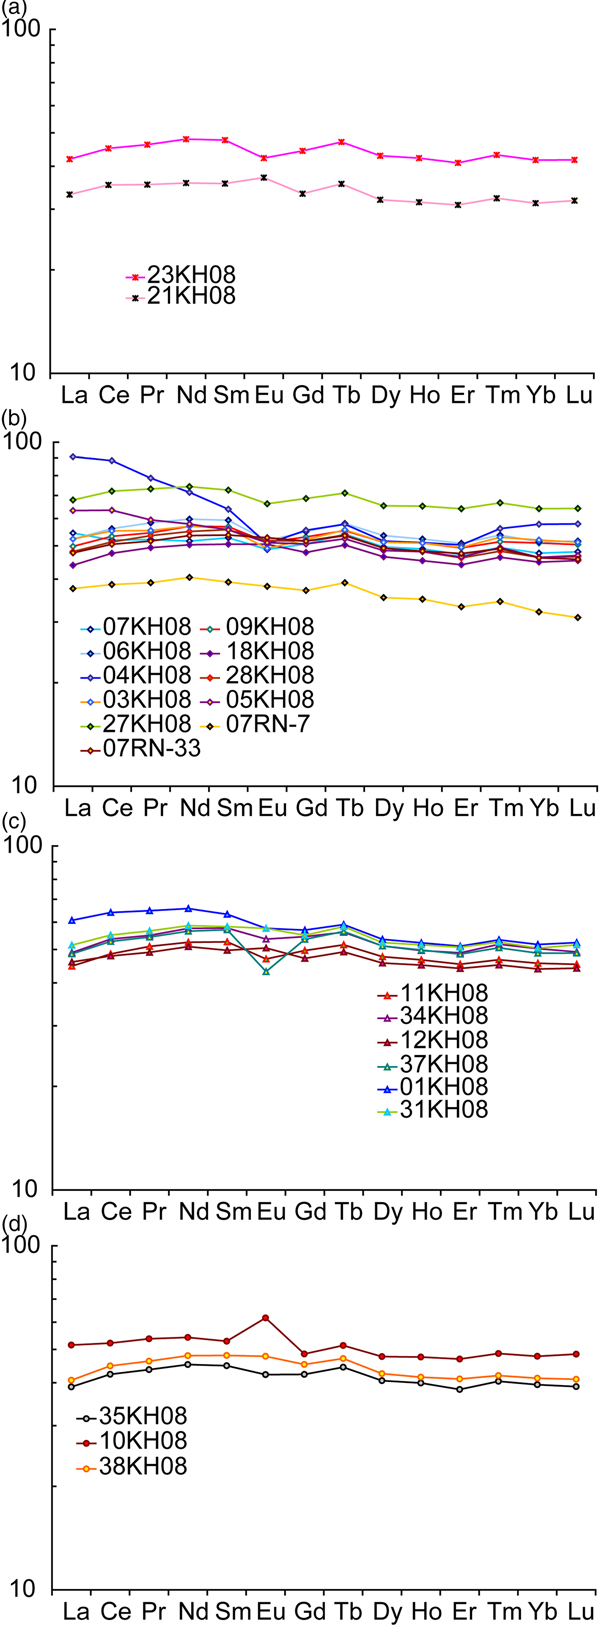
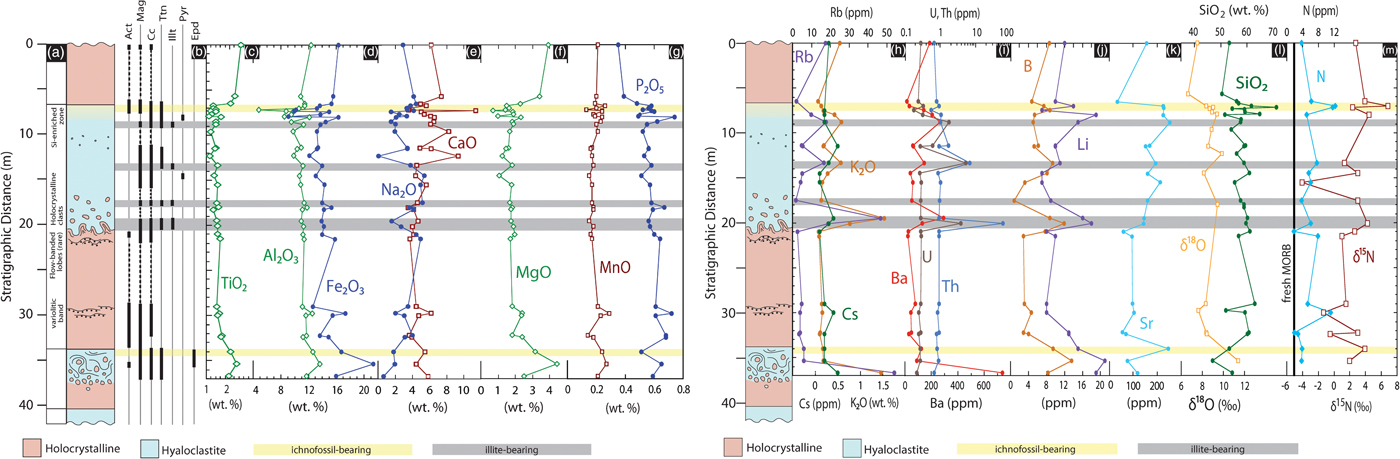
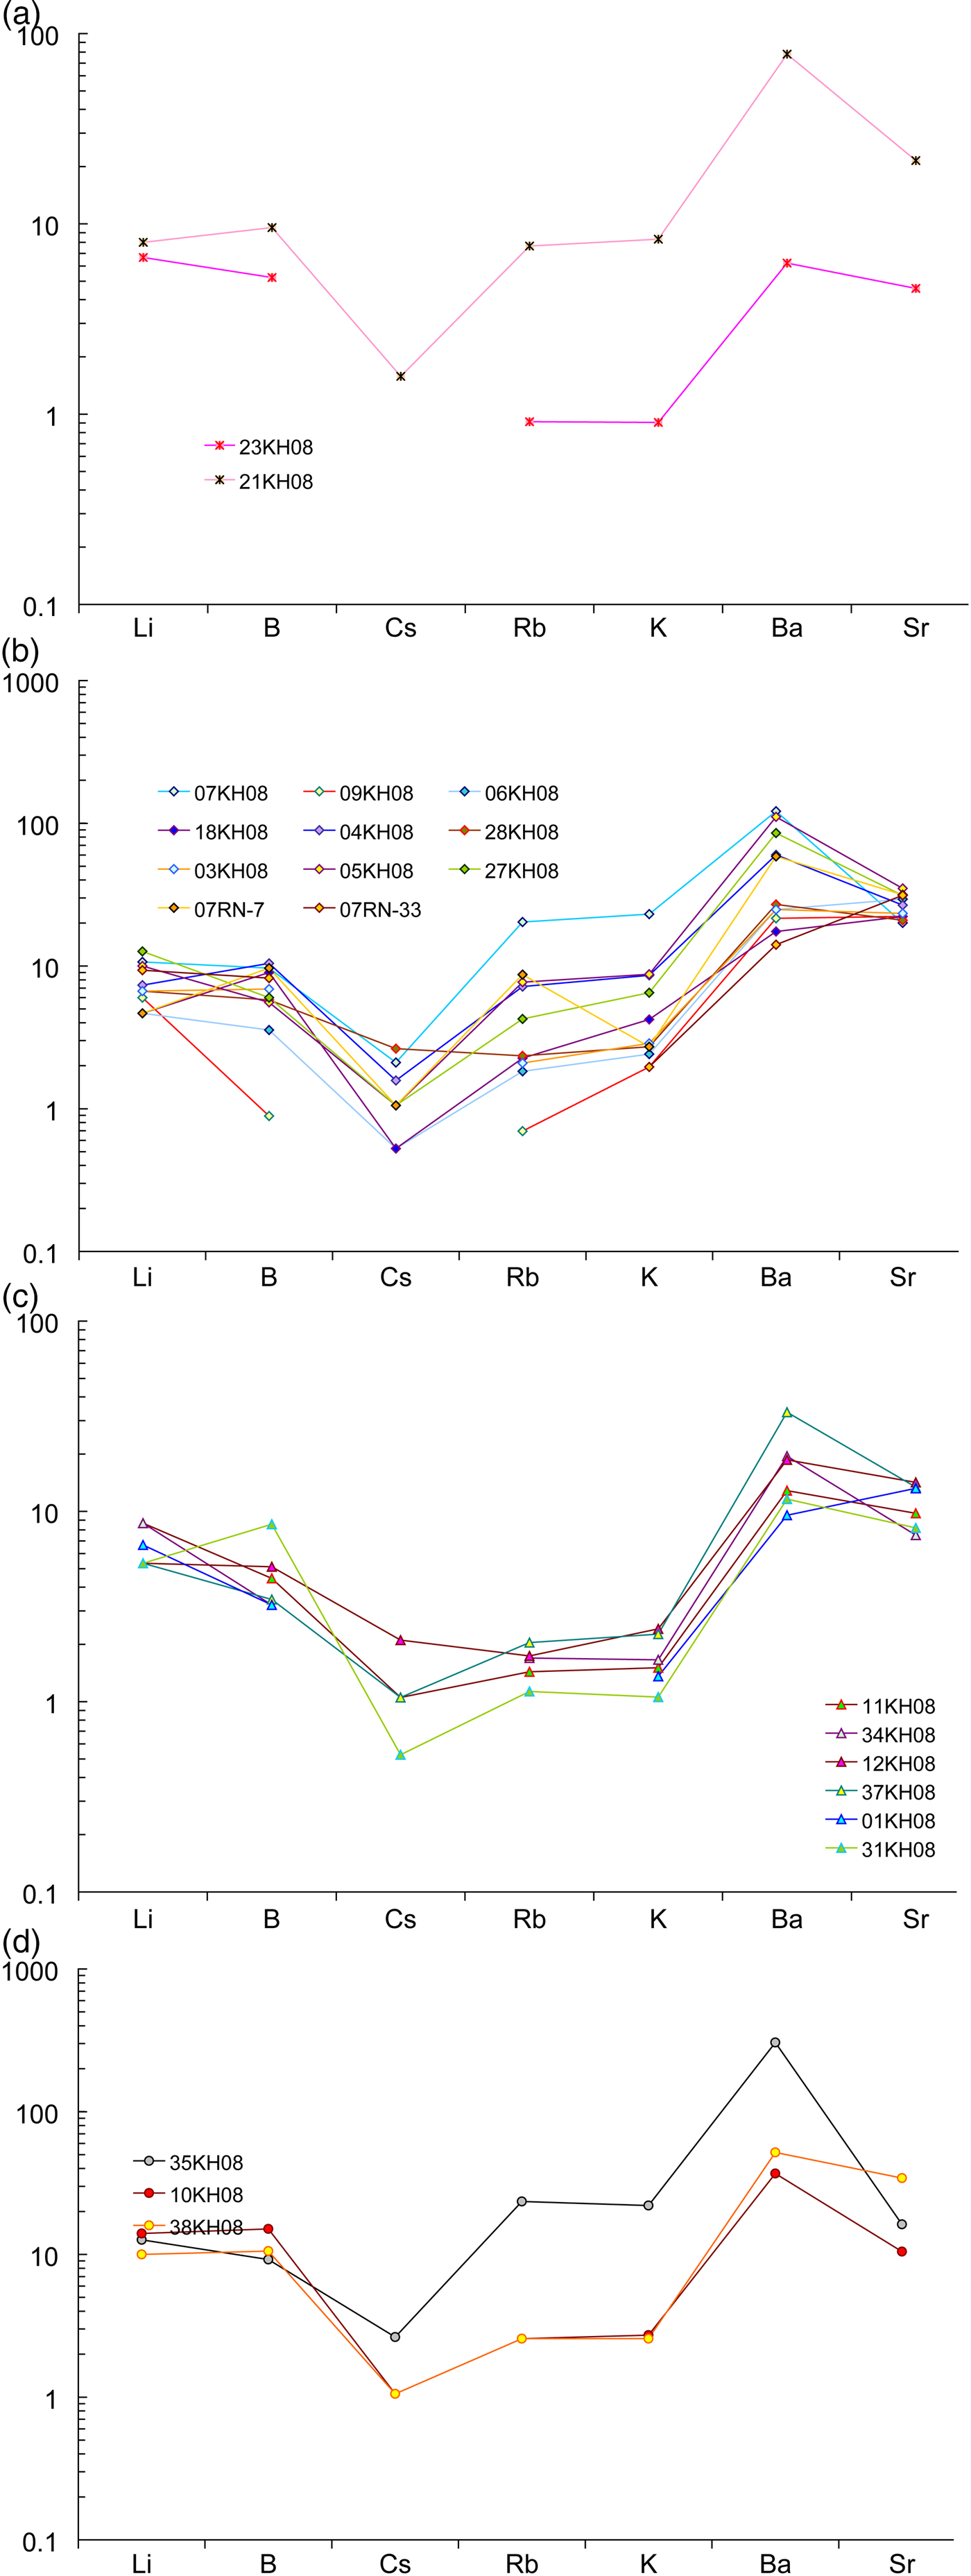
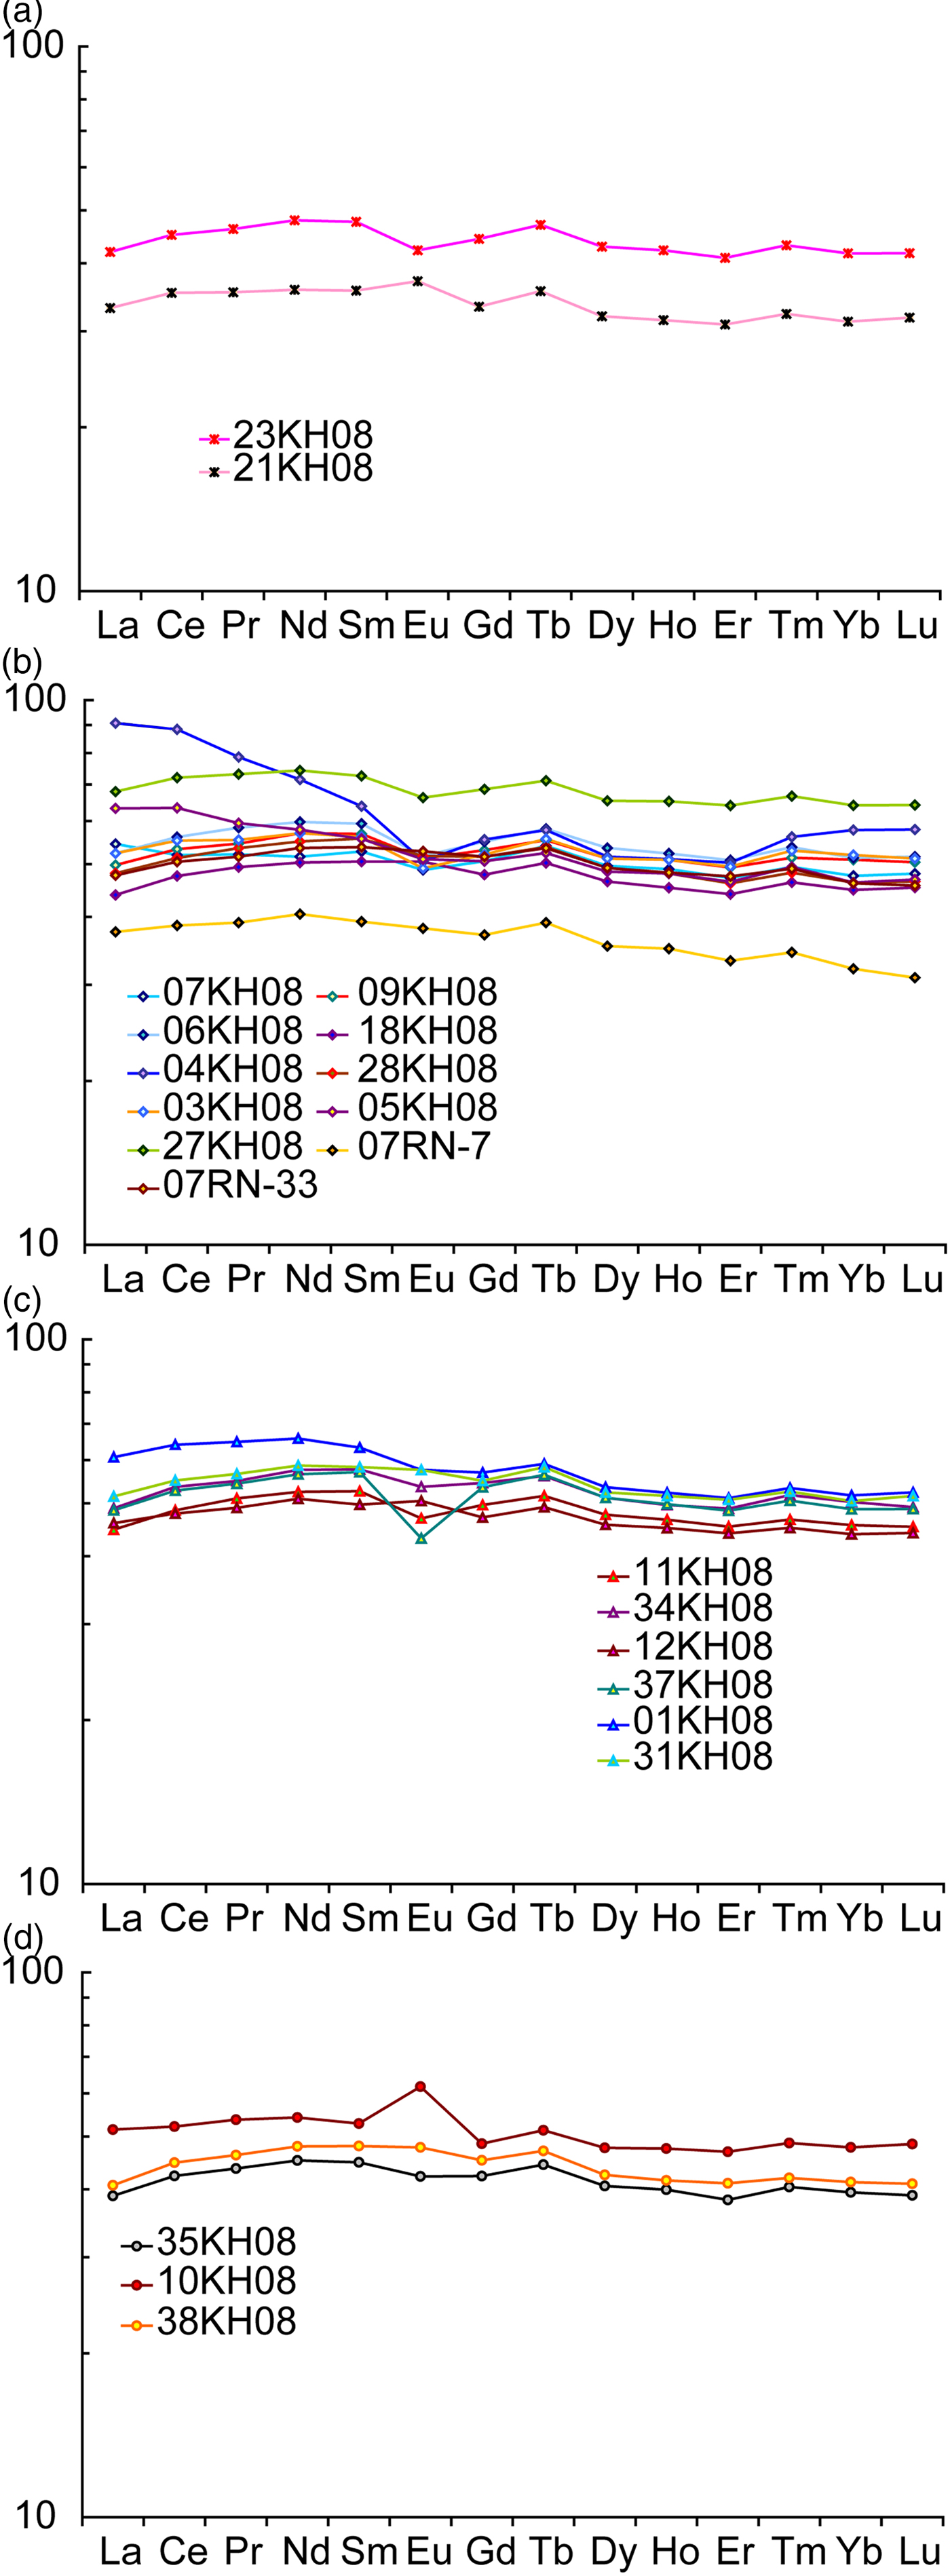
Figure 4 presents the major and some trace element data as a function of stratigraphic position. The Hurd samples contain 47–63 wt.% SiO2, with the highest concentrations occurring in samples from the SiO2-enriched zone at the upper contact of the thickest hyaloclastite unit (Fig. 4(l)). The TiO2 concentrations at Hurd are 1.3–2.5 wt.%, and appear to remain relatively uniform throughout the section except in the uppermost holocrystalline unit. Concentrations of MgO and CaO in the Hurd samples (1–4 and 3–7 wt.%, respectively) are lower than concentrations in modern MORB (Fig. 4(e) and (f)). CaO and Na2O concentrations appear to be anti-correlated (Fig. 4(e)), and K2O is highly variable within each unit of the Hurd outcrop, especially within the hyaloclastite units (Fig. 4(h)), consistent with the influence of plagioclase. Large-ion lithophile elements (LILE) Cs, Rb, Ba, K and Sr, generally regarded as relatively fluid-mobile elements, are variably enriched in the brecciated hyaloclastite units at the Hurd Property while remaining relatively uniform in the massive holocrystalline units (Fig. 4(h), (i) and (k)). Boron and Li concentrations vary in a similar manner to the LILE, as do U and Th concentrations, with the highest concentrations of all of these elements occurring within the same horizons of the stratigraphic section (Fig. 4(j)). Hyaloclastites are enriched in fluid-mobile elements, with LILE signatures broadly consistent with subseafloor hydrothermal alteration (Fig. 5). Rare earth element (REE) patterns are generally flat, with chondrite normalized La/Yb (La/YbN) values close to unity (Fig. 6).
Representative stratigraphic section of the volcanic units at the Hurd Property. (a) Description of volcanic facies and sample locations relative to the section. (b) Mineral occurrence diagram showing the presence of amphibole (Amp), magnetite (Mag), calcite (Cc), titanite (Ttn), illite (Illt), pyrite (Py) and epidote (Ep). Albite, chlorite and quartz have been omitted from the diagram because of their occurrence in every sample. (c–g) The major oxide element concentrations plotted as a function of their position in the section. Note that there are additional data in these plots, which are sourced from Bridge et al. (Reference Bridge, Banerjee, Mueller, Muehlenbachs and Chacko2010). (h–k) Large-ion lithophile and fluid-mobile element concentrations as a function of depth. (l) Oxygen isotope composition and SiO2 concentrations. (m) Nitrogen isotope compositions and N concentrations. Horizontal shaded bars represent the ichnofossil-bearing horizons (yellow) and illite-bearing horizons (grey).
Abundances of fluid-mobile elements, normalized to CI chondrites (values of McDonough and Sun Reference McDonough and Sun1995). (a) Uppermost stratigraphic unit, uppermost hyaloclastite unit (0–7 m); (b) thick hyaloclastite unit (7–21 m); (c) massive holocrystalline unit (21–34 m) and (d) oldest hyaloclastite (34–37 m).
Rare earth element (REE) patterns for Hurd volcanics, normalized to CI chondrites (values of McDonough and Sun Reference McDonough and Sun1995). (a) Uppermost stratigraphic unit, uppermost hyaloclastite unit (0–7 m); (b) thick hyaloclastite unit (7–21 m); (c) massive holocrystalline unit (21–34 m) and (d) oldest hyaloclastite (34–37 m).
Stable isotope compositions
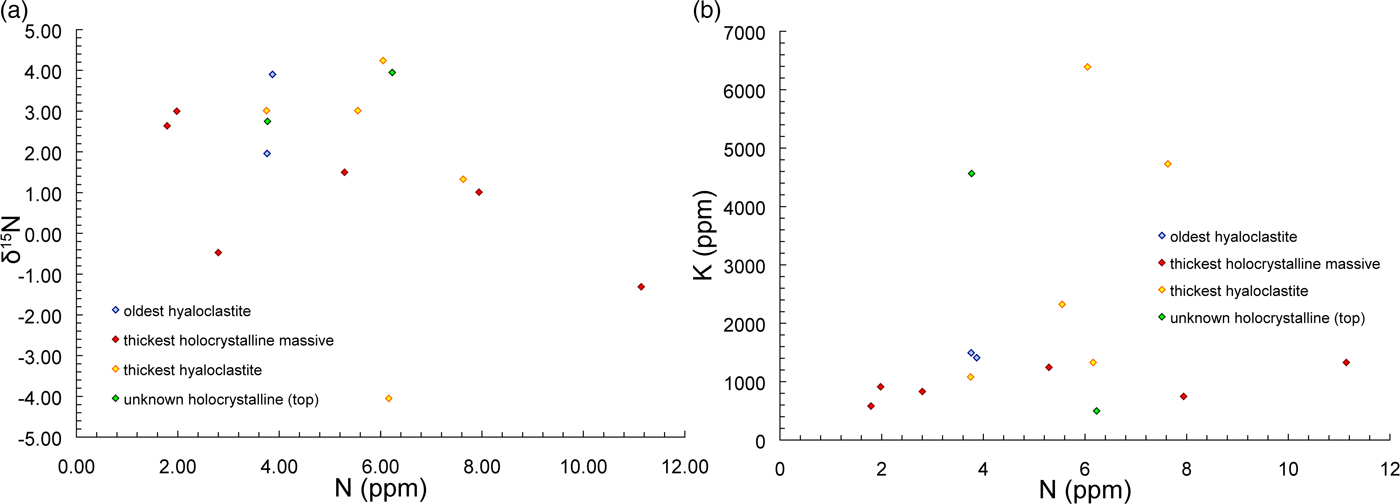
Eighteen samples contain 1–13 ppm N (mean ~6 ppm) and δ15N values ranging from −4 to +7‰ (mean = +2‰; Fig. 4(m)). There is no obvious correlation between N concentration and δ15N (Fig. 7(a)). Nitrogen concentrations are weakly correlated with those of K (Fig. 7(b)), but the correlation breaks down for samples greatly enriched in K (>1000 ppm), including most of those from the thickest hyaloclastite unit.
Silicate-hosted N concentrations and δ15N values of the Hurd Property samples. (a) N content versus isotope concentration showing no obvious correlation within the sample suite. Within each unit, however, a few trends emerge, including the Hurd unit 2b and 2c (see unit designations in Fig. 2) samples that contain ichnofossils having greater N contents than the other samples in their unit and mostly higher δ15N as well. (b) Nitrogen content versus K content, showing weak correlation of N and K related to the substitution of NH4+ for K+.
Seventeen silicate O isotope analyses obtained in this study and nine additional analyses obtained by Bridge et al. (Reference Bridge, Banerjee, Mueller, Muehlenbachs and Chacko2010) show a range in δ18O of +6 to +12‰ with a mean value of +8.6‰ (Fig. 4(l)). The hyaloclastites tend to exhibit δ18O values most shifted from magmatic values (the latter near +6‰), suggesting that those units experienced more extensive fluid rock interactions and consistent with oxygen isotope compositions of modern altered oceanic crust. The correlated SiO2 content and silicate δ18O observed in highly silicified seafloor volcanics in the Barberton greenstone belt (Hofmann & Harris Reference Hofmann and Harris2008) was not observed in this suite.
Discussion
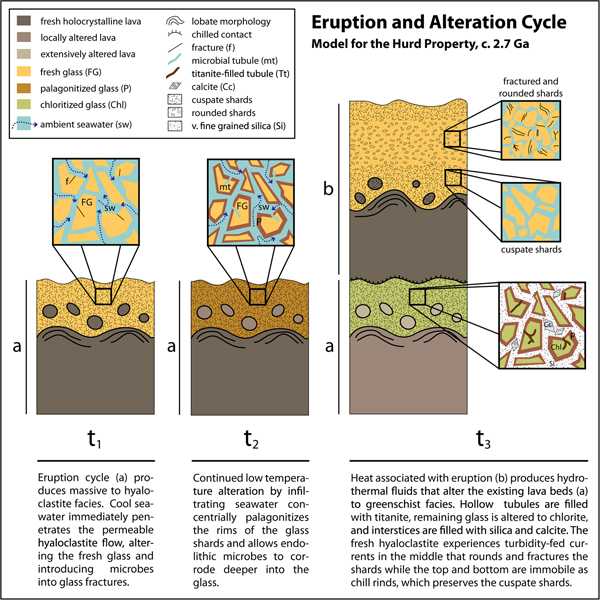
A model for the eruption and alteration cycles at the Hurd outcrop, based on volcanologic, petrographic and geochemical evidence, is presented in Fig. 8 and described in the following sections. Following eruption, each lava unit was altered by cool, infiltrating seawater that possibly introduced microbes into the glassy deposits. Later eruption events heated crustal pore waters, which produced evolved hydrothermal fluids. These hotter fluids altered the existing, cooled volcanic flows to greenschist grade, while the freshly formed, hotter lava deposited on top interacted only with cool seawater. The hydrothermal fluids likely exceeded temperatures suitable for life and silicified any remaining pore space in the older volcanic units, but the younger deposits would provide a new habitat for endolithic microbes, continuing the cycle.
Conceptual model of the eruption, alteration and microbial colonization cycles at the Hurd outcrop with a summary of events during each point in time, t1, t2 and t3; (a) and (b) indicate the specific eruption cycle units. Note that flow thicknesses and effects of subsidence are not indicated because the diagram is not spatially scaled.

Volcanic protolith
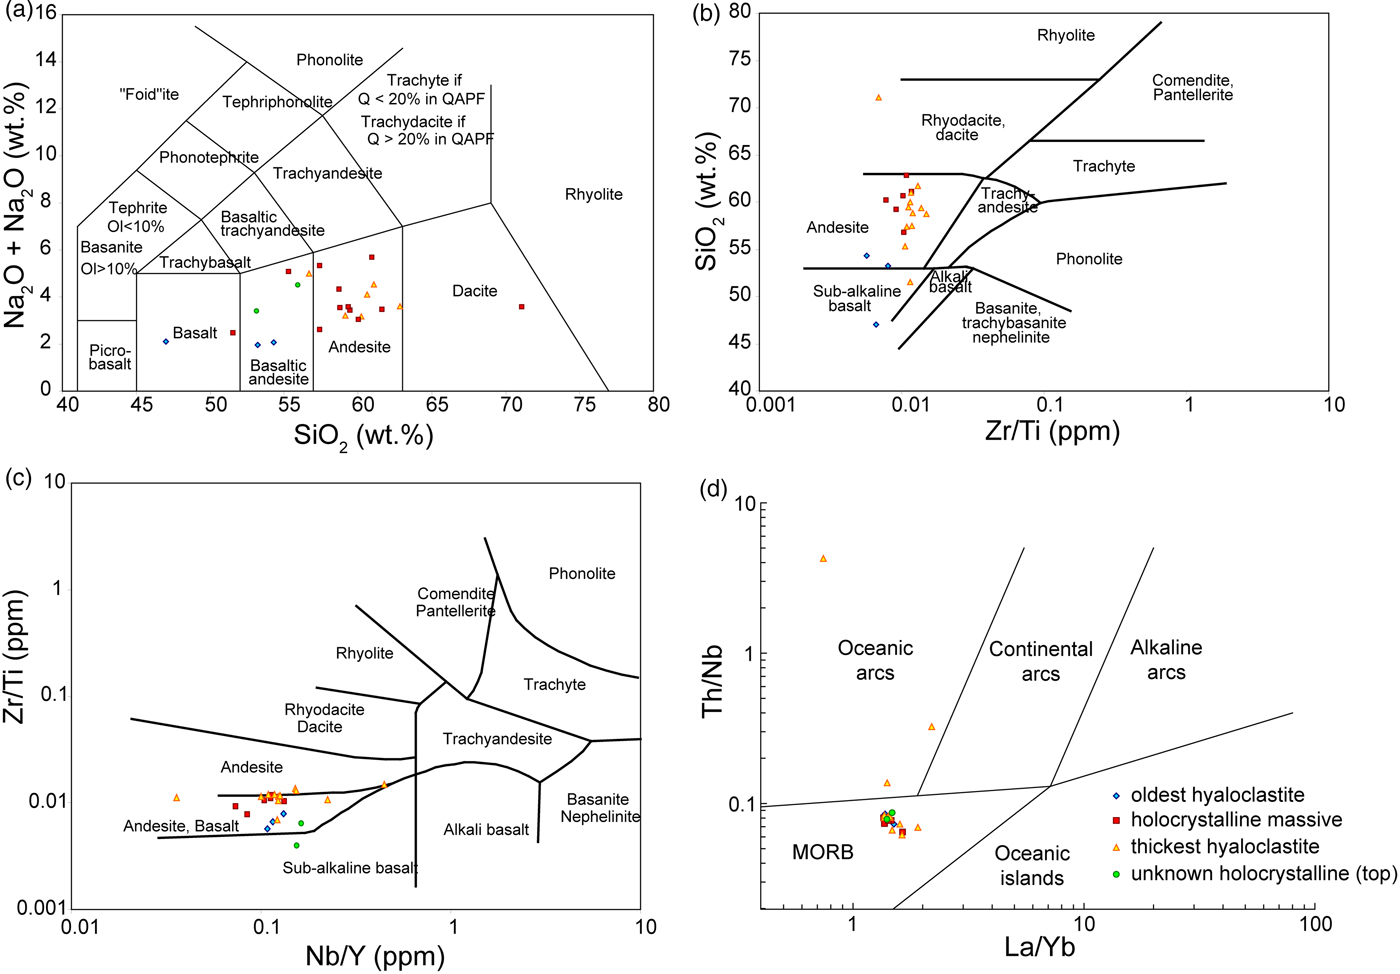
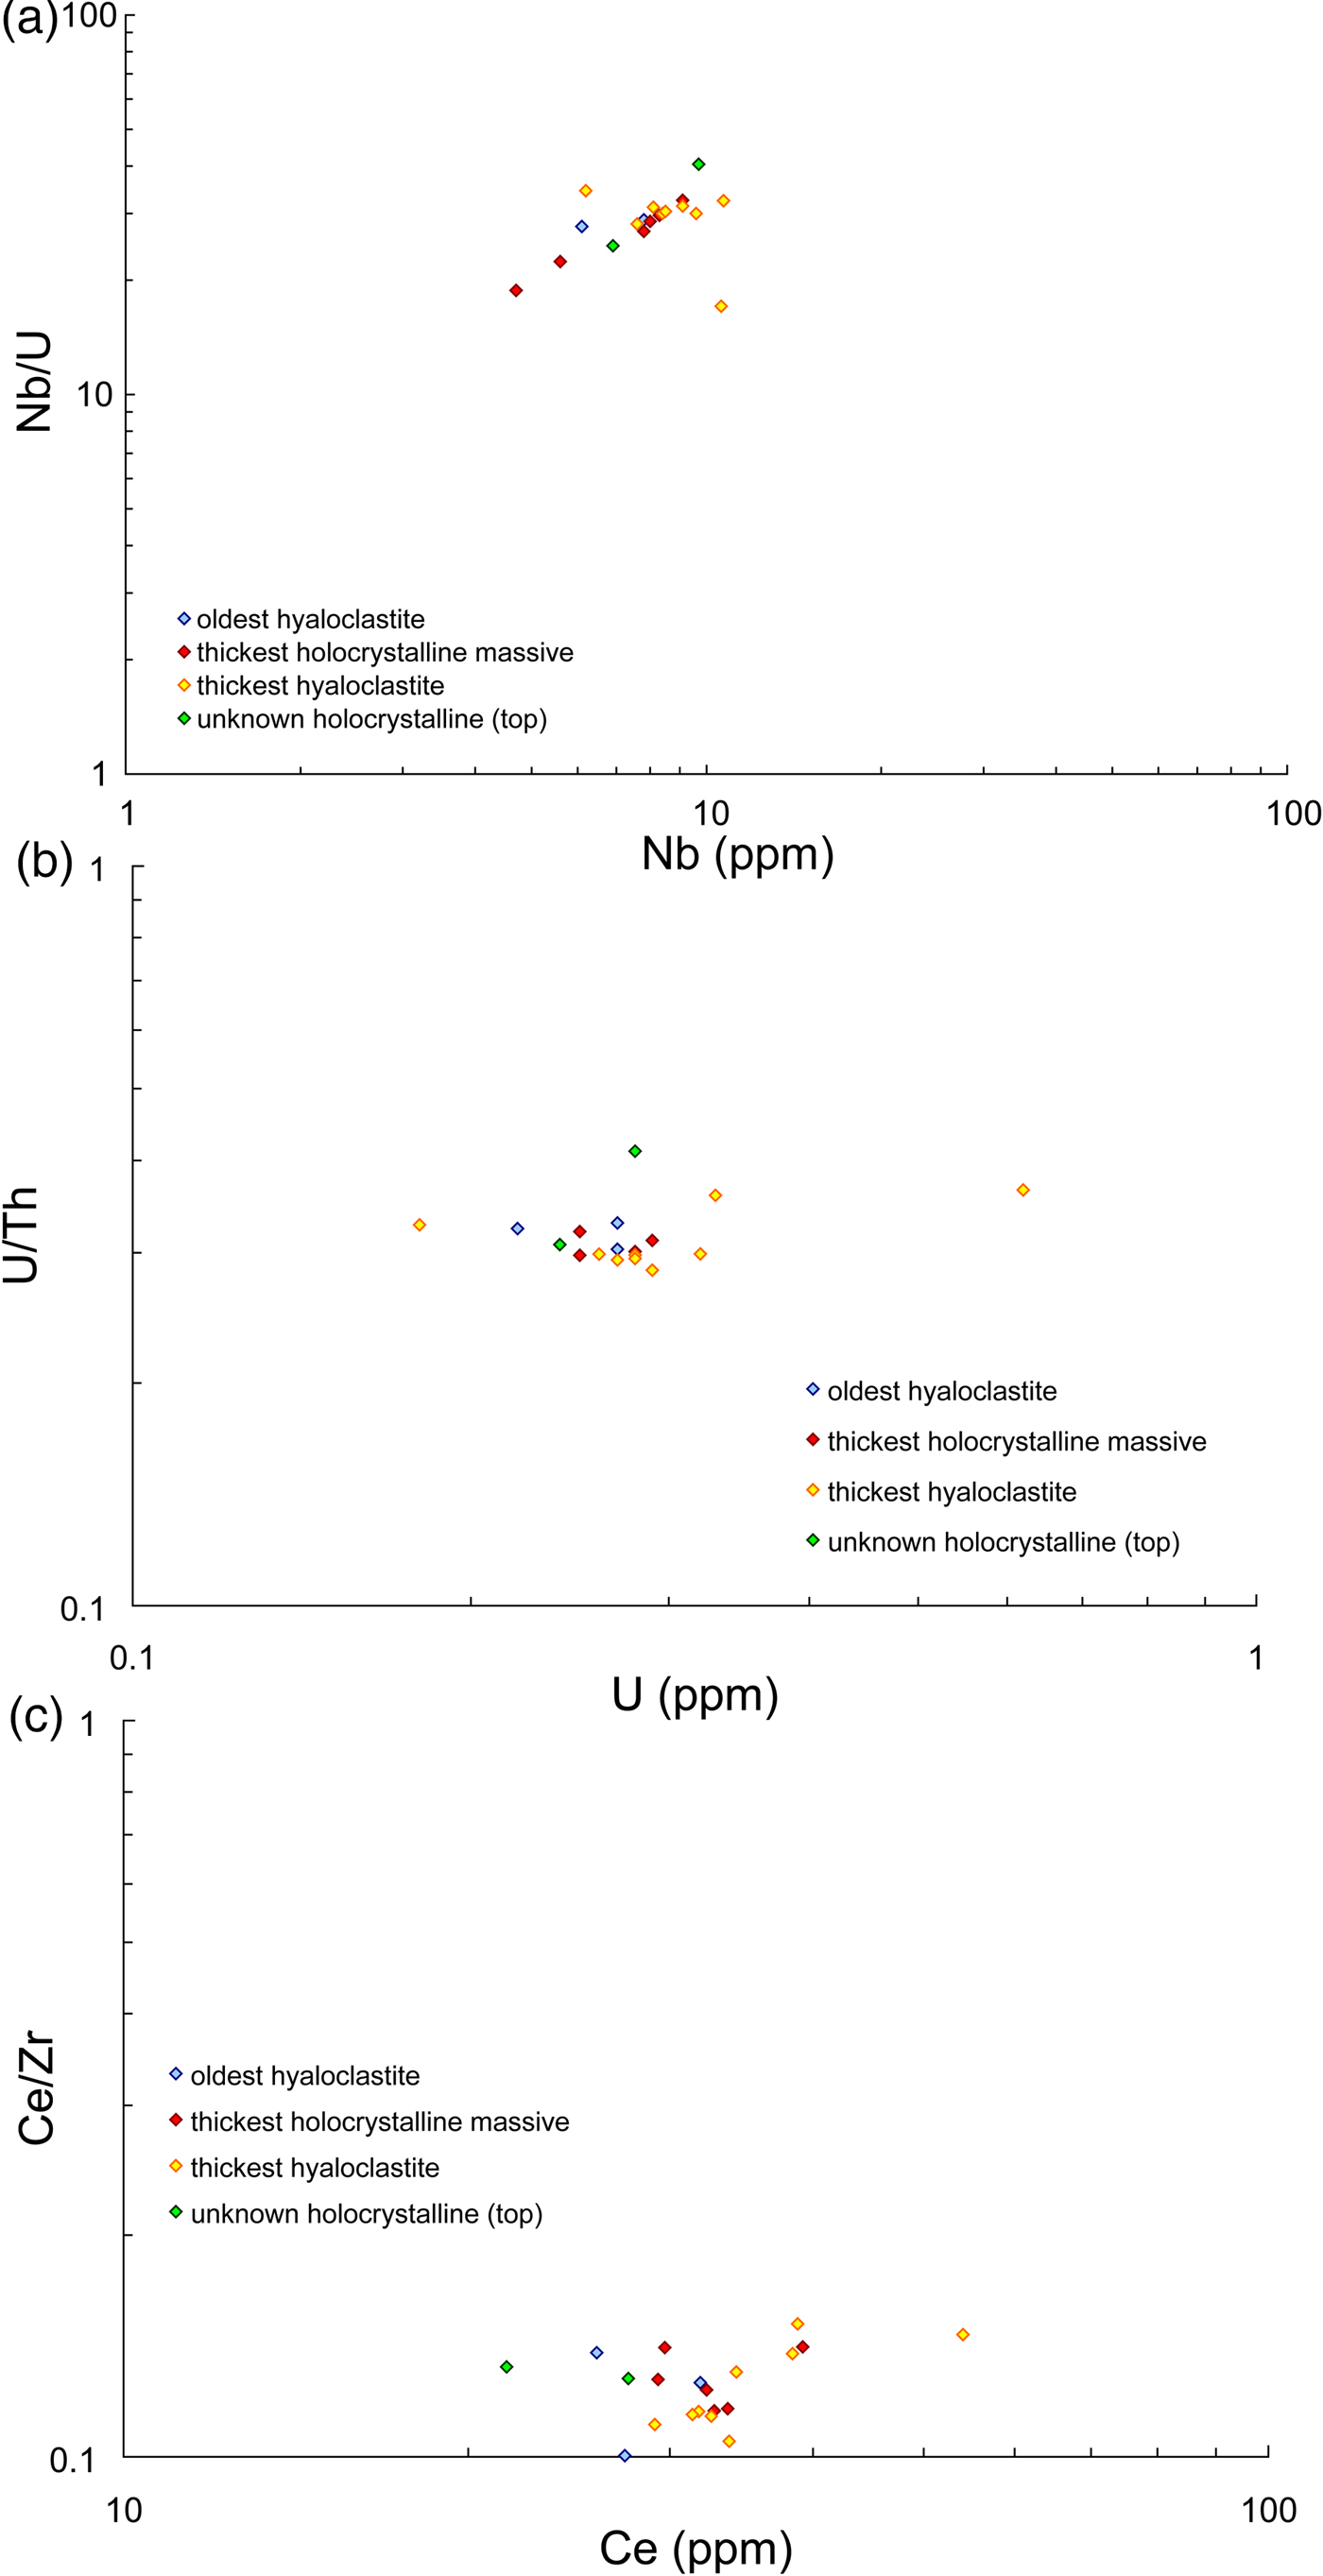
To date, the three studies considering the Hurd outcrop volcanics have proposed three different volcanic protoliths: subaqueous intermediate tholeiites (Jones Reference Jones1992), subaerial dacites (Scott et al. Reference Scott, Richard and Fowler2003) and subaqueous basaltic tholeiites (Bridge et al. Reference Bridge, Banerjee, Mueller, Muehlenbachs and Chacko2010). The major element oxide concentrations of the rocks were altered from initial whole-rock levels by subsequent fluid–rock interactions, so they are usually not reliable indicators of protolith composition in altered rocks. High-field strength elements, such as Ti, Zr, Nb, Ta, Y, U, Th and the REE, are regarded as being relatively immobile during fluid–rock interactions of seafloor alteration and up to mid-amphibolite facies metamorphic grades (Rollinson Reference Rollinson1993). The trace element data obtained in this study, therefore, enable a more confident assessment of the Hurd outcrop volcanic protolith. Geochemically, the Hurd samples resemble an evolved, or intermediate, tholeiitic sequence as originally proposed by Jones (Reference Jones1992). The Hurd samples fall in the range of evolved magmas of andesitic to dacitic composition in the total alkali-silica diagram (Fig. 9(a); LeBas et al. Reference LeBas, LeMaitre, Streckeisen and Zanettin1986), and in the andesite range on the SiO2-Zr/Ti diagram (Fig. 9(b); Winchester & Floyd Reference Winchester and Floyd1977); however, the use of these discrimination diagrams for these rocks is very possibly compromised by the seafloor metasomatism experienced by the Hurd volcanics. Discrimination diagrams based on immobile elements less susceptible to the effects of hydrothermal alteration and weathering show that Hurd samples fall within the ‘basaltic andesite’ and ‘andesite’ fields (e.g. Zr/Ti versus Nb/Y ratios; see Fig. 9(c); Winchester & Floyd Reference Winchester and Floyd1977). The tholeiitic nature of the Hurd volcanics is further demonstrated by the Th/Nb versus La/Yb discrimination diagram (Fig. 9(d); Hollocher et al. Reference Hollocher, Robinson, Walsh and Roberts2012) demonstrating MORB-like, anorogenic affinities for the Hurd volcanics. Ratios of Nb/U, U/Th and Ce/Zr remain largely uniform with increasing concentrations of the individual elements throughout the sample suite, an observation consistent with co-enrichment by progressive magmatic differentiation via fractional crystallization (Fig. 10).
Geochemical discrimination diagrams with data for the Hurd Property samples. (a) Total alkali versus silica (TAS) diagram showing the broadly tholeiitic affinity of the Hurd Property rocks. (b) Alternative discrimination diagram using Zr/Ti instead of total alkalis (which are presumably more strongly affected by postmagmatic processes), showing the same tholeiitic affinity. Volcanic classification diagrams employing high-field strength elements. (c) Zr/TiO2 ratio versus Nb/Y ratio demonstrating the intermediate basaltic andesite to andesite nature of the Hurd Property samples. (d) TiO2 versus Zr concentrations demonstrating the intermediate nature of the Hurd Property samples whose Ti and Zr contents resemble within-plate lavas more than they resemble volcanic arc lavas (indicating a lack of crustal contamination).
Ratios of elements with similar compatibility versus concentration show uniform ratios with enrichment, consistent with by progressive magmatic differentiation via fractional crystallization. (a) Nb versus Nb/U; (b) U versus U/Th and (c) Ce versus Ce/Zr.
Further consideration of the physical volcanology observed at the outcrop confirms an intermediate tholeiite protolith. In an idealized basaltic eruption, pillow-like flows develop between the initiating massive and terminating hyaloclastite facies as the eruption wanes (Staudigel et al. Reference Staudigel, Plank, White, Schmincke, Bebout, Scholl, Kirby and Platt1996). Commonly, when pillows are present, the hyaloclastite deposit thicknesses are minimal and may include spalled pieces of the glassy pillow rims. Volcanic pillow morphologies become far less common in more siliceous eruptions involving higher viscosity magmas and are commonly replaced with more explosive, pyroclastic eruptions and glassy deposits (Condie Reference Condie and Condie1981). The two flow facies at the Hurd outcrop, a massive to lobate, holocrystalline flow and a hydroclastic, or brecciated, hyaloclastite deposit, share gradational boundaries with hyaloclastite units commonly hosting clasts from the underlying massive basalts. This indicates that the two complete volcanic cycles exposed at the Hurd outcrop never developed flows with pillow morphologies. This conclusion is also supported by the evidence for minimal deformation at the outcrop scale, which precludes the possibility that any pillowed flows that may have formed were later displaced from the stratigraphic section.
Although pillowed flows are completely absent at the Hurd outcrop, nearby outcrops of similarly aged mafic units host thick units of variolitic basalt pillows (Jones Reference Jones1992). This observation indicates that coeval Archæan subaqueous basaltic eruptions were constructed in a similar manner to that of modern seafloor volcanic sections. The absence of pillowed flows at the Hurd outcrop, but presence in nearby sections, can be explained by differing magma compositions at the outcrops. Archæan andesites commonly occur primarily as tuffs, breccias and agglomerate flows where the ratio of explosive to effusive flows increases with increasing stratigraphic height and decreasing distance to eruptive centres (Condie Reference Condie and Condie1981). Eruption-fed turbidity currents, where water is a continuous intergranular phase of the particulate flow, dominate these occurrences, and turbulence is a particle support mechanism (White Reference White, Eriksson, Altermann, Nelson, Mueller and Catuneanu2004). In these turbidity currents, vertical (or lateral) segregation of the flow unit occurs, and is possibly due to, some parts of the current dominated by intergranular collisions causing extensive shard fracturing and rounding of edges. Lateral zonation is clearly evident in the thickest hyaloclastite flow at the Hurd outcrop where the middle portion is dominated by rounded and fractured glass-rich clasts, and appears to be clast-supported. This is in contrast to the upper and lower zones of the same unit where pristine cuspate clasts are preserved within a matrix of fluid-precipitated silica. The middle part of the thickest hyaloclastite deposit thus resembles the eruption-fed turbidity currents characteristic of modern subaqueous siliceous magma flows and would have flowed between two chilled rinds of autobrecciated glass that cooled immediately upon contact with old, cold seafloor below and cool seawater above.
Based on the considerations above, the volcanic protolith of the Hurd outcrop rocks was likely an intermediate tholeiitic composition of anorogenic origin, similar to an icelandite. This does not necessarily imply volcanic arc, crustal mixing or subduction-related processes. Trace element systematics of the Hurd outcrop display a tholeiitic affinity and are most consistent with a within-plate setting. An anorogenic origin for the intermediate tholeiites is also supported by the age estimate of the Hurd outcrop. The volcanic flows were erupted at ~2701 Ma (Ayer et al. Reference Ayer, Ameline, Corfu, Kamo, Ketchum, Kwok and Trowell2002) during the subaqueous development of the shield volcano that became the SVZ (Mueller et al. Reference Mueller, Daigneault, Mortensen and Chown1996). This predates, by ~5 Ma, the earliest age of subduction between the Southern and Northern Volcanic Zones; thus, crustal mixing likely was not involved in the formation of the Hurd outcrop magmas. Furthermore, fractional crystallization has been proposed for some rare andesitic to rhyolitic rocks in well-developed mafic assemblages on the Ontario side of the BRS (Jackson et al. Reference Jackson, Fyon and Corfu1994). The evolved units can be derived by extensive fractionation of mafic tholeiitic parent magma, which are classified as THOLKOM-type (tholeiitic–komatiitic-type) assemblages (Jackson et al. Reference Jackson, Fyon and Corfu1994). The Hurd Property outcrop is part of the Kinojevis assemblage, which is classified as a THOLKOM and is therefore a potential candidate for having experienced extensive fractional crystallization. It is possible that the higher heat flux from the Archæan mantle (Davies Reference Davies1980) supported a shallow, more differentiated magma body in the precaldera, shield volcano-building setting.
Conceptual model of alteration
Petrographic results suggest that the Hurd outcrop samples were affected by at least two types of alteration: low-temperature seafloor alteration involving primarily seawater that resulted in glass dissolution, indicated by the palagonite phase in glass clasts (<150°C); and higher temperature hydrothermal alteration involving evolved fluids, indicated by the chlorite-replaced glass and greenschist-grade secondary mineral assemblages of the holocrystalline samples (~250–350°C). The following sections describe the inferred sequence of these paragenetic events.
Low-temperature seafloor alteration
Fluid–rock interactions at the seafloor interface constitute a large portion of global element cycling, with low-temperature basalt alteration and glass dissolution allowing the exchange of many elements between seawater and oceanic crust. Due to its amorphous and unstable structure, volcanic glass is particularly susceptible to alteration by seawater. Palagonite is the most common alteration product of glass and is described as an intermediate gel-like, heterogeneous material (Stroncik & Schmincke Reference Stroncik and Schmincke2001). The gel-like palagonite is also thermodynamically unstable and is later replaced by clays and zeolites (Stroncik & Schmincke Reference Stroncik and Schmincke2001). The step producing gel-like palagonite involves congruent dissolution and manifests itself in modern samples as a smooth and distinct boundary between fresh glass and the alteration material, with the alteration product progressing concentrically inwards to the shard centre (Stroncik & Schmincke Reference Stroncik and Schmincke2001). This characteristic texture is observed in the cuspate glass shards of the Hurd hyaloclastites (Fig. 3(a) and (b)) where there are distinct regions of altered glass (brown palagonite rims) and preserved fresh glass now altered to chlorite. The palagonite phase in these samples is relatively free of inclusions and in some areas exhibits fibrous textures perpendicular to the glass alteration front, a common texture in crystallized palagonite (i.e. a mix of clay compositions; Stroncik & Schmincke Reference Stroncik and Schmincke2001, Reference Stroncik and Schmincke2002). Stroncik & Schmincke (Reference Stroncik and Schmincke2002) note that (gel-like) palagonite generally has a sponge-like texture with large amounts of heterogeneously distributed pores, and may contain spherical structures, which Zhou et al. (Reference Zhou, Fyfe, Tazaki and Vandergaast1992) had interpreted to be microcrystalline precursors of smectite. Textures resembling this description are found in the more rounded and fractured shards that are pervasively palagonitized (Fig. 3(c)–(f)). The rate of glass dissolution in these samples was undoubtedly catalysed by the high fracture density and increased surface area. Gel-palagonite formed quickly and non-uniformly (i.e. not in concentric layers) due to increased access of fluids into the rounded glass shards resulting in patchy or sponge-like textures that are heavily included by secondary mineral phases, including fine-grained quartz, chlorite, calcite and opaque minerals. These secondary mineral phases might have formed coevally with the silicification of the gel-like palagonite into its current crystalline phase.
Smectite is the dominant phase in modern crystallized palagonite but additional phases that commonly replace gel-like palagonite include other clay minerals, carbonates, zeolites, and Fe-, Ti- and Al-oxyhydroxides (Staudigel et al. Reference Staudigel, Plank, White, Schmincke, Bebout, Scholl, Kirby and Platt1996; Kruber et al. Reference Kruber, Thorseth and Pedersen2008). No smectite was detected in any of the hyaloclastite samples containing a palagonite phase, either optically or by XRD. Similarly, very few clay minerals, other than illite (Fig. 3(b)), and no oxyhydroxides or zeolites, were detected in parts of hyaloclastite samples thought to represent the initial palagonite. It is likely that the initial palagonite assemblage has been replaced by other phases, including illite (observed in some XRD patterns), during low-grade metamorphism. Thin section observations of former palagonite are consistent with the presence of fine-grained illite, stained with Fe-oxyhydroxides. The presence of illite is significant, as it is the only identified alteration phase that commonly incorporates elevated concentrations of K and other LILE and it is a likely mineral host for N structurally bound as NH4+.
Many factors influence the direction of element exchange during the formation of palagonite (Stroncik & Schmincke Reference Stroncik and Schmincke2001). Studies addressing the elemental exchange between fresh and palagonitized glass pairs produce wildly differing results. Kruber et al. (Reference Kruber, Thorseth and Pedersen2008) concluded that there is a near-complete loss of alkalis (Li, Na, K, Rb and Cs) from the crust during gel-palagonite formation, whereas Staudigel et al. (Reference Staudigel, Plank, White, Schmincke, Bebout, Scholl, Kirby and Platt1996) suggested that there is an uptake of LILE, K, Rb and Cs during glass hydration. Furthermore, another exchange of elements and H2O contents occur between rock and ambient fluids when the gel-palagonite crystallizes (Stroncik & Schmincke Reference Stroncik and Schmincke2001). Despite the difficulty in predicting element behaviour during palagonitization, a few trends in the high-resolution element variations within the brecciated hyaloclastite and massive flow units (Fig. 4) could reflect palagonitization at the Hurd Property. The concentrations of Sr, B and Li are generally higher and more variable in the hyaloclastite units (Fig. 4(j) and (k)), likely due to exchange with seawater. This trend has been observed in modern volcanic sections by Chan et al. (Reference Chan, Alt and Teagle2002), who reported Li enrichments in breccias relative to nearby massive flows in the upper volcanic section of ODP Hole 504B. Similarly, LILE enrichments in certain hyaloclastite samples could be partially due to early, low-temperature alteration, but the enrichments are not consistent throughout the entire suite of palagonite-bearing hyaloclastite samples. We thus conclude that early, low-temperature, seafloor alteration processes, which hydrated and palagonitized glass surfaces exposed to infiltrating seawater, were chemically overprinted by later hydrothermal alteration and are best inferred from the petrographic textures and mineral assemblages observed in the samples.
Hydrothermal alteration
The mineralogy of the Hurd Property samples indicates that alteration reached greenschist-grade conditions (low pressure and 250°C ≤ T ≤ 350°C) at peak metamorphism. The silicate δ18O data support interaction with lower temperature hydrothermal fluids, at high fluid–rock ratios, with values increased from those of fresh mantle-derived basalt (+5.7‰; Muehlenbachs & Clayton Reference Muehlenbachs and Clayton1972; Muehlenbachs Reference Muehlenbachs, Valley, Taylor and O'Neil1986). At temperatures below 200–250°C, whole rock δ18O values increase in the crust because 18O forms stronger bonds in the newly created secondary minerals (Bowers Reference Bowers1989). Gregory & Taylor (Reference Gregory and Taylor1981) quote a typical range for pillow lavas from multiple ophiolites of +10 to +14‰, representing shallow, low-temperature circulation systems. The Hurd sample values fall slightly below that range (+6 to +12‰; Fig. 4(l)). The δ18O values are higher in the hyaloclastite samples than in the underlying holocrystalline samples from the thickest volcanic cycle, likely representing more extensive circulation and higher water/rock ratios in the hyaloclastite unit. More extensive circulation provided greater fluid volumes and a larger window of opportunity for the hyaloclastite samples to approach equilibrium than that experienced by the massive flow. The slight disparity in estimated temperatures between the mineral assemblage (estimated at 250–350°C) and O isotope compositions (<250°) likely indicates that the silicate δ18O values reflect the time-integrated effect of fluid–rock interaction, including slight retrograde alteration from the maximum metamorphic grade attained, which is recorded by the secondary mineral assemblage.
Flank, or passive, hydrothermal circulation processes driven by heat conducted into the modern crust operate at temperatures of 0–150°C but account for about 85% of the total oceanic heat flux (Alt Reference Alt2003; and references therein). They generally involve disseminated discharge of hydrothermal fluids through areas of the seafloor that are made permeable primarily by fracture networks or brecciated lithologies (Lowell et al. Reference Lowell, Rona and Von Herzen1995). The hydrothermal convection cells in these passive alteration regimes are usually no more than 100–200 m deep and develop as closed circulation systems with limited or no exchange with seawater (Alt et al. Reference Alt, Laverne, Vanko, Tartarotti, Teagle, Bach, Zuleger, Erzinger, Honnorez, Pezard, Becker, Salisbury, Wilkens, Alt, Kinoshita, Stokking and Michael1996; Gutzmer et al. Reference Gutzmer, Banks, Lüders, Hoefs, Beukes and von Bezing2003). Based on the temperatures and constraints on fluid–rock ratios indicated by mineral assemblage and O isotope compositions, the hydrothermal alteration at the Hurd outcrop was likely caused by low to moderate temperature (T < 350°C), shallow-circulating fluids in a flank-like setting that allowed interaction with large volumes of fluid. The fluids were heated by proximity to active magma chambers prior to or penecontemporaneously with eruptions.
The Hurd Property samples all display moderate to extensive albitization and chloritization. Two samples, 01-KH08 and 31-KH08, were selected to be the most representative of the primary magma composition. This selection was based on well-preserved primary igneous textures, low modal percentages of chlorite and major element contents consistent with average suite values. Compared to these two samples, the enrichment of MgO in more altered samples appears minor. The CaO contents are enriched in many of the samples, reflecting the presence of calcic secondary minerals including actinolite, titanite, epidote and calcite. These trends are consistent with other observations of syn-volcanic hydrothermal and low-temperature seawater interaction with mafic and felsic rocks of the eastern BRS, where spilitization (albite and chlorite replacement) is common (Hannington et al. Reference Hannington, Santaguida, Kjarsgaard and Cathles2003). Calcium enrichment associated with the formation of calcic minerals (prehnite, pumpellyite, epidote, actinolite, titanite and calcite) is especially common in the mafic rocks (Hannington et al. Reference Hannington, Santaguida, Kjarsgaard and Cathles2003). Most of the Hurd Property samples also show significant enrichment in K, Rb and Ba (Fig. 5). Trends in LILE, B, Li, U and Th concentrations (Fig. 4(h)–(k)) serve as markers of zones of the hyaloclastite units that had the highest permeability and thus were accessible to fluids for the longest periods of time (allowing the most extensive fluid–rock interaction and associated element enrichment). This conclusion is supported by the presence of illite in samples from these zones (grey-shaded bars in Fig. 4), as illite is a likely host for many of these elements (e.g. Li substitutes for Mg in octahedral sites in clays such as smectite and is also concentrated in chlorite; Chan et al. Reference Chan, Alt and Teagle2002).
A possible subsurface microbial habitat
The location of the newly identified ichnofossil-containing sample in a structurally lower (older) brecciated unit (Anderson Reference Anderson2010) suggests that conditions suitable for microbial seafloor inhabitation were satisfied more than once at the Hurd locality. All three of the samples containing these microbial structures exhibit cuspate shards and well-silicified interstices (see Bridge Reference Bridge2008). None of the hyaloclastite samples with rounded, fractured and variably palagonitized shards appear to contain ichnofossils. This may be due to a preservation bias by which the tubular structures in the cuspate, minimally palagonitized shards were the only textures unaffected long enough during seafloor alteration to be infilled with titanite during later hydrothermal alteration. Alternatively, the pattern arising from ichnofossil occurrences, only appearing at the top of hyaloclastite flow units in the proposed ‘chill rind’ (flow crust) zone that experienced little internal clast movement or deformation, suggests that this may have been the most favourable horizon for microbial colonization.
The cycle proposed to explain the two temporal occurrences of ichnofossils in only one breccia texture (i.e. cuspate shards; Fig. 3(a) and (b)) begins with the eruption of a massive flow that wanes to lobate and then brecciated facies, producing a large volume of fresh volcanic glass. Glass shards in the middle of thicker hyaloclastite units likely experienced eruption-fed, density-current-like flow or compaction, which caused them to become rounded and highly fractured (Fig. 3(e) and (f)) and increased the glass surface area. These mid-section glasses were quickly and extensively altered to palagonite by circulation of cool seawater through the permeable volcanic units. In contrast, glass clasts that formed as chill-rind quench textures (i.e. autobrecciated upon contact with a cool surface like that of an underlying massive flow or the lava–seawater interface; Fig. 3(a) and (b)) retained their angularity and glassy structure, allowing the horizon to maintain well-defined, porous interstitial spaces. The minimally fractured, cuspate clasts experienced lower rates of palagonitization and alteration due to smaller surface area to volume ratios. Once the lava cooled to temperatures suitable for life, endolithic microorganisms introduced by cool circulating seawater could access and exploit the preserved glass (i.e. non-palagonitized shard interiors). Life persisted in the cuspate glasses, which were simultaneously palagonitized in the characteristic inward progressing concentric rims, as long as either actively or passively burrowing microbes stayed ahead of the reaction front marking the boundary between glass and palagonite. The microbes could have gained energy by releasing electron donors from the glass to exploit in energetic redox reactions until ambient and fluid temperatures rose above suitable levels for the organisms. Evidence of microbial bioalteration in the modern deep oceanic crust approaches maximum texture densities at ambient temperatures of ~80°C (Staudigel et al. Reference Staudigel, Furnes, McLoughlin, Banerjee, Connell and Templeton2008), and an upper limit of 121°C has been measured for the viability of thermophilic Archaea (Kashefi & Lovley Reference Kashefi and Lovley2003). The hydrothermal systems at the Hurd locality introduced fluids of T < 350°C that altered the existing volcanic rocks to greenschist-facies metamorphic assemblages. At this point, any remaining glass was altered to chlorite and the tubules were filled with titanite. The eruption(s) that heated the hydrothermal fluids also deposited a fresh layer of glass on the seafloor for continued microbial colonization of the seafloor.
By 2.7 Ga, life may have been colonizing seafloor glasses for 0.8 Gy or longer and continental crust growth was proceeding at possibly some of the greatest rates experienced to that point (Arndt Reference Arndt, Eriksson, Altermann, Nelson, Mueller and Catuneanu2004). Considering the abundance of Archæan volcano-sedimentary sequences affected by low-temperature hydrothermal activity, of which the AGB is one, and the apparent suitability of such a habitat for modern microorganisms, it seems very likely that microbes would have exploited these ancient habitats (Hofmann & Harris Reference Hofmann and Harris2008). Large, well-preserved greenstone belts like the AGB should provide a high potential for finding traces of life within their volcanic sequences.
Nitrogen remobilization from overlying sediments
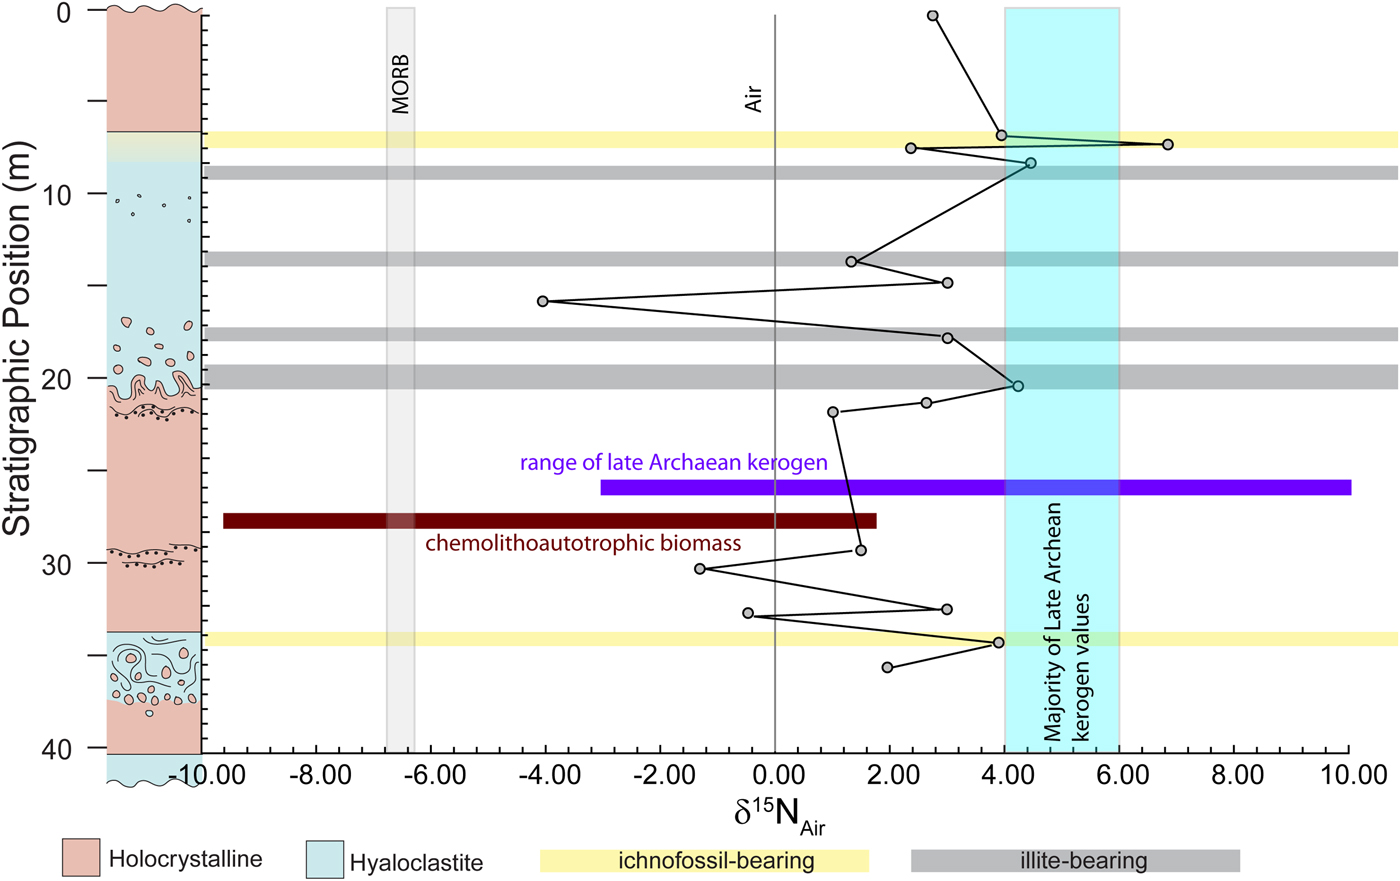
Isotopic records of Archæan and Proterozoic rocks reflect various steps in the perturbation of the geochemical cycles into their modern biogeochemical states (e.g. Thomazo et al. Reference Thomazo, Ader and Philippot2010). Nitrogen leaves a significant and increasingly considered (in addition to C and S) light isotope record of evolving biogeochemical and environmental redox conditions (see Thomazo & Papineau Reference Thomazo and Papineau2013; Zerkle & Mikhail Reference Zerkle and Mikhail2017). Large positive fractionations, up to 10–20‰, in δ15N are known to occur via the process of denitrification, which converts NO3− to N2. The process favours the lighter 14N for conversion into the gas phase and leaves the remaining NO3−, which can be converted back into bioavailable NH4+, enriched in 15N (Boyd Reference Boyd2001; Fogel Reference Fogel, Beauchemin and Matthews2010). The sedimentary kerogen N record is thought to preserve the isotopic values of marine organic matter in the form of NH4+, which represent the 15N-enrichment of residual dissolved nitrate (Beaumont & Robert Reference Beaumont and Robert1999). Values ranging from −6 to +12‰ are reported for Archæan and Proterozoic kerogens in the sedimentary record (Fig. 11). Values between +4 and +6‰ are most common, indicating the changing redox conditions of the oceans and presence of nitrifying and denitrifying microbes by the Late Archæan (Beaumont & Robert Reference Beaumont and Robert1999).
Nitrogen isotope composition plotted versus stratigraphic depth for the Hurd section. Shaded fields indicate the range of most Archean kerogen, modern air and modern MORB. Horizontal bars represent estimates of the range of δ15N values for two possible N input sources (chemolithoautotrophic biomass and Late Archean biomass) that could have influenced the δ15N of the NH4+ preserved in the volcanic rocks. The Hurd samples, even those containing microbial ichnofossils, appear to largely reflect the sedimentary kerogen values, indicating that fluids likely introduced NH4+ derived from overlying organic-rich sedimentary units.
In addition to their significance as the primary host of the fluid-derived K, potassic secondary minerals can host N in the form of NH4+, which has the same charge and similar ionic radius (~148 versus ~133 pm in 12-fold coordination; Shannon Reference Shannon1976; Holden & Dickinson Reference Holden and Dickinson1975) to K+. Very little silicate N was detected in the Hurd samples (~3–12 ppm); however, altered basaltic rocks and glasses on the modern and Mesozoic seafloor overlap with this range in concentration (Bebout et al. Reference Bebout, Banerjee, Izawa, Kobayashi, Lazzeri, Ranieri and Nakamura2017). The low N content could reflect limited delivery of N to the rocks by fluids, poor preservation of the N as NH4+ and/or a low abundance of K-rich minerals in the primary and secondary mineral assemblages. There is a tenuous positive correlation between K and N concentrations (best illustrated by the thickest massive hyaloclastite unit; Fig. 7(b)), consistent with the substitution of NH4+ for K+. The Pearson product-moment correlation coefficient (commonly denoted R 2) of the entire N and K data sets for all samples is ~0.01; however, this coefficient is not very useful for describing small data sets with multiple possible trends, not all of which are necessarily linear. Moreover, the N and K concentrations are affected by the closure of the compositional data set (e.g. Rollinson Reference Rollinson1993), further reducing the quantitative value of measures like R 2. Therefore, we conclude that the evidence from this study is consistent with but not diagnostic of a role for NH4+ ↔ K+ substitutions in the incorporation of N into the Hurd localty rocks. Most of the samples with higher N concentrations are illite-bearing hyaloclastites or contain possible ichnofossils. Elevated concentrations of N in magmatic rocks are a good indicator of sedimentary/organic enrichments in the rocks (Li et al. Reference Li, Bebout and Idleman2007; Bebout et al. Reference Bebout, Banerjee, Izawa, Kobayashi, Lazzeri, Ranieri and Nakamurain press). Nitrogen, although a major component of the modern Earth's atmosphere and a key element in biologic evolution (Libourel et al. Reference Libourel, Marty and Humbert2003), occurs in very low concentrations in magmatic rocks due to its low solubility and incompatible behaviour, the latter which causes it to degas very efficiently during cooling and crystallization (Marty & Humbert Reference Marty and Humbert1997). Typical concentrations of N in fresh, MORB-like basalts, representing residual N trapped in the rocks during the degassing, are between 0.3 and 2.8 ppm with an average around 1.1 ppm (Busigny et al. Reference Busigny, Ader and Cartigny2005a). Modern hydrothermally altered basalts have elevated N concentrations (Marty Reference Marty1995; Marty & Humbert Reference Marty and Humbert1997; Busigny et al. Reference Busigny, Laverne and Bonifacie2005b; Li et al. Reference Li, Bebout and Idleman2007) relative to unaltered equivalents, approaching 20 ppm in rocks that are thought to have experienced high water–rock ratio interactions (see Figs 4(m) and 7; Li et al. Reference Li, Bebout and Idleman2007).
The δ15N values for the Hurd Property neither co-vary with N contents nor show distinct ranges for any sample type or volcanic unit. The δ15N of the mantle is inferred to be about −5‰, a value supported by both studies of diamonds and measurements of fresh and lightly altered modern oceanic basalts (Marty & Humbert Reference Marty and Humbert1997). The mantle δ15N value is carried over to fresh basalts, as little to no fractionation occurs during magmatic degassing of N2 (Marty & Humbert Reference Marty and Humbert1997). Hydrothermal alteration causing N enrichment commonly also increases the basalt whole-rock δ15N. Li et al. (Reference Li, Bebout and Idleman2007) reported values approaching +1‰ in hydrothermally altered volcanics in the upper part of the oceanic crust section at ODP Site 801C, attributing the increase to input from seafloor sediments, the latter with values of −0.9 to +5.0‰ in the Marianas margin and +2.5 to +8.2‰ in the Izu margin (data for sediments in Sadofsky & Bebout Reference Sadofsky and Bebout2004). Large down-hole δ15N shifts in the sediment sections are attributed to biologic fractionation of organic N and varying degrees of later diagenetic alteration. The story of the Hurd samples is not well constrained, but all but three of the samples showed positive δ15N values mostly >+2‰ (Fig. 11). The lowest δ15N value of −4‰ is still greater than values for MORB and therefore consistent with mixing of mantle and biologically fractionated N. The ichnofossil-bearing samples, which have the greatest N contents of their respective units, generally exhibit δ15N higher than the values characteristic of chemolithoautotrophic biomass (Fig. 11). Therefore, it seems plausible that the Hurd volcanic rocks were altered by fluids bearing sedimentary/organic N isotope signatures (i.e. that had previously exchanged chemically/isotopically with N in nearby sediments and/or biogeochemically processed N dissolved in seawater). The isotopic signature of these distal and local organic reservoirs is preserved in the Hurd Property volcanic rocks despite significant later metamorphism. Therefore, whereas whole-rock N isotope compositions alone cannot unambiguously identify biologic remains or signatures left behind in the putative trace fossils, they do appear to preserve a record of Archæan biogeochemical N cycling conveyed into the rocks by infiltrating pore waters.
Implications for extraterrestrial habitats
The vastness of the deep subsurface biosphere on Earth, including that residing in basaltic oceanic crust, has only recently been realized, and various studies estimate that anywhere between 6 × 10⁵ and 1 × 10⁹ cells per gram of rock exist in modern seafloor basalts (Einen et al. Reference Einen, Thorseth and Øvreås2008; Santelli et al. Reference Santelli, Orcutt, Banning, Bach, Moyer, Sogin, Staudigel and Edwards2008). Others estimate that approximately two-thirds of Earth's prokaryotic biomass is contained in the deep subseafloor (Whitman et al. Reference Whitman, Coleman and Wiebe1998; Parkes et al. Reference Parkes, Linnane, Webster, Sass, Weightman, Hornibrook and Horsfield2011). Not all of the organisms present in the subseafloor actively dissolve basaltic glass for redox reaction-derived energy; instead, a great diversity of bacteria (and some Archæa) exist within the various temperature and chemical gradients of the hydrothermal systems in the ocean crust performing both chemoautotrophic and heterotrophic metabolic reactions (Mason et al. Reference Mason, Di Meo-Savoie, Van Nostrand, Zhou, Fisk and Giovannoni2009). The realization of a large biosphere hosted in the deep subsurface, and the expanding range of physicochemical conditions under which microbial life can survive and thrive, have many implications for astrobiology, notably an expansion in a range of plausibly habitable environments. The Martian deep subsurface is thought to be one of the best candidates for an extant Martian biosphere (e.g. Ivarsson & Lindgren Reference Ivarsson and Lindgren2010). Furthermore, the Martian subsurface may be more suitable for life than Earth's, or provide a greater volume to inhabit, due to the lower heat flow on Mars (Ivarsson & Lindgren Reference Ivarsson and Lindgren2010). Recent investigations of Martian meteorites (e.g. Cannon et al. Reference Cannon, Mustard and Agee2015) and of Martian surface rocks (e.g. Blake et al. Reference Blake, Morris, Kocurek, Morrison, Downs, Bish, Ming, Edgett, Rubin, Goetz, Madsen, Sullivan, Gellert, Campbell, Treiman, McLennan, Yen, Grotzinger, Vaniman, Chipera, Achilles, Rampe, Sumner, Meslin, Maurice, Forni, Gasnault, Fisk, Schmidt, Mahaffy, Leshin, Glavin, Steele, Freissinet, Navarro-Gonzalez, Yingst, Kah, Bridges, Lewis, Bristow, Farmer, Crisp, Stolper, Des Marais and Sarrazin2013) show that glass-rich materials are widely distributed on Mars. Our results show that palagonitized basaltic glasses can retain N chemical and isotopic records for ~Ga timescales, underscoring the potential importance of glass alteration processes in recording ancient Martian (bio)geochemical cycles. Incorporation of N into palagonitized volcanic (and impact-related) glasses, in intact volcanic rocks or in soils derived therefrom, could result in appreciable storage of N at/near the Mars surface (cf. Mancinelli & Banin Reference Mancinelli and Banin2003; see Bebout et al. Reference Bebout, Fogel and Cartigny2013). Silicate N within palagonitized glass is distinct from the oxidized N detected at the Martian surface, which is predominantly hosted in highly soluble nitrates (Stern et al. Reference Stern, Sutter, Freissinet, Navarro-Gonzalez, McKay, Archer, Buch, Brunner, Coll, Eigenbrode, Fairen, Franz, Glavin, Kashyap, McAdam, Ming, Steele, Szopa, Wray, Martin-Torres, Zorzano, Conrad and Mahaffy2015). Nitrogen incorporated into palagonitized glass is less susceptible to postformation alteration than nitrates and is therefore a potentially more robust recorder of ancient N. Plausible Martian scenarios for N incorporation into palagonitized basaltic glass include hydrothermal alteration of glass-rich rocks associated with endogenic magmatism and in impact-generated hydrothermal systems, situations that may have been more common in the distant past. Interpretation of such a record will depend on improved constraints on the concentration, isotopic composition and material hosts of N in the Martian surface and interior, from meteorites, in situ observations by spacecraft and ultimately from returned samples.
Conclusions
At the ~2.7 Ga outcrop of subaqueous, tholeiitic basaltic andesite volcanics at the Hurd Property, subvertically oriented flows of alternating massive and brecciated glassy flows were sampled at a high resolution for petrographic and geochemical investigation. The units are altered to a maximum grade of greenschist facies, most likely by hydrothermal fluids heated during volcanic activity associated with subsequent seafloor volcanic eruptions reflected in the section preserved at this locality. Petrographic evidence demonstrates that the glasses of the brecciated units experienced early alteration by low-temperature seawater, as indicated by the palagonite phase textures in the hyaloclastite samples. The hyaloclastite flows were more permeable than the holocrystalline massive flows, and therefore experienced the largest amount of element exchange with altering fluids during the water–rock interactions. This is demonstrated by the large variations in the concentrations of relatively fluid-mobile elements, such as K, Rb, Ba, Sr, Li and B, in the hyaloclastite units compared with near uniform concentrations of the same elements in the massive flows. Variations in the concentrations of fluid-mobile elements in the hyaloclastite units are interpreted to reflect the varying surface area to volume ratios of the glass shards, which would affect their permeability and alteration rate. Middle parts of the thicker hyaloclastite flows likely experienced eruption-fed turbidity currents, which would cause high rates of granular collisions resulting in very fractured and rounded glass shards. The top and bottom horizons of the hyaloclastite flows, which contacted either cold seawater or older, cool lava tops, formed as chilled zones where the glass autobrecciated and was essentially ‘frozen’ into place. It is these flow-top, cuspate glass clasts that appear to have provided the best habitat for euendolithic microorganisms because low glass surface area to volume ratios caused only rims of palagonite to form on the individual shards and preserved glass at the core for microbial colonization. Euendolithic organisms capable of etching glass and leaving behind tubular or granular textures were well established by the Late Archæan. Nitrogen concentration and isotope data presented here show that records of ancient N (bio)geochemical processes can be retained for billions of years in altered basaltic rocks. The silicate N concentrations and δ15N data from the Hurd Property also suggest that biologically driven processes, specifically denitrification, were active in ocean basins by the time of the Hurd outcrop volcanic eruptions near 2.7 Ga.
Supplementary material
The supplementary material for this article can be found at https://doi.org/10.1017/S1473550417000441
Acknowledgements
This paper largely presents the M.S. thesis research conducted by LDA at the Lehigh University (Anderson 2010). The authors thank Dr Lisa A. Gilbert, from the Williams College-Mystic Seaport Program, for advising and organizing the fieldwork, and the Keck Geology Consortium and the National Science Foundation for funding the field and analytical work. GEB received support from the National Science Foundation, specifically grant EAR-0711355. MRMI acknowledges support from the Mineralogical Association of Canada, and the NSERC CREATE Canadian Astrobiology Training Program. NRB also acknowledges support from NSERC. The authors also thank Editor-in-chief Dr Rocco Mancinelli, and the anonymous reviewer(s) for many insightful comments that led to significant improvements in the manuscript.